355 Food Sci. Technol, Campinas, 33(2): 355-361, Apr.-June 2013 Food Science and Technology ISSN 0101-2061 Received 23/8/2012 Accepted 27/3/2013 (005770) 1 Departamento de Ciência e Tecnologia dos Alimentos, Universidade Federal de Santa Maria – UFSM, Km 9, Camobi, CEP 97119-900, Santa Maria, RS, Brazil 2 Curso de Farmácia, Centro Universitário Franciscano – UNIFRA, Rua dos Andradas, 1614, Centro, CEP 97010-032, Santa Maria, RS, Brazil, e-mail: [email protected]*Corresponding author Phenolic compounds in Merlot wines from two wine regions of Rio Grande do Sul, Brazil Carlos Eugenio DAUDT 1 , Aline de Oliveira FOGAÇA 2 * 1 Introduction Nowadays, deeply colored and full-bodied red wines are highly valued by Brazilian consumers. For this reason, many winemaking techniques have been developed to improve color extraction allowing obtaining products with market demanding characteristics (PUERTAS et al., 2008). The color of young red wines is mainly due to free anthocyanins, self-association, and the copigmentation of anthocyanins with other phenols present in these wines (CAVALCANTI; SANTOS; MEIRELES, 2011). ere are two major characteristics of the wine medium that affect the color of wine pigments and consequently influence red wine color; these factors are the pH value of the medium and the susceptibility to color bleaching in the presence of the sulfite ion (BIRSE, 2007). The color of red wines is due to a number of factors including the type and concentration of anthocyanins, pH, free SO 2 level, and the extent of polymerization and copigmentation. e color of a red wine continues to change throughout its life and can be affected by a number of winemaking practices and environmental conditions (BOULTON et al., 1998; RIBÉREAU- GAYON et al., 2006). Darias-Martín et al. (2006) noted that wines made with grapes from warm zones had higher values of polymeric pigments (%P) and lower values of free anthocyanins (%M). Winemaking practices also help to change the extraction of phenolic compounds and their subsequent reactions in wine. Maceration conditions greatly affect the relative proportion of anthocyanins and flavanols diffusing into the wine (FULCRAND; SALAS; CHEYNIER, 2006). Herjavec et al. (2012) observed that the concentration of total and individual anthocyanins significantly increased with the increase in maceration time. In Brazil, grape and wine production takes place mainly in the state of Rio Grande do Sul, and the Serra region is known as the traditional wine region. In the last years, new areas have emerged, especially the Campanha region; the climate of this region has adequate rainfall and sunshine to produce good quality wines, as confirmed by numerous studies (DAUDT; MUTTI; KERSTEIN, 1973; MOTTA; 2003) and even by the Brazilian wine industry. e red wines in this region have low acidity and little color intensity, and they are wines to drink while young, even when produced from grape varieties such as Merlot and Cabernet Sauvignon. e objective of this study was to evaluate the influence of different maceration techniques on the phenolic compounds of Merlot wines, made with grapes produced in two regions of Rio Grande do Sul, as well as to identify the key differences between the wines produced. 2 Materials and method Red grapes from Vitis vinifera Merlot variety were harvested in 2011 from commercial vineyards located in two cities: Dom Pedrito (vineyards 1 and 2), in the Campanha region; and Bento Gonçalves (vineyard 3), in the Serra region. e grapes were harvested at the technological maturity, accordingly to the ºBrix, acidity and pH parameters and vinified with three replications each. Dry active yeast (Saccharomyces cerevisae bayanus, Blastocel Grand cru, Perdomini) was added Abstract In Brazil, the grape and wine production takes place mainly in the state of Rio Grande do Sul, and the region “Serra” is known as the traditional wine region. In the last years, new areas have emerged, with emphasis for the Campanha region; the red wines from this region have low acidity, little color intensity, and are wines to drink while young, even when produced from grape varieties such as Merlot and Cabernet Sauvignon. e objective of this study was to evaluate the influence of different maceration types on the phenolic compounds of Merlot wines made with grapes produced in two regions of Rio Grande do Sul, Serra and Campanha, as well as to identify the key differences between the wines produced. e localization of the vineyards seems to have more influence on the wine characteristics than the maceration type. e color due copigmentation was an important aspect in the wines made with short maceration. e effect of extended maceration was different than the expected for the Campanha region wines; the extended maceration increased the extraction of tannins resulting in greater color intensity and a greater amount of anthocyanins. e pH control seems to be a key factor for the Campanha region wines. Keywords: copigmentation; anthocyanin; tannins. OI: D http://dx.doi.org/10.1590/S0101-20612013005000045
Received 23/8/2012Accepted 27/3/2013 (005770)1 Departamento de Ciência e Tecnologia dos Alimentos, Universidade Federal de Santa Maria – UFSM, Km 9, Camobi, CEP 97119-900, Santa Maria, RS, Brazil 2 Curso de Farmácia, Centro Universitário Franciscano – UNIFRA, Rua dos Andradas, 1614, Centro, CEP 97010-032, Santa Maria, RS, Brazil, e-mail: [email protected]*Corresponding author
Phenolic compounds in Merlot wines from two wine regions of Rio Grande do Sul, BrazilCarlos Eugenio DAUDT1, Aline de Oliveira FOGAÇA2*
1 IntroductionNowadays, deeply colored and full-bodied red wines are
highly valued by Brazilian consumers. For this reason, many winemaking techniques have been developed to improve color extraction allowing obtaining products with market demanding characteristics (PUERTAS et al., 2008).
The color of young red wines is mainly due to free anthocyanins, self-association, and the copigmentation of anthocyanins with other phenols present in these wines (CAVALCANTI; SANTOS; MEIRELES, 2011). There are two major characteristics of the wine medium that affect the color of wine pigments and consequently influence red wine color; these factors are the pH value of the medium and the susceptibility to color bleaching in the presence of the sulfite ion (BIRSE, 2007).
The color of red wines is due to a number of factors including the type and concentration of anthocyanins, pH, free SO2 level, and the extent of polymerization and copigmentation. The color of a red wine continues to change throughout its life and can be affected by a number of winemaking practices and environmental conditions (BOULTON et al., 1998; RIBÉREAU-GAYON et al., 2006). Darias-Martín et al. (2006) noted that wines made with grapes from warm zones had higher values of polymeric pigments (%P) and lower values of free anthocyanins (%M).
Winemaking practices also help to change the extraction of phenolic compounds and their subsequent reactions in wine. Maceration conditions greatly affect the relative proportion of anthocyanins and flavanols diffusing into the wine (FULCRAND; SALAS; CHEYNIER, 2006). Herjavec et al. (2012) observed that the concentration of total and individual
anthocyanins significantly increased with the increase in maceration time.
In Brazil, grape and wine production takes place mainly in the state of Rio Grande do Sul, and the Serra region is known as the traditional wine region. In the last years, new areas have emerged, especially the Campanha region; the climate of this region has adequate rainfall and sunshine to produce good quality wines, as confirmed by numerous studies (DAUDT; MUTTI; KERSTEIN, 1973; MOTTA; 2003) and even by the Brazilian wine industry. The red wines in this region have low acidity and little color intensity, and they are wines to drink while young, even when produced from grape varieties such as Merlot and Cabernet Sauvignon.
The objective of this study was to evaluate the influence of different maceration techniques on the phenolic compounds of Merlot wines, made with grapes produced in two regions of Rio Grande do Sul, as well as to identify the key differences between the wines produced.
2 Materials and methodRed grapes from Vitis vinifera Merlot variety were harvested
in 2011 from commercial vineyards located in two cities: Dom Pedrito (vineyards 1 and 2), in the Campanha region; and Bento Gonçalves (vineyard 3), in the Serra region.
The grapes were harvested at the technological maturity, accordingly to the ºBrix, acidity and pH parameters and vinified with three replications each. Dry active yeast (Saccharomyces cerevisae bayanus, Blastocel Grand cru, Perdomini) was added
AbstractIn Brazil, the grape and wine production takes place mainly in the state of Rio Grande do Sul, and the region “Serra” is known as the traditional wine region. In the last years, new areas have emerged, with emphasis for the Campanha region; the red wines from this region have low acidity, little color intensity, and are wines to drink while young, even when produced from grape varieties such as Merlot and Cabernet Sauvignon. The objective of this study was to evaluate the influence of different maceration types on the phenolic compounds of Merlot wines made with grapes produced in two regions of Rio Grande do Sul, Serra and Campanha, as well as to identify the key differences between the wines produced. The localization of the vineyards seems to have more influence on the wine characteristics than the maceration type. The color due copigmentation was an important aspect in the wines made with short maceration. The effect of extended maceration was different than the expected for the Campanha region wines; the extended maceration increased the extraction of tannins resulting in greater color intensity and a greater amount of anthocyanins. The pH control seems to be a key factor for the Campanha region wines.
All measurements were carried out using a UV 11-000 (Pro Análise) spectrophotometer with quartz and glass cells with 10 mm or 1 mm pathlenght.
The Statistica software program for Windows 5.1 (StatSoft Inc., 1998) was used for data processing. Analyses of Variance (ANOVA) were applied to the results of the means among the wines; the means were statistically separated by the Tukey at 5%. Principal component analysis was used from standardized (auto-escalated) variables to study the relationship between the 20 analyzed parameters using the Pirouette 4.0 software (Infometrix, USA).
3 Results and discussionThe wine physicochemical parameters are shown in Table 1.
As expected, the type of maceration influenced the pH of the wines tested; and the highest values were found in the wines produced with extended maceration. This is an important fact since the pH values affect directly the equilibrium between red and colorless forms of anthocyanins; at high pH the flavilium cation (reddish color) is converted into uncolored species (BROUILLARD et al., 1989). The maceration type does not affect acidity and alcohol content, these two variables are related to grape maturity degree; therefore, it can be observed that the grapes showed different degrees of maturation.
Anthocyanins are extracted at the beginning of the process, mainly in the aqueous phase, during maceration at the beginning of alcoholic fermentation (RIBÉREAU-GAYON et al., 2006); some studies show that different maceration times did not significantly influence the intensity and hue of color (VRHOVSEK; VANZO; NEMAMIC, 2002). This finding is in agreement with the results obtained for wine 3, from Serra region (Table 2). However, for the Campanha wines (1 e 2), there was a different profile extraction (Table 2). The increase in maceration time (extended maceration) resulted in higher amounts of anthocyanins (ANT e TA – Table 3) and color intensity for both wines (Table 2).
the musts, (0,2 g.L–1) after the addition of 30 mg.L–1 of sulfur dioxide. The fermentation temperature was set at 28 °C. At the end of fermentation, sulfur dioxide was added again (20 mg.L–1). After two months, the wines were cleaned and bottled. Four maceration types were tested: short (4 days of skin contact time), control (8 days of skin contact time), extended (15 days of skin contact time), and WBF (whole berry fermentation: destemming, light crushed, and fermented with whole berries for 4 days after that the grapes were completely crushed, remaining in the skins for 8 days). The analyses were performed after 4 months of bottling,.
Alcohol (°GL), pH, and total acidity (g.100 mL–1 tartaric acid) were determined by OIV (OFFICE..., 2010). Total phenolics were determined by the Folin Ciocalteau method (mg.L–1 galic acid equivalent); anthocyanins by the bleaching method (mg.L–1 de malvidin-3-glucoside); and tannins by acid hydrolysis (g.L–1 cianidin chloride) (RIBÉREAU-GAYON et al., 2006).
The color characteristics, intensity (A420 + A520 + A620), and nuance (A420/A520), were measured directly on the basis of absorption at 620, 420, and 520 nm, registering the measurement in a 1 mm optical path cell and multiplying the results by 10 since the measure is conventionally referred to the optical path of 10 mm (RIBÉREAU-GAYON et al., 2006).
The contribution of monomeric anthocyanin (%M), copigmented anthocyanin (%C), polymeric anthocyanin (% P), and total anthocyanin (TA) were determined from the method proposed by Boulton (1996). The wines were adjusted to pH 3.6 (for standardization) and the membrane was filtered (0.45 mm pore size). First, 20 mL of 10% acetaldehyde solution was added to 2 mL of wine sample in order to quantify anthocyanins. After resting for 45 minutes, absorbance was measured at 520 nm. Another 100 µL of wine sample was mixed with 1900 µL of buffer solution pH 3.6. After a few minutes, absorbance was read at 520 nm. For the monitoring of the total amount of phenols, a diluted wine sample (1/100) was read directly at 280 nm (BOULTON, 2013).
Monomeric anthocyanins (mg.L–1 de malvidin-3-glucoside) and polymeric anthocyanins (mg.L–1 de malvidin-3-glucoside) were calculated by fractionation using C18 Sep-pak cartridges (HO; SILVA; HOGG, 2001).
The methodology described by Mazza et al. (1999) was used to estimate the phenolic content of wine samples. All of the samples were diluted 1:10 with 10% ethanol solution.
The method consisted of mixing an aliquot of 0.25 mL of sample or a standard with 0.25 mL of 0.1% HCl in 95% ethanol and 4.55 mL of 2% HCl. The solution was allowed to sit for approximately 15 minutes before reading the absorbance at 280 and 320 nm using a spectrophotometer. The absorbance at 280 nm was used to estimate total phenolic content (F280), and that at 320 nm was used to estimate tartaric esters (F320). The standards used were gallic acid for total phenolics and caffeic acid for tartaric esters, both in 10% ethanol.
Table 1. pH, total acidity (g% tartaric acid), and alcohol content (°GL) in Merlot wines with different maceration types, 2011 harvest (wines 1 and 2: Campanha; wine 3: Serra).
Wine Maceration pH Acidity Alcohol1 Short 3.42b 0.60ns 13.6b
Control 3.46b 0.64 13.6b
WBF 3.57ab 0.62 13.7b
Extended 3.67a 0.61 13.9a
2 Short 3.74b 0.65ns 13.5ns
Control 3.81b 0.63 13.4WBF 4.21a 0.62 13.8Extended 4.08a 0.60 13.8
3 Short 3.13ns 0.74ns 10.7ns
Control 3.21 0.75 10.8Extended 3.23 0.78 11.1
abMeans followed by different letters in the same column for each wine are significantly different (p < 0.05). ns = not significant. Short: 4 days of maceration; control: 8 days of maceration; extended: 15 days of maceration; WBF: whole berry fermentation - destemming, light crushed and fermented with whole berries for 4 days, then completely crushed, remaining in the skins for 8 days.
As expected, short maceration time led to significantly lower total phenolics (Table 2) and TPI (Table 3) for all wines studied. This type of maceration had the highest values of color due to copigmentation (Table 3). García-Marino et al. (2013) confirmed the effect of copigmentation process on wine color during the early stages of the winemaking; during short maceration, the skins remain in contact with the liquid for 4 days only, therefore copigmentation has become an important factor in this maceration type.
Some facts suggest that the copigmentation level in red wine is independent of the free anthocyanins and total phenol content,; therefore further research other relationship is needed to investigate copigment precursors, such as the non-flavonoid compounds. This explains the highest effect of copigmentation in short maceration, which has less phenolics compounds. Darias-Martin et al. (2006) found that copigmented anthocyanins (%C) do not appear to be related to the vineyard location.
The WBF (whole berry fermentation) maceration is used by some wineries, but there are not enough studies on the effects
In the present study, the analysis of tannins (TAN) represents the amount of procyanidins; this group of compounds is extracted from the grape skin with the anthocyanins at the beginning of the process of fermentation; however its extraction continues for a longer period due to the location of these in the skin cells. When these compounds are found in the seeds, they are solubilized when the cuticle is dissolved by ethanol (RIBÉREAU-GAYON et al., 2006). As shown in Tables 2 and 3, the wines that showed the highest content of procyanidins (TAN), total phenol compounds and total phenol index (TPI)- Table 3) were those produced with extended maceration.
These results are in agreement with those found by Cerpa-Calderón and Kennedy (2008), who evaluated the influence of the degree of crushing in the content of procyanidin in Merlot wines; they found that total procyanidin extraction increased with the time of fermentation in all treatments; in addition, crushing increased the rate at which procyanidins were extracted.
Table 2. Phenolic compounds in Merlot wines with different maceration types, 2011 harvest (wines 1 and 2: Campanha; wine 3: Serra).
Wine Maceration ANT TAN TF CI Hue % R %Y %B1 Short 222.5b 1.15ab 1,176.1c 5.6b 0.76a 50.9b 38.8a 10.3ns
abMeans followed by different letters in the same column for each wine are significantly different (p < 0.05). ns = not significant. ANT – anthocyanin, mg.L–1 malvidin-3-glucosídeo; TAN – tannins, g.L–1 cianidin chloride; TF – total phenols, mg.L–1 galic acid; CI – color intensity; %R – absorbance at 520 nm; %Y – absorbance at 420 nm; % B – absorbance at 620 nm. Short: 4 days of maceration; control: 8 days of maceration; extended: 15 days of maceration; WBF: whole berry fermentation - destemming, light crushed and fermented with whole berries for 4 days, then completely crushed, remaining in the skins for 8 days.
Table 3. Percentage of color due to Copigmented Anthocyanins (%C), to Monomeric Anthocyanins (%M), and to Polymeric Pigments (%P); Total Anthocyanin (TA – absorbance units), Total Phenol Index (TPI – OD 280 nm), Monomeric (AM) and Polymeric Anthocyanins (AP) in Merlot wines, with different types of maceration, 2011 harvest (wines 1 and 2: Campanha; wine 3: Serra).
Wine Maceration %C %M %P TA TPI AM AP1 Short 48.3a 24.6b 27.1ns 3.91c 31.8c 94.5b 279.4ns
abMeans followed by different letters in the same column for each wine are significantly different (p < 0.05). ns = not significant. AM and AP = mg.L–1 malvidin-3-glucoside. Short: 4 days of maceration; control: 8 days of maceration; extended: 15 days of maceration; WBF: whole berry fermentation - destemming, light crushed and fermented with whole berries for 4 days, then completely crushed, remaining in the skins for 8 days.
related to the color intensity of the wines, and all polymeric anthocyanins were important contributors to wine color; however, in the present study, color intensity did not show a direct correlation with any specific parameters. In general, it is known that the polimerization process starts during the winemaking process, and wine 2 shows the highest amounts of polymeric anthocyanins (AP) (Table 3), but this has not resulted
of this type of maceration. In the present study, it showed very similar results to those of the control treatment (both have 8 days of skin contact time); it was observed, however, that both the anthocyanin content and the color intensity were a little smaller in WBF.
Gao et al. (1997) , working with Pinot noir grapes, reported that the total or individual polymeric anthocyanins were directly
a
b
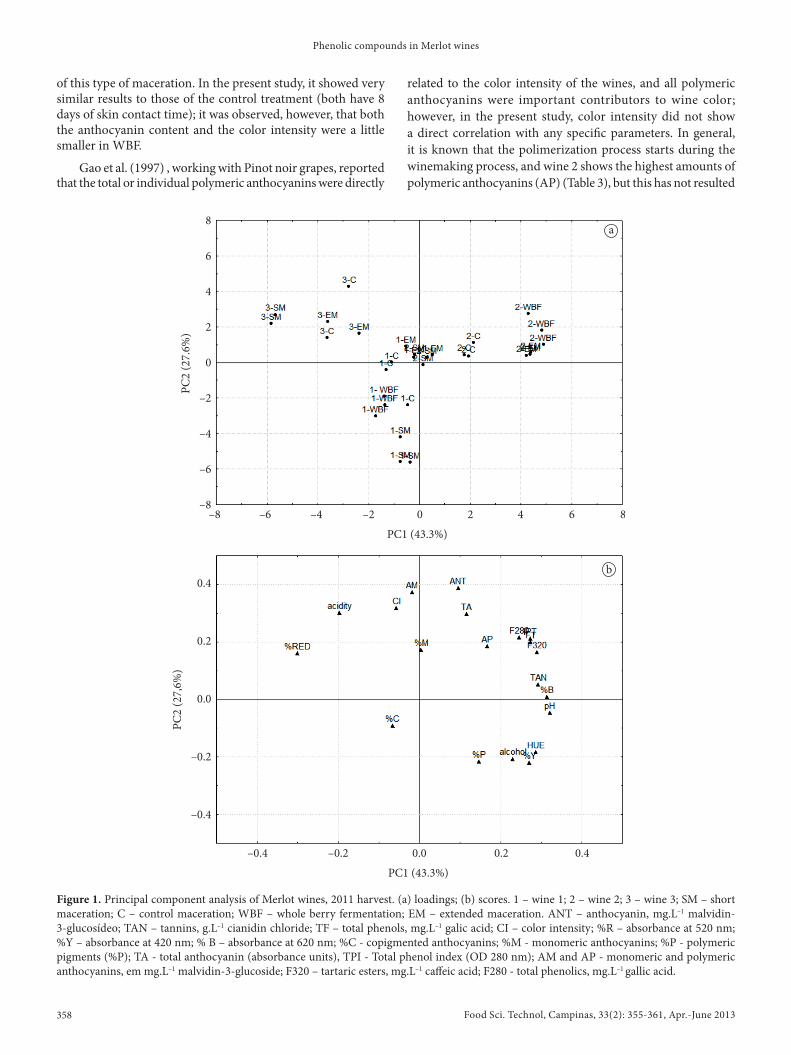
Figure 1. Principal component analysis of Merlot wines, 2011 harvest. (a) loadings; (b) scores. 1 – wine 1; 2 – wine 2; 3 – wine 3; SM – short maceration; C – control maceration; WBF – whole berry fermentation; EM – extended maceration. ANT – anthocyanin, mg.L–1 malvidin-3-glucosídeo; TAN – tannins, g.L–1 cianidin chloride; TF – total phenols, mg.L–1 galic acid; CI – color intensity; %R – absorbance at 520 nm; %Y – absorbance at 420 nm; % B – absorbance at 620 nm; %C - copigmented anthocyanins; %M - monomeric anthocyanins; %P - polymeric pigments (%P); TA - total anthocyanin (absorbance units), TPI - Total phenol index (OD 280 nm); AM and AP - monomeric and polymeric anthocyanins, em mg.L–1 malvidin-3-glucoside; F320 – tartaric esters, mg.L–1 caffeic acid; F280 - total phenolics, mg.L–1 gallic acid.
in terms of the percentage of pigments that do not lose their color upon SO2 bleaching; this observation suggests that it is not the quantity of SO2-stable pigments that contributed the most to the overall red wine color.
The principal component analysis (Figure 1) allowed the separation of wines according to origin and type of maceration, and principal component 1 and 2 explain 70.9% of the variation
in higher color intensity (Table 2). In addition, the wine 2 did not have high value of color due polimerization (%P); the difference between these two parameters is explained by the fact that color due polimerization (%P) determines the amount of pigment resistant to sulfite bleaching, while the amount of polymeric anthocyanins (AP) is related to the size of the molecule. Birse (2007) suggests that there is no difference between wine regions
a
b
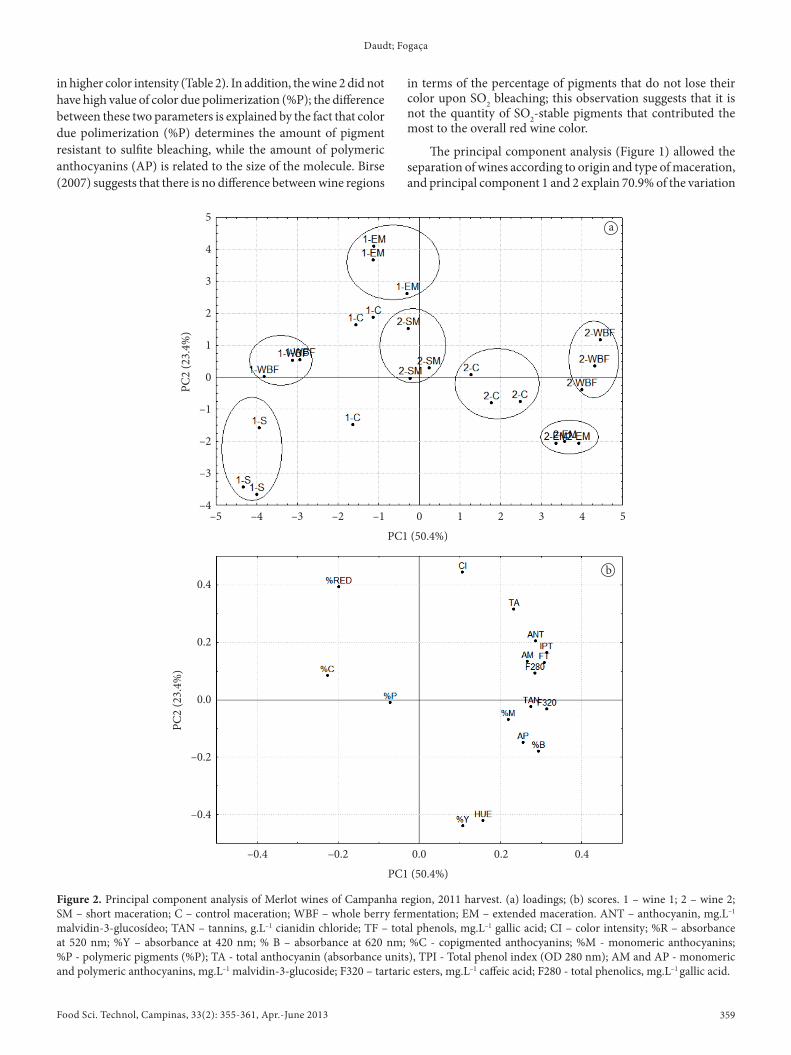
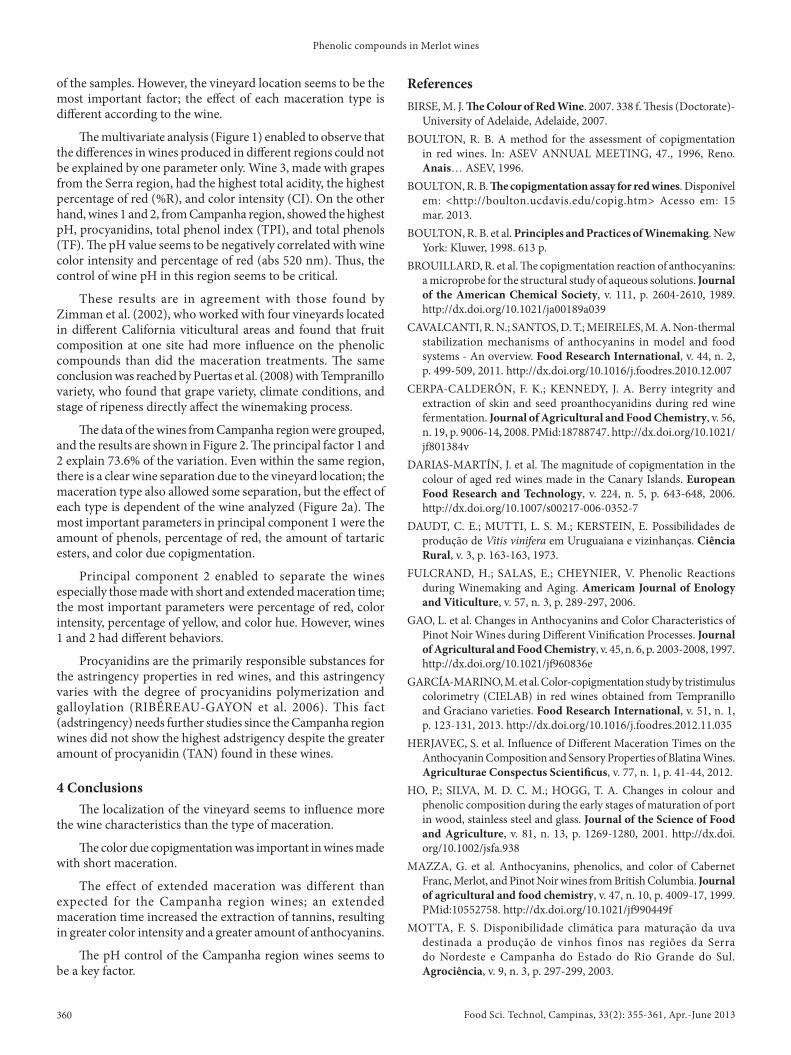
Figure 2. Principal component analysis of Merlot wines of Campanha region, 2011 harvest. (a) loadings; (b) scores. 1 – wine 1; 2 – wine 2; SM – short maceration; C – control maceration; WBF – whole berry fermentation; EM – extended maceration. ANT – anthocyanin, mg.L–1 malvidin-3-glucosídeo; TAN – tannins, g.L–1 cianidin chloride; TF – total phenols, mg.L–1 gallic acid; CI – color intensity; %R – absorbance at 520 nm; %Y – absorbance at 420 nm; % B – absorbance at 620 nm; %C - copigmented anthocyanins; %M - monomeric anthocyanins; %P - polymeric pigments (%P); TA - total anthocyanin (absorbance units), TPI - Total phenol index (OD 280 nm); AM and AP - monomeric and polymeric anthocyanins, mg.L–1 malvidin-3-glucoside; F320 – tartaric esters, mg.L–1 caffeic acid; F280 - total phenolics, mg.L–1 gallic acid.
ReferencesBIRSE, M. J. The Colour of Red Wine. 2007. 338 f. Thesis (Doctorate)-
University of Adelaide, Adelaide, 2007.BOULTON, R. B. A method for the assessment of copigmentation
in red wines. In: ASEV ANNUAL MEETING, 47., 1996, Reno. Anais… ASEV, 1996.
BOULTON, R. B. The copigmentation assay for red wines. Disponível em: <http://boulton.ucdavis.edu/copig.htm> Acesso em: 15 mar. 2013.
BOULTON, R. B. et al. Principles and Practices of Winemaking. New York: Kluwer, 1998. 613 p.
BROUILLARD, R. et al. The copigmentation reaction of anthocyanins: a microprobe for the structural study of aqueous solutions. Journal of the American Chemical Society, v. 111, p. 2604-2610, 1989. http://dx.doi.org/10.1021/ja00189a039
CAVALCANTI, R. N.; SANTOS, D. T.; MEIRELES, M. A. Non-thermal stabilization mechanisms of anthocyanins in model and food systems - An overview. Food Research International, v. 44, n. 2, p. 499-509, 2011. http://dx.doi.org/10.1016/j.foodres.2010.12.007
CERPA-CALDERÓN, F. K.; KENNEDY, J. A. Berry integrity and extraction of skin and seed proanthocyanidins during red wine fermentation. Journal of Agricultural and Food Chemistry, v. 56, n. 19, p. 9006-14, 2008. PMid:18788747. http://dx.doi.org/10.1021/jf801384v
DARIAS-MARTÍN, J. et al. The magnitude of copigmentation in the colour of aged red wines made in the Canary Islands. European Food Research and Technology, v. 224, n. 5, p. 643-648, 2006. http://dx.doi.org/10.1007/s00217-006-0352-7
DAUDT, C. E.; MUTTI, L. S. M.; KERSTEIN, E. Possibilidades de produção de Vitis vinifera em Uruguaiana e vizinhanças. Ciência Rural, v. 3, p. 163-163, 1973.
FULCRAND, H.; SALAS, E.; CHEYNIER, V. Phenolic Reactions during Winemaking and Aging. Americam Journal of Enology and Viticulture, v. 57, n. 3, p. 289-297, 2006.
GAO, L. et al. Changes in Anthocyanins and Color Characteristics of Pinot Noir Wines during Different Vinification Processes. Journal of Agricultural and Food Chemistry, v. 45, n. 6, p. 2003-2008, 1997. http://dx.doi.org/10.1021/jf960836e
GARCÍA-MARINO, M. et al. Color-copigmentation study by tristimulus colorimetry (CIELAB) in red wines obtained from Tempranillo and Graciano varieties. Food Research International, v. 51, n. 1, p. 123-131, 2013. http://dx.doi.org/10.1016/j.foodres.2012.11.035
HERJAVEC, S. et al. Influence of Different Maceration Times on the Anthocyanin Composition and Sensory Properties of Blatina Wines. Agriculturae Conspectus Scientificus, v. 77, n. 1, p. 41-44, 2012.
HO, P.; SILVA, M. D. C. M.; HOGG, T. A. Changes in colour and phenolic composition during the early stages of maturation of port in wood, stainless steel and glass. Journal of the Science of Food and Agriculture, v. 81, n. 13, p. 1269-1280, 2001. http://dx.doi.org/10.1002/jsfa.938
MAZZA, G. et al. Anthocyanins, phenolics, and color of Cabernet Franc, Merlot, and Pinot Noir wines from British Columbia. Journal of agricultural and food chemistry, v. 47, n. 10, p. 4009-17, 1999. PMid:10552758. http://dx.doi.org/10.1021/jf990449f
MOTTA, F. S. Disponibilidade climática para maturação da uva destinada a produção de vinhos finos nas regiões da Serra do Nordeste e Campanha do Estado do Rio Grande do Sul. Agrociência, v. 9, n. 3, p. 297-299, 2003.
of the samples. However, the vineyard location seems to be the most important factor; the effect of each maceration type is different according to the wine.
The multivariate analysis (Figure 1) enabled to observe that the differences in wines produced in different regions could not be explained by one parameter only. Wine 3, made with grapes from the Serra region, had the highest total acidity, the highest percentage of red (%R), and color intensity (CI). On the other hand, wines 1 and 2, from Campanha region, showed the highest pH, procyanidins, total phenol index (TPI), and total phenols (TF). The pH value seems to be negatively correlated with wine color intensity and percentage of red (abs 520 nm). Thus, the control of wine pH in this region seems to be critical.
These results are in agreement with those found by Zimman et al. (2002), who worked with four vineyards located in different California viticultural areas and found that fruit composition at one site had more influence on the phenolic compounds than did the maceration treatments. The same conclusion was reached by Puertas et al. (2008) with Tempranillo variety, who found that grape variety, climate conditions, and stage of ripeness directly affect the winemaking process.
The data of the wines from Campanha region were grouped, and the results are shown in Figure 2. The principal factor 1 and 2 explain 73.6% of the variation. Even within the same region, there is a clear wine separation due to the vineyard location; the maceration type also allowed some separation, but the effect of each type is dependent of the wine analyzed (Figure 2a). The most important parameters in principal component 1 were the amount of phenols, percentage of red, the amount of tartaric esters, and color due copigmentation.
Principal component 2 enabled to separate the wines especially those made with short and extended maceration time; the most important parameters were percentage of red, color intensity, percentage of yellow, and color hue. However, wines 1 and 2 had different behaviors.
Procyanidins are the primarily responsible substances for the astringency properties in red wines, and this astringency varies with the degree of procyanidins polymerization and galloylation (RIBÉREAU-GAYON et al. 2006). This fact (adstringency) needs further studies since the Campanha region wines did not show the highest adstrigency despite the greater amount of procyanidin (TAN) found in these wines.
4 ConclusionsThe localization of the vineyard seems to influence more
the wine characteristics than the type of maceration.
The color due copigmentation was important in wines made with short maceration.
The effect of extended maceration was different than expected for the Campanha region wines; an extended maceration time increased the extraction of tannins, resulting in greater color intensity and a greater amount of anthocyanins.
The pH control of the Campanha region wines seems to be a key factor.
England: John Wiley & Sons Ed., 2006. p. 441. http://dx.doi.org/10.1002/0470010398
VRHOVSEK, U.; VANZO, A.; NEMANIC, J. Effect of red wine maceration techniques on oligomeric and polymeric proanthocyanidins in wine , cv. Blaufränkisch. Vitis, v. 41, p. 47-51, 2002.
ZIMMAN, A. et al. Maceration Variables Affecting Phenolic Composition in Commercial-scale Cabernet Sauvignon Winemaking Trials. American Journal of Enology and Viticulture, v. 2, n. 52, p. 93-98, 2002.
OFFICE INTERNATIONAL DE LA VIGNE ET DU VIN - OIV. Recueil des méthodes internationales d’analyse des vins. Paris: O.I.V, 2010. Disponível em: <http://www.oiv.int/oiv/info/ enplubicationoiv#compendium>. Acesso em: 08 mar 2011.
PUERTAS, B. et al. Evaluation of Alternative Winemaking Processes for Red Wine Color Enhancement. Food Science Technology International, v. 14, p. 21-27, 2008. http://dx.doi.org/10.1177/1082013208095686
RIBÉREAU-GAYON, P. et al. Handbook of Enology - Vol. 2: The chemistry of wine stabilization and treatments. 2nd ed.