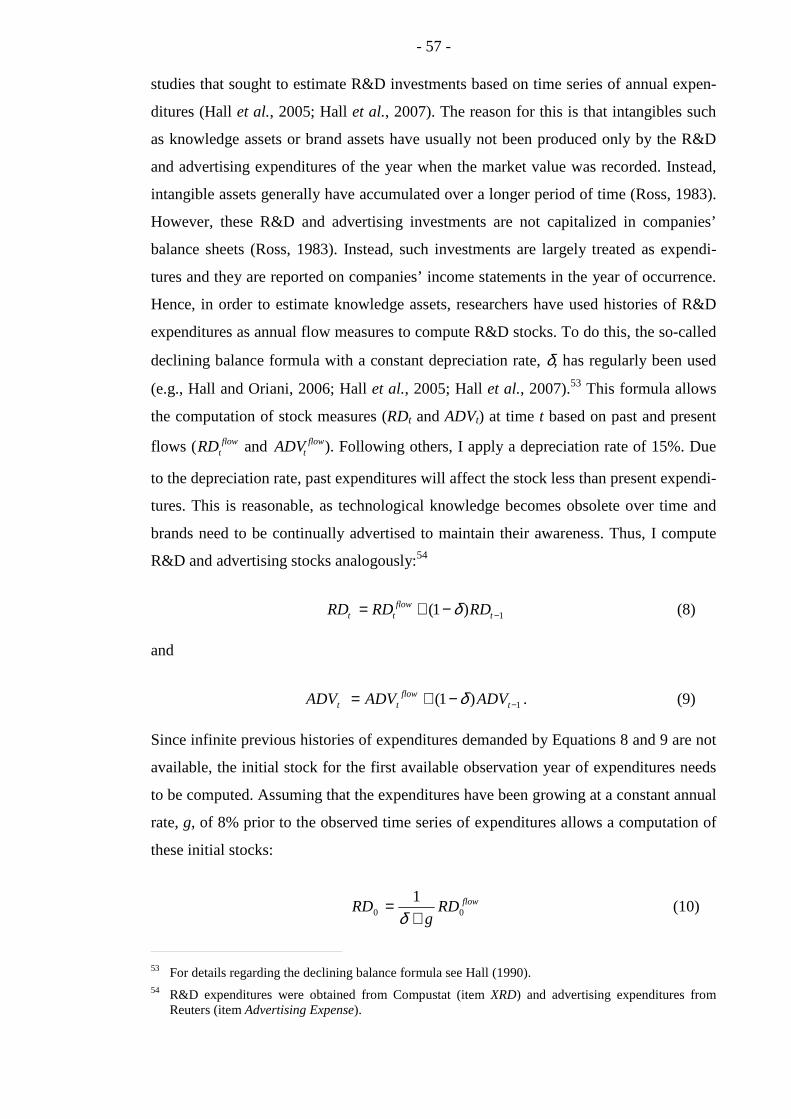
Trademark Filing Strategies and Their Valuation: Creating, Hedging, Modernizing, and Extending Brands Philipp G. Sandner 1 Ludwig-Maximilians-Universität München (University of Munich) E-Mail: [email protected]March 2009 Abstract This study uses trademarks to explore brands as intangible assets. Trade- marks protect brands and make them visible. Brand management decisions can therefore be observed through trademarks. Corporate brand management deals with the allocation of brands and products, as there are no 1-to-1 rela- tionships between them. Instead, brands can encompass multiple products. When new products are introduced, brand management deals with decisions to either create new brands or use existing ones. Such decisions require trademark filings, which reflect both the creation as well as the development of brands through hedging, modernization, and extension. I develop and ap- ply a technique that reveals the inherent structure of trademark portfolios. This allows an assessment of how brands are protected by trademarks and how trademark filing strategies produced these portfolios. In this study, a cross-sectional dataset of 1,735 companies is compiled and, again, the market value approach and NLLS estimation is used to assess the value of trademark filing strategies. The results show that financial markets value only the de- velopment of brands, while the creation of brands is not financially valued. These results are interpreted by the cash flow potential of brand development. Future cash flows can be expected, first, when companies re-use existing brands to introduce new products, and second, when companies coherently and further develop previously established brands rather than creating nu- merous new ones. JEL classification: M31, O34, G12 Keywords: market valuation, Tobin’s q, trademarks, brands, brand manage- ment intellectual property, IP management 1 Address: INNO-tec, Ludwig-Maximilians-Universität München, Kaulbachstr. 45, 80539 München, Germany, Phone: +49 (0)89 2180-5809.
Transcript
Trademark Filing Strategies and Their Valuation: Creating, Hedging, Modernizing, and
Extending Brands
Philipp G. Sandner1 Ludwig-Maximilians-Universität München
This study uses trademarks to explore brands as intangible assets. Trade-marks protect brands and make them visible. Brand management decisions can therefore be observed through trademarks. Corporate brand management deals with the allocation of brands and products, as there are no 1-to-1 rela-tionships between them. Instead, brands can encompass multiple products. When new products are introduced, brand management deals with decisions to either create new brands or use existing ones. Such decisions require trademark filings, which reflect both the creation as well as the development of brands through hedging, modernization, and extension. I develop and ap-ply a technique that reveals the inherent structure of trademark portfolios. This allows an assessment of how brands are protected by trademarks and how trademark filing strategies produced these portfolios. In this study, a cross-sectional dataset of 1,735 companies is compiled and, again, the market value approach and NLLS estimation is used to assess the value of trademark filing strategies. The results show that financial markets value only the de-velopment of brands, while the creation of brands is not financially valued. These results are interpreted by the cash flow potential of brand development. Future cash flows can be expected, first, when companies re-use existing brands to introduce new products, and second, when companies coherently and further develop previously established brands rather than creating nu-merous new ones. JEL classification: M31, O34, G12 Keywords: market valuation, Tobin’s q, trademarks, brands, brand manage-ment intellectual property, IP management
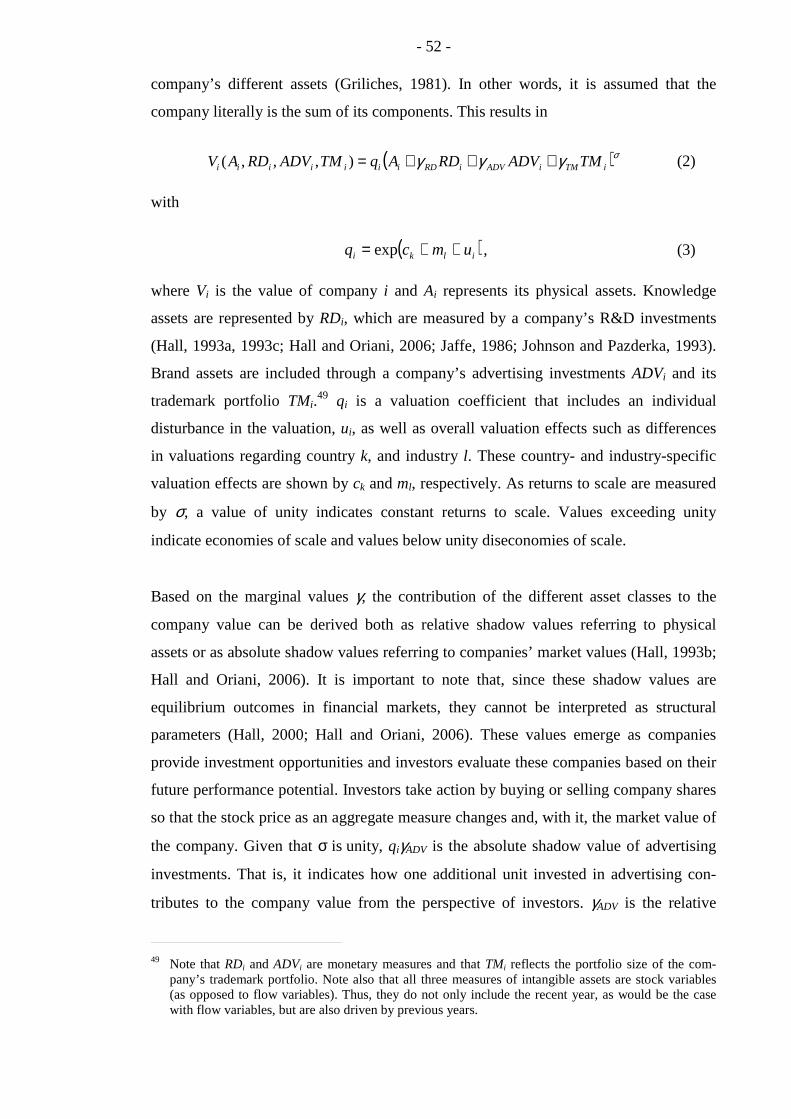
Financial markets value companies based on the future cash flows that are generated by
their assets. These assets include not only tangibles but also intangibles such as knowl-
edge assets or brands. Both of these types of assets play an important role in the valua-
tion of a company but intangibles are generally difficult to price. Understanding the
contribution of knowledge assets to the market value of companies has a long history,
and researchers have often used R&D expenditures and patent data when estimating the
value of these assets (e.g., Connolly and Hirschey, 1988; Griliches, 1981; Hall, 2000;
Hall et al., 2007). Contrary to that, the contribution of brands to companies’ market
values has been less rigorously researched. There are some notable exceptions, in which
researchers empirically investigated the relation between brands and company values in
financial markets (e.g., Barth et al., 1998; Kallapur and Kwan, 2004; Simon and Sulli-
van, 1993). Researchers in this area have employed different measures at the brand-
level to analyze the determinants of brand value and to estimate the share of brand
assets in total company value.
Brands and their underlying trademarks are important assets to companies as they have
the potential to influence consumers’ product choices (Agarwal and Rao, 1996). From
the perspective of consumers, brands facilitate consumer choice by providing informa-
tion, and they are generally taken to transmit quality signals and thus to serve as a
vehicle for reducing perceived risk (Economides, 1988; Montgomery and Wernerfelt,
1992; Wernerfelt, 1988).
Despite the importance of brands to companies, proving its relevance to company
performance is not an easy endeavor leading Aaker to write (1991, p. 15): “The value of
brand-building activities on future performance is not easy to demonstrate. The chal-
lenge is to understand better the links between brand assets and future performance, so
that brand-building activities can be justified.” Brand values are affected by corporate
brand management, which involves decisions such as the creation of new brands or the
use of existing ones when new products are introduced (Farquhar et al., 1992). Under-
standing the link between brand management and the valuation of brand assets allows
researchers and managers to assess how decisions in corporate brand management
contribute to company value and, in turn, how financial markets value the brands that a
company owns.
- 3 -
<INTEXT>Aaker, 1991<>
Insofar as brand management involves issues such as brand creation and development, it
organizes the allocation of brands to products. A firm can decide, for example, to create
narrow brands that are applied to only one or very few products, or it can create um-
brella brands that span broad product categories or even a company’s entire product
portfolio. Since new trademarks need to be filed to protect these brands (i.e., to exclude
others from unauthorized use, European Council, 1993, Art. 9), activities in brand
management will be, to a large extent, mirrored in trademark registers.
Brands are constructs that are perceived by consumers as possessing both visible and
invisible aspects. The latter aspects include the brand image or brand reputation. Visible
factors mainly concern the trademarks that underlie a brand but a brand does not
necessarily need to be associated with a single trademark. Instead, a plurality of trade-
marks can be associated with a brand in order to take on different appearances or to
include different components (Mendonça et al., 2004). This is well illustrated, for
example, by the brand Coca-Cola which represents a bundle of trademarks, including
several protected word marks and several protected graphical signs. Since brand man-
agement is reflected in trademark data, it is surprising that researchers have never
widened the scope of brand management to include trademarks as the legal basis of
brands.
Related research characterizes brands as having the potential to differentiate a product
from those of competitors. The differentiation potential of a brand is of great importance
because brands affect consumers’ product choices or command price premia (Agarwal
and Rao, 1996; Ailawadi et al., 2003; Swaminathan et al., 2001). The reason why
consumers are in the position to perceive brands as being distinctive is rooted in the
trademark rights that protect those brands. A trademark allows its owner to prevent third
parties from using it (European Council, 1993, Art. 9). Trademarks are hence the legal
anchors of brands (Phillips, 2003). The link between the differentiation potential of a
brand and the associated trademarks is explained as follows. Trademark law requires a
brand to be inherently distinctive, meaning that it needs to be “capable of distinguishing
the goods or services” (European Council, 1993, Art. 4) of one company from those of
competitors. Trademark applications that do not comply with this requirement are not
granted. If a competitor files a trademark application that is identical or confusingly
similar to an already registered trademark, the proprietor of the existing trademark can
- 4 -
stop the competitor’s application from being granted (European Council, 1993, Art. 8).
Correspondingly, competitors cannot get protection for an identical or similar trade-
mark. Moreover, trademarks ensure that their owners can control their use since a
company can take legal actions if a competitor counterfeits products or otherwise seeks
to unfairly appropriate a trademark’s value. It is this requirement of distinctiveness
enshrined in trademark law, and the legal protection that it affords, that preserves a
brand’s communicative power to current and potential consumers and allows it to
proceed free from interference. The trademarks that underlie a brand endow their
proprietors with the legal instruments to effectively maintain a brand’s differentiation
potential. All advertising activities, product promotions, etc. need to comply with the
legal grounds set up by trademarks. Trademarks are hence the building blocks of brands
in that they ensure the value of a brand and protect this value against impairment. As
trademarks are the fundamental constituents of brands, their characteristics and the ways
in which they support and form brands should be analyzed.
The objective of this study is to investigate how brand management is associated with
trademark filing strategies and how the benefits of these strategies are valued in finan-
cial markets. This unveils the importance of different kinds of trademarks and how they
are affiliated with brands. Moreover, assessing the valuation of trademark portfolios
based on companies’ valuations in stock markets provides insights into what investors
expect to be profitable strategies. This study seeks to address the following questions:
First, which trademark filing strategies can be identified, and do they reflect corporate
brand management? Second, how can companies’ trademark portfolios be examined to
reveal the inherent structure of these portfolios? Third, is the valuation of companies in
financial markets related to the trademark filing strategies they employ? To address
these questions, corporate brand management needs to be reconciled with the complex
structure of trademark portfolios. Based on the trademark filing strategies companies
employed when building their portfolios, I derive portfolio characteristics which I then
link to companies’ valuations in financial markets. Companies’ market values in stock
markets are forward-looking performance measures that reflect future expectations
about company success. Investors examine companies’ assets (including brands) in
order to estimate how these assets might generate future cash flows. The expectations
investors form ultimately materialize in stock prices. Adopting a Tobin’s q format
derived from the market value approach then allows one to examine market-related
intangible assets. To my knowledge, this is the first study linking trademarks and their
- 5 -
filing strategies to financial markets by considering the inherent structure of trademark
portfolios. This also allows scrutinizing the relationship between trademarks and
brands. A dataset is compiled that includes accounting, financial, and trademark data for
the world’s largest publicly listed corporations. The dataset contains 1,735 observations
from the year 2004 and is cross-sectional in nature. Based on this dataset, NLLS
regression techniques are used to estimate the market value equation. To build corporate
trademark portfolios and to subsequently reveal their structures, I use applications for
CTMs. CTMs, which are pan-EU trademark rights, are filed by companies that seek
protection in the entire territory of the EU. The CTM register used here was provided by
the OHIM and included all CTM applications filed until the end of 2004.
This study makes several contributions to the existing literature. Four different trade-
mark filing strategies were identified and, for the purpose of this study, named as
follows: (i) creating, (ii) hedging, (iii) modernizing, and (iv) extending brands. With the
first filing strategy, creating brands, companies file a trademark to protect brands that
are newly created, for example, if a new product is to be introduced. The other three
strategies concern the development of already existing brands. Hedging brands refers to
those cases where a company simultaneously files highly interrelated trademarks to
support a brand. Companies adopt such a strategy to separately protect multiple facets
of the same sign or brand name. Modernizing brands refers to those cases where a
company files trademarks to update or maintain the appearance of a brand. This is
necessary to prevent the symbols that represent a brand from becoming obsolete and to
protect established brands against erosion and impairment.2 Extending brands refers to
those cases where established brands are applied to new products in both familiar and
new markets. When launching a new product in a familiar market (line extensions) or in
an unknown market (brand extensions), a link to established brands allows consumers to
infer the quality of these new products by drawing on their past experiences with the
brand. Interestingly, although each trademark filing strategy may have its justification
from the company’s perspective, only modernizing and extending brands were found to
be valued in financial markets when estimating the market value equation. This finding
is explained by the potential impact of these two strategies on future cash flows, on
which investors in financial markets base their appraisals of companies. Modernizing
2 Examples where such strategies were applied include brands like Lufthansa and Shell, whose appearances (i.e., their trademarks) changed several times over the last decades.
- 6 -
strategies strengthen existing brands and, thus, support revenue streams from existing
products. Moreover, new consumers may be attracted by a brand that is not subject to
obsolescence because the company commits to asserting and enhancing its assets.
Extending strategies may induce future cash flows as the use of established brands for
new products both increases the probability of product success and disseminates exist-
ing price premia. Furthermore, as brands become broadened through extending strate-
gies, advertising efficiencies can be gained.
Another important contribution of this work is the presentation of a technique that
dissolves companies’ trademark portfolios and maps trademark applications to different
roles and filing strategies. This technique unveils groups of interrelated trademarks
within trademark portfolios, which I call trademark families. While trademark families
themselves reflect brands, their sizes indicate both the degree of each brand’s legal
protection and their portfolio relevance. This technique is appealing for at least three
reasons: First, the combination of this technique with the market value approach de-
pends only on objective data. This concerns Tobin’s q as the dependent variable to
measure company performance and the various regressors. The need for studies that
employ ‘hard’ data has been noted as the marketing and business research often evalu-
ates brand decisions in hypothetical laboratory settings (Reddy et al., 1994). Only few
studies have used ‘hard’ data to investigate the relation between brands and company
values (e.g., Kallapur and Kwan, 2004; Lane and Jacobson, 1995; Rao et al., 2004).
Second, it has been suggested that studies involving brand management decisions
should be extended to other and broader product categories, instead of focusing on
single products or narrow categories (e.g., Sullivan, 1992). As trademarks can be
registered for the whole range of products and services, the technique of uncovering the
structure of trademark portfolios is not restricted to specific industries. Thus, when
compiling the dataset for this study, no restriction regarding industry membership was
imposed. Third, researchers have noted a lack of systematic empirical work in this field.
It has been stated that instead of focusing on single brands, researchers should consider
entire portfolios containing multiple brands since measurement errors occur when
combining brand-level with firm-level data (Aaker and Jacobson, 1994; Simon and
- 7 -
Sullivan, 1993).3 As a consequence of such objections, researchers have called for
research on more complex branding strategies that might include, for example, the
histories of brand extensions instead of focusing on single decisions (Aaker and Keller,
1990; Reddy et al., 1994). The technique proposed in this study complies with these
research needs because trademark portfolios reflect multiple brands and also reveal the
ways in which companies have developed them.
<INTEXT>Sullivan, 1992<>
This study is organized as follows. Section 2 explains how brand management decisions
may affect companies’ valuation in financial markets. The decisions involved in brand
management are characterized and then linked to the filing of trademark applications.
The idea is to use brand management as a ‘connector’ between trademark filing strate-
gies and brand assets. Section 3 presents the technique of revealing the structure of
trademark portfolios to uncover both the brands protected therein and the underlying
trademark filing strategies that produced these portfolios. For several companies, the
trademark portfolios are presented in detail. Section 4 describes the market value
approach and presents how trademark portfolio characteristics are accommodated in the
market value equation. Section 5 presents how the data have been compiled and unveils
descriptive statistics of the dataset. In Section 6, I estimate the market value equation
and present the results along with a discussion of them. Section 7 summarizes the main
results, addresses limitations of this work, and identifies fruitful avenues for further
research.
3 Imagine a company like Procter & Gamble holding a large portfolio of brands (e.g., Duracell, Gillette, Lenor, Pampers). Problems may arise when data on single brands (e.g., price premia) are combined with firm-level data (e.g., company values).
- 8 -
2 The Connection Between Market Value, Brand Management, and Trademarks
This section explains brands as an asset class (Section 2.1). It then describes how brand
assets are linked to brand management (Section 2.2) and that decisions to create new
brands or to develop existing ones (e.g., by means of line extension or brand extension)
are among the main issues of brand management (Section 2.3). The development of
brands would not be possible without transferable reputation and informational leverage
(Section 2.4). Finally, it is discussed how brand management is reflected in trademark
filing strategies (Section 2.5).
2.1 Brand Assets
Brands belong to the class of intangible assets (Kapferer, 2004; Lev, 2001). The main
function of a brand is differentiation. From the company’s perspective, brands enable
consumers to identify their products and services as well as to differentiate them from
the products and services of competing businesses. Brands also induce perceptions by
consumers. Bennett (1995) and Dibb et al. (1997) state that a brand is a name, term,
design, symbol, or any other feature that identifies a company’s product or service as
distinct from those of other companies. Brands differ from trademarks in two main
ways: First, a brand can comprise not only a single name, term, design, or symbol,
which regularly are the trademarks, but any combination thereof. Hence, although not
explicitly stated in the aforementioned definition, a brand can represent a bundle of
trademarks. Second, consumers’ perceptions of a brand are formed not only by signs
that can be graphically represented like trademarks (European Council, 1993, Art. 4) but
also by intangibles such as reputation and image (Ailawadi et al., 2003). Companies
rely on trademarks to codify and communicate brands because trademark rights are the
fundament of differentiation. That is because they, as legal instruments, assure that
signs or symbols cannot be copied or imitated by competitors. For consumers, however,
the definition of a brand focuses on the perceived added valued delivered by the brand
not on the graphical trademark itself (Farquhar, 1989). A brand can be viewed as a
feature of the product both inducing consumer perceptions and affecting consumer
choice (Agarwal and Rao, 1996). As such, it bundles attributes that provide satisfaction
and benefits to the consumer.
<INTEXT>Bennett, 1995; Dibb et al., 1997<>
- 9 -
Brand assets have been widely discussed in the literature, and researchers have pro-
posed several ways to conceptualize, measure, manage, and enhance them. Researchers
do not agree on a common perspective for studying brand assets. Instead, they have
either used an individual consumer-oriented approach or a firm-level approach (e.g.,
Farquhar, 1989; Goldfarb et al., 2007). As Ailawadi et al. (2003, p. 1) state, “[T]he two
perspectives are linked because firm-level outcomes, such as incremental volume,
revenue, price commanded, cash flow, and profit, are the aggregated consequence of
consumer-level effects, such as positive image, attitude, knowledge, and loyalty.” The
several definitions that have been developed have in common that brand assets refer to
the difference between outcomes accruing to branded products and those accruing to
unbranded products (Aaker, 1991; Ailawadi et al., 2003; Goldfarb et al., 2007). If the
outcome is viewed at the individual consumer-oriented level, an appropriate variable to
study brand assets would be the price premium of a product due to its brand. If outcome
however is viewed at the firm-level, appropriate measures would be profits, sales or
market valuation. The former perspective attempts to measure the strength of consumer
attachment to a brand, and the latter perspective conceptualizes brands as assets at the
firm-level. Brand assets can thus be studied through two measurable constructs (Wood,
2000): brand strength and brand value. Wood (2000) argues that researchers taking a
consumer-oriented perspective analyze the strength of a brand while firm-oriented
approaches seek to analyze its value. This implies a causal relationship since the brand
strength, which influences consumer product choice, ultimately materializes in brand
value. Marketing activities such as advertising lead to brand strength and shape con-
sumers’ willingness to buy branded products (Farquhar, 1989). In turn, brand value as a
financial measure ultimately depends on these strengths (Goldfarb et al., 2007;
Srivastava et al., 1998). Since trademarks protect brands, brand management activities
are mirrored in trademark portfolios. I thus argue that brand values, which are implicitly
considered in company values, are reflected in the configurations of companies’ trade-
mark portfolios.
<INTEXT>Wood, 2000<>
According to consumer-based approaches to study brand assets, consumers and their
reactions to a company’s marketing efforts are the main source of a brand’s strength.
Pitta and Katsanis (1995) found that brand strength is related to the probability of
consumer choice and that brand strength leads to a higher degree of loyalty that “insu-
lates the brand from a measure of competitive threats” (p. 56). The finding that brands
affect consumer choice was confirmed by others (Agarwal and Rao, 1996; Srinivasan et
- 10 -
al., 2005). Brand strength can also be assessed by the price premia that branded prod-
ucts yield over unbranded products (Farquhar, 1989). Arvidsson (2006) argues that the
strength of a brand resides in the minds of consumers. Interestingly, he argues that when
trademark law protects brands from dilution, this body of law actually seeks to inhibit
any interference with consumer perceptions. He concludes that what finally is protected
is the “property over a specific share of mind” (p. 189). Similarly, Aaker (1991) sug-
gests that a change in the brand’s sign or name – which regularly are trademarks –
might affect brand value. The main drivers of brand strength are awareness, loyalty,
quality perception, associations, and other proprietary assets such as trademarks (Aaker,
1991; Seetharaman et al., 2001; Srinivasan et al., 2005). However, consumer-oriented
approaches do not reveal the financial value of brand assets at the firm-level.
<INTEXT>Arvidsson, 2006; Pitta and Katsanis, 1995; <>
Firm-oriented approaches to study brand assets seek to analyze the financial value of
brands. The financial value of a brand stems from its potential to generate future cash
flows (Aaker and Jacobson, 1994; Goldfarb et al., 2007; Srinivasan et al., 2005). The
two main sources of these cash flows – and, accordingly, the two main sources of brand
value – are the brand’s potential to increase the success of existing products and the
brand’s potential to successfully support launching new products (Smith and Park,
1992). Concerning existing products, future cash flows arise when price premia can be
charged, when consumers are loyal, or when new consumers can be attracted. Cash
flows from launching new products appear when the company decides to re-use an
established brand to introduce new products. This popular strategy of line extension or
brand extension will be described in greater detail below. Research has confirmed that
stock markets consider brands in their firm valuations (Kallapur and Kwan, 2004; Lane
and Jacobson, 1995; Simon and Sullivan, 1993). The estimation of the financial value of
brands has been the subject of many research projects (e.g., Barth et al., 1998;
Kamakura and Russell, 1993; Keller and Aaker, 1992; Reddy et al., 1994; Swait et al.,
1993). These studies acknowledge the importance of brands as intangible assets for a
company.
In this study, I take a firm-oriented approach and estimate the financial value of brand
assets through firm values in financial markets. According to Simon and Sullivan (1993,
p. 29) brand assets originate from “the incremental cash flows which accrue to branded
products over and above the cash flows which would result from the sale of unbranded
products.” Company communication and advertising, reflected in trademark portfolios,
- 11 -
create brand associations for consumers (Aaker, 1991), thereby affecting their purchas-
ing decisions leading to future cash flows (Goldfarb et al., 2007). These are assessed by
financial markets and materialize in companies’ valuations in stock markets. However,
since the market value of a firm in financial markets provides an “unbiased estimate of
the future cash flows that are attributable to all of the firm’s assets”4 (Simon and
Sullivan, 1993, p. 29), the value of a company’s brand assets needs to be extracted.
Simon and Sullivan (1993) employ such a methodology and show that brand assets are
associated with companies’ marketing decisions such as advertising expenditures or
product introductions.
<INTEXT>Aaker, 2004a<>
Clearly, the relationship between a company’s products and its brands depends on the
corporate brand strategy, the brand portfolio, and the trademark portfolio that is associ-
ated with the brand portfolio. Companies offering electronic products such as home
entertainment systems (e.g., Samsung) or computer equipment (e.g., Hewlett-Packard)
tend to use one strong brand that comprises large fractions of the company’s total
business. Other companies selling consumer goods (e.g., Procter & Gamble) follow a
different strategy and create separate brands for each product or each product category.5
Rao et al. (2004) link these brand strategies with company values in financial markets.6
They argue that brand strategies can be plotted on a continuum with companies having a
dominant corporate brand (e.g., Samsung, Hewlett-Packard) at the one end, and compa-
nies using several individual brand names with no corporate identification (e.g., Procter
& Gamble) being at the other end. They find that corporate branding strategy is more
highly valued in financial markets as compared to other branding strategies. They
explain this finding through the differences in costs and benefits of these strategies.
Having a strong corporate brand enables a company to concentrate on building and
maintaining the reputation of a single brand, whereas a strategy of using an individual
brand for each product requires a company to build a reputation for each of its brands.
These differences affect future cash flows and, thus, the market value of a company.
4 Emphasis added. 5 For example, some of the brands Procter & Gamble owns are Duracell, Gillette, Lenor, Ariel,
Pampers, and Pantene. 6 Aaker (2004) also described various brand strategies which are similar to those of Rao et al. (2004).
- 12 -
2.2 Brand Management
The way in which brands and trademarks are managed is influenced by the branding
strategy. Brand management deals with the management of the whole brand and trade-
mark portfolio that a company owns. Although portfolios of brands have been consid-
ered in research (Aaker, 2004a; Montgomery and Wernerfelt, 1992; Petromilli et al.,
2002; Simmons et al., 2000; Völckner and Sattler, 2006), this area lacks systematic
examinations of brand portfolios and, in particular, trademark portfolios. Work in this
area points out that, in addition to single brands, firms’ entire brand portfolios are
important to appropriately study companies that own multiple brands. Brand manage-
ment involves marketing decisions that seek to build brand strength at the consumer-
level. Moreover, companies are able to foster brand strength by filing trademarks that
enable consumer perceptions to center on a particular graphically protected sign,
thereby establishing a link between the consumers and the company. Finally, companies
protect the strength of a brand by taking legal actions against competing businesses that
seek to take unfair advantage of a brand by filing confusingly similar trademarks.
As Simon and Sullivan (1993) point out, studying brand assets correctly and objectivly
allows an evaluation of the long-run impact of marketing decisions. Such decisions
concern the structure of both the brand and the trademark portfolio. The structure of a
brand or trademark portfolio can be regarded as the visible ‘facade’ of a company. It
represents the way in which a company organizes its brands, marks its products, and
interacts with the market. Aaker (2004a) illustrates the portfolio configuration with
several examples and classifies the brands in companies’ portfolios according to their
roles. According to him, a parent brand is located at the top of the hierarchy, e.g., the
brand Sony. Then, by extending the parent brand into a new segment, a novel so-called
subbrand may emerge, e.g., Sony Walkman.
<INTEXT>Aaker, 2004a<>
Brand management will be reflected in companies’ trademark portfolios. For example,
the register of CTMs shows that Microsoft, according to its trademark filings, sought to
create a new brand for its operating system Windows7 since it did not explicitly link the
7 CTMs No. 79681, No. 327890, and No. 1691963.
- 13 -
trademark’s name to the corporate name.8 Microsoft continued this strategy with
subsequent versions (e.g., Windows XP9 and Windows Mobile10). This is different from
its package of office applications sold under the brand Microsoft Office11. Microsoft
explicitly links this software package to its corporate name.12
It is important to point out the linkages of brand management to new product develop-
ment and subsequent market introduction. If a new product has been developed, several
issues are important for its introduction to the market. The company has to decide
whether it should create a new brand or use an existing brand to cover it. When creating
a new brand, the name to be chosen is a complex issue. Schuiling and Moss (2004)
illustrate these difficulties in the pharmaceutical industry. For example, the name of a
new pharmaceutical product may be a chemical-derived name, a therapy name, referring
to a use, an indication, or a newly invented name. If the company decides to use an
existing name to cover the new product, it has to decide whether the existing brand is
used without change to label the new product or if the existing brand is used through a
modified name, which may trigger the filing of a new trademark. It has been stated that
the corporate name itself is usually among the most important brands a company owns
(Aaker, 2004b). As the history of well-known brands shows (e.g., Shell or Lufthansa), a
brand needs to be modernized to continuously serve as an attractive platform for
extensions and new product launches (Farquhar, 1989; Farquhar et al., 1992).
<INTEXT>Schuiling and Moss, 2004<>
Brand management thus deals with two main decision categories. The first category
involves decisions to create new brands or to use existing ones when introducing new
products. If an existing brand is used to accommodate the new product, the brand is said
to be extended or stretched (Aaker, 1990; Cabral, 2000). The second decision category
is solely associated with applying an existing brand and concerns the way in which the
8 Here, creating a new brand explicitely needs to be distinguished from a new product. Of course, the new product may carry both trademarks, Microsoft and Windows. However, the name of the new trademark is Windows and not Microsoft Windows.
9 CTM No. 2160810. 10 CTM No. 3423845. 11 CTMs No. 951459, No. 2157113, and No. 7138225. 12 Microsoft does not call this software package simply Office, Office 2000, or Office XP. Obviously, the
trademark Office is devoid of distinctive character, and its filing would be rejected if it has not gained distinctiveness through use. Although not protected, Microsoft could still use the term Office for ad-vertising its software suite, something which has not happened. While trademarks like Office 2000 or Office XP are unlikely to be subject of a rejection, Microsoft still did not register these trademarks.
- 14 -
brand is developed. In general, it must be decided whether existing brand names should
be used without any change or whether they should be modified. Developing a brand
might elevate the brand to the status of an umbrella brand. An umbrella brand is a brand
that spans various products, product classes or business segments but still seeks to
communicate a common value proposition (Erdem, 1998; Sullivan, 1990; Wernerfelt,
1988). For example, Virgin can be viewed as an umbrella brand covering retail busi-
ness, an airline, a radio station, and other business segments. According to the founder
of Virgin, Richard Branson, “Consumers understand that all the values that apply to one
product – good service, style, quality, value and fair dealing – apply to the others”
(Time Magazine, No. 26, June 1996, cited by Andersson, 2002). Of course, a common
value proposition of such different product categories all carrying the same brand is not
always given. Still, the example of Virgin illustrates the breadth an umbrella brand can
take.
2.3 Creating Versus Developing Brands
Brand management first involves the creation of new brands and, second, the develop-
ment and leveraging of established brands, for example, by extending pre-existing
brands to new products. If companies introduce new products, the decision either to
create a new brand or to use an existing one is influenced by cost-benefit analyses
(Choi, 1998; Smith and Park, 1992) and by the availability of a suitable brand for
further development (Choi, 1998; Osler, 2004). The share of new products that use an
existing brand through extension has been estimated to range between 80% and 95% of
all new product introductions (Aaker, 1991; Kim and Sullivan, 1998; Rangaswamy et
al., 1993). An interesting example is the car manufacturer Toyota (Choi, 1998). For
communication to the mass market, it used its corporate brand Toyota, which is linked
to introductions of new cars like Toyota Aygo13 or Toyota Yaris14. However, when
Toyota introduced Lexus15 as a new car category to target the premium market segment,
it avoided any associations with the corporate brand Toyota when filing trademarks.
Obviously, the question arises why Toyota intentionally connected its cars for the mass
market with its corporate name but chose a new unrelated brand for its luxury cars.
According to Choi (1998), this can be explained by Toyata entering a new market
segment with different consumer preferences.
When extending an established brand to a new product, researchers distinguish between
line extension and brand extension (Aaker and Keller, 1990; Ambler and Styles, 1997;
Reddy et al., 1994). Line extension refers to the application of an existing brand to a
new product with the new product being in a category the brand is already known in. In
other words, the existing brand is not extended to new product classes. Examples
include the broad product portfolios of consumer electronics manufacturers like Hew-
lett-Packard, which uses its corporate brand for virtually all new products. Brand
extension involves the application of an established brand to different product classes
that are new to the brand. An example is Canon, which initially produced photographic
cameras and later extended its brand to printers and photocopiers (Cabral, 2000).
Another example is Honda, which originally produced motorcycles but later extended
its name to automobiles as well as lawn and garden power tools (Dacin and Smith,
1994).
Instead of using the term brand extension, as most researchers do, sometimes research-
ers prefer to say ‘brand stretching’ (e.g., Pepall and Richards, 2002) although both mean
the same. Some researchers explicitly focus on brand extensions (e.g., Smith and Park,
1992; Sullivan, 1992), and others focus on line extensions (e.g., Reddy et al., 1994).
The main features of both extension modes such as informational leverage, transferable
reputation, and spillover effects – described in the next section – apply to both variants
of extensions.16 It needs to be noted that, depending on the definition of how broad a
product class is, the distinction between line and brand extensions blur. While both line
extension and brand extension refer to the process of extending an existing brand to
new products, the term umbrella brand refers to the result of several extension proc-
esses: An umbrella brand is a brand that covers a broad range of different products or
product classes and, thus, is to a large extent a result of multiple extensions.
<INTEXT>Smith and Park, 1992; Tauber, 1988; Choi, 1998<>
A cost-benefit analysis compares the attractiveness of brand development to that of
brand creation (Choi, 1998). For firms extending their brands either within or beyond
16 For the remainder of this study, I will use ‘extension’ and ‘brand extension’ interchangeably, with ‘extension’ also covering ‘line extension’ if not noted otherwise.
- 16 -
original product categories, several sources of costs and benefits have been revealed by
researchers. According to Smith and Park (1990), firms that use brand extension have
lower advertising expenses and thus exhibit a greater advertising efficiency. Tauber
(1988) found that on average the cost of introduction of a new product via a brand
extension amounts to 50 million US dollars, compared to 150 million US dollars when a
product is introduced with a newly created brand. Brand extensions also have a positive
impact on the market share of new products (Smith and Park, 1992). Moreover, it has
been stated that extensions have the potential to generate future cash flows and are
valued by financial markets (Srivastava et al., 1998). On the other hand, costs may be
incurred if consumers become confused, for example, when a brand name is used on
various products, leading to the dilution of the existing brand (Loken and John, 1993).
<INTEXT>Völckner and Sattler, 2007<>
The availability of a suitable brand for development is required if a new product is to be
introduced to the market by extending an existing brand (Osler, 2004). Obviously, if the
company is not able to find leveragable associations with an existing brand, a new brand
needs to be created. The suitability of developing a brand has been widely discussed in
the marketing literature referring to the ‘fit’ between the parent brand and the extension
(Aaker and Keller, 1990; Broniarczyk and Alba, 1994; Keller and Aaker, 1992; Reddy
et al., 1994; Völckner and Sattler, 2006, 2007). The parent brand could be damaged, for
example, if two products carrying the same brand are too different leading to consum-
ers’ confusion. In particular, quality considerations matter as the example of the brands
Toyota and Lexus illustrated. Choi (1998) analyzed the decision of firms to use brand
extension or to create a new brand and finds that “new brand names are created for high
cost premium products such as Lexus, whose market is limited to upscale consumers”17
(p. 666). His study focused on multi-product companies having different reputations in
different markets. It has been found that the development of brands through extensions
signals high quality; this will be described in more detail in the next section.
2.4 Informational Leverage, Transferable Reputation, and Spillover Effects
Extensions have been proven to be profitable strategies because of the reduced product
introduction cost, the increased chance of success, the advertising efficiency that can be
gained, the increased demand that an existing brand can provide to a new product, and
17 Emphasis added.
- 17 -
the premium prices that can be charged (Aaker, 1990; Kapferer, 2004; Pepall and
Richards, 2002; Reddy et al., 1994; Smith and Park, 1992; Tauber, 1988). Any success-
ful development of brands such as extending or modernizing brands would not be
possible without informational leverage (Choi, 1998). Informational leverage builds
upon transferable reputation and spillover effects between the parent brand and the new
product. Spillover effects can also have a reciprocal nature since the brand value of the
parent brand can in turn be enhanced or diminished (Swaminathan et al., 2001). In all, it
is important to also consider the extension potential of a brand when studying brand
assets (Tauber, 1988).
Brand extension is a mechanism of informational leverage (Choi, 1998). Consumers
make inferences from the performance of one product to other products using the same
brand. For example, if a consumer discovers a product’s inferiority, he might opt to not
repurchase the same product again or refrain from purchasing another product that is
affiliated with the same brand: The experience with his first purchase is valuable
information regarding the second purchase. As Wernerfelt (1988) stated, consumers
pool their experiences with several products and attribute them to the brand. Since
consumers use these pooled experiences to infer the performance of other products of
the same brand, the brand carries information, and companies can use the brand to
transmit information to consumers. If companies extend an established brand to a new
product, they seek to tap into consumers’ experiences with products sold under the
established brand and to link these experiences with the new product. Using informa-
tional leverage thus allows companies to alleviate the problem of asymmetric informa-
tion because consumers use the experience of old products to infer the performance of
new products.
Companies can only solve the problem of asymmetric information through informa-
tional leverage if consumers correlate their beliefs about the quality of products sharing
the same brand. This leads to spillovers from the experience of known products to
unknown products. The assumption that consumers correlate their beliefs has been
empirically validated using experimental settings (Aaker and Keller, 1990) and field
data (Balachander and Ghose, 2003; Erdem, 1998; Sullivan, 1990). Aaker and Keller
(1990) found that the perceived quality of one product provides a stock of information
about the expected quality of other products. According to Erdem (1998), consumers’
expectations about the quality of several products are highly correlated if these products
- 18 -
share the same brand. The panel data that she uses in her regression framework concern
dental care products of which some carry the same brand. Sullivan (1990) also uses
field data from the automobile market and observes image spillovers. Hakenes and Peitz
(2008b) point out that numerous product classes are concerned such as cars, consumer
electronics, household durables, cosmetics, and many services (e.g., maintenance or
financial services), since these product classes are characterized by imperfect ob-
servability of product quality.
<INTEXT>Hakenes and Peitz, 2008b<>
The link between brand extension and product quality has been assessed in the econom-
ics literature. Extending brands to new products is a signal of high quality (Cabral,
a multi-product monopolist introducing new experience goods.18,19 He finds that infor-
mational leverage leads to less price distortion of the newly introduced products.
According to him, firms stake their “reputation as a bond for quality in using brand
extension as a signal of quality” (p. 655). Reputation is at stake if the association of a
high-quality with a low-quality product adversely affects the profits of the former due to
consumers’ negative evaluation of the brand.20 The reputation being transferred between
products leads to both forward and reciprocal spillover effects (Wernerfelt, 1988).
Wernerfelt (1988), using a signaling model, argues that a common brand shared by
different products represents a ‘performance bond’ that only links high-quality products.
The company’s decision to extend a brand optimally spans only high-quality products in
order to comply with consumer perceptions. If the company chooses to extend a high-
quality brand to a low-quality product, it would jeopardize its reputation. Shirking on
product quality by extending the brand to a low-quality product is thus prevented. The
monopolist therefore uses brand extension only if the new introduced product is of high
quality. Cabral (2000b) takes a different approach and compares high-quality with low-
quality firms. He finds that high-quality firms whose reputation builds on past perform-
18 Experience goods require the consumer to first purchase the product before he is able to determine its quality (Nelson, 1970). Examples include appliances, automobiles, and consumer electronics.
19 Choi (1998) argues that his model is complementary to the reputation model of Tadelis (1999). While the model of Choi (1998) focuses on inter-product transfers of reputation, Tadelis (1999) focuses on on inter-firm transfers of reputation.
20 Choi (1998) states that brand extension is not the only mechanism for informational leverage. According to him, “any marketing arrangement that purposely associates one product with another” (p. 667) is a form of informational leverage as long as the company puts its reputation at stake. Hence, other mechanisms for informational leverage are sequencing of product introductions or bundling of products (Choi, 1996, 1998).
- 19 -
ance will often use extensions to transfer their reputation to new products. His model
suggests that high-quality firms benefit more from reputation than low-quality firms.
Thus, he argues that stretching reputation by means of extensions signals high quality.
Hakenes and Peitz (2008b) argue that umbrella brands act as “a safeguard to consum-
ers” (p. 547) and also provide incentives to companies to offer products of high quality
if these products are sold under a well-developed brand. This is in line with the finding
that umbrella brands act as full or partial substitutes to external quality certification
(Hakenes and Peitz, 2008a). Moreover, Choi (1988) points out that brand extensions
might enhance incentives for R&D.
<INTEXT>Choi, 1998; Tadelis, 1999; Hakenes and Peitz, 2008b; Cabral, 2000<>
Taking a broader perspective, Montgomery and Wernerfelt (1992, p. 50) argue that
“reputational economies of scope” exist. This can be traced back to information spill-
overs, which exist between all products affiliated with one shared brand. If products are
introduced sequentially, Smith and Park (1992) find that brand extensions benefit from
spillover effects of the parent brand. However, it is important to note that both forward
and reciprocal spillover effects exist (Balachander and Ghose, 2003). Balachander and
Ghose (2003) apply scanner data from food products and find reciprocal spillover
effects between products that carry the same brand, namely, that the success of the
parent brand is affected by new product introductions carrying the same brand. These
reciprocal spillover effects can be both negative and positive (Balachander and Ghose,
2003; Swaminathan et al., 2001). Negative reciprocal spillovers exist because consum-
ers might devalue the brand subsequent to an extension thereby also threatening other
products affiliated with the brand. These negative reciprocal spillover effects can
weaken the parent brand and can materialize through cannibalization or dilution of the
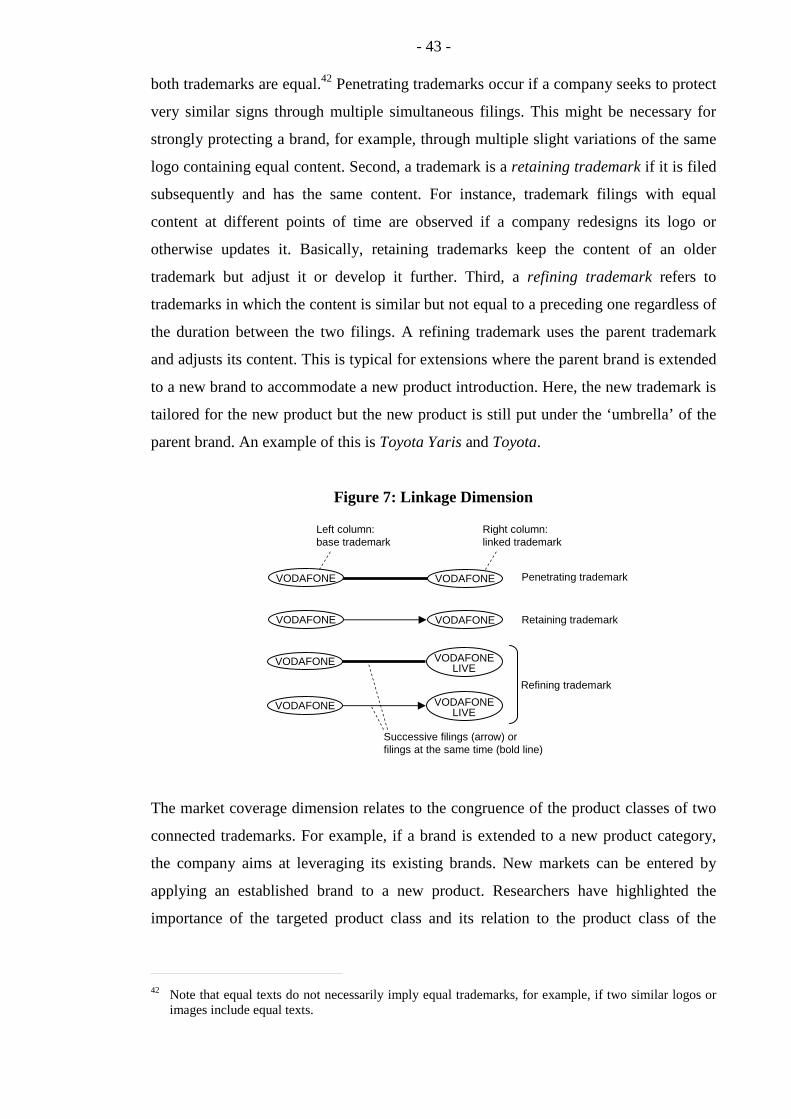
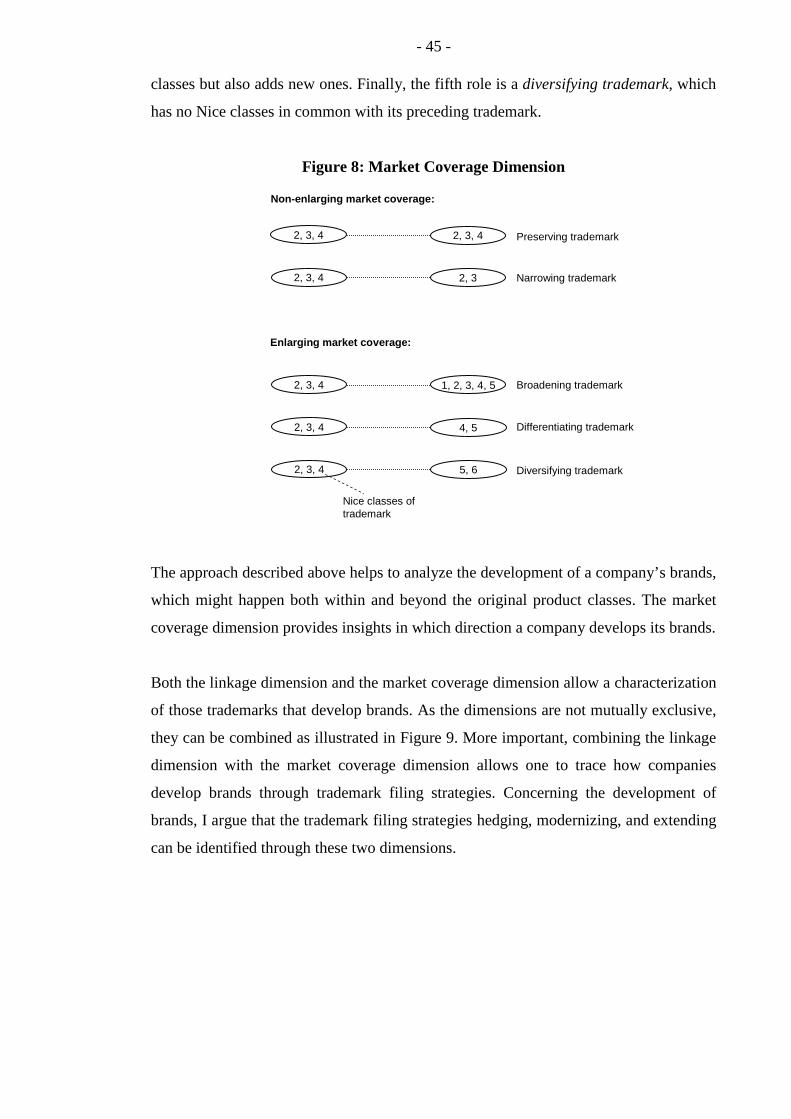
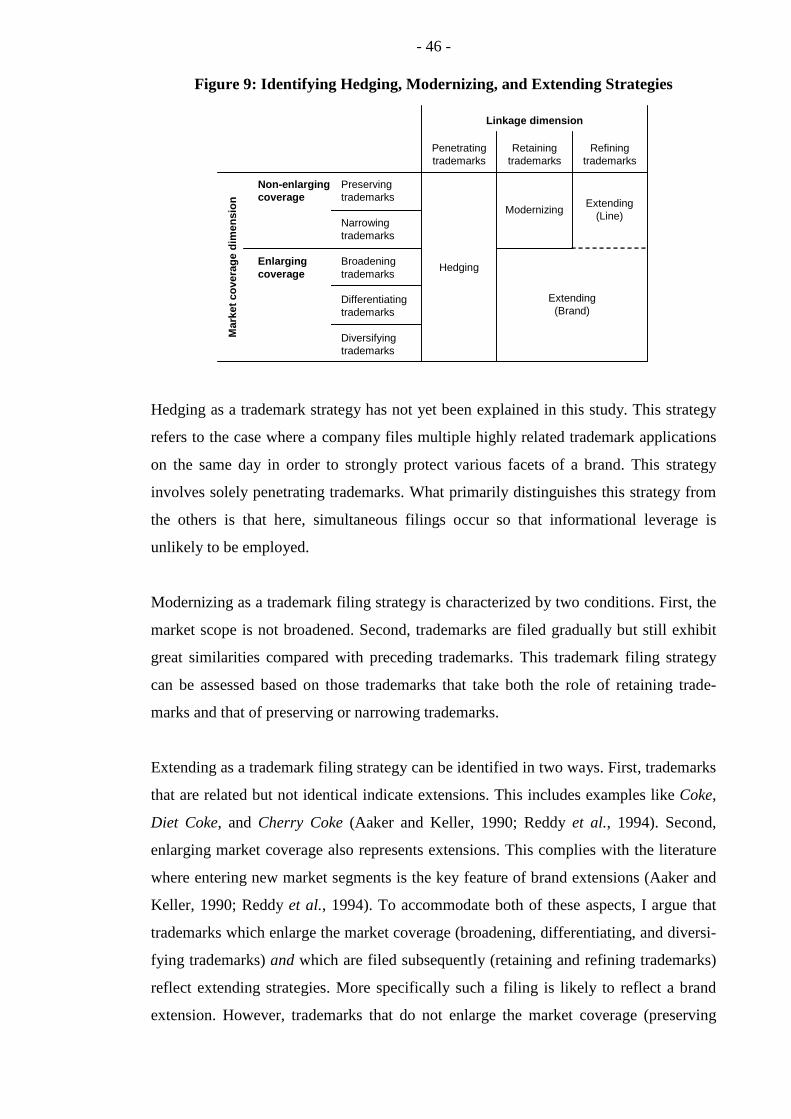
From a brand management perspective, three trademark filing strategies exist: creating,
modernizing, and extending brands. The fourth trademark filing strategy, hedging
brands, cannot be derived from the perspective of brand management because the legal
mechanisms of trademark law are its context.21 While the first strategy concerns the
creation of a new brand, the second and third strategy deals with the development of an
existing brand. The second strategy aims at modernizing an already existing brand. This
strategy corresponds to the renewal of an established brand to keep its appearance up-
21 Each trademark only protects a single sign or word. Yet, a brand might need to be represented by a bundle of trademarks. This is addressed by the hedging strategy, which does not have its roots in brand management since it specifically builds on the nature of trademarks as IP rights and their rela-tion to multi-faceted brands.
- 21 -
to-date and to maintain its strengths. The third strategy extends an established brand to a
new product.
The creation of new brands may be required if the company wants to tap into new
market segments and has no suitable brands to extend, as illustrated by Toyota’s crea-
tion of the brand Lexus (Choi, 1998). Such decisions are usually followed by the filing
of trademarks. It has been shown that the introduction costs for products under a new
brand are higher compared to the extension of pre-existing brands (Tauber, 1988).
Moreover, the probability of success is lower if no backing from a reliable parent brand
is available. I argue that financial investors have trouble to assess the future success of
newly created brands. The difficulty of projecting the success of a new brand is illus-
trated by comparing this situation with the case where a brand extension is used. Then,
investors can approximate the extension’s future success based on the strength and
history of the parent brand. If financial investors assess the potential of a new brand,
they are confronted with greater difficulties when estimating future revenue streams.
Modernization of established brands can be viewed as the ‘renovation’ of existing
brands. This strategy might be required to inhibit the dilution of a brand or to conserve a
brand’s potential to provide a platform for subsequent brand extensions. Situations in
which a company uses this strategy include those where the brand’s old appearance
needs to be adjusted to a changing environment or those where a trademark needs to be
altered to discard unwanted associations.22 Practice shows that companies use this
instrument regularly. Examples include Shell, whose corporate sign of a shell has
undergone several changes, and Lufthansa, which redesigned both its corporate logo
and its sign at various times. Actually, the modernization of established trademarks is
linked to line extensions since an established brand is only modernized if the company
seeks to use it for future products. However, I regard this strategy as a separate path for
the development of brands since the main objective of this strategy is to keep the brand
itself updated and renewed in order to uphold its strength, for example, to accommodate
future extensions (Farquhar, 1989; Farquhar et al., 1992). Although many well-known
trademarks have undergone major and minor changes over time, this instrument has not
been a major research issue. However, its existence is often implicitly assumed in the
22 Note that such situations involve the filing of new trademarks because registered trademarks generally cannot be altered (European Council, 1993, Art. 48).
- 22 -
literature (e.g., Bass, 2004). As the product life cycle approach suggests, a product
passes through different stages during its life cycle. It has been noted that brands need
to be adjusted according to the stages of the branded products (Rajagopal and Sanchez,
2004). As with extensions, informational leverage increases the probability of success-
ful product introductions. Moreover, only a strong brand can serve as the parent brand
for future brand extensions (Smith and Park, 1992). Thus, I expect that modernizing
brands as a trademark filing strategy is valued in financial markets.
Extensions are seen as beneficial because they reduce introduction costs for new
products and increase the probability of product success (Aaker, 1990). They are
profitable even if cannibalization between the parent brand and the extension brand is
accounted for (Reddy et al., 1994). Smith and Park (1992) found that advertising
efficiencies can be realized and a greater market share can be captured through exten-
sions. If both marketing expenses are lowered and revenues are increased through the
use of extensions, future cash flows will rise. This is in line with Srivastava et al.
(1998), who argue that extensions should enhance cash flows. As the market value of
companies in financial markets represents the sum of all discounted future cash flows,
extensions should be considered by investors in financial markets. Analyzing stock
reactions subsequent to extension announcements, Lane and Jacobson (1995) confirmed
that extensions can be financially beneficial, thus increasing the value of brand assets.
When companies develop their brands by means of extensions, they file trademarks to
protect these extensions. As illustrated with Toyota filing the trademarks Toyota Aygo
and Toyota Yaris, trademarks allow us to observe extensions because they indicate the
connection to the parent brand. Although the similarity of the parent brand and the
extension is crucial to the success of extensions (Aaker and Keller, 1990; Broniarczyk
and Alba, 1994; Keller and Aaker, 1992; Reddy et al., 1994; Völckner and Sattler,
2006, 2007), companies often seek to launch products into unknown or rather distant
product classes (Dawar and Anderson, 1994). Companies that employ extensions of this
kind need to file new trademarks to gain protection in these new markets. Due to
advertising efficiency, increased market growth, and a greater probability of success
regarding new product introductions, I expect that extending brands as a trademark
filing strategy is valued in financial markets.
<INTEXT>Aaker, 1990; Srivastava et al., 1998; Völckner and Sattler, 2007<>
To summarize, I argue that financial markets value those companies that employ
trademark filing strategies which aim at developing and protecting established brands.
- 23 -
This includes both fostering existing brands by means of modernization and disseminat-
ing established brands by means of extension. Financial markets should value the
benefits of these strategies since they are likely to produce future cash flows. This is in
line with other research which showed that stock markets consider brands in their firm
valuations (e.g., Barth et al., 1998; Simon and Sullivan, 1993). These brands obviously
first need to be developed; and such brand development is mirrored in trademark filings.
In order to connect these trademark filing strategies with companies’ market values, the
structure of corporate trademark portfolios first needs to be examined in detail. This is
the objective of the next section.
- 24 -
3 Revealing the Structure of Trademark Portfolios
To assess trademark filing strategies and their valuation, the structure of how companies
built their trademark portfolios needs to be known. Revealing the structure of trademark
portfolios means that the various trademarks a firm possesses have to be grouped into
separate coherent trademark families. I use the term ‘trademark family’ in order to
denote a group of trademarks that jointly protects a brand to preserve its distinctiveness.
This allows separating those trademarks potentially creating new brands from those that
are filed adjacent to existing brands. For example, Microsoft’s brand Windows is
protected not only by its corresponding trademark23 but also by new trademarks that
refer to the parent brand but have been filed subsequently such as Windows XP24,
Windows Mobile25, or Windows Vista26. Trademark protection means that the distinct-
iveness of a brand can be maintained since trademarks allow their owners to take legal
actions against counterfeiting, imitation, or competitors’ filing of identical or confus-
ingly similar trademarks (European Council, 1993, Art. 8, and Art. 9; Phillips, 2003).
Thus, trademark families serve as the legal basis of a brand’s distinctiveness and protect
various facets and appearances of the brand. This section describes how these families
are identified in trademark portfolios and which trademark filing strategies were em-
ployed by companies to form them.
First, I describe the source of the trademark data (Section 3.1). Then, I explain the
consolidation of companies’ trademark portfolios (Section 3.2). Drawing the border
between companies is necessary for the third step, which presents the technique used to
group a portfolio’s trademarks into its families (Section 3.3). Finally, I use the revealed
structures of the trademark portfolios to carve out companies’ trademark filing strate-
gies (Section 3.4). Since this is, to my knowledge, the first time that the structure of
trademark portfolios is analyzed and that the connection between brands and trademarks
is empirically examined, I present and explain the trademark portfolios of several
For building corporate trademark portfolios, I used CTM data provided by the OHIM.
This database represents a copy of the CTM register comprising all CTMs that have
been filed between 1996 through 2004. There are no CTM filings before 1996 since the
OHIM commenced its operations in that year. As this work analyzes trademark filing
strategies, I argue that companies’ branding aspirations, which materialize in these
strategies, are best analyzed using trademark applications, regardless of whether an
application is ultimately granted or rejected.27 In all, the dataset from the OHIM com-
prises 402,724 trademark applications, of which 229,627 have been registered until the
end of 2004 when the legal status of each application was recorded; 56,169 trademark
applications failed, and 116,928 were still in the application process.
<INTEXT>von Graevenitz, 2007<>
To group the trademarks within a company’s portfolio into families, I rely on the
relatedness between trademarks. Although trademarks “may consist of any signs
capable of being represented graphically, particularly words, including personal names,
designs, letters, numerals, the shape of goods or of their packaging” (European Council,
1993, Art. 4), I will focus on those trademarks that contain words or letters for two
reasons. First, the relatedness between these text-based trademarks can be assessed
more easily and more objectively than other types of trademarks such as pure graphical
symbols, which would require a systematic examination of images. Second, the major-
ity of trademarks are text-based, be it either a pure word mark or a trademark that
includes text in its graphical depiction. Of all 402,724 trademarks in the dataset,
378,811 (94.1%) are text-based and analyzable.28
Companies of all sizes file trademarks. Applying the market value approach requires,
however, that the companies are publicly listed. I identified the world’s largest publicly
traded companies using the financial databases Reuters and Compustat. A total of 4,085
companies complied with my selection criterion of reporting at least 400 million Euros
in revenues in their last income statement. Other criteria such as the selection of certain
27 For the remainder of this study, the term ‘trademark’ is thus used to cover both applications and registered trademarks. This also applies to the terms ‘trademark portfolio’ and ‘trademark families’.
28 Actually, 383,495 trademarks are text-based but 4,684 of them cannot be systematically analyzed. Specifically, I declared those trademarks as analyzable which contained two or more alphanumeric characters.
- 26 -
industries were not imposed. The next section describes how trademark portfolios were
built for this set of companies.
3.2 Building Trademark Portfolios
To establish firm-level trademark portfolios, the trademarks of the OHIM database
needed to be reconciled with the names of the 4,085 companies derived from the
Reuters and Computstat databases. To consolidate trademarks at the corporate level, I
employed the ‘search engine logic’ described in the appendix. This approach uses each
company name as a search pattern and assigns the appropriate set of compatible trade-
mark applicants to that company. This step is necessary since a company can be repre-
sented by multiple trademark applicants. There are three main reasons for this: First,
spelling variations or misspellings can immediately lead to a seemingly inflated number
of applicants.29 Such variations of applicant names can be traced back to inconsistencies
committed by the trademark applicant or the examiners at trademark offices. Second, a
company changing its name or its legal form leads to multiple applicants. Third, a
company as a corporate entity needs to be distinguished from trademark applicants as
legal entities. From an organizational perspective, large corporations own different legal
entities, which represent several divisions and departments. While financial statements
are published on the corporate level, trademarks are filed on the level of legal entities.
An appropriate consolidation of trademarks at the corporate level thus requires that all
trademark filings of these associated applicants are pooled on the company-level. An
examination of the data reveals that not all companies of the initial selection filed
CTMs. Trademark applications were matched to 2,289 companies, which in total filed
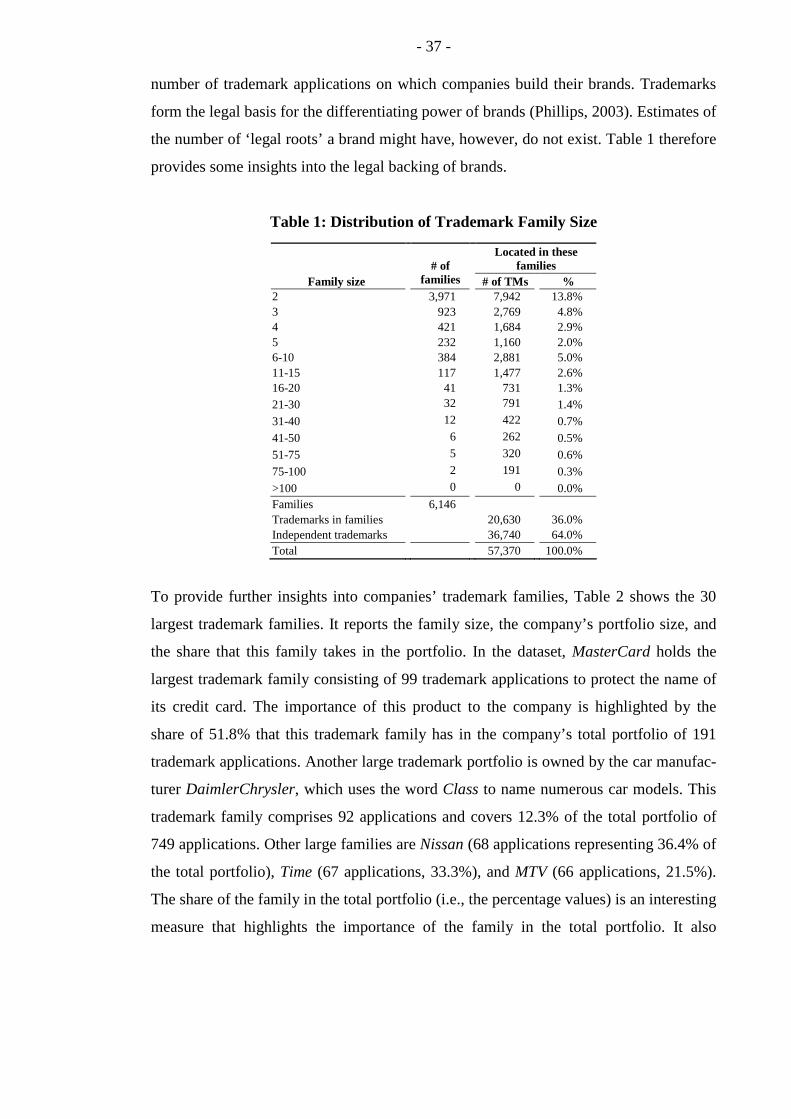
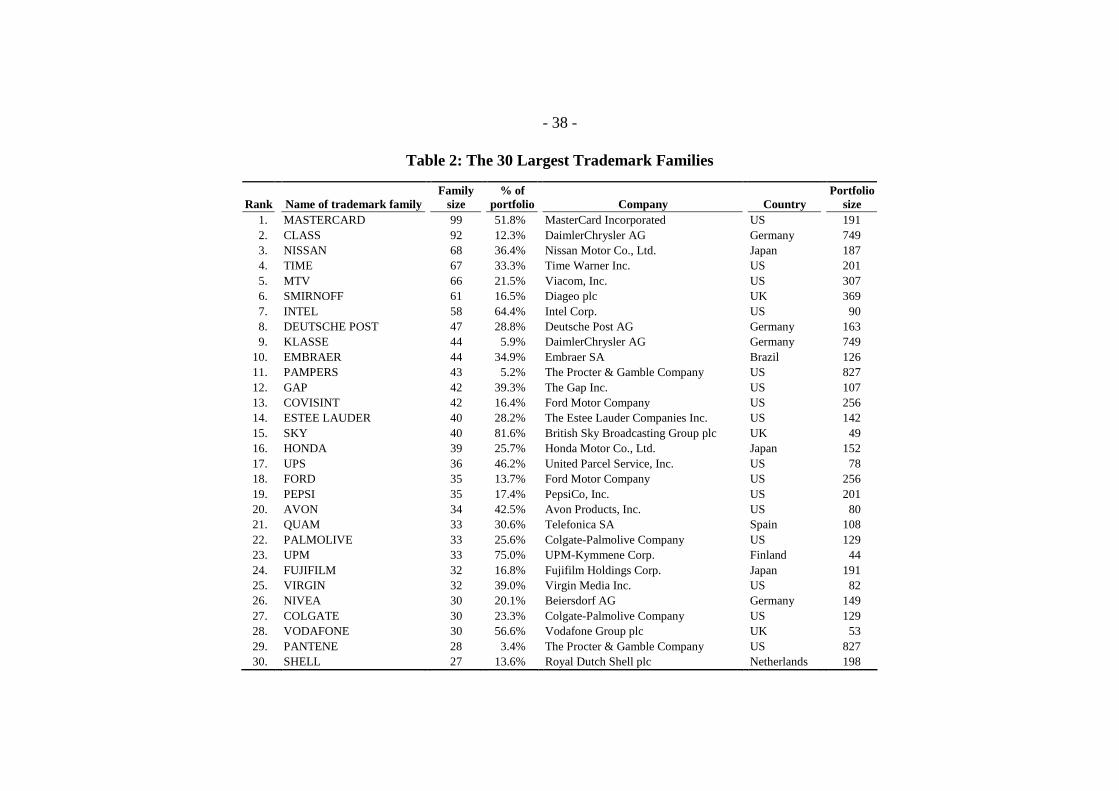
57,370 trademarks with the OHIM. Table 3, discussed in detail in the next section,
reports the top 30 companies as measured by the numbers of CTM applications they
have filed (see the column containing the portfolio size). The Japanese company
Konami tops the list, with 1,401 trademark applications, followed by Procter & Gamble
(827 CTM applications) and Deutsche Telekom (797 CTM applications).30
29 This issue has also been found to be a severe problem with patent filings (Magerman et al., 2006). 30 Note that 12 of these top 30 companies having the largest CTM portfolios are US-based. Companies’
locations will be examined in more detail below when discussing the final dataset used in the market value regressions (Section 5.3).
- 27 -
3.3 Identifying Trademark Families
After building firm-level trademark portfolios, their structures are revealed. As pointed
out above, I use the characters, words and syllables contained in trademarks to form
trademark families within the portfolios. Within each corporate portfolio, trademarks
are grouped into families by an iterative algorithm beginning with the first trademark
filed and ending with the last.
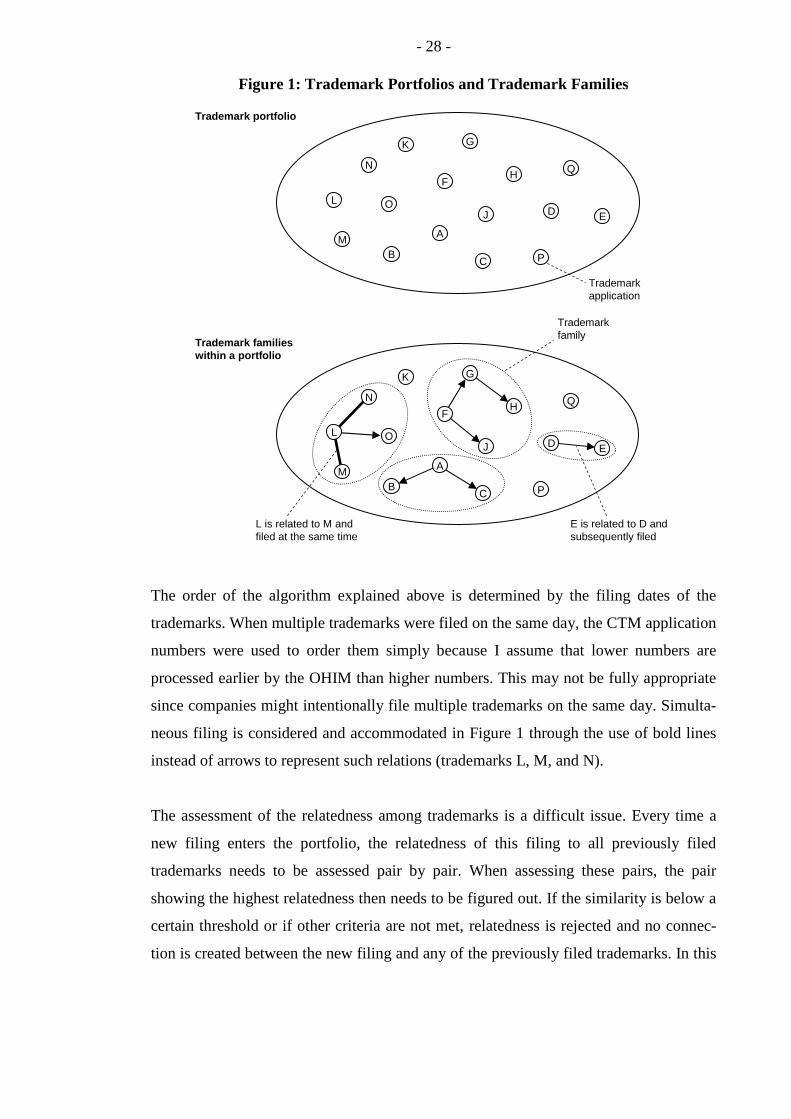
Based on this algorithm, the trademark families within a portfolio will be uncovered as
illustrated in Figure 1. It begins with the first trademark filed by a company, trademark
A, and gradually analyzes each trademark that is subsequently filed. As the second
trademark B is filed by that company, the relatedness between both trademarks is
assessed. If B is related to A, it is connected to the first trademark and creates a trade-
mark family with two members. In Figure 1, this is indicated by an arrow. As the third
trademark C is filed, the relatedness of this trademark to the preceding two trademarks,
A and B, is assessed. Where the relatedness is greatest, trademark C is connected to that
trademark, which is trademark A in Figure 1. As the fourth trademark D is filed by the
company, its relatedness to all previous trademarks is assessed again. If it is found to be
unrelated to any of the previously filed trademarks, it does not become connected to any
preceding trademarks; instead, it becomes an independent trademark, at least until the
new trademark E arrives. D and E are then connected because they show the highest
relatedness compared to the other preceding filings. Note that trademarks K, P, and Q
remain independent because they were not found to be related to others.
Depending on the highest relatedness to previous filings, new trademarks may also lead
to ‘chains’ of trademarks. Figure 1 illustrates this by the trademarks F, G, and H.
Trademark F, the first one filed within its group, initiated the trademark family. The
subsequently filed trademark G was connected to F since G yielded the highest related-
ness. H was then filed and found to have the highest relatedness to G among all other
preceding filings; hence, it is connected to trademark G and forms a ‘trademark chain’.
This addresses the issue raised by Dacin and Smith (1994), who suggested that exten-
sion chains also need to be considered.
- 28 -
Figure 1: Trademark Portfolios and Trademark Families
P
M
Q
K
O
B
J
C
E
NH
L
G
F
A
D
Trademark familieswithin a portfolio
Trademark portfolio
Trademarkapplication
Trademarkfamily
E is related to D and subsequently filed
L is related to M andfiled at the same time
P
M
Q
K
O
B
J
C
E
NH
L
G
F
A
D
<INTEXT>Dacin and Smith, 1994<>
The order of the algorithm explained above is determined by the filing dates of the
trademarks. When multiple trademarks were filed on the same day, the CTM application
numbers were used to order them simply because I assume that lower numbers are
processed earlier by the OHIM than higher numbers. This may not be fully appropriate
since companies might intentionally file multiple trademarks on the same day. Simulta-
neous filing is considered and accommodated in Figure 1 through the use of bold lines
instead of arrows to represent such relations (trademarks L, M, and N).
The assessment of the relatedness among trademarks is a difficult issue. Every time a
new filing enters the portfolio, the relatedness of this filing to all previously filed
trademarks needs to be assessed pair by pair. When assessing these pairs, the pair
showing the highest relatedness then needs to be figured out. If the similarity is below a
certain threshold or if other criteria are not met, relatedness is rejected and no connec-
tion is created between the new filing and any of the previously filed trademarks. In this
- 29 -
work, relatedness is based upon the text-based similarity of a trademark pair.31 The
similarity of trademarks can be analyzed solely on the basis of numerical string similar-
ity algorithms like the Jaro-Winkler or the Levenshtein approach (Cohen et al., 2003;
von Graevenitz, 2007). Such algorithms provide a value that indicates the similarity
estimate between any two strings. I use the bigram measure, whose values range
between zero and one, with higher values indicating higher similarity. However, I found
that trademarks contain specific words or syllables that have to be treated separately as
it is these key terms that make up the reference to a common brand. For example,
consider the filing of the trademarks Roche, Roche Cardiac, La Roche. The similarity
metric of the bigram string comparator yields 0.89 for a comparison of Roche and La
Roche. As I use a threshold of 0.7, this value is above the threshold indicating a reason-
able degree of relatedness. However, although Roche and Roche Cardiac are also
clearly related, the bigram metric indicates a similarity measure of 0.14, which mistak-
enly indicates a very low degree of relatedness.32 Companies often seek to trigger
spillovers from one trademark to another by intentionally making them similar or using
common words or syllables in both. Hence, based on the construction of trademarks, a
two-step approach is more appropriate when assessing their relatedness. In the first step,
similarity is assessed based on words or syllables that are contained in both trademarks
of each pair. In this step, for example, the fact that Roche is included in Roche Cardiac
is considered as an indicator of high relatedness. The second step assesses similarity
using the bigram string comparator as a similarity metric to assess imperfect string
matches. In this step, the words a trademark is composed of do not matter. Instead, only
the letters matter so that, for example, the trademark Sulagil can be found to be related
to the trademark Soulagil although neither word is included in the other. I deem this
hybrid approach of combining both seeking perfect matches and relying on similarity
algorithms appropriate because it takes into account the way in which companies
construct their trademarks to induce spillovers between them. Moreover, I expect that
this approach – given that trademarks are compounds of words or syllables – is superior
to applying solely numerical algorithms.
31 Specifically, only the alphanumeric characters of the texts contained in trademarks are used to determine the relatedness between trademarks.
32 This is due to the algorithm that cannot distinguish between the relevant importance of the fragments Roche and Cardiac. Obviously, the former should be more strongly weighted, which my approach exactly seeks to do.
- 30 -
I apply the bigram string comparator as a similarity algorithm only in the second step.
In the first step, however, Roche and Roche Cardiac are compared, and it is found that
the text of the former trademark is fully included in the text of the latter trademark. Put
differently, I argue that similarity within a pair of trademarks occurs in a hierarchy with
five different layers. As different layers are given by the way in which trademarks have
been constructed, the first step deals with determining the layer of each trademark pair.
Higher layers represent higher degrees of relatedness. After the first step, pairs with
lower degrees of relatedness are therefore ruled out and only the remaining pairs of the
highest layer are passed on to the second step. To select the most similar pair in the
second step, the bigram string comparator is then used.
In the first step, each pair is assigned to one of the following five layers whose explana-
tion is organized in a descending degree of relatedness: The fifth layer, with the highest
degree of relatedness, is used for trademark pairs where both trademarks are identical.
The fourth layer regards pairs where one trademark as a separate word is fully included
in the other one if and only if the other trademark begins with that word, e.g., Roche and
Roche Cardiac. The third layer concerns pairs where one trademark as a separate word
is fully included in the other one regardless of the position within the other trademark,
e.g., Panasonic and New Panasonic Special. The second layer refers to those pairs
where one trademark is fully included in the other one but not as a separated word, e.g.,
Sanostol and Multisanostol. The fifth layer does not require any common word or
syllable but instead requires the bigram metric to be ≥ 0.7, e.g., Sulagil and Soulagil
having a bigram metric of 0.97.
To illustrate the differences of this technique to others that seek to form groups in large
networks, the total number of possible connections is an interesting criterion. On
maximum, the technique used in this work establishes n – 1 connections given that the
portfolio consists of n trademarks. Establishing trademark families through relatedness
between trademarks aims at finding the preceding trademark that is most similar to the
new incremental trademark entering the portfolio. New trademarks are therefore either
connected to exactly one preceding trademark or connected not at all.33 <C>
33 This approach only produces robust results, however, if the relatedness observed within pairs of trademarks is unambiguous. If the assessment was ambiguous, one subsequent trademark would have to be linked to two or more preceding ones. The two-step approach of assessing relatedness outlined above turned out to have this characteristic: In all, 14,514 assessments of relatedness were performed,
- 31 -
This is in contrast to other approaches that seek to find clusters in networks by connect-
ing each node with multiple other nodes. Approaches of this kind would result in a
maximum of n(n – 1) / 2 connections.34 Because only very few studies dealt with
trademarks and their portfolios, I preferred to use the technique described above due to
its clarity and its replicability. Other approaches would add substantial complexity but
would not greatly alter the outcome. Moreover, regarding trademark filing strategies,
the approach used here complies with the suggestions set out by several researchers to
systematically assess order, directions, and chains of extensions (Dacin and Smith,
1994; Dawar and Anderson, 1994).
To summarize the technique of identifying trademark families used in this work, new
trademarks flowing into the portfolio are compared to all previously filed trademarks.
This process leads to new trademark families, the growth of existing families, as well as
a number of independent trademarks, which are not connected to any preceding trade-
mark. A trademark family is thus defined as comprising at least two trademarks.35
After the last trademark has entered the portfolio, the outcome stage can be inspected.
Figure 2 presents the trademark families in the portfolio of the telecommunications
company Vodafone.36 In all, Vodafone filed 53 CTM applications. Of these, 19 applica-
tions were independent and 34 applications were grouped in three trademark families.
Note that Figure 2 only includes the trademarks arranged in families. As this figure
shows, the largest trademark family agglomerates around the trademark Vodafone. This
trademark family consists of 30 trademark applications. Each of the other two trade-
mark families (Intercare and Omnifin/Omniafin) accommodates two applications. As
arrows indicate successive filings and bold lines multiple filings on the same day, the
and the approach proposed potential 14,545 connections between trademarks. The difference between proposed connections and performed assessments is due to 31 assessments that had ambiguous out-comes as some incremental trademarks were proposed to be connected to two or more preceding trademarks because the bigram metric of the second step did not produce unique values among the pairs. The trademarks involved in this rather low amount of uncertain assessments (i.e., the share of ambiguous connections is 0.2% of all assessments) were therefore randomly connected to one of the proposed preceding trademarks.
34 If all pairwise combinations of, for example, four objects A, B, C, and D are formed, six assessments (= 4 ⋅ 3 / 2) are required: A and B, A and C, A and D, B and C, B and D, as well as C and D.
35 Independent trademarks exist for several reasons, which are not distinguished in this study. For example, an independent trademark may singularly protect a brand or it protects a slogan in advertis-ing. In both examples, the trademark is not related to others in the portfolio.
36 For graphically depicting the trademark families in this and the following figures, the program Cytoscape was used.
- 32 -
development of this brand can be assessed.37 Various subsequent filings made explicit
reference to the trademark Vodafone. Some of these clearly extended the parent trade-
mark, e.g., Vodafone Hotspot. Others used the parent trademark without changing the
text. This can be interpreted as modernizing or extending the parent trademark depend-
ing on the target product class of the new filing. Vodafone Live is also an interesting
trademark. It clearly followed the parent trademark Vodafone. Instead of filing just one
application, however, Vodafone filed four applications including the same text on the
same day as indicated by the bold lines.38 In all, this figure suggests that Vodafone has a
rather developed umbrella brand.
<INTEXT>[TOT-GRPH-TMP-VOD]<>
Figure 2: Trademark Portfolio of Vodafone
(53 TMs in portfolio, thereof 34 TMs in 3 families. 19 independent TMs not displayed.)
37 Note that the lengths of the connections vary only in order to display the trademarks in the best possible way. There is no additional interpretation of this.
38 Three of these filings are figurative and differ in the way they are graphically represented. The fourth filing is a word mark.
- 33 -
Figure 3: Trademark Portfolio of Microsoft
(A) Detailed view
MICROSOFT
WINDOWS
NAVISION
MSN
XBOX
(B) Overview(367 TMs in portfolio, thereof 160 TMs in 49 families. 207 independent TMs not displayed.)
<INTEXT>[TOT-GRPH-TMP-MSFT]<>
Figure 3 shows the trademark portfolio of Microsoft. In this figure, panel (A) shows a
portion of the trademark portfolio in detail while panel (B) provides an overview
perspective. I highlight this distinction as company portfolios are presented below
which are too large to be shown in detail. Microsoft filed 367 trademark applications, of
which 207 were independent and 160 were grouped into 49 families. This trademark
portfolio shows that Microsoft has families of various sizes. Apparently, Microsoft’s
corporate brand makes up the largest trademark family. Other large families are grouped
around the operating system Windows, its enterprise resource planning software for-
merly known as Navision and its video game console Xbox. Figure 3 also shows how
- 34 -
Microsoft filed trademarks both to create new brands and to further develop them
through the filing of subsequent trademarks.
Figure 4 and Figure 5 show trademark portfolios of other companies in various indus-
tries: Deutsche Telekom operating in telecommunications, BASF producing chemicals,
Unilever producing food and consumer goods, Pfizer operating in pharmaceuticals, and
Philips mainly producing electronics.39 The variety of trademark portfolios both in size
and structure suggests that these companies employed different trademark filing strate-
gies. Most companies developed certain larger core trademark families in addition to
numerous smaller ones. With some companies, the corporate brand is protected by the
largest trademark family in their portfolios (e.g., Deutsche Telekom40, Pfizer, Microsoft,
and Vodafone). With others, product-oriented brands are protected by more trademarks
than the corporate brand (e.g., BASF and Unilever). Manufacturers of consumer goods
such as Unilever rely on multiple strong brands applied to their products (Blichfeldt,
2005). A main reason for such fundamental differences in trademark portfolios are
companies’ business models and their industries, which lead them to emphasize differ-
ent trademark filing strategies. Interestingly, the graphical depiction of Philips’ trade-
mark portfolio (see Figure 5) understates the number of applications Philips has filed.
Philips filed 234 trademarks, of which only 20 are included in trademark families; the
remaining 214 are independent applications. Philips files trademarks that are less related
to each other than those filed by other companies like Deutsche Telekom or Vodafone. A
reason might be that Philips uses its corporate brand to label its products and also new
trademarks that are not associated with existing brands.
39 Deutsche Telekom, having one of the largest trademark portfolios, filed 797 trademark applications, of which 482 are contained in 137 families (see Figure 4). BASF, with 676 trademark applications, ac-commodates 174 of them in its 61 trademark families (see Figure 4). Unilever, having filed 348 trademarks, holds 193 applications in 53 families (see Figure 4). Pfizer filed 584 applications, of which 148 are included in 59 families (see Figure 5). Philips filed 234 applications, of which 34 are contained in 14 families (see Figure 5).
40 The trademark family Telekom also includes all trademarks related to the corporate brand Deutsche Telekom.
- 35 -
Figure 4: Trademark Portfolios of Deutsche Telekom, BASF, and Unilever
TELEKOM T-CARD CALL GONET
T-MEDIA THE ONE T-INTRA T-BUSINESSCALL
SICO
BASO
STYRO
TAMOL
BASF
LURAN
(C) Unilever(348 TMs in portfolio, thereof 193 TMs in 53 families. 155 independent TMs not displayed.)
(B) BASF(676 TMs in portfolio, thereof 174 TMs in 61 families. 502 independent TMs not displayed.)
(A) Deutsche Telekom(797 TMs in portfolio, thereof 482 TMs in 137 families. 315 independent TMs not displayed.)
CIF
SUN
AXE
BERTOLLI
LIPTON
BEN AND JERRYS
LUX
<INTEXT>[TOT-GRPH-TMP-MISC1]<>
- 36 -
Figure 5: Trademark Portfolios of Philips and Pfizer
PROMETHEAN ACTIVBOARD
PHILIPS
ENGAZE
DUODIAGNOST
INTELLIGENT AQ
MICROGELS
PFIZER
NEURONTIN
VIAGRA
OPOVASC
TARGIT
(A) Philips(234 TMs in portfolio, thereof 34 TMs in 14 families. 200 independent TMs not displayed.)
(B) Pfizer(584 TMs in portfolio, thereof 148 TMs in 59 families. 436 independent TMs not displayed.)
<INTEXT>[TOT-GRPH-TMP-MISC2]<>
Both the order and direction of developing brands are important for corporate brand
management (Dawar and Anderson, 1994). Families of various sizes as well as many
independent trademarks emerge as a result of different brand management strategies.
Table 1 shows how all 57,370 applications that were filed by 2,289 companies were
grouped into families. 36,740 trademark applications (64%) were independent. The
other 20,630 trademark applications (36%) were grouped into 6,146 families of varying
sizes. About two thirds of the families consisted of only two trademark applications
(13.8% of all trademark applications). Approximately one third of the families com-
prised 3 to 15 applications, representing 17.3% of all applications. 98 families had a size
of 16 trademark applications or more, making up 4.8% of all applications.
I argue that brands are represented by trademark families. This is reasonable since the
inclusion in a trademark family by the criteria used here requires inherent relatedness
between the trademarks of a family. This relatedness allows consumers to transfer the
reputation between products that may carry different but related trademarks. Companies
thus intentionally use the relatedness of their trademark filings as the basis of informa-
tional leverage, which triggers spillover effects. Assuming that each product is sold
under one main brand, these spillover effects mostly happen within the trademark
family of that brand and are far less likely to happen between trademark families. This
leads to another interesting interpretation of Table 1. It shows the distribution of the
- 37 -
number of trademark applications on which companies build their brands. Trademarks
form the legal basis for the differentiating power of brands (Phillips, 2003). Estimates of
the number of ‘legal roots’ a brand might have, however, do not exist. Table 1 therefore
provides some insights into the legal backing of brands.
>100 0 0 0.0% Families 6,146 Trademarks in families 20,630 36.0% Independent trademarks 36,740 64.0% Total 57,370 100.0%
<INTEXT>[TOT-FAMSIZE-TMF]<>
To provide further insights into companies’ trademark families, Table 2 shows the 30
largest trademark families. It reports the family size, the company’s portfolio size, and
the share that this family takes in the portfolio. In the dataset, MasterCard holds the
largest trademark family consisting of 99 trademark applications to protect the name of
its credit card. The importance of this product to the company is highlighted by the
share of 51.8% that this trademark family has in the company’s total portfolio of 191
trademark applications. Another large trademark portfolio is owned by the car manufac-
turer DaimlerChrysler, which uses the word Class to name numerous car models. This
trademark family comprises 92 applications and covers 12.3% of the total portfolio of
749 applications. Other large families are Nissan (68 applications representing 36.4% of
the total portfolio), Time (67 applications, 33.3%), and MTV (66 applications, 21.5%).
The share of the family in the total portfolio (i.e., the percentage values) is an interesting
measure that highlights the importance of the family in the total portfolio. It also
- 38 -
Table 2: The 30 Largest Trademark Families
Rank Name of trademark family
Family size
% of portfolio
Company
Country
Portfolio size
1. MASTERCARD 99 51.8% MasterCard Incorporated US 191 2. CLASS 92 12.3% DaimlerChrysler AG Germany 749 3. NISSAN 68 36.4% Nissan Motor Co., Ltd. Japan 187 4. TIME 67 33.3% Time Warner Inc. US 201 5. MTV 66 21.5% Viacom, Inc. US 307 6. SMIRNOFF 61 16.5% Diageo plc UK 369 7. INTEL 58 64.4% Intel Corp. US 90 8. DEUTSCHE POST 47 28.8% Deutsche Post AG Germany 163 9. KLASSE 44 5.9% DaimlerChrysler AG Germany 749 10. EMBRAER 44 34.9% Embraer SA Brazil 126 11. PAMPERS 43 5.2% The Procter & Gamble Company US 827 12. GAP 42 39.3% The Gap Inc. US 107 13. COVISINT 42 16.4% Ford Motor Company US 256 14. ESTEE LAUDER 40 28.2% The Estee Lauder Companies Inc. US 142 15. SKY 40 81.6% British Sky Broadcasting Group plc UK 49 16. HONDA 39 25.7% Honda Motor Co., Ltd. Japan 152 17. UPS 36 46.2% United Parcel Service, Inc. US 78 18. FORD 35 13.7% Ford Motor Company US 256 19. PEPSI 35 17.4% PepsiCo, Inc. US 201 20. AVON 34 42.5% Avon Products, Inc. US 80 21. QUAM 33 30.6% Telefonica SA Spain 108 22. PALMOLIVE 33 25.6% Colgate-Palmolive Company US 129 23. UPM 33 75.0% UPM-Kymmene Corp. Finland 44 24. FUJIFILM 32 16.8% Fujifilm Holdings Corp. Japan 191 25. VIRGIN 32 39.0% Virgin Media Inc. US 82 26. NIVEA 30 20.1% Beiersdorf AG Germany 149 27. COLGATE 30 23.3% Colgate-Palmolive Company US 129 28. VODAFONE 30 56.6% Vodafone Group plc UK 53 29. PANTENE 28 3.4% The Procter & Gamble Company US 827 30. SHELL 27 13.6% Royal Dutch Shell plc Netherlands 198
<INTEXT>[TOT-TOP-TMF]<>
- 39 -
provides insights into the concentration of a company’s trademark portfolio.41 Among
the 30 largest trademark families, this percentage measure exhibits large variation.
Procter & Gamble, for example, has two trademark families ranking among the top 30,
Pampers (43 applications) and Pantene (28 applications). Despite the size of these
families, their portfolio shares are rather low (5.2% and 3.4%). This is in contrast to
Intel, whose trademark family protecting its corporate brand appears to have one of the
highest percentage measures in Table 2. This also leads to another noteworthy insight.
Like approximately two-thirds of the companies in Table 2, Intel also protects its
corporate brand with a large trademark family. As the congruence between family name
and company name indicates, only about one third of the families in Table 2 protect
brands that are unrelated to their corporate name. This adds to the importance of corpo-
rate brands (Aaker, 2004b; Rao et al., 2004). It is also consistent with the observation
that the typical industrial brand is the name of the company (Webster and Keller, 2004).
Table 3 reports the 30 largest trademark portfolios along with some characteristics of
the portfolio structures. Konami, a Japanese electronics manufacturer has the largest
portfolio with 1,401 trademarks. Procter & Gamble (827 filings) and Deutsche Telekom
(797 filings) have the second- and the third-largest portfolios. The number of total
applications in the portfolio of company i, TMi, can be split into trademarks of different
types:
iiii TMDTMCTMITM ++= . (1)
TMIi is the number of independent trademark applications, which are not linked to a
trademark family. TMCi is the number of those trademark applications that initiate a
particular trademark family and to which subsequent trademark applications are con-
nected. Thus, I argue that they refer to the brand creation efforts of a company. Finally,
TMDi is the number of applications that enlarge and develop existing trademark fami-
lies. Therefore, I argue that these trademark filings reflect a company’s brand develop-
ment efforts.
41 Note that this measure is not to be interpreted as the concentration or the distribution of a company’s sales or its business activities.
- 40 -
Table 3: The 30 Companies with the Largest Trademark Portfolios
Brand-creating TMs (TMCi); # of families including …
Brand-developing TMs (TMDi)
Rank Company
Country
Portfolio
size (TMi)
Inde-pendent
TMs (TMIi)
2-5 TMs
6-15 TMs
16-25 TMs >25 TMs # of TMs %
1. Konami Corp. Japan 1,401 1,042 135 5 0 0 219 15.6% 2. The Procter & Gamble Company US 827 357 85 18 0 2 365 44.1% 3. Deutsche Telekom AG Germany 797 315 121 14 2 0 345 43.3% 4. DaimlerChrysler AG Germany 749 358 44 11 2 2 332 44.3% 5. BASF SE Germany 676 502 59 0 2 0 113 16.7% 6. Sony Corp. Japan 623 363 76 7 1 0 176 28.3% 7. GlaxoSmithKline plc UK 617 395 81 3 0 0 138 22.4% 8. L’Oréal France 592 452 42 1 1 0 96 16.2% 9. Pfizer Inc. US 584 436 58 1 0 0 89 15.2% 10. Novartis AG Switzerland 559 400 61 0 0 0 98 17.5% 11. General Electric Company US 474 380 34 2 0 0 58 12.2% 12. Syngenta AG Switzerland 430 312 49 2 0 0 67 15.6% 13. International Business Machines Corp. US 394 265 32 5 0 0 92 23.4% 14. Diageo plc UK 369 146 42 4 1 1 175 47.4% 15. Microsoft Corp. US 367 207 45 3 1 0 111 30.2% 16. Bristol Myers Squibb Co. US 358 232 48 1 0 0 77 21.5% 17. Unilever NV Netherlands 348 155 46 6 1 0 140 40.2% 18. Altana AG Germany 313 228 29 2 0 0 54 17.3% 19. Hewlett-Packard Company US 309 192 44 2 0 0 71 23.0% 20. Viacom, Inc. US 307 138 37 2 0 1 129 42.0% 21. Volkswagen AG Germany 292 178 33 0 0 1 80 27.4% 22. Schering-Plough Corp. US 291 221 23 1 0 0 46 15.8% 23. Bayer AG Germany 282 222 25 1 0 0 34 12.1% 24. AstraZeneca plc UK 280 203 24 2 0 0 51 18.2% 25. Abbott Laboratories US 278 184 33 2 0 0 59 21.2% 26. Saint-Gobain SA France 272 206 24 1 0 0 41 15.1% 27. Sanofi-Aventis SA France 271 201 25 2 0 0 43 15.9% 28. Eli Lilly & Co. US 270 139 39 4 0 0 88 32.6% 29. Medtronic, Inc. US 263 174 30 0 1 0 58 22.1% 30. Ford Motor Company US 256 110 14 4 0 2 126 49.2%
<INTEXT>[TOT-TOP-TMP]<>
- 41 -
Table 3 includes these portfolio characteristics. Procter & Gamble, for instance, filed
827 trademark applications (TMi), of which 357 were independent (TMIi). Of the
remaining applications, 105 initiated trademark families (TMCi) and 365 were filed to
develop existing families (TMDi). Note that Table 3 splits TMCi into various classes. Of
the 105 applications initiating trademark families, 85 have been developed to families
with a size of two to five trademark applications. 18 of those family-initiating trade-
marks subsequently developed into families with 6 to 15 applications, and two of these
trademarks initiated families with more than 25 applications.
As the trademarks that a company filed can be differentiated according to their roles,
Table 3 leads to some initial insights into companies’ trademark filing strategies. Still, a
thorough assessment of these strategies is not possible without a more detailed
categorization of the role trademarks take within their family. The next section goes
further in this direction in that it thoroughly reveals the trademark filing strategies that
formed the families which were identified in this section.
3.4 Trademark Filing Strategies
The development of trademark families discussed in the previous section did not reveal
how the development of the families proceeded. The way in which these families were
developed depends on the particular filing strategies employed. In order to discriminate
between these strategies, different roles of trademarks need to be identified. To examine
companies’ trademark filing strategies, it is therefore important to assess the role of
each trademark application.
<INTEXT>Völckner and Sattler, 2007<>
To distinguish between various trademark roles that develop existing brands, I draw on
the characteristics that the connection between two trademarks exhibits. Based on these
characteristics, for example, the ‘fit’ of the extension can be explored, which has been
found to be an important factor (e.g., Aaker and Keller, 1990; Keller and Aaker, 1992;
Reddy et al., 1994; Smith and Park, 1992; Völckner and Sattler, 2006, 2007). To
characterize the connection between two trademarks, I employ two dimensions: the
linkage dimension and the market coverage dimension. The linkage dimension concerns
the connection between two trademarks in a family, including similarity and filing
sequence. The market coverage dimension comprises the congruence of the product
classes covered by each trademark. Figure 6 summarizes the roles that a newly filed
trademark can take in the portfolio. Note that the linkage dimension and the market
- 42 -
coverage dimension are not mutually exclusive. Each trademark developing a brand
takes two characteristics informing about its role: The first characteristic is given by the
linkage dimension, the second by the market coverage dimension.
The linkage dimension concerns the connection between two trademark applications.
This dimension is based on two factors. The first factor, filing sequence, refers to the
elapsed duration between both applications. This distinguishes between trademark
filings that were brought to the OHIM on the same day and those that were filed succes-
sively. The second factor is related to the content of both trademarks and refers to the
degree of trademark similarity. This allows discriminating between a trademark ‘up-
date’, where the texts of both trademarks are identical, and a trademark extension,
which refers to a slightly altered trademark text (e.g., Vodafone and Vodafone Live).
The process of determining the linkage dimension and deriving a specific trademark
role is illustrated in Figure 7. Recall that a bold line represents simultaneous filings and
an arrow reflects successive filings. I argue that the linkage dimension reveals three
roles that a developing trademark can take. For the purpose of this study, these roles
were named as follows: First, the linked trademark can take the role of a penetrating
trademark if both trademarks are filed on the same day and, additionally, the texts of
- 43 -
both trademarks are equal.42 Penetrating trademarks occur if a company seeks to protect
very similar signs through multiple simultaneous filings. This might be necessary for
strongly protecting a brand, for example, through multiple slight variations of the same
logo containing equal content. Second, a trademark is a retaining trademark if it is filed
subsequently and has the same content. For instance, trademark filings with equal
content at different points of time are observed if a company redesigns its logo or
otherwise updates it. Basically, retaining trademarks keep the content of an older
trademark but adjust it or develop it further. Third, a refining trademark refers to
trademarks in which the content is similar but not equal to a preceding one regardless of
the duration between the two filings. A refining trademark uses the parent trademark
and adjusts its content. This is typical for extensions where the parent brand is extended
to a new brand to accommodate a new product introduction. Here, the new trademark is
tailored for the new product but the new product is still put under the ‘umbrella’ of the
parent brand. An example of this is Toyota Yaris and Toyota.
Figure 7: Linkage Dimension
VODAFONE VODAFONE
VODAFONE VODAFONE
VODAFONE VODAFONELIVE
Penetrating trademark
Retaining trademark
Left column: base trademark
Right column: linked trademark
VODAFONE VODAFONELIVE
Refining trademark
Successive filings (arrow) or filings at the same time (bold line)
The market coverage dimension relates to the congruence of the product classes of two
connected trademarks. For example, if a brand is extended to a new product category,
the company aims at leveraging its existing brands. New markets can be entered by
applying an established brand to a new product. Researchers have highlighted the
importance of the targeted product class and its relation to the product class of the
42 Note that equal texts do not necessarily imply equal trademarks, for example, if two similar logos or images include equal texts.
- 44 -
parent brand in determining the success of such extensions (Dacin and Smith, 1994;
Lane, 2000; Pepall and Richards, 2002).
With trademark data, the congruence between two successively filed trademark applica-
tions can be assessed according to the product classes to which each application is
assigned. These product classes are set out by the Nice Classification and span 34 goods
and 11 service classes (Mendonça et al., 2004; WIPO, 2006). When filing a trademark,
the applicant specifies the Nice classes in which he wishes to gain protection for. The
applicant can choose any combination of Nice classes. He can even specify all 45 Nice
classes.43 However, the OHIM might reject this ambition and limit the Nice classes
during the examination process (European Council, 1993, Art. 38).44 Comparing the
product classes affiliated with two connected trademarks allows one to measure the
market-related congruence between both trademarks.45 Assume that a trademark has
been filed, for example, in the Nice classes 2, 3 and 4. This set of Nice classes makes up
the benchmark against which a subsequent trademark filing is compared. If the subse-
quent trademark filing is, for example, affiliated with Nice classes 1 through 5, it is
reasonable to argue that this subsequent filing is broadening the company’s originally
covered product classes (see Figure 8).
Comparing the overlap between the Nice classes of two trademarks leads to five differ-
ent roles which, for the purpose of this study, were named as follows (see Figure 8).
First, the subsequent filing can take the role of a preserving trademark if its set of Nice
classes is identical to the preceding trademark. In this case, the market scope is not
altered through the new trademark filing. Second, if the subsequent trademark applica-
tion has only a subset of the Nice classes of the preceding trademark, it takes the role of
a narrowing trademark. Here, the market scope decreases with the new filing. The third
role is that of a broadening trademark, which includes additional product classes when
compared to the preceding filing. Here, the market scope clearly increases. The fourth
role is a differentiating trademark, which is affiliated with some of the preceding Nice
43 The CTM No. 2977569 (Nestlé) is an example affiliated with all 45 Nice classes. 44 A trademark might not be registrable for all kinds of goods and services. The trademark Apple, for
example, is a generic term when applied to food and is thus not registrable in this product class. How-ever, it is registrable for computers and consumer electronics because it is not generic for these prod-ucts.
45 Note that, due to revisions of the Nice Classification, only 42 classes could be considered until the end of 2001. Thereafter, 45 classes were considered.
- 45 -
classes but also adds new ones. Finally, the fifth role is a diversifying trademark, which
has no Nice classes in common with its preceding trademark.
Figure 8: Market Coverage Dimension
2, 3, 4 2, 3, 4
2, 3, 4 2, 3
Preserving trademark
Narrowing trademark
Enlarging market coverage:
Non-enlarging market coverage:
2, 3, 4 1, 2, 3, 4, 5
2, 3, 4 4, 5
2, 3, 4 5, 6
Broadening trademark
Differentiating trademark
Diversifying trademark
Nice classes of trademark
The approach described above helps to analyze the development of a company’s brands,
which might happen both within and beyond the original product classes. The market
coverage dimension provides insights in which direction a company develops its brands.
Both the linkage dimension and the market coverage dimension allow a characterization
of those trademarks that develop brands. As the dimensions are not mutually exclusive,
they can be combined as illustrated in Figure 9. More important, combining the linkage
dimension with the market coverage dimension allows one to trace how companies
develop brands through trademark filing strategies. Concerning the development of
brands, I argue that the trademark filing strategies hedging, modernizing, and extending
can be identified through these two dimensions.
- 46 -
Figure 9: Identifying Hedging, Modernizing, and Extending Strategies
Non-enlarging coverage
Enlarging coverage
Preserving trademarks
Narrowing trademarks
Broadening trademarks
Differentiating trademarks
Diversifying trademarks
Mar
ket
cove
rag
e d
imen
sio
n
Penetratingtrademarks
Retainingtrademarks
Refiningtrademarks
Linkage dimension
Hedging
ModernizingExtending
(Line)
Extending (Brand)
Hedging as a trademark strategy has not yet been explained in this study. This strategy
refers to the case where a company files multiple highly related trademark applications
on the same day in order to strongly protect various facets of a brand. This strategy
involves solely penetrating trademarks. What primarily distinguishes this strategy from
the others is that here, simultaneous filings occur so that informational leverage is
unlikely to be employed.
Modernizing as a trademark filing strategy is characterized by two conditions. First, the
market scope is not broadened. Second, trademarks are filed gradually but still exhibit
great similarities compared with preceding trademarks. This trademark filing strategy
can be assessed based on those trademarks that take both the role of retaining trade-
marks and that of preserving or narrowing trademarks.
Extending as a trademark filing strategy can be identified in two ways. First, trademarks
that are related but not identical indicate extensions. This includes examples like Coke,
Diet Coke, and Cherry Coke (Aaker and Keller, 1990; Reddy et al., 1994). Second,
enlarging market coverage also represents extensions. This complies with the literature
where entering new market segments is the key feature of brand extensions (Aaker and
Keller, 1990; Reddy et al., 1994). To accommodate both of these aspects, I argue that
trademarks which enlarge the market coverage (broadening, differentiating, and diversi-
fying trademarks) and which are filed subsequently (retaining and refining trademarks)
reflect extending strategies. More specifically such a filing is likely to reflect a brand
extension. However, trademarks that do not enlarge the market coverage (preserving
- 47 -
and narrowing trademarks) can still reflect an extending strategy but only if the kind of
linkages between the trademarks support it (refining trademarks). In this case, it is
reasonable to assume that the filing reflects a line extension.46
Using this approach to categorize the trademarks in company portfolios allows studying
to what extent companies employ different trademark filing strategies. Table 4 illus-
trates this decomposition not only for the total trademarks covered by the companies in
the sample but also for several corporate portfolios. 75.2%47 of all trademarks that
develop already existing brands can be traced back to extending strategies. Based on the
categorization above, approximately half of these reflect line and half brand extensions
(51% vs. 49%). Trademark filings based on hedging strategies have been employed
nearly as frequently as modernizing strategies (10.7% vs. 14.1%). However, both
hedging and modernizing strategies are less frequent than extension strategies.
Regarding the trademark filing strategies of specific companies, Table 4 shows that
Deutsche Telekom to a substantial degree used hedging strategies to protect its brands: It
rather frequently filed simultaneous applications for very similar trademarks. This is in
contrast to Unilever which, to a large extent, used modernizing strategies. Unilever, like
Pfizer and BASF, also engaged in trademark activities that preserved or narrowed its
market scope. This is different from other companies such as Vodafone, Microsoft, or
Deutsche Telekom which largely filed trademarks to broaden their market scopes.
To summarize, the identification of trademark families allows scrutinizing how compa-
nies seek to protect their brands through trademark filings. This led to the distinction
between trademarks that create brands and trademarks that develop brands. To examine
more precisely the strategies companies employ to develop their brands, the trademarks
were characterized according to their roles. In turn, the frequencies of these roles
allowed determining which trademark filing strategies were employed by companies.
Table 5 provides a summary of the four trademark filing strategies that have been
identified: creating, hedging, modernizing, and extending brands.<C>
46 If the linkages between the trademarks suggest a high similarity (which means identical texts), the trademark filing strategy is however not extending but modernizing.
47 Dividing the number of extending trademarks (10,896) by the number of brand-developing trademarks (14,484) yields 75.2%.
- 48 -
Table 4: Companies’ Trademark Filing Strategies
Total Vodafone Microsoft Deutsche Telekom BASF Unilever Philips Pfizer
– Protect newly created brands (e.g., for quality consistency reasons, new products or new product lines)
– Trademarks that initiate a family, which is subsequently developed by the filings of at least one other trademark
Hedging brands
– Protect different facets and appearances of a brand
– Seek strong protection of a brand through filing of multiple slight variations of a sign
– Trademarks in families that (1) are filed on the same day as their connected trademark and (2) exhibit very similar trademark content as measured by identical texts
Modernizing brands
– Maintain the protection of an existing brand, whose trademarks need to be updated from time to time
– Protect the differentiation potential of an existing brand
– Conserve an existing brand as a powerful platform for future extensions
– Trademarks in families that (1) are filed subsequently to their connected trademark, (2) exhibit very similar trademark content, as measured by identical texts, and (3) do not enlarge the market coverage
Extending brands
– Extension as a mechanism of informational leverage since consumers correlate the expectations they have about products that carry the same brand
– Use existing brand for launching new products in familiar (line extension) or new markets (brand extension) to raise advertising efficiencies and increase the success of new product introductions
– Trademarks in families that (1) are filed subsequently to their connected trademark, (2) exhibit very similar trademark content as measured by identical texts, and (3) enlarge the market coverage
– Trademarks in families that (1) are filed subsequently to their connected trademark and (2) exhibit trademark content of lower similarity
In the next section, I will present the market value approach and outline how the market
value equation connects trademark filing strategies and company values.
- 50 -
4 The Market Value Approach
In this section, I explain the market value approach and present how other work has
used this approach to measure the value contribution of intangible assets. I then describe
how this model can be used to assess the valuation of different trademark filing strate-
gies. Finally, I derive a form of the market value equation that can be empirically
estimated using an NLLS regression framework.
The key characteristic of the market value approach is that it uses the market value of a
company – observed in financial markets – as a forward-looking performance measure
and relates it to both the tangible and the intangible assets a company owns (Hall, 2000;
Hall and Oriani, 2006; Hall et al., 2007). It seeks to assess the contribution of each asset
class to the market value of a company. Using the market value of companies as a
forward-looking performance measure builds upon the theoretical and empirical founda-
tions of the efficient markets literature (Fama, 1970; Ross, 1983). Under the efficient
market hypothesis, the stock price provides the best available unbiased estimate of the
value of a company because it accurately reflects currently available information about
future cash flows.
Basically, the market value approach assumes that the company is a bundle of both
tangible and intangible assets that are treated symmetrically in the market value equa-
tion. The market value approach applies the idea of hedonic price models that seek to
decompose the price of a good according to its characteristics. The price of a company
is the company value derived from the price at which its stocks trade. As company
characteristics, tangible assets and intangible assets are considered. The market value
approach then allows one to estimate the relative contribution of several asset categories
to the company value. To examine brand assets in this study, I use characteristics
derived from companies’ trademark portfolios. Since the way in which companies have
built their brands is reflected in their trademark filing strategies, this allows an assess-
ment of the contribution of different trademarks and their filing strategies to company
values.
Tangible assets can be derived from companies’ accounting data (Lindenberg and Ross,
1981; Montgomery and Wernerfelt, 1988). Yet, accounting struggles with the determi-
nation of the value of intangible assets (Lev, 2001). Researchers have still been able to
- 51 -
estimate the value of intangible assets by relying on the market value approach.
Hirschey and Weygandt (1985) found that both R&D and advertising expenditures are
important factors in determining companies’ market value although both are normally
not reported as assets in the balance sheet.48 Other research has confirmed that finding
(e.g., Hall, 1993a). For example, accumulated R&D investments or patents have been
used to assess the value of knowledge assets (Hall et al., 2005; Hall et al., 2007), and
brand assets have been assessed employing measures derived from advertising expendi-
tures (Connolly and Hirschey, 1988; Hall, 1993b; Hirschey and Weygandt, 1985;
Villalonga, 2004) or trademarks (Bosworth and Rogers, 2001; Greenhalgh and Rogers,
2006a, 2006b). The market value approach assumes that a company is able to choose
between different asset classes to invest in. Different tangible and intangible asset
classes are treated additively and symmetrically in the market value equation (Hall and
Oriani, 2006). A company may invest, for example, in intangible assets such as knowl-
edge assets to develop innovative high-quality products, or it may invest in advertising
to foster its brand assets.
Various studies have shown that brand assets are associated with the company value or
its stock price (e.g., Barth et al., 1998; Kallapur and Kwan, 2004; Lane and Jacobson,
1995; Rao et al., 2004; Rao and Bharadwaj, 2008; Simon and Sullivan, 1993). There are
two main linkages between brands and future cash flows that may influence investors’
expectations (Smith and Park, 1992). The first linkage concerns the brand’s contribution
to the success of existing products. This, for example, includes cash flows generated
from brand-related price premia, the loyalty of existing customers, or the potential to
attract new customers. The second linkage refers to the potential of a brand to launch
new products, meaning that revenue streams may originate from the extension of the
brand to new products in both familiar and new markets.
<INTEXT>Hirschey and Weygandt, 1985; Greenhalgh and Rogers, 2006b<>
Research has confirmed the contribution of different types of intangible assets to
companies’ market valuation. It is thus reasonable to consider both kinds of intangible
assets: knowledge assets and brand assets. As set out in Equation 2, the market value
equation assumes that the value of a company can be traced back to the sum of a
48 Under particular conditions, R&D and advertising expenditures may be capitalized in balance sheets: If, for example, a company which has conducted R&D and advertising is acquired, its company value which also includes intangible assets can be capitalized in the balance sheet of the buying company.
- 52 -
company’s different assets (Griliches, 1981). In other words, it is assumed that the
company literally is the sum of its components. This results in
where Vi is the value of company i and Ai represents its physical assets. Knowledge
assets are represented by RDi, which are measured by a company’s R&D investments
(Hall, 1993a, 1993c; Hall and Oriani, 2006; Jaffe, 1986; Johnson and Pazderka, 1993).
Brand assets are included through a company’s advertising investments ADVi and its
trademark portfolio TMi.49 qi is a valuation coefficient that includes an individual
disturbance in the valuation, ui, as well as overall valuation effects such as differences
in valuations regarding country k, and industry l. These country- and industry-specific
valuation effects are shown by ck and ml, respectively. As returns to scale are measured
by σ, a value of unity indicates constant returns to scale. Values exceeding unity
indicate economies of scale and values below unity diseconomies of scale.
<INTEXT>Hall, 1993b<>
Based on the marginal values γ, the contribution of the different asset classes to the
company value can be derived both as relative shadow values referring to physical
assets or as absolute shadow values referring to companies’ market values (Hall, 1993b;
Hall and Oriani, 2006). It is important to note that, since these shadow values are
equilibrium outcomes in financial markets, they cannot be interpreted as structural
parameters (Hall, 2000; Hall and Oriani, 2006). These values emerge as companies
provide investment opportunities and investors evaluate these companies based on their
future performance potential. Investors take action by buying or selling company shares
so that the stock price as an aggregate measure changes and, with it, the market value of
the company. Given that σ is unity, qiγADV is the absolute shadow value of advertising
investments. That is, it indicates how one additional unit invested in advertising con-
tributes to the company value from the perspective of investors. γADV is the relative
49 Note that RDi and ADVi are monetary measures and that TMi reflects the portfolio size of the com-pany’s trademark portfolio. Note also that all three measures of intangible assets are stock variables (as opposed to flow variables). Thus, they do not only include the recent year, as would be the case with flow variables, but are also driven by previous years.
- 53 -
shadow of one additional unit spent on advertising measured in terms of physical assets
but it does not reflect investors’ expectations. Analogously, qiγTM is the absolute shadow
value of trademarks indicating the contribution of one trademark to the company value
from an investor’s perspective. Then, γTM is the relative shadow value of trademarks
indicating the value of one trademark in terms of physical assets.
Having presented the market value equation on a general level, I now further develop
this equation in order to arrive at a form that not only can be empirically estimated but
also accommodates the characteristics of trademark portfolios as measures that reflect
<INTEXT>Simon and Sullivan, 1993; Hall et al., 2007<>
++++−+=
i
iTM
i
iADV
i
iRDii
i
i
A
TM
A
ADV
A
RDAq
A
V γγγσσ 1loglog)1(loglog . (4)
Here, Tobin’s q, the ratio of the market value of the company to the replacement cost of
the company’s assets, is represented by the fraction on the left side (Rao et al., 2004). If
the company value exceeds the value of its physical assets, Tobin’s q is larger than one.
Equation 4 clearly shows that, ceteris paribus, intangible assets as measured by their
intensities regarding physical assets can lead to a markup over physical assets. Simon
and Sullivan (1993), for example, use a similar approach to study brand assets.
In this work, I argue that the trademarks in a corporate portfolio have different roles and
hence contribute differently to a company’s market value. If trademarks in a corporate
portfolio can be decomposed into several groups, the contribution of each group of
trademarks to the company value can be assessed. Assuming that the trademarks of
company i can be decomposed into s groups leads to:
∑=
=s
jjii TMTM
1, . (5)
This allows us to write Equation 4 as
+−+= iii
i AqA
Vlog)1(loglog σ
+++ ∑
=
s
j i
ijjTM
i
iADV
i
iRD A
TM
A
ADV
A
RD
1
,,1log γγγσ . (6)
- 54 -
With Equation 6, different decompositions can be used and compared. Then, based on
their marginal values, the value contributions of different trademark types can be
assessed. For example, trademarks that created brands can be compared to independent
trademarks and to trademarks that developed already existing brands. I will draw upon
the decomposition of the trademark portfolio shown by Equation 5 when estimating the
market value equation. This allows assessing the relationship between trademarks that
reflect different filing strategies and brand assets.
Another feature of Equation 6 is that it provides a functional form that can be empiri-
cally estimated using regression techniques. Early research that applied the market value
approach used OLS regressions based on the approximation of log(1 + x) with x, which
is only sufficiently accurate for small values of x (Cockburn and Griliches, 1988;
Griliches, 1981; Jaffe, 1986). However, as NLLS regression techniques do not require
this approximation, they are superior to OLS in cases where the functional form is non-
linear as is the case with the market value equation. By specifying the functional form
of the regression equation during the estimation process, NLLS allows the estimation of
non-linear relationships between the dependent variable and the regressors. I follow
preceding work and employ NLLS for estimating the market value equation (Hall et al.,
2005; Hall et al., 2007). The next section describes the construction of the dataset used
in the estimations.
- 55 -
5 Dataset, Variables, and Descriptive Statistics
In this section, I describe the dataset, used to estimate the model developed in the
previous section. The final dataset includes accounting and financial data in addition to
the characteristics derived from companies’ trademark portfolios. I first explain how the
final dataset is constructed (Section 5.1). Then I describe the variables that enter the
empirical model (Section 5.2). Finally, I present descriptive statistics for the variables in
the dataset (Section 5.3).
5.1 Dataset
Accounting and financial market data were taken from the Compustat database50 and
from the Reuters database. The Compustat database provided companies’ market
capitalizations, total assets, total debts, and R&D expenditures. Since this database did
not contain companies’ advertising expenses, I supplemented the data obtained from
Compustat with the advertising expenses data from Reuters. The available trademark
data from the OHIM included all trademark applications until the end of 2004. All
trademark portfolio characteristics have been computed for that date. Due to the cross-
sectional nature of the dataset, I obtained companies’ market capitalization at the end of
2004 and took total assets and total debt as reported in companies’ balance sheets of
2004. As accumulated R&D and advertising investments enter the market value equa-
tion, a reliable computation of these R&D and advertising stocks ideally requires full
histories of annual R&D and advertising expenditures. Accordingly, all available R&D
and advertising expenditures from the income statements of 2004 and earlier were
obtained from Compustat and Reuters. To produce consistent Euro values, historical
currency rates were applied. In addition, although it was only necessary to compute
R&D and advertising stocks for 2004, the annual R&D and advertising expenditures
used for the computation of stocks also included earlier years, requiring an inflation
adjustment to arrive at consistent real 2004 prices.51
50 The Compustat database is provided by Standard & Poor’s. Precisely, the international data required in this study is offered by GlobalVantage, a license within Compustat.
51 To do this, the GDP price deflator available in Ameco, an annual macro-economic database provided by the European Commission, was used. Specifically, the item PVGD was used and re-indexed to 2004.
- 56 -
Corporate trademark portfolios could be built for 2,289 worldwide publicly listed
companies in the sample drawn from Compustat and Reuters. Some of these observa-
tions, however, included missing values and outliers, so they were removed to arrive at
a dataset that could be used for estimation. The exclusion of those observations that
contained missing values reduced the dataset to 1,841 observations. This loss can be
attributed to the computation of Tobin’s q, which required the components total assets,
total debt, and market capitalization. To identify outliers, the variables Tobin’s q, the
ratio of the trademark applications to assets, the ratio of the R&D stock to assets, and
the ratio of the advertising stock to assets were considered. For each of these variables,
the 1st and the 99th percentiles were computed. If one of the measures was outside the
boundaries given by these percentiles, the observation was dropped. The resulting
dataset comprised 1,735 observations.
5.2 Variables
Tobin’s q, the dependent variable in the market value equation, is computed by using
both accounting and financial measures since it is the ratio of the market value of the
company, V, to the replacement costs of the company’s assets, A (Rao et al., 2004). For
the replacement costs of the company’s assets, its total assets are used as reported on its
balance sheet. The market value of a company is the sum of the market capitalization,
MC, and the market value of its debt, MD. However, as the market value of a com-
pany’s debt is difficult to observe and estimate (DaDalt et al., 2003; Hall and Oriani,
2006), it is usually proxied by the total debt as reported on the balance sheet.52 Thus,
Tobin’s q is computed by adding up market capitalization and total debt (Compustat
item DT) and dividing this sum by total assets (Compustat item AT). The market
capitalization is the product of the number of outstanding shares (Compustat item
CSHO) and the price at which a company’s stock trades (Compustat item PRCCM). The
computation of Tobin’s q, regularly employed by other studies, is thus given by:
AT
DTPRCCMCSHO
A
MDMC
A
V +⋅≈+= . (7)
Advertising and R&D investments are symmetrically computed: Even though some
studies have simply employed annual R&D or advertising expenditures of the observa-
tion year (Greenhalgh and Rogers, 2006a; Simon and Sullivan, 1993), I follow other
52 The total debt is the sum of long-term debt and debt in current liabilities.
- 57 -
studies that sought to estimate R&D investments based on time series of annual expen-
ditures (Hall et al., 2005; Hall et al., 2007). The reason for this is that intangibles such
as knowledge assets or brand assets have usually not been produced only by the R&D
and advertising expenditures of the year when the market value was recorded. Instead,
intangible assets generally have accumulated over a longer period of time (Ross, 1983).
However, these R&D and advertising investments are not capitalized in companies’
balance sheets (Ross, 1983). Instead, such investments are largely treated as expendi-
tures and they are reported on companies’ income statements in the year of occurrence.
Hence, in order to estimate knowledge assets, researchers have used histories of R&D
expenditures as annual flow measures to compute R&D stocks. To do this, the so-called
declining balance formula with a constant depreciation rate, δ, has regularly been used
(e.g., Hall and Oriani, 2006; Hall et al., 2005; Hall et al., 2007).53 This formula allows
the computation of stock measures (RDt and ADVt) at time t based on past and present
flows ( flowtRD and flow
tADV ). Following others, I apply a depreciation rate of 15%. Due
to the depreciation rate, past expenditures will affect the stock less than present expendi-
tures. This is reasonable, as technological knowledge becomes obsolete over time and
brands need to be continually advertised to maintain their awareness. Thus, I compute
R&D and advertising stocks analogously:54
<INTEXT>Hall, 1990<> 1)1( −−+= t
flowtt RDRDRD δ (8)
and
1)1( −−+= t
flowtt ADVADVADV δ . (9)
Since infinite previous histories of expenditures demanded by Equations 8 and 9 are not
available, the initial stock for the first available observation year of expenditures needs
to be computed. Assuming that the expenditures have been growing at a constant annual
rate, g, of 8% prior to the observed time series of expenditures allows a computation of
these initial stocks:
flowRDg
RD 00
1
+=
δ (10)
53 For details regarding the declining balance formula see Hall (1990). 54 R&D expenditures were obtained from Compustat (item XRD) and advertising expenditures from
Reuters (item Advertising Expense).
- 58 -
and
flowADVg
ADV 00
1
+=
δ. (11)
Not all companies report R&D or advertising expenditures. In some cases, companies
do not perform any R&D or do not engage in advertising. In most countries, companies
may choose whether or not to disclose their R&D and advertising expenditures (Hall
and Oriani, 2006). The latter case needs to be addressed as companies’ deliberate choice
of disclosure might be strategically influenced, leading to biased estimates due to
sample selection. However, Hall and Oriani (2006) empirically found that a company’s
decision to publish R&D expenditures induced no sample selection bias. Following
other work, two dummy variables will capture the non-availability of R&D and adver-
tising stocks.55
The total number of trademark applications a company filed (i.e., the trademark stock)
can be decomposed into different groups. Depending on the affiliation with trademark
families, the trademarks in the total portfolio of company i, TMi, can be divided into
brand-creating trademarks, TMCi, brand-developing trademarks, TMDi, and independent
trademarks, TMIi:
iiii TMITMDTMCTM ++= . (12)
By definition, TMCi, the number of brand-creating trademarks, equals the number of
trademark families. Interesting insights into a company’s brand management can be
gained if these brand-creating trademarks are split into those that initiate smaller
families and those that initiate larger ones. As a cut-off value I use a family size of 15
applications, leading to brand-creating trademarks that induce smaller families of 15
trademarks or less, TMF1i, and brand-creating trademarks that initiate larger families of
16 trademarks or more, TMF2i. This decomposition is then given by:
iii TMFTMFTMC 21 += . (13)
55 Stocks will also be unavailable if the history of R&D or advertising expenditures is interrupted. That is because the declining balance formula requires histories of past and present flows to be continuous.
- 59 -
Brand-developing trademarks can be assigned to different filing strategies according to
their roles, which are determined by the ways in which the trademarks are embedded in
their families. Thus, TMDi, the number of company i ’s brand-developing trademarks,
can be decomposed into hedging trademarks, TMDHi, modernizing trademarks,
TMDMi, and extending trademarks, TMDEi. Each addend reflects a company’s empha-
sis on different developing strategies:
iiii TMDETMDMTMDHTMD ++= . (14)
A company’s extending trademarks, TMDEi, can be further divided according to the
mode of extension. Then, TMDEi is the sum of extending trademarks assumed to be
triggered by line extensions, TMDELi, and those assumed to be triggered by brand
extensions, TMDEBi:
iii TMDEBTMDELTMDE += . (15)
This decomposition provides insights into the different purposes for which trademarks
are filed. When integrated into the market value equation, these decompositions allow
an assessment of how different trademark roles are valued and which effects different
filing strategies have.
Finally, control variables capture country- and industry-specific valuation effects. The
industry classification of companies is based on SIC codes. Since no selection criteria
regarding industry membership were imposed in the selection of the sample, I basically
used the SIC division structure to categorize companies. The division structure provides
a basic categorization (e.g., ‘manufacturing’, ‘services’, ‘transportation, communica-
tions, and infrastructure’, ‘construction’). However, since there are many companies in
manufacturing, it was further distinguished between different areas within manufactur-
ing (e.g., ‘food and kindred products’, ‘chemicals’, ‘transportation equipment’, ‘instru-
ments for measuring, analyzing, and controlling’). Ultimately, this approach categorized
the companies into 31 industries, of which the largest category held 11.7% of all
observations (‘transportation, communications, and infrastructure’, see Table 7 dis-
cussed in the next section).
- 60 -
5.3 Descriptive Statistics
Descriptive statistics for the 1,735 observations in the dataset are reported in Table 6.
Tobin’s q is 1.2 on average. With values ranging from 0.26 to 4.83, a large variation in
company performance exists. A Tobin’s q value exceeding one indicates that the market
value of a company as a measure of aggregate investor expectations is higher than its
physical assets. One reason for this is that intangible assets also contribute to compa-
nies’ market value. As Tobin’s q is a compound of accounting and financial measures,
its components reflect the size of the companies. On average, market capitalization is
6,236.8 million Euros. Debt on average is 2,480.8 million Euros. The mean value of
total assets is 8,242.6 million Euros. As both the standard deviations and the ranges of
these measures show, the size of the companies varies to a large degree. The smallest
company exhibits total assets of only 53.3 million Euros while the largest company has
assets of 552.4 billion Euros.
As R&D expenditures were not available for each company, R&D stocks could not be
computed in 46.1% of all cases. For the remaining 935 companies, the average R&D
stock is 1,523.1 million Euros. Advertising stocks could only be computed for 434
observations representing 75% of all observations. Here, the mean is 1,229.9 million
Euros.
<INTEXT>[FIN-DS-TMP-CS]<>
Regarding trademark portfolios, companies on average filed 24.9 trademark applica-
tions. This measure ranges from 1 to 827 applications.56 The measures reflecting the
structure of trademark portfolios exhibit large heterogeneity. Independent trademark
applications made up the largest fraction of company portfolios, with a mean of 16
applications per observation. On average, 2.65 applications per portfolios created
trademark families while 6.25 applications per portfolio were filed to develop these
families further. Companies largely relied on extending existing brands. On average,
4.71 applications were dedicated to extensions. A mean value of 0.87 trademarks is
reported for modernizing brands, and an average of 0.67 trademarks was found to be
hedging.
56 Note that the largest identified trademark portfolio owned by Konami (1,401 applications) has been excluded in the final dataset as this observation was identified as being an outlier. The portfolio with 827 applications belongs to Procter & Gamble (see Table 3).
US 0.324 0.0 0.0 1.0 Japan 0.206 0.0 0.0 1.0 UK 0.084 0.0 0.0 1.0 Germany 0.038 0.0 0.0 1.0 France 0.031 0.0 0.0 1.0 Canada 0.025 0.0 0.0 1.0 Taiwan 0.025 0.0 0.0 1.0 Australia 0.022 0.0 0.0 1.0 Italy 0.021 0.0 0.0 1.0 Sweden 0.020 0.0 0.0 1.0 Other countries 0.204 0.0 0.0 1.0 Notes: N = 1,735 observations. SD = Standard deviation. 1 Real 2004 prices. 2 Companies never performing or disclosing R&D or advertising expenditures, respectively, were excluded. R&D expenditures are available for 935
observations and advertising spendings are available for 434 observations.
- 62 -
Most trademark families had a small size. Although large trademark families including
more than 15 applications were very scarce in company portfolios, PepsiCo had even
four families of that size. This company filed 201 applications in total, of which 93
applications belonged to one of the four large trademark families. This example is
noteworthy as Pepsico had nearly four times more trademarks in just four families than
the ‘average’ company had in total.
Regarding companies’ domiciles, more than half of the companies in the sample are
from the US (32.4%) and from Japan (20.6%). This is followed by firms being located
in the UK (8.4%), in Germany (3.8%), and in France (3.1%). The weak presence of
Europen companies is due to two reasons. The main reason is that the companies in the
sample needed to be publicly listed. If the listing of companies at stock markets is more
common in one country than in another, there will naturally be more companies from
that country in the sample. This explains the large fraction of US- and Japan-based
companies.57 While this explains the weak presence of European companies to a large
extent, another reason is related to the particular trademark rights studied (i.e., CTMs):
It is possible that if non-European companies enter the European market, they are more
likely to seek Europe-wide protection by filing CTMs instead of filing multiple trade-
marks at the national level. As compared to European companies, which might still file
national trademarks despite the advent of the CTM as a pan-EU right (Greenhalgh and
Rogers, 2006a), the possibility of filing national trademarks additionally increases the
share of non-European companies in the sample.
The industries covered in the sample are reported in Table 7. This table also includes
several characteristics of the companies in these industries. The largest share of compa-
nies operates in ‘transportation, communications, and infrastructure’ (11.7%). Other
large industries include ‘services’ (9.3%), ‘electronics and components’ (8.1%), ‘ma-
chinery and computer equipment’ (7.8%), and ‘chemicals’ (6.7%).
Table 7 reveals large differences between the company populations of the various
industries. While some industries such as ‘services’ (mean of total assets: 3,917 million
Euros) or ‘chemicals’ (mean of total assets: 4,435 million Euros) consist of smaller
57 Data from the Reuters database substantiate this reason: Of the 6,500 largest worldwide companies that are stock market-listed, 25% have their domicile in the US and 19.1% in Japan.
- 63 -
companies, others such as ‘transportation equipment’ (mean of total assets: 18,097
million Euros), which contains car manufacturers, include larger companies. These
differences are also reflected in the Tobin’s q values. The average Tobin’s q in the
‘transportation equipment’ industry is 0.88, indicating that the market value of these
companies is below the value of their physical assets. This is contrasted with companies
operating in ‘biotechnology and pharmaceuticals’, whose mean Tobin’s q of 1.97
appears to be more than double of that in ‘transportation equipment’. When estimating
the market value equation, a set of industry dummies will account for these differences.
The trademark activity of the companies also appears to be heterogeneous. Companies
in ‘biotechnology and pharmaceuticals’ companies have filed 107.2 trademark applica-
tions on average and hence show intense trademark activity (see also Malmberg, 2005).
This is in contrast to companies in ‘transportation, communications, and infrastructure’,
which on average only brought 18.1 applications to the OHIM even though they have a
mean of total assets similar to those in ‘biotechnology and pharmaceuticals’. In all
industries, companies filed more brand-developing trademarks than brand-creating
trademarks. The ratio of brand-developing to brand-creating trademarks, however,
reveals variations and indicates different accentuations. In some industries, an emphasis
is put on brand creation while in others brand development is more prominent. Indus-
tries that seem to accentuate brand creation, showing fairly low values of this ratio, are
‘food and kindred products’ and ‘chemicals’. Companies in ‘machinery and computer
equipment’ and ‘instruments for measuring, analyzing, and controlling’ exhibit higher
values and hence put more emphasis on brand development.
<INTEXT>Malmberg, 2005<>
The way in which companies develop their existing brands can be analyzed when
relating the number of hedging, modernizing, and extending trademarks to the total
number of brand-developing trademarks. This allows an assessment of industry-specific
emphases of different trademark filing strategies. Extension strategies are the most
prominent strategy in all industries. However, comparing trademark filing strategies
between industries reveals that the trademarks filed by companies in ‘transportation
equipment’, ‘machinery and computer equipment’, ‘electronics and components’ and
‘food and kindred products’ more often have modernizing or hedging characteristics
whereas trademarks filed by companies in ‘services’ and ‘biotechnology and pharma-
ceuticals’ more often have line- or brand-extending characteristics.
and advertising spendings are available for 434 observations.
<INTEXT>[FIN-CORR]<>
Table 8 reports the Pearson correlation coefficients of the variables that enter the market
value equation. Asset ratios for all variables measuring intangible assets were used since
these ratios are also used in the market value equation. Moreover by using these ratios,
company size effects which might influence all variables are less likely to be captured
by the correlation coefficients. Interestingly, all correlation coefficients with the de-
pendent variable, Tobin’s q, are small. However, there are a number of high correlation
coefficients. This is not unexpected because these coefficients involve trademark
portfolio characteristics that are derived from the same source. It is important to note
that practically all high correlation coefficients cannot distort the multivariate analysis
since the variables that produce these coefficients are not used in the same estimation
models.58 Overall, the correlation coefficients between those variables that are
commonly included in the same models appear to be fairly small.
58 However, there are a few coefficients whose size needs to be noted. First, the number of trademarks that create brands and the number of trademarks that develop brands is highly correlated. Second, the correlations between independent trademarks and brand-creating, brand-developing, and extending trademarks are of moderate size.
6 Empirical Model and Results
In this section, the market value equation is estimated to examine the valuation of
trademark portfolios that were produced by different filing strategies. I first present the
regression equation, on which I ground the estimation of several models (Section 6.1).
Then, the results of these models are reported (Section 6.2).
6.1 Multivariate Specification
The estimation of the market value equation employs the following regression equation:
To account for the non-linear functional form of the regression equation, NLLS estima-
tion is applied. To examine the valuation of trademark filing strategies, five different
models will be estimated, all resting upon Equation 16. These models differ in the
decomposition of companies’ trademark portfolios. If this decomposition concerns s
groups, the relative shadow value γTM,j can be estimated for group j.59
As R&D and advertising stocks could not be computed for all companies, the non-
availability is captured by the dummy variables zRD and zADV.60 Then, differences in
valuations that originate from the unavailability of these variables will appear in the
coefficients ρRD and ρADV. To isolate overall variations in valuations, the regression
equation includes a set of country and industry dummies (i.e., the regressors d1,k and d2,l,
respectively). For each set of dummies, the largest category has been chosen as the
reference category. The reference country is the US (32.4% of all observations), and the
reference category for industries is ‘transportation, communications, and infrastructure’
(11.7% of all observations).
59 Obviously, if no decomposition is applied, one trademark group leads to the estimation of one marginal value. As the decompositions involve more groups, several marginal values are estimated.
60 Specifially, both dummy variables zRD and zADV are set to one if R&D and advertising stock, respec-tively, are not available, and zero otherwise.
6.2 Estimation and Discussion of Results
Table 9 reports the estimation results of the five models. For a comparison of these
models, it is useful to highlight the differences in the decompositions of the trademark
portfolios. In Model M1, no decomposition is used so that only the total number of
companies’ applications, TM, is included. In Model M2, the total number of applica-
tions is divided into brand-creating trademarks, TMC, brand-developing trademarks,
TMD, and independent trademarks, TMI. Model M3 further decomposes TMD into the
different kinds of brand development: hedging trademarks, TMDH, modernizing
trademarks, TMDM, and extending trademarks, TMDE. In Model M4, extending
trademarks are further split into those that are triggered by line extensions, TMDEL, and
those filings that have been initiated through brand extensions, TMDEB.61 Model M5
includes trademark families instead of applications.
Before discussing each model in detail, the common observations between Models M1
through M5 are described. In doing so, I refer to Model M1. In all five models, the
coefficient of the R&D intensity (i.e., the ratio of the R&D stock to assets) is highly
significant (0.490, p < 0.001 in Model M1), and its size is rather stable. Other studies
found similar values (Hall, 1993a; Hall et al., 2007; Megna and Klock, 1993). Accord-
ingly, capitalized R&D expenditures are positively associated with companies’ market
value. If interpreted as the relative shadow value of R&D, the size of this coefficient
indicates that one Euro spent on R&D is equivalent to 0.49 Euros in physical assets. The
coefficient of the advertising intensity (i.e., the ratio of the advertising stock to assets) is
also significantly positive throughout all models (0.688, p < 0.01 in Model M1) and
shows large consistency between the models. Again, there is a positive relationship
between advertising stocks and company values, with one Euro spent on advertising
corresponding to 0.69 Euros in physical assets. Similarities between the coefficients of
both R&D and advertising have also been found by other researchers (Connolly and
Hirschey, 1988). The coefficients of both dummy variables that address the non-
availability of R&D and advertising investments are not significant throughout all
models. This indicates that the absent or non-reported R&D and advertising data are
unlikely to cause any variations in valuations. This is good news as it does not raise
great concerns about sample selection (Hall and Oriani, 2006). In each model, both sets
61 In Models M1 through M4, companies’ trademark applications have been gradually decomposed, but the total number of trademarks considered is equal throughout the models; that is, the sum of all trademarks considered is the same in these models.
of dummy variables are jointly significant. Finally, the R² ranges between 0.278 and
0.284 and is thus similar to the values in other work employing Tobin’s q formats. In
all, these findings do not substiantially differ from previous work.
Model M1 contains the total number of companies’ trademark applications, which has
not been decomposed. The coefficient for total trademark applications is significantly
positive (3.795, p < 0.01). Regardless of different trademark roles, companies’ trade-
mark activity is generally valued in financial markets, which is in line with other studies
(Greenhalgh and Rogers, 2006a). The coefficient indicates that one trademark applica-
tion is valued at approximately 3.8 million Euros in physical assets. As this coefficient
does not apply any decomposition, it has to be interpreted as an average value of any
marginal trademark application regardless of its role in the portfolio.
Table 9: Market Value of Trademark Filing Strategies
R² 0.278 0.283 0.284 0.284 0.283 Log likelihood -1,045.67 -1,039.91 -1,038.33 -1,038.30 -1,039.92 Notes: N = 1,735. Estimation method: NLLS. Significance levels: + 0.05 < p ≤ 0.10; * 0.01 < p ≤ 0.05; ** 0.001 < p ≤ 0.01; *** p ≤ 0.001. Reference group for industry: ‘transportation, communications, and infrastructure’. Reference country: US.
In Model M2, total applications were split into brand-creating, brand-developing, and
independent trademark applications. This allows comparing the valuation of brand-
creating trademarks with brand-developing trademarks. While the coefficient of trade-
marks that develop families is significantly positive (21.779, p < 0.01), the coefficient
of trademarks that initiate families is not significantly different from zero. The coeffi-
cient of independent trademarks, of which trademark families might arise as the trade-
mark portfolio develops further, is also not significant. The interpretation of these
coefficients is that only the development of brands is valued in financial markets.
Trademarks that initiate these brands or trademarks that are not related to these brands
do not contribute to companies’ market valuations. This is interesting since investors in
financial markets do not seem to simply value the number of trademarks that a company
has. Instead, they value specific trademark roles and the benefits of specific strategies.
Model M3 splits the trademarks within a portfolio according to their filing strategies.
Here, the valuation of trademarks that create, hedge, modernize, and extend brands can
be assessed. The coefficient of hedging trademarks is not significant. However, both the
coefficient of modernizing trademarks and that of extending trademarks are signifi-
cantly positive (55.489 and 17.984, p < 0.05). As in Model M2, the coefficients of
brand-creating trademarks and independent trademarks are not significant. The pattern
of these coefficients indicates that financial markets do not value all enlargements of
trademark families alike. The valuation of trademarks that extend brands can be ex-
plained by the informational leverage that these strategies involve. With extending
strategies companies build upon an established brand and seek to induce spillover
effects by transferring this brand to other products or other markets. These spillovers
lead consumers to pool their experiences about products that share the same brand and
potentially increase the market position of existing products as well as the success of
new products (Dacin and Smith, 1994; Smith and Park, 1992). Investors seem to expect
increasing future cash flows from extensions that seek to tap into the reputation of
established brands, which is consistent with other research (Lane and Jacobson, 1995;
Smith and Park, 1992). With modernizing strategies companies seek to cultivate and
renew established brands. An explanation for investors who value modernizing strate-
gies is that they maintain the strengths of existing brands and thus may also provide
platforms for future extension strategies (Farquhar, 1989). Hedging strategies are not
valued in financial markets. By definition, hedging trademarks occur when companies
file very similar or nearly identical trademarks on the same day. I explain the finding
that this strategy does not add value by the absence of potentials to generate cash flows.
The fact that a new product is launched and the possibility that it generates future cash
flows are fully reflected by a single one of the multiple applications filed. If a new
product introduction is reflected by multiple trademark filings, this does not add value
from an investor perspective. Put differently, investors do not expect additional cash
flows from multiple trademark filings that differ slightly. That is because the number of
trademarks simultaneously filed is obviously not related to the introduction of more
products from which investors would derive future revenue streams.
In Model M4, extending strategies are further investigated. Splitting extending trade-
marks into two groups allows differentiating between line and brand extensions. The
coefficients of those variables that already have been included in the regression equation
of Model M3 remain unchanged. In Model M3, the coefficient of extending trademarks
was significantly positive (17.984, p < 0.05). However, in Model M4, the coefficients
related either to line or to brand extensions are not significant.62
Model M5 only includes trademark families.63 To consider varying sizes of trademark
families in the model, the number of families is split into smaller and larger families.64
Through this split of the original measure of brand-creating trademarks, insights into the
valuation of families with different sizes can be gained. Both coefficients of trademark
families are positive and significant. However, the coefficient of larger trademark
families (846.155, p < 0.05) clearly exceeds the coefficient of smaller families (19.770,
p < 0.1). As indicated by the difference between the sizes of both coefficients, larger
trademark families are more highly valued. Larger trademark families result from the
extensive development of brands. Thus, this model again indicates that financial mar-
kets value those trademarks that develop brands. It seems that, if companies develop
their brands, investors attribute future cash flows to these brands according to the extent
of brand development. This finding is interesting as it is consistent with the observa-
tions of Models M2 and M3 that the development of trademark families is valued.
Again, the effects of those variables that have already been included in other models are
highly robust.
62 It is possible that the deep level of portfolio decomposition does not allow for the estimation of a significant coefficient. Both variables carry zero values in a rather large fraction due to a large number of smaller trademark portfolios, in which extension strategies occur rather infrequently. Moreover, both variables are correlated (r = 0.323). It is also possible that the rule for separating line-extending trademarks from brand-extending trademarks is not appropriate for producing accurate estimates.
63 If only trademark families enter the model, brand-developing trademarks are implicitely considered because they are encompassed by the families.
64 Smaller trademark families include 2 to 15 trademark applications and larger trademark families 16 or more applications.
7 Conclusions
Brands are important intangible assets for companies. The ways in which companies
create new brands and develop existing ones influence brand assets to a large extent.
Corporate brand management deals with decisions of how the product portfolio is
linked to the brand portfolio. As new products are introduced, companies can choose to
either create new brands or to use existing ones. This results in a variety of brand types
with some being applied only to one product while others cover a broad range of
products. In the latter case, brand management has decided to use the same existing
brand for several new product introductions. The impact of this brand management
strategy on brand assets is rooted in the transferable reputation of a brand. When
multiple products share the same brand, consumers correlate their beliefs about the
qualities of these products (Erdem, 1998). When new products are launched under
existing brands, consumers infer from their past experiences with the brand or its
branded products the quality of the new products. In the marketing and business litera-
ture, research on brand strategies has a long history. The main characteristic of a brand,
its differentiation potential, has often been used to define the brand as a construct. It is
trademarks as IP rights, however, that ultimately underlie the mechanisms of a brand’s
differentiation potential (Phillips, 2003). As distinctiveness is a requirement for trade-
mark registration, these very IP rights confer companies the legal instruments required
to protect a brand against impairment and, hence, to maintain a brand’s differentiation
potential. Accordingly, the filing of trademarks reflects decisions of corporate brand
management and provides insights into companies’ brand assets. Surprisingly, trade-
marks that enshrine and protect company’s brands have in empirical studies never been
associated with companies’ brand portfolios and their brand management. With the
present study, I seek to fill this gap by analyzing how trademark filing strategies are
associated with brand management and how these strategies contribute to the value of
companies in financial markets.
Four different trademark filing strategies have been identified: creating, hedging,
modernizing, and extending brands. The first strategy of creating brands involves
trademark applications that are filed because the name or the sign of a new brand needs
to be protected. This trademark filing strategy refers to the creation of new brands.
Hedging is the second strategy and refers to a company’s intense simultaneous filing of
several very similar trademarks. A company employs this strategy to protect different
facets of brands with multiple trademarks. Third, modernizing strategies correspond to
the renewal of established brands to keep their appearance up-to-date and to maintain
their strengths. The fourth strategy, extending brands, is used in order to extend estab-
lished brands to cover new products, potentially with the purpose of leveraging existing
brands in new markets.
I developed and employed a technique that reveals the structure of corporate trademark
portfolios and establishes groups of trademarks that protect a brand. Moreover, this
technique uncovered the role of trademarks and categorized them according to the filing
strategies employed by companies. For several companies, the structures of their
trademark portfolios have been presented and discussed to illustrate the linkages
between trademarks and brands. The decomposition of trademark portfolios was then
used with the market value approach to investigate the contribution of filing strategies
to companies’ valuations in financial markets. The market value equation was estimated
with the financial, accounting, and trademark data of 1,734 companies.
The findings of this study may be valuable for both researchers and managers. They add
to our understanding of how trademarks are linked to brands and how these linkages are
valued by investors in financial markets. The findings of this study are based on a
technique that reveals the structure of trademark portfolios, which provides formidable
insights into a company’s IP activities. It is shown that trademark portfolios include
complex structures that protect companies’ brands. This systematic technique allowed
studying companies’ brand management activities from a broader perspective since
entire company portfolios and their development could be analyzed based on different
strategies. The results indicate that financial markets value established brands. When
using trademarks to investigate these brands and how they were developed, both
modernizing and extending strategies were found to contribute to company values. The
contribution of extending strategies to company value can be explained by the cash flow
potential of relying on established brands to launch new products or to enter new
markets. Extending strategies are a mechanism of informational leverage that tap into
consumers’ past experiences with a brand in order to induce quality inferences about