Photocatalytic conversion of carbon dioxide into methanol using zinc–copper–M(III) (M = aluminum, gallium) layered double hydroxides Naveed Ahmed a , Yoshiyuki Shibata a , Tatsuo Taniguchi b , Yasuo Izumi a,⇑ a Department of Chemistry, Graduate School of Science, Chiba University, Yayoi 1-33, Inage-ku, Chiba 263-8522, Japan b Department of Applied Chemistry and Biotechnology, Graduate School of Engineering, Chiba University, Yayoi 1-33, Inage-ku, Chiba 263-8522, Japan article info Article history: Received 6 October 2010 Revised 7 January 2011 Accepted 9 January 2011 Available online 15 February 2011 Keywords: CO 2 Photoreduction Methanol Layered double hydroxide Copper abstract Ordered layered double hydroxides (LDHs) consisting of zinc and/or copper hydroxides were synthesized and combined with aluminum or gallium. These LDH compounds were then applied as photocatalysts to convert gaseous CO 2 (2.3 kPa) to methanol or CO under UV–visible light using hydrogen. ZnAAl LDH was the most active for CO 2 photoreduction and the major product was CO formed at a rate of 620 nmol h 1 g 1 cat , whereas methanol was the major product formed by the inclusion of Cu in the LDH photocatalysts, e.g., at a formation rate of 170 nmol h 1 g 1 cat using ZnACuAGa photocatalyst. The metha- nol selectivity improved by the inclusion of Cu from 5.9 to 26 mol% and 39 to 68 mol%, respectively, when ZnAAl (the conversion 0.16–0.11%) and ZnAGa LDH catalysts were used (the conversion 0.02–0.03%). Specific interaction of Cu sites with CO 2 was spectroscopically suggested to enable coupling with protons and photogenerated electrons to form methanol. Ó 2011 Elsevier Inc. All rights reserved. 1. Introduction Carbon dioxide is one of the major greenhouse gases [1]. Several methods for reducing CO 2 concentration in the atmosphere have been investigated, such as increasing green carbon sinks (plants, phytoplankton, and algae containing chloroplasts); increasing dis- solved carbonate and its salts in sea water; or capturing CO 2 and transferring it to the bottom of the sea in a supercritical state. It would be advantageous to capture CO 2 from the atmosphere and convert it to fuels using sustainable energy such as sunlight, be- cause this solves the problems of global warming and sustainable energy shortage simultaneously. The major obstacle to realizing this option is the thermody- namic limitation on the chemical conversion: CO 2 ðgÞþ 2H 2 OðgÞ! CH 3 OHðgÞþ 1:5O 2 ðgÞ; DG r ¼þ689 kJ mol 1 : Since an efficient catalyst for this photoconversion to fuel is un- known [2–12], it is also important to investigate good catalysts for CO 2 conversion to methanol or other fuels using hydrogen as a reductant, which is potentially obtained from water splitting: 2H 2 OðgÞ! 2H 2 ðgÞþ O 2 ðgÞ; DG r ¼þ457:2 kJ mol 1 : CO 2 ðgÞþ 3H 2 ðgÞ! CH 3 OHðgÞþ H 2 OðgÞ; DG r ¼þ2:9 kJ mol 1 : The latter reaction, using hydrogen, does not essentially solve the problems of global warming and sustainable energy shortage, be- cause current hydrogen production processes require energy and produce CO 2 . The hydrogen needs to be produced from water driven by sunlight if the photoreduction in this paper is to be utilized in a future environmentally benign society [13]. Catalysts for converting CO 2 to methanol using hydrogen at room temperature and utilizing UV–visible light were investigated in this study. As described above, this option requires technologies both to capture CO 2 from the atmosphere and to convert it into fuel. To satisfy the two requisites, layered double hydroxides (LDHs) were chosen with the expectation of (1) sorption capacity for CO 2 in the layered space and (2) tunable semiconductor prop- erties (photocatalytically active) as a result of the choice of metal cations. LDHs are materials based on the layered structure of bru- cite (Mg(OH) 2 ), which has a hexagonal crystal structure, whereas the MgO 6 octahedra are linked at the edge to form sheets (Scheme 1A). One of the naturally occurring LDH compounds is hydrotalcite [14]. The charge of cationic sheets formulated as ½M II 1x M III x ðOHÞ 2 xþ is compensated for by an intercalated anion group, e.g., CO 23 ; SO 24 ; NO 3 ; Cl ; or OH , and the M II site can be Mg, Mn, Fe, Co, Ni, Cu, or Zn. The M III site can be Al, Cr, Mn, Fe, or Ga. x is normally variable within the range 0.17–0.33. The molar amount of structural water intercalated between the cationic lay- ers is about half of the total molar amount of metal cations (Scheme 1A) [15–19]. As for the first requisite, the sorption capacity of LDHs was 0:5—1:4 mmol g 1 sorbent , which was comparable to that of zeolites (0:95—3:2 mmol g 1 sorbent ) [20,21] and greater than that of 0021-9517/$ - see front matter Ó 2011 Elsevier Inc. All rights reserved. doi:10.1016/j.jcat.2011.01.004 ⇑ Corresponding author. Fax: +81 43 290 2783. E-mail address: [email protected](Y. Izumi). Journal of Catalysis 279 (2011) 123–135 Contents lists available at ScienceDirect Journal of Catalysis journal homepage: www.elsevier.com/locate/jcat
Transcript
Journal of Catalysis 279 (2011) 123–135
Contents lists available at ScienceDirect
Journal of Catalysis
journal homepage: www.elsevier .com/locate / jcat
Photocatalytic conversion of carbon dioxide into methanol usingzinc–copper–M(III) (M = aluminum, gallium) layered double hydroxides
Naveed Ahmed a, Yoshiyuki Shibata a, Tatsuo Taniguchi b, Yasuo Izumi a,⇑a Department of Chemistry, Graduate School of Science, Chiba University, Yayoi 1-33, Inage-ku, Chiba 263-8522, Japanb Department of Applied Chemistry and Biotechnology, Graduate School of Engineering, Chiba University, Yayoi 1-33, Inage-ku, Chiba 263-8522, Japan
a r t i c l e i n f o a b s t r a c t
Article history:Received 6 October 2010Revised 7 January 2011Accepted 9 January 2011Available online 15 February 2011
Ordered layered double hydroxides (LDHs) consisting of zinc and/or copper hydroxides were synthesizedand combined with aluminum or gallium. These LDH compounds were then applied as photocatalysts toconvert gaseous CO2 (2.3 kPa) to methanol or CO under UV–visible light using hydrogen. ZnAAl LDH wasthe most active for CO2 photoreduction and the major product was CO formed at a rate of620 nmol h�1 g�1
cat, whereas methanol was the major product formed by the inclusion of Cu in the LDHphotocatalysts, e.g., at a formation rate of 170 nmol h�1 g�1
cat using ZnACuAGa photocatalyst. The metha-nol selectivity improved by the inclusion of Cu from 5.9 to 26 mol% and 39 to 68 mol%, respectively, whenZnAAl (the conversion 0.16–0.11%) and ZnAGa LDH catalysts were used (the conversion 0.02–0.03%).Specific interaction of Cu sites with CO2 was spectroscopically suggested to enable coupling with protonsand photogenerated electrons to form methanol.
� 2011 Elsevier Inc. All rights reserved.
1. Introduction The latter reaction, using hydrogen, does not essentially solve the
Carbon dioxide is one of the major greenhouse gases [1]. Severalmethods for reducing CO2 concentration in the atmosphere havebeen investigated, such as increasing green carbon sinks (plants,phytoplankton, and algae containing chloroplasts); increasing dis-solved carbonate and its salts in sea water; or capturing CO2 andtransferring it to the bottom of the sea in a supercritical state. Itwould be advantageous to capture CO2 from the atmosphere andconvert it to fuels using sustainable energy such as sunlight, be-cause this solves the problems of global warming and sustainableenergy shortage simultaneously.
The major obstacle to realizing this option is the thermody-namic limitation on the chemical conversion:
CO2ðgÞ þ2H2OðgÞ ! CH3OHðgÞþ 1:5O2ðgÞ; DG�
r ¼þ689 kJ mol�1:
Since an efficient catalyst for this photoconversion to fuel is un-known [2–12], it is also important to investigate good catalystsfor CO2 conversion to methanol or other fuels using hydrogen as areductant, which is potentially obtained from water splitting:
2H2OðgÞ ! 2H2ðgÞ þ O2ðgÞ; DG�
r ¼ þ457:2 kJ mol�1:
CO2ðgÞ þ 3H2ðgÞ ! CH3OHðgÞ þH2OðgÞ; DG�
r ¼ þ2:9 kJ mol�1:
ll rights reserved.
i).
problems of global warming and sustainable energy shortage, be-cause current hydrogen production processes require energy andproduce CO2. The hydrogen needs to be produced from water drivenby sunlight if the photoreduction in this paper is to be utilized in afuture environmentally benign society [13].
Catalysts for converting CO2 to methanol using hydrogen atroom temperature and utilizing UV–visible light were investigatedin this study. As described above, this option requires technologiesboth to capture CO2 from the atmosphere and to convert it intofuel. To satisfy the two requisites, layered double hydroxides(LDHs) were chosen with the expectation of (1) sorption capacityfor CO2 in the layered space and (2) tunable semiconductor prop-erties (photocatalytically active) as a result of the choice of metalcations. LDHs are materials based on the layered structure of bru-cite (Mg(OH)2), which has a hexagonal crystal structure, whereasthe MgO6 octahedra are linked at the edge to form sheets(Scheme 1A). One of the naturally occurring LDH compounds ishydrotalcite [14]. The charge of cationic sheets formulated as½MII
1�xMIIIx ðOHÞ2�
xþ is compensated for by an intercalated aniongroup, e.g., CO2�
3 ; SO2�4 ;NO�3 ;Cl�; or OH�, and the MII site can be
Mg, Mn, Fe, Co, Ni, Cu, or Zn. The MIII site can be Al, Cr, Mn, Fe,or Ga. x is normally variable within the range 0.17–0.33. The molaramount of structural water intercalated between the cationic lay-ers is about half of the total molar amount of metal cations(Scheme 1A) [15–19].
As for the first requisite, the sorption capacity of LDHswas 0:5—1:4 mmol g�1
sorbent, which was comparable to that ofzeolites (0:95—3:2 mmol g�1
Scheme 1. (A) Structure of Zn57�x�yCuxMIIIy ðOHÞ72 � 38H2O cluster models: (i) x = y = 0; (ii) x = 0, y = 12, M = Al; (iii) x = 0, y = 1, M = Ga; (iv) x = 1, y = 0; and (v) x = 1, y = 12,
M = Al. (B) Hydrogen carbonate species formed from the reaction of CO2 with the surface hydroxy group of Zn57�x�yCuxMIIIy ðOHÞ72 � 38H2O.
124 N. Ahmed et al. / Journal of Catalysis 279 (2011) 123–135
montmorillonites (0:4—0:5 mmol g�1sorbent) [22,23]. The proportion
of carbonate ions in ½Zn0:75Ga0:25ðOHÞ2�0:25þðCO3Þ2�0:125 �mH2O is
1:1 mmol g�1LDH. The tests for CO2 sorption were reported for previ-
ously degassed LDH compounds in which the MII site was Mg, Co,Ni, Cu, and Zn and the MIII site was Al and Ga [15,24–26]. In con-trast to the fact that various negatively charged sheet layeredmaterials such as montmorillonites, smectites, and kaolinites havebeen studied in detail, the number of positively charged sheet lay-ered materials that can be applied directly to carbonate anion ex-change is limited and they are not well studied.
As for the second requisite, ZnII and GaIII were chosen as the cat-ions of LDHs to form the semiconductor samples. Zinc and copperhave an affinity for CO2 and they form carbonate and formate spe-cies in methanol synthesis, typically at 523–573 K [27]. In addition,Zn and Cu are associated with the trivalent elements Ga, Al, or Cr inthe synthesis of industrial methanol [28]. In this context, LDH com-pounds ½ZnII
1�x�yCuIIy MIII
x ðOHÞ2�xþ2=xðCO3Þ2� consisting of Zn and/or Cu
associated with GaIII or AlIII were chosen to behave as semiconduc-tors and potentially produce methanol via a photo process.
Photoreduction of CO2 using hydrogen as a reductant has beenreported to produce carbon monoxide using Rh/TiO2
[33], and to produce methane using TiO2 (0:30 lmol h�1 g�1cat)
[8,34]. In this study, new catalysts for producing methanol werefound for the first time in the photoreaction of CO2 using hydrogenas a reductant. The synthesis, photocatalytic performance, andspectroscopic monitoring of the interaction of metal sites withCO2, and bandgap energies vs each reaction step of CO2 reductionand that of H2 oxidation to H+ were reported.
2. Experimental
2.1. Syntheses
For the synthesis of LDH compounds, zinc nitrate hexahydrate(Wako Pure Chemical, >99%), copper nitrate trihydrate (Wako PureChemical, >99%), gallium nitrate hydrate (Wako Pure Chemical,>99.9%; n = 7–9 of GaðNO3Þ3 � nH2O), aluminum nitrate nonahydrate
(Wako Pure Chemical, >99.9%), sodium carbonate (Wako PureChemical, >99.8%), and sodium hydroxide (Kanto Chemical,>97.0%) were used as received. Deionized water (<1.0 lS cm�1)was used throughout the syntheses.
An LDH compound formulated as ½Zn3GaIIIðOHÞ8�þ2 ðCO3Þ2��
mH2O was synthesized [35]. A mixed solution (20 ml) of 0.75 MZn(NO3)2�6H2O and 0.25 M GaðNO3Þ3 � nH2O was dropped at a rateof 0.6 ml min�1 into 100 ml of a 0.075 M Na2CO3 solution in a flaskat 290 K with stirring at a rate of 900 rpm. The pH was adjusted to8 by adding 1.0 M NaOH (�20 ml total). After the addition wascomplete, the mixture was continuously stirred at the same rateat 290 K for 2 h. The pH was maintained at 8 by adding 1.0 M NaOH(�0.5 ml total). Then the temperature of the mixture was raised to353 K and continuously stirred for an additional 22 h. The pH of thesolution did not change from 8 throughout the 22 h. The obtainedprecipitates were filtered using a polytetrafluoroethene-basedmembrane filter (Omnipore JGWP04700, Millipore) with a poresize of 0.2 lm, washed with deionized water, and dried in ambientair at 290 K for 5 days. Following the same procedure, an LDH com-pound formulated as ½Zn3AlIIIðOHÞ8�
þ2 ðCO3Þ2� �mH2O was synthe-
sized using Al(NO3)3�9H2O (0.25 M) instead of GaðNO3Þ3 � nH2O(0.25 M).
Cu atoms were substituted at the ZnII sites in the LDH com-pounds formulated as ½Zn3MIIIðOHÞ8�
þ2 ðCO3Þ2� �mH2O (M = Ga or
Al). At the beginning of the synthesis, a mixed solution (20 ml)was prepared as 0.375 M Zn(NO3)2�6H2O, 0.375 M Cu(NO3)2�3H2O,and 0.25 M Al(NO3)3�9H2O (or 0.25 M Ga(NO3)3�nH2O) to set themolar ratio of ZnII, CuII, and MIII (Ga, Al) ions to 3:3:2. Henceforth,the steps are essentially identical to those described above for thesyntheses of ½Zn3MIIIðOHÞ8�
þ2 ðCO3Þ2� �mH2O.
2.2. Characterization
Nitrogen adsorption isotherm measurements were performedat 77 K within the pressure range 1.0–90 kPa in a vacuum systemconnected to diffusion and rotary pumps (10�6 Pa) and equippedwith a capacitance manometer (Models CCMT-1000A and GM-2001, ULVAC). The Brunauer–Emmett–Teller (BET) surface area(SBET) was calculated on the basis of eight-point measurements
N. Ahmed et al. / Journal of Catalysis 279 (2011) 123–135 125
between 10 and 46 kPa (P/P0 = 0.10–0.45) on the adsorption iso-therm. The samples were evacuated at 383 K for 2 h before themeasurements.
X-ray diffraction (XRD) data were obtained using a MiniFlex dif-fractometer (Rigaku) at a Bragg angle of 2hB = 5–70� with a scanstep of 0.01� and a scan rate of 7 s per step for the sample powders.The measurements were performed at 30 kV and 15 mA using CuKa emission and a nickel filter. Scanning electron microscopy(SEM) measurements were performed using JEOL Model JSM-6510A at the Chemical Analysis Center, Chiba University. The sam-ples were mounted on a conducting carbon tape and coated withgold. The electron accelerating voltage was between 15 and25 kV and the magnification was between 20,000 and 50,000times.
Optical spectroscopic measurements were performed using aUV–visible spectrophotometer (JASCO, Model V-650). D2 and halo-gen lamps for wavelengths below and above 340 nm, respectively,and an integrating sphere (JASCO, Model ISV-469) were used forthe diffuse reflectance measurements. Measurements were per-formed at 290 K within the wavelength range 200–900 nm using100 mg of fresh samples. Diffuse reflectance spectra were con-verted to absorption spectra on the basis of the Kubelka–Munkequation [36,37]. The bandgap value was evaluated on the basisof either simple extrapolation of the absorption edge or the fit tothe equation of Davis and Mott [37],
a� hm / ðhm� EgÞn;
in which a, h, and m are the absorption coefficient, Planck’s constant,and the wavenumber, respectively, and n is 1/2, 3/2, 2, and 3 forallowed direct, forbidden direct, allowed indirect, and forbiddenindirect transitions, respectively.
Cu, Zn, and Ga K-edge X-ray absorption fine structure (XAFS)spectra were measured at 30–290 K in transmission mode in thePhoton Factory at the High Energy Accelerator Research Organiza-tion (Tsukuba) on beamlines 7C and 9C. The storage-ring energywas 2.5 GeV and the top-up ring current was 450 mA. A Si(1 1 1)double-crystal monochromator was inserted into the X-ray beampath. The X-ray intensity was maintained at 65% of the maximumflux using a piezo translator set to the crystal. The slit opening sizewas 1 mm (vertical) � (1–3) mm (horizontal) in front of the I0 ion-ization chamber. The I0 and Itransmit ionization chambers werepurged with N2 and Ar, respectively. The scan steps were �9,�0.3, and �2.5 eV in the pre-edge, edge, and postedge regions,respectively. The data accumulation time was 1–5 s for each datapoint. The Zn K, Cu K, and Ga K-edge absorption energy valueswere calibrated to 9660.7, 8980.3, and 10,368.2 eV for the spectraof Zn, Cu, and Ga metals, respectively [38,39]. The energy positionof the monochromator was reproduced within ±0.1 eV.
2.3. Analyses
The XAFS data were analyzed using an XDAP package [40]. Thepre-edge background was approximated by a modified Victoreenfunction, C2/E2 + C1/E + C0. The background of the postedge oscilla-tion was approximated by a smoothing spline function, calculatedby an equation for the number of data points, where k is the wave-number of photoelectrons:
XData Points
i¼1
ðlxi � BGiÞ2
expð�0:075k2i Þ6 smoothing factor:
Multiple-shell curve-fit analyses were performed for theFourier-filtered k3-weighted extended X-ray absorption fine struc-ture (EXAFS) data in k- and R-space using empirical amplitude andphase-shift parameters extracted from the EXAFS data for CuO andZnO. The interatomic distance (R) and its associated coordination
number (N) for the CuAO and ZnAO pairs were set to0.19521 nm with the N value of 4 [41] and to 0.1978 nm withthe N value of 4, respectively, on the basis of their crystal structure[42]. The many-body reduction factor S2
0 was assumed to be equalfor the sample and the reference.
The amplitude and phase-shift parameters were also generatedtheoretically for Zn� � �Zn (R = 0.308 nm with an N value of 6),Zn� � �Zn (R = 0.53347 nm with an N value of 6), and Zn� � �Zn pairs(R = 0.616 nm with an N value of 6) using a Zn57(OH)72 model(Scheme 1A-i), and for the Zn� � �Al pair (R = 0.308 nm with an Nvalue of 2) using a Zn45Al12(OH)72 model (Scheme 1A-ii) using theab initio calculation code FEFF 8.4 [43] in the self-consistent fieldmode. One-fourth of the Zn sites were periodically replaced by Alatoms in the Zn45Al12(OH)72 model. The exchange–correlationpotential of Hedin–Lundqvist was chosen. The Debye temperatureof the LDH models was assumed to be equal to that of ZnO(370 K) [44]. The goodness of fit was given as requested by the Com-mittee on Standards and Criteria in X-ray Absorption Spectroscopy.
The Zn, Cu, and Ga K-edge X-ray absorption near-edge structure(XANES) spectra were theoretically generated using FEFF 8.4 oper-ated in the self-consistent field mode and the fully multiple scat-tering mode.
2.4. Photocatalytic reduction of CO2
Photocatalytic reactions were conducted in a closed circulatingsystem using a photoreaction cell with a flat quartz bottom (totalvolume of reaction system 186 ml, Fig. S1) [45]. One hundred mil-ligrams of the LDH catalyst was homogenously spread in a quartzreaction cell (bottom plate area 23.8 cm2) connected to the circula-tion loop and evacuated (10�6 Pa) at 290 K for 2 h as pretreatmentuntil the desorbed gas was detected by an online gas chromato-graph (GC). Either 21.7 kPa of H2 (1.67 mmol) or 2.3 kPa of CO2
(0.177 mmol) + 21.7 kPa of H2 (1.67 mmol) was introduced and al-lowed to circulate for 30 min in contact with the catalyst to reach asorption equilibrium before the photoillumination.
The catalyst was then illuminated with UV–visible light ob-tained from a 500-W xenon arc lamp (Ushio, Model UI-502Q)through the flat bottom of the quartz reactor (Fig. S1A) for 5 h.The distance between the bottom of the reactor and the lamp exitwindow was set to 20 mm. The light intensity at the wavelength of555 nm was 42 mW cm�2 at the center of the sample cell and28 mW cm�2 at the periphery of the bottom plate of the samplecell. Note that the intensity was measured at 555 nm but the Xearc lamp irradiated in a wide spectrum between 200 and1100 nm. The temperature was within the range 305–313 K atthe catalyst position during the illumination (Fig. S2). The trans-mitted light intensity was also evaluated by changing the catalystamount between 0 and 0.2 g (Fig. S3). Half of the incident light wasabsorbed or scattered by 0.1 g of catalyst charged and half wastransmitted. Because the transmitted light intensity monotonicallydecreased as the catalyst amount increased, most of 0.1 g of cata-lyst should have been effectively illuminated. As a comparison,one of the LDH catalysts was illuminated with UV–visible light ob-tained from another 500-W xenon arc lamp (Ushio, Model SX-UID502XAM) through a UV hot mirror (3.3 mm thick; Edmond), awater filter (100-mm thickness), and the flat bottom of the quartzreactor (Fig. S1B). The distance between the bottom of the reactorand the lamp exit window was set to 206 mm. The light intensityat 555 nm was 106 mW cm�2 at the maximum of the sample celland 76 mW cm�2 at the periphery of the bottom plate of the sam-ple cell.
To evaluate the dependence of the photocatalytic reaction rateson wavelength, a sharp cutoff filter, UV-32 (>320 nm), L-37(>370 nm), L-42 (>420 nm), or Y-48 (>480 nm) (Kenko), was setat the lamp exit window [45]. The liquid nitrogen trap was used
Table 1Physicochemical characterization of ½Zn3�xCuxMIIIðOHÞ8�
a The CuAZnO catalyst was prepared via the reported inverse precipitation method starting from copper and zinc nitrates (atomic ratio Cu:Zn = 54:46) with NaHCO3 [27].b Commercial sample (Kanto Chemical, 99.0%). The major crystalline phase was a-Ga2O3.
126 N. Ahmed et al. / Journal of Catalysis 279 (2011) 123–135
for the reaction in H2 gas only to condense the formed CO2, CH3OH,and H2O. Products and reactants were analyzed using packed col-umns of Molecular Sieve 13X-S and PEG (polyethylene glycol)-6000 supported on Flusin P (GL Sciences) set in the online GCequipped with a thermal conductivity detector (Shimadzu, ModelGC-8A). Two blank tests were performed: a reaction test illumi-nated with UV–visible light in the absence of photocatalysts andanother test for catalyst in the absence of any light. For the lattertest, the reactor was completely wrapped with 20-lm-thick alumi-num foil. To confirm the photocatalytic methanol synthesis, reac-tivity tests on carbonates in LDHs in H2 gas and photocatalytictests on LDHs in CO2 gas were also performed. Furthermore, thechange in the photocatalytic performance when the gas wasswitched to a mixture of CO2 + H2 was investigated.
3. Results
3.1. Nitrogen adsorption, XRD, SEM, and UV–visible spectra
The SBET value was measured on the basis of the N2 adsorptionat 77 K for LDH compounds preheated at 383 K (Table 1). The SBET
value for ½Zn3GaðOHÞ8�þ2 ðCO3Þ2� �mH2O (70 m2 g�1) was 21%
greater than that for ½Zn3AlðOHÞ8�þ2 ðCO3Þ2� �mH2O. The SBET value
decreased by 19% for ½Zn3GaðOHÞ8�þ2 ðCO3Þ2� �mH2O and by 34%
for ½Zn3AlðOHÞ8�þ2 ðCO3Þ2� �mH2O by substitution of Cu atoms at
half of the Zn sites.
Fig. 1. XRD spectra of fresh samples of ½Zn3AlðOHÞ8�þ2 ðCO3Þ2� �mH2O (a),
½Zn1:5Cu1:5GaðOHÞ8�þ2 ðCO3Þ2� �mH2O (d) and the used samples of
½Zn1:5Cu1:5AlðOHÞ8�þ2 ðCO3Þ2� �mH2O (b-u) and ½Zn1:5Cu1:5GaðOHÞ8�
þ2 ðCO3Þ2� �mH2O
(d-u) in 2.3 kPa of CO2 + 21.7 kPa of H2 under UV–visible light for 5 h.
The XRD spectra measured for ½Zn3AlðOHÞ8�þ2 ðCO3Þ2� �mH2O and
½Zn1:5Cu1:5AlðOHÞ8�þ2 ðCO3Þ2� �mH2O are depicted in Fig. 1a and b.
The diffraction peaks common at 2hB = 11.7�, 23.5�, 34.6�, 37.3�,39.2�, 43.9�, 46.7�, 52.9�, 56.3�, 60.2�, 61.5�, and 65.5� were as-signed to (0 0 3), (0 0 6), (0 0 9), (1 0 4), (0 1 5), (1 0 7), (0 1 8),(1 0 1 0), (0 1 1 1), (1 1 0), (1 1 3), and (1 1 6) diffraction for the reg-ular layered structure, respectively [46,47]. The interlayer intervalwas evaluated as 0.757 and 0.753 nm on the basis of the (0 0 3) dif-fraction angle (Table 1A), consistent with the values 0.757 and0.756 nm, which were evaluated based on the (0 0 6) diffractionangle. The interlayer interval value was 0.777 nm, on the basis ofthe (0 0 9) diffraction. The small difference may be due to the over-lap of the diffraction peak (0 0 9) with the (0 1 2) diffraction. Thein-plane (1 1 0) diffraction angle (0.154 nm, Table 1A) within alayer corresponds to R(ZnAO) of 0.218 nm if complete ZnO6 octa-hedra are assumed. Compared to the R(ZnAO) values provided bythe Zn K-edge EXAFS analyses for ½Zn3AlðOHÞ8�
þ2 ðCO3Þ2� �mH2O
and ½Zn1:5Cu1:5AlðOHÞ8�þ2 ðCO3Þ2� �mH2O (0.205–0.207 nm), the
LDH cation sheets were found to be slightly elongated in the direc-tion of the cationic layer plane.
The 2hB angles of plane-to-plane diffraction peaks (0 0 3),(0 0 6), and (0 0 9) perpendicular to the cationic layers changednegligibly when Ga atoms were substituted at the trivalent Al sites(Fig. 1c and d). In contrast, other peaks significantly shifted towardsmaller angles, reflecting the greater ionic radius of GaIII than ofAlIII, e.g., 2hB for (1 1 0) diffraction of 60.2� (0.154 nm) for Al-con-taining LDHs to 59.5� (0.155 nm) for Ga-containing LDHs (Table 1).In the spectrum d for Zn1:5Cu1:5GaðOHÞ8�
þ2 ðCO3Þ2� �mH2O, peaks at
2hB = 27.9�, 30.3�, 35.7�, 57.3�, and 62.9� were also observed, whichwere derived from the impurity.
A representative SEM image for ½Zn3AlðOHÞ8�þ2 ðCO3Þ2� �mH2O is
depicted in Fig. 2. Flat flakes smaller than 100 nm were observed,which suggested the coagulation of the stacked layered structure.
As indicated in Fig. 1b-u and d-u, the LDH samples after thephotocatalytic tests in 2.3 kPa of CO2 + 21.7 kPa of H2 underUV–visible light for 5 h differed negligibly from the correspondingdata for fresh samples (Fig. 1b and d); therefore, the layeredstructures of as-synthesized Zn1:5Cu1:5AlðOHÞ8�
þ2 ðCO3Þ2� �mH2O
and Zn1:5Cu1:5GaðOHÞ8�þ2 ðCO3Þ2� �mH2O samples should be well
retained.An extrapolation of the absorption edge in the UV–visible
absorption spectra was drawn (Fig. 3A). The intercepts with thex-axis for ½Zn3AlðOHÞ8�
þ2 ðCO3Þ2� �mH2O and ½Zn3GaðOHÞ8�
þ2 ðCO3Þ2��
mH2O were 218 and 222 nm, respectively (Spectra a, c), corre-sponding to bandgap values of 5.7 for ½Zn3AlðOHÞ8�
þ2 ðCO3Þ2��
mH2O and 5.6 eV for ½Zn3GaðOHÞ8�þ2 ðCO3Þ2� �mH2O (Table 1).
The bandgap values based on the fit to the equation of Davis and
Fig. 2. SEM image for ½Zn3AlðOHÞ8�þ2 ðCO3Þ2� �mH2O.
½Zn3GaðOHÞ8�þ2 ðCO3Þ2� �mH2O (c), and ½Zn1:5Cu1:5GaðOHÞ8�
þ2 ðCO3Þ2� �mH2O (d).
(Inset) Expanded spectra (a) and (c). (B) Fit to the equation of Davis and Mott(a� hm / ðhm� EgÞn) for data of spectrum (d). (a � hm)2, (a � hm)2/3, (a � hm)1/2, or(a � hm)1/3 vs hm was plotted and the intercept with the x-axis estimates the Eg
value.
N. Ahmed et al. / Journal of Catalysis 279 (2011) 123–135 127
Mott by applying different n values were within the range5.0–5.9 eV both for ½Zn3AlðOHÞ8�
þ2 ðCO3Þ2� �mH2O and for
½Zn3GaðOHÞ8�þ2 ðCO3Þ2� �mH2O. The bandgap values in the case of
n = 1/2 or 3/2 were relatively similar to the corresponding bandgapvalues based on simple absorption edge extrapolation (Table 1).The electronic transition for ½Zn3MIIIðOHÞ8�
þ2 ðCO3Þ2� �mH2O could
be a direct process from oxygen 2p to metal ns or np levels (n = 4for Zn and Ga and n = 3 for Al). In addition, a weak peak was ob-served centered at 291 nm for ½Zn3GaðOHÞ8�
þ2 ðCO3Þ2� �mH2O and
a weaker peak was observed for ½Zn3AlðOHÞ8�þ2 ðCO3Þ2� �mH2O
(Fig. 3A, insets c, a).By the inclusion of Cu, the UV absorption edge shifted toward the
lower-energy side for ½Zn1:5Cu1:5AlðOHÞ8�þ2 ðCO3Þ2 �mH2O (Fig. 3A-b)
and shifted to further lower energy for ½Zn1:5Cu1:5GaðOHÞ8�þ2 ðCO3Þ2��
mH2O (Spectrum d). The extrapolation of the absorption edge wasdrawn and the intercepts with the x-axis for ½Zn1:5Cu1:5AlðOHÞ8�
þ2
ðCO3Þ2�H2O and ½Zn1:5Cu1:5GaðOHÞ8�þ2 ðCO3Þ2�H2O were 306 and
354 nm, respectively, corresponding to the bandgap values of4.1 for ½Zn1:5Cu1:5AlðOHÞ8�
þ2 ðCO3Þ2� �mH2O and 3.5 eV for
½Zn1:5Cu1:5GaðOHÞ8�þ2 ðCO3Þ2� �mH2O (Table 1). The bandgap
values calculated on the basis of the fit to the Davis andMott equation by applying different n values were 2.7–4.5for ½Zn1:5Cu1:5AlðOHÞ8�
þ2 ðCO3Þ2� �mH2O and 2.6–4.2 eV for
½Zn1:5Cu1:5GaðOHÞ8�þ2 ðCO3Þ2� �mH2O (Table 1 and Fig. 3B). The band-
gap values in the case of n = 3/2 were similar to the correspondingbandgap values based on simple extrapolation. The electronic tran-sition for ½Zn1:5Cu1:5MIIIðOHÞ8�
þ2 ðCO3Þ2� �mH2O might be a forbidden
direct process from oxygen 2p to metal ns or np levels (n = 4 for Cu,Zn, and Ga and n = 3 for Al).
3.2. XANES spectra for fresh ½Zn3�xCuxXðOHÞ8�þ2 ðCO3Þ2� �mH2O
Zn K-edge XANES spectra for LDH samples in comparison to thereference spectra are shown in Fig. 4A. The entire spectral patternsfor ½Zn3AlðOHÞ8�
þ2 ðCO3Þ2� �mH2O and ½Zn1:5Cu1:5AlðOHÞ8�
þ2 ðCO3Þ2��
mH2O (Spectra b and c) closely resemble each other. In bothspectra, an intense peak at 9671.7 eV is accompanied by weak,broad peaks at 9688, 9715, and 9724 eV. The Cu K-edge XANESpattern for the latter sample closely resembles those of thecorresponding Zn K-edge data (Fig. 4A-c and B-c), strongly suggest-ing an identical coordination environment for Cu and Zn in½Zn1:5Cu1:5AlðOHÞ8�
þ2 ðCO3Þ2� �mH2O. The energy values of postedge
peaks relative to the first intense peak were 16, 44, and 52 eV forthe Cu K-edge, similar to the gaps of 16, 43, and 52 eV for the ZnK-edge.
The patterns of these experimental spectra were reproduced inthe theoretically generated Zn K-edge spectrum for a complete octa-hedral model (Fig. 4A-f) and theoretically generated Cu K-edge spec-trum for a complete octahedral model (Fig. 4B-h and Scheme 1A-v,ii). The energy values of the Zn K postedge peaks relative to the firstintense peak were 16, 39, and 47 eV in the theoretical spectrum(Fig. 4A-f) compared to 16, 43, and 52 eV in the correspondingexperimental spectrum (Fig. 4A-b). The energy values of the Cu Kpostedge peaks relative to the first intense peak were 14, 39, and46 eV in the theoretical spectrum (Fig. 4B-h) compared to 16, 44,and 52 eV in the corresponding experimental spectrum (Fig. 4B-c).Thus, the Zn and Cu sites in ½Zn3AlðOHÞ8�
þ2 ðCO3Þ2� �mH2O and
½Zn1:5Cu1:5AlðOHÞ8�þ2 ðCO3Þ2� �mH2O should show nearly complete
octahedral coordination.The Zn K-edge XANES spectra for ½Zn3�xCuxGaðOHÞ8�
þ2
ðCO3Þ2� �mH2O (x = 0, 1.5) also consisted of intense peaks at9671.7–9672.2 eV accompanied by weak, broad peaks at 9688–9689 eV (Fig. 4A, Spectra d and e), similar to spectra b and c for½Zn3�xCuxAlðOHÞ8�
þ2 ðCO3Þ2� �mH2O (x = 0, 1.5). A minor difference
was that weak, broad peaks at 9715 and 9724 eV observed for½Zn3�xCuxAlðOHÞ8�
þ2 ðCO3Þ2� �mH2O merged into a weak, broad peak
ranging from 9718 to 9720 eV for ½Zn3�xCuxGaðOHÞ8�þ2 ðCO3Þ2��
mH2O. The energy position of the experimental three peaks for½Zn3�xCuxGaðOHÞ8�
þ2 ðCO3Þ2� �mH2O was reproduced in the theoret-
ically generated Zn K-edge XANES spectrum for a complete octahe-dral model (Scheme 1A-i; Fig. 4A-g). Note that 30Zn, 29Cu, and 31Gaare similar photoelectron backscatters compared to the lighterelement 13Al.
The Cu K-edge XANES spectrum for ½Zn1:5Cu1:5GaðOHÞ8�þ2
ðCO3Þ2�H2O closely resembled the corresponding Zn K-edge data(Fig. 4A-e and B-e). The energy values of the postedge peaks rela-tive to the first intense peak were 17 and 48 eV for the Zn K-edge,identical to the gaps for the Cu K-edge. The energy position ofthe three experimental peaks in the Cu K-edge spectrum e for½Zn1:5Cu1:5GaðOHÞ8�
þ2 ðCO3Þ2� �mH2O was closely reproduced in the
Fig. 4. (A) Normalized Zn, (B) Cu, and (C) Ga K-edge XANES spectra for ZnO (A-a), CuO (B-a), ½Zn3AlðOHÞ8�þ2 ðCO3Þ2� �mH2O (b), ½Zn1:5Cu1:5AlðOHÞ8�
þ2 ðCO3Þ2� �mH2O (c),
½Zn3GaðOHÞ8�þ2 ðCO3Þ2� �mH2O (d), and ½Zn1:5Cu1:5GaðOHÞ8�
þ2 ðCO3Þ2� �mH2O (e). Theoretical spectra generated using FEFF 8.4 for Zn45Al12(OH)72 (f), Zn57(OH)72 (g),
CuZn44Al12(OH)72 (h), CuZn56(OH)72 (i), and GaZn56(OH)72 models (j). The central, X-ray absorbing atoms were Zn (f, g), Cu (h, i), and Ga (j).
128 N. Ahmed et al. / Journal of Catalysis 279 (2011) 123–135
theoretical Cu K-edge spectra for the complete octahedral model(Fig. 4B-i). Thus, as in the case of ½Zn3�xCuxAlðOHÞ8�
þ2 ðCO3Þ2��
mH2O, the Zn and Cu sites show nearly complete octahedralcoordination.
The Cu K-edge XANES pattern for CuO (Fig. 4B-a) was similar tothose for ½Zn1:5Cu1:5GaðOHÞ8�
þ2 ðCO3Þ2� �mH2O (spectrum e) and the
CuZn56(OH)72 model (spectrum i). The Cu sites in CuO are coordi-nated with four equatorial O atoms (average CuAO distance0.19521 nm) and two farther axial O atoms (average CuAO dis-tance 0.2817 nm). The Cu K-edge XANES pattern could be relativelyinsensitive to the variation in CuAO distances [41].
The Ga K-edge XANES spectra for ½Zn3�xCuxGaðOHÞ8�þ2 ðCO3Þ2��
mH2O (x = 0, 1.5) are depicted in Fig. 4C-d, e. The intense peak sit-uated just above the edge (10,380.6 eV) and the three weak, broadpostedge peaks appeared. The energy values of the postedge peaksrelative to the first intense peak were 16–17, 40–41, and 47–48 eV,somewhat different from the gaps of 17 and 43 eV for the theoret-ically generated Ga K-edge spectrum for the complete octahedralmodel (Fig. 4C-j). A possible explanation for this discrepancy is thatthere is a significant distortion of GaIII site coordination comparedto the nearly complete octahedral ZnO6 or CuO6 coordination.
3.3. XANES spectra for partially dehydrated and CO2-adsorbed½Zn3�xCuxXðOHÞ8�
þ2 ðCO3Þ2� �mH2O
When the ½Zn1:5Cu1:5GaðOHÞ8�þ2 ðCO3Þ2� �mH2O sample was
heated at 383 K for 1 h in vacuum, the intensity of the first post-
Fig. 5. Normalized Zn (A, D), Cu (B), and Ga K-edge XANES (C, E) spectra for ½Zn1:5Cu1:
synthesized (e), sample (e) in vacuum at 383 K (e-383), and sample (e-383) in 34.3 kPa offor Zn57(OH)72 (g), CuZn56(OH)72 (i), GaZn56(OH)72 (j), Zn57(OH)72�38H2O (k), CuZn56(OH)Zn (g, k), Cu (i, l), and Ga (j, m).
edge peak at 9689 eV in the Zn K-edge XANES for a fresh sample(Fig. 5A-e) decreased to 65% (Fig. 5A-e-383). In fact, the postedgepeak intensity decreased to 58% when the theoretically generatedXANES spectra for Zn57(OH)72�38H2O model (Scheme 1A-i andFig. 5A-k) lost all the structural water (Fig. 5A-g). In contrast, aclear additional peak was not found in the Fourier transform ofthe theoretically generated Zn K-edge EXAFS besides those derivedfrom the in-plane ZnAO, Zn� � �Zn (R = 0.308 nm), Zn� � �O(R = 0.37722 nm), Zn� � �Zn (R = 0.53347 nm), or Zn� � �Zn pair(R = 0.616 nm) on going from the spectrum for the Zn57(OH)72
model to the one for the Zn57(OH)72�38H2O model. When34.3 kPa of CO2 was introduced into the 383 K-heated LDH sample,the postedge peak intensity increased slightly to 72% of the freshsample (Fig. 5A-e-CO2-290). When the LDH sample was heated to423 K in CO2, the peak intensity further increased to 83% of spec-trum e (spectrum e-CO2-423, Table 2A). Note that the postedgepeak is in the ‘‘multiple scattering’’ region, and the peak intensityincreased in the presence of either water or CO2 molecules be-tween the LDH cationic layers.
A similar in situ trend was observed in the Cu K-edge XANES forthe LDH compound of ½Zn1:5Cu1:5GaðOHÞ8�
þ2 ðCO3Þ2� �mH2O. The
intensity of the first postedge peak at 9016 eV decreased to 76%by heating in vacuum at 383 K (Fig. 5B-e ? e-383). Upon introduc-tion of CO2, the peak intensity increased back to 87% of the freshsample at 290 K (spectrum e-CO2-290) and 91% of the fresh oneat 423 K (spectrum e-CO2-423, Table 2B).
It should be noted that these semireversible in situ peakintensity changes in both the Zn and Cu K-edges for
5GaðOHÞ8�þ2 ðCO3Þ2� �mH2O (A–C) and ½Zn3 GaðOHÞ8�
þ2 ðCO3Þ2� �mH2O (D and E). As-
CO2 at 290 K (e-CO2-290) or 423 K (e-CO2-423). Theoretical spectrum using FEFF 8.472�38H2O (l), and GaZn56(OH)72�38H2O (m). The central, X-ray absorbing atoms were
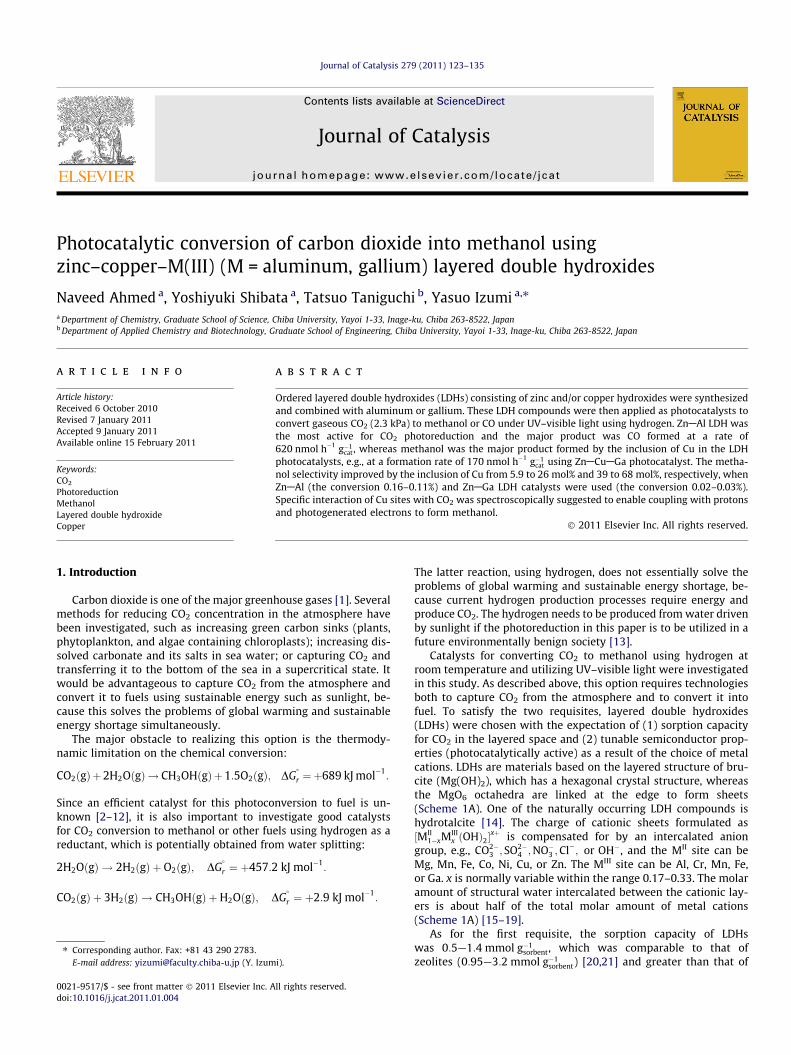
Table 2First postedge peak intensity in normalized Zn, Cu, and Ga K-edge XANES spectra.a
a Values in parentheses: peak intensity ratio to the as-synthesized sample.
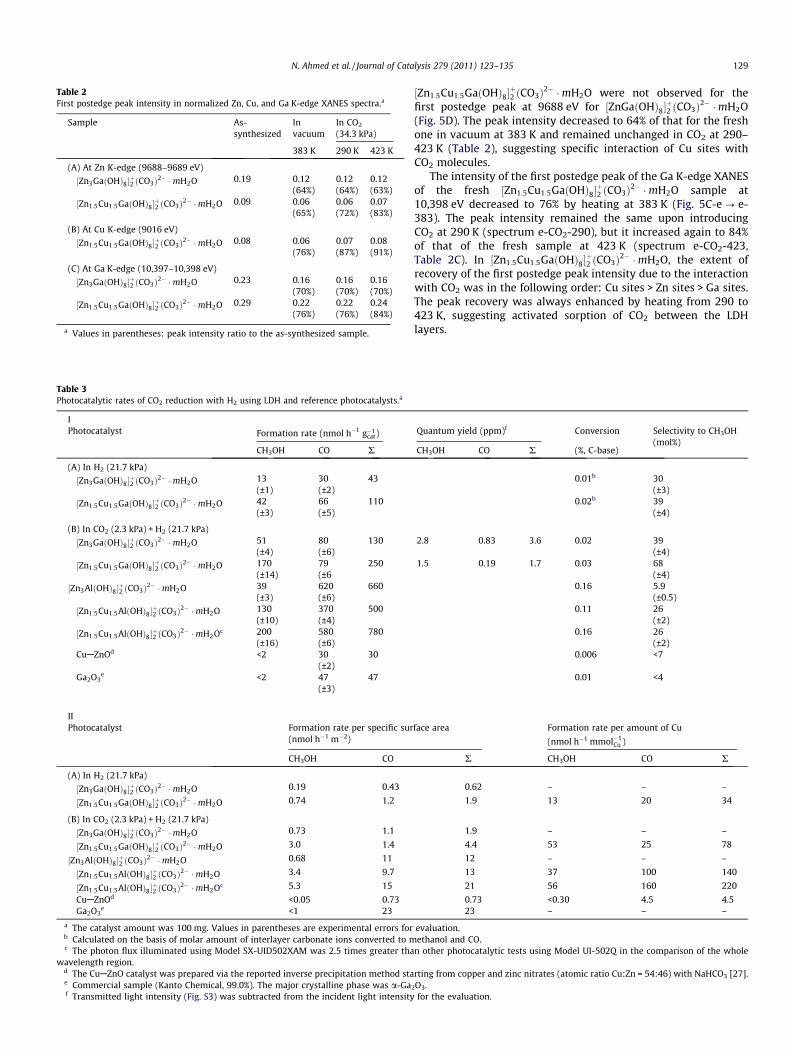
Table 3Photocatalytic rates of CO2 reduction with H2 using LDH and reference photocatalysts.a
IPhotocatalyst Formation rate (nmol h�1 g�1
cat)
CH3OH CO R
(A) In H2 (21.7 kPa)
½Zn3GaðOHÞ8�þ2 ðCO3Þ2� �mH2O 13 30 43
(±1) (±2)
½Zn1:5Cu1:5GaðOHÞ8�þ2 ðCO3Þ2� �mH2O 42 66 110
(±3) (±5)
(B) In CO2 (2.3 kPa) + H2 (21.7 kPa)
½Zn3GaðOHÞ8�þ2 ðCO3Þ2� �mH2O 51 80 130
(±4) (±6)
½Zn1:5Cu1:5GaðOHÞ8�þ2 ðCO3Þ2� �mH2O 170 79 250
(±14) (±6
½Zn3AlðOHÞ8�þ2 ðCO3Þ2� �mH2O 39 620 660
(±3) (±6)
½Zn1:5Cu1:5AlðOHÞ8�þ2 ðCO3Þ2� �mH2O 130 370 500
(±10) (±4)
½Zn1:5Cu1:5AlðOHÞ8�þ2 ðCO3Þ2� �mH2Oc 200 580 780
(±16) (±6)CuAZnOd <2 30 30
(±2)Ga2O3
e <2 47 47(±3)
IIPhotocatalyst Formation rate per specific sur
(nmol h�1 m�2)
CH3OH CO
(A) In H2 (21.7 kPa)
½Zn3GaðOHÞ8�þ2 ðCO3Þ2� �mH2O 0.19 0.43
½Zn1:5Cu1:5GaðOHÞ8�þ2 ðCO3Þ2� �mH2O 0.74 1.2
(B) In CO2 (2.3 kPa) + H2 (21.7 kPa)
½Zn3GaðOHÞ8�þ2 ðCO3Þ2� �mH2O 0.73 1.1
½Zn1:5Cu1:5GaðOHÞ8�þ2 ðCO3Þ2� �mH2O 3.0 1.4
½Zn3AlðOHÞ8�þ2 ðCO3Þ2� �mH2O 0.68 11
½Zn1:5Cu1:5AlðOHÞ8�þ2 ðCO3Þ2� �mH2O 3.4 9.7
½Zn1:5Cu1:5AlðOHÞ8�þ2 ðCO3Þ2� �mH2Oc 5.3 15
CuAZnOd <0.05 0.73Ga2O3
e <1 23
a The catalyst amount was 100 mg. Values in parentheses are experimental errors forb Calculated on the basis of molar amount of interlayer carbonate ions converted to mc The photon flux illuminated using Model SX-UID502XAM was 2.5 times greater tha
wavelength region.d The CuAZnO catalyst was prepared via the reported inverse precipitation method stae Commercial sample (Kanto Chemical, 99.0%). The major crystalline phase was a-Gaf Transmitted light intensity (Fig. S3) was subtracted from the incident light intensity
N. Ahmed et al. / Journal of Catalysis 279 (2011) 123–135 129
½Zn1:5Cu1:5GaðOHÞ8�þ2 ðCO3Þ2� �mH2O were not observed for the
first postedge peak at 9688 eV for ½ZnGaðOHÞ8�þ2 ðCO3Þ2� �mH2O
(Fig. 5D). The peak intensity decreased to 64% of that for the freshone in vacuum at 383 K and remained unchanged in CO2 at 290–423 K (Table 2), suggesting specific interaction of Cu sites withCO2 molecules.
The intensity of the first postedge peak of the Ga K-edge XANESof the fresh ½Zn1:5Cu1:5GaðOHÞ8�
þ2 ðCO3Þ2� �mH2O sample at
10,398 eV decreased to 76% by heating at 383 K (Fig. 5C-e ? e-383). The peak intensity remained the same upon introducingCO2 at 290 K (spectrum e-CO2-290), but it increased again to 84%of that of the fresh sample at 423 K (spectrum e-CO2-423,Table 2C). In ½Zn1:5Cu1:5GaðOHÞ8�
þ2 ðCO3Þ2� �mH2O, the extent of
recovery of the first postedge peak intensity due to the interactionwith CO2 was in the following order: Cu sites > Zn sites > Ga sites.The peak recovery was always enhanced by heating from 290 to423 K, suggesting activated sorption of CO2 between the LDHlayers.
Quantum yield (ppm)f Conversion Selectivity to CH3OH(mol%)
CH3OH CO R (%, C-base)
0.01b 30(±3)
0.02b 39(±4)
2.8 0.83 3.6 0.02 39(±4)
1.5 0.19 1.7 0.03 68(±4)
0.16 5.9(±0.5)
0.11 26(±2)
0.16 26(±2)
0.006 <7
0.01 <4
face area Formation rate per amount of Cu
(nmol h�1 mmol�1Cu )
R CH3OH CO R
0.62 – – –
1.9 13 20 34
1.9 – – –
4.4 53 25 78
12 – – –
13 37 100 140
21 56 160 220
0.73 <0.30 4.5 4.523 – – –
evaluation.ethanol and CO.
n other photocatalytic tests using Model UI-502Q in the comparison of the whole
rting from copper and zinc nitrates (atomic ratio Cu:Zn = 54:46) with NaHCO3 [27].2O3.
for the evaluation.
130 N. Ahmed et al. / Journal of Catalysis 279 (2011) 123–135
Similarly to the first postedge in the Zn K-edge for½Zn3GaðOHÞ8�
þ2 ðCO3Þ2� �mH2O, the intensity of the first postedge
peak in the Ga K-edge spectrum decreased to 70% of the freshone and remained the same in CO2 at 290–423 K (Fig. 5E andTable 2C, A), suggesting poor interaction of the Zn/Ga sites withCO2 molecules.
3.4. Photocatalytic reduction rates of CO2
First, the reactivity of the interlayer carbonate ions of LDHs wastested in 21.7 kPa of H2 for ½Zn3�xCuxGaðOHÞ8�
þ2 ðCO3Þ2� �mH2O
(x = 0, 1.5) (Table 3I-A and Fig. 6A and B). Methanol was detectedas a byproduct using both catalysts under UV–visible light in addi-tion to the major product of CO (70–61 mol%). The conversion ofcarbonate ions into methanol + CO was 0.01–0.02%.
The photocatalysis of ½Zn3GaðOHÞ8�þ2 ðCO3Þ2� �mH2O was tested
in 2.3 kPa of CO2 + 21.7 kPa of H2 under illumination by UV–visiblelight (Fig. 6C). The major product was CO (selectivity 61 mol%), andmethanol was also formed. The catalyst was compared to½Zn1:5Cu1:5GaðOHÞ8�
þ2 ðCO3Þ2� �mH2O (Fig. 6D). The formation rate
of CO was essentially identical (79 nmol h�1g�1cat), whereas that of
methanol increased (170 nmol h�1g�1cat) by a factor of 3.3 for
½Zn1:5Cu1:5GaðOHÞ8�2ðCO3Þ2� �mH2O. The methanol selectivity wasimproved to 68 mol% (Table 3I-B).
Next, the ½Zn3AlðOHÞ8�þ2 ðCO3Þ2� �mH2O catalyst was tested
(Fig. 6E) in comparison to the ½Zn3GaðOHÞ8�þ2 ðCO3Þ2� �mH2O catalyst
(Fig. 6C). Total product formation rate was enhanced by a factor of5.1 of ½Zn3GaðOHÞ8�
þ2 ðCO3Þ2� �mH2O by the substitution of Ga for
Al. The major product was CO (selectivity 94 mol%). Then the½Zn1:5Cu1:5AlðOHÞ8�
þ2 ðCO3Þ2� �mH2O catalyst (Fig. 6F) was compared
to the ½Zn3AlðOHÞ8�þ2 ðCO3Þ2� �mH2O catalyst. The total product
Fig. 6. Time course of photoreactions in only H2 alone (21.7 kPa; A, B) and in CO2
(2.3 kPa) + H2 (21.7 kPa) (C–F, BL-1, BL-2). One hundred milligrams of the LDHcatalyst was charged except for the blank test BL-1 (empty reactor):½Zn3GaðOHÞ8�
þ2 ðCO3Þ2� �mH2O (A, C), ½Zn1:5Cu1:5GaðOHÞ8�
þ2 ðCO3Þ2� �mH2O (B, D),
½Zn3AlðOHÞ8�þ2 ðCO3Þ2� �mH2O (E), and ½Zn1:5Cu1:5AlðOHÞ8�
þ2 ðCO3Þ2� �mH2O (F, BL-2).
The reactor was illuminated with a 500-W Xe arc lamp except for blank test BL-2(reactor in darkness). CO2 (�; diamond), H2O (N; triangle), CH3OH (j; square), andCO (d; circle).
formation rate decreased by 24%. Similarly to the Cu substitutioninto ½Zn3GaðOHÞ8�
þ2 ðCO3Þ2� �mH2O, the methanol formation rate
was promoted by a factor of 3.3 of ½Zn3AlðOHÞ8�þ2 ðCO3Þ2� �mH2O.
The conversion using ½Zn1:5Cu1:5AlðOHÞ8�þ2 ðCO3Þ2� �mH2O was im-
proved by increasing the light intensity of Model UI-502Q (0.11%)to 2.5 times using Model SX-UID502XAM (0.16%, Table 3I-B) in thecomparison of the whole wavelength region.
The formation rates per specific surface area of catalyst andthose per amount of Cu are also summarized in Table 3II. Espe-cially, a concern that 500-W high-intensity light may lead to a localhigh temperature for the catalyst can be estimated based on theformation rates per amount of Cu, although the catalyst tempera-ture was monitored to be 305–313 K (Fig. S2). ConventionalCuAZnO catalyst was quite inactive per amount of Cu and formedonly CO. The Cu sites in LDH are CuII, which is normally consideredto be inactive for thermal methanol synthesis [27]. Further,LDHs that do not contain Cu (½Zn3GaðOHÞ8�
þ2 ðCO3Þ2� �mH2O,
½Zn3AlðOHÞ8�þ2 ðCO3Þ2� �mH2O) did produce methanol (Table 3I-B).
Thus, the catalysis listed in Table 3 should be photocatalytic below313 K.
The formation rates of water were between 0.5 and2:0 lmol h�1g�1
cat in the kinetic tests (Fig. 6C–F). These rates exceedthe amount of water that was catalytically formed as the productsof the following equations:
CO2 þH2 ! COþH2O
CO2 þ 3H2 ! CH3OHþH2O:
This discrepancy is due to the desorption of interlayer water mole-cules of LDHs [15–19].
A control reaction experiment was performed using½Zn1:5Cu1:5AlðOHÞ8�
þ2 ðCO3Þ2� �mH2O in the absence of light
(Fig. 6BL-2). Another control experiment included a reaction
Fig. 7. Time course of photoreactions in CO2 (2.6 kPa) only in first 3 h and in CO2
(2.6 kPa) + H2 (21.7 kPa) after 3 h from the start of the reactions for 100 mg of½Zn1:5Cu1:5GaðOHÞ8�
þ2 ðCO3Þ2� �mH2O. Other reaction conditions and legends are the
same as those for Fig. 6.
Table 4Comparison of photoconversion of gases over ½Zn1:5Cu1:5GaðOHÞ8�
þ2 ðCO3Þ2� �mH2Oa.
Condition Formation rate
(nmol h�1 g�1cat)
CH3OH CO
In methanol (1.7 Pa), no light – <2In methanol (1.7 Pa), under lightb �26 26In methanol (1.7 Pa) + H2 (21.7 kPa), no light – <2In methanol (1.7 Pa) + H2 (21.7 kPa), under lightb 24 82In H2 (21.7 kPa), under lightb 42 66
a The catalyst amount was 100 mg.b Photocatalytic tests using Model UI-502Q.
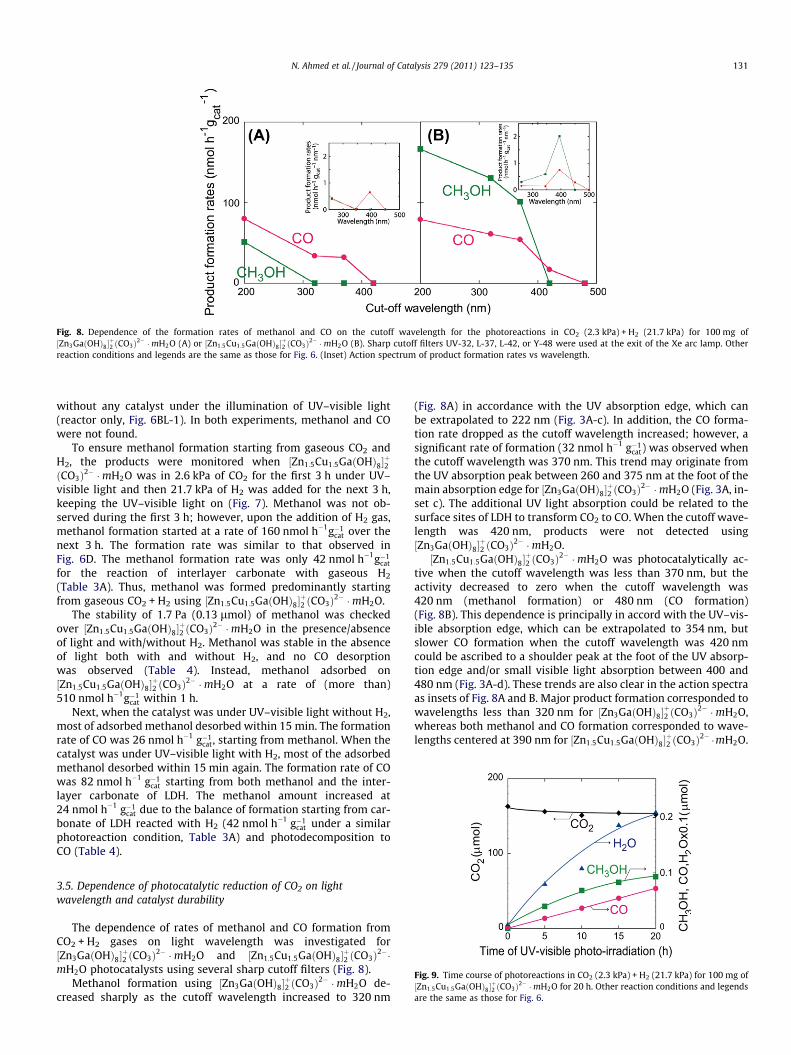
Fig. 8. Dependence of the formation rates of methanol and CO on the cutoff wavelength for the photoreactions in CO2 (2.3 kPa) + H2 (21.7 kPa) for 100 mg of½Zn3GaðOHÞ8�
þ2 ðCO3Þ2� �mH2O (A) or ½Zn1:5Cu1:5GaðOHÞ8�
þ2 ðCO3Þ2� �mH2O (B). Sharp cutoff filters UV-32, L-37, L-42, or Y-48 were used at the exit of the Xe arc lamp. Other
reaction conditions and legends are the same as those for Fig. 6. (Inset) Action spectrum of product formation rates vs wavelength.
N. Ahmed et al. / Journal of Catalysis 279 (2011) 123–135 131
without any catalyst under the illumination of UV–visible light(reactor only, Fig. 6BL-1). In both experiments, methanol and COwere not found.
To ensure methanol formation starting from gaseous CO2 andH2, the products were monitored when ½Zn1:5Cu1:5GaðOHÞ8�
þ2
ðCO3Þ2� �mH2O was in 2.6 kPa of CO2 for the first 3 h under UV–visible light and then 21.7 kPa of H2 was added for the next 3 h,keeping the UV–visible light on (Fig. 7). Methanol was not ob-served during the first 3 h; however, upon the addition of H2 gas,methanol formation started at a rate of 160 nmol h�1g�1
cat over thenext 3 h. The formation rate was similar to that observed inFig. 6D. The methanol formation rate was only 42 nmol h�1g�1
cat
for the reaction of interlayer carbonate with gaseous H2
(Table 3A). Thus, methanol was formed predominantly startingfrom gaseous CO2 + H2 using ½Zn1:5Cu1:5GaðOHÞ8�
þ2 ðCO3Þ2� �mH2O.
The stability of 1.7 Pa (0.13 lmol) of methanol was checkedover ½Zn1:5Cu1:5GaðOHÞ8�
þ2 ðCO3Þ2� �mH2O in the presence/absence
of light and with/without H2. Methanol was stable in the absenceof light both with and without H2, and no CO desorptionwas observed (Table 4). Instead, methanol adsorbed on½Zn1:5Cu1:5GaðOHÞ8�
þ2 ðCO3Þ2� �mH2O at a rate of (more than)
510 nmol h�1g�1cat within 1 h.
Next, when the catalyst was under UV–visible light without H2,most of adsorbed methanol desorbed within 15 min. The formationrate of CO was 26 nmol h�1 g�1
cat, starting from methanol. When thecatalyst was under UV–visible light with H2, most of the adsorbedmethanol desorbed within 15 min again. The formation rate of COwas 82 nmol h�1 g�1
cat starting from both methanol and the inter-layer carbonate of LDH. The methanol amount increased at24 nmol h�1 g�1
cat due to the balance of formation starting from car-bonate of LDH reacted with H2 (42 nmol h�1 g�1
cat under a similarphotoreaction condition, Table 3A) and photodecomposition toCO (Table 4).
Fig. 9. Time course of photoreactions in CO2 (2.3 kPa) + H2 (21.7 kPa) for 100 mg of½Zn1:5Cu1:5GaðOHÞ8�
þ2 ðCO3Þ2� �mH2O for 20 h. Other reaction conditions and legends
are the same as those for Fig. 6.
3.5. Dependence of photocatalytic reduction of CO2 on lightwavelength and catalyst durability
The dependence of rates of methanol and CO formation fromCO2 + H2 gases on light wavelength was investigated for½Zn3GaðOHÞ8�
þ2 ðCO3Þ2� �mH2O and ½Zn1:5Cu1:5GaðOHÞ8�
þ2 ðCO3Þ2��
mH2O photocatalysts using several sharp cutoff filters (Fig. 8).Methanol formation using ½Zn3GaðOHÞ8�
þ2 ðCO3Þ2� �mH2O de-
creased sharply as the cutoff wavelength increased to 320 nm
(Fig. 8A) in accordance with the UV absorption edge, which canbe extrapolated to 222 nm (Fig. 3A-c). In addition, the CO forma-tion rate dropped as the cutoff wavelength increased; however, asignificant rate of formation (32 nmol h�1 g�1
cat) was observed whenthe cutoff wavelength was 370 nm. This trend may originate fromthe UV absorption peak between 260 and 375 nm at the foot of themain absorption edge for ½Zn3GaðOHÞ8�
þ2 ðCO3Þ2� �mH2O (Fig. 3A, in-
set c). The additional UV light absorption could be related to thesurface sites of LDH to transform CO2 to CO. When the cutoff wave-length was 420 nm, products were not detected using½Zn3GaðOHÞ8�
þ2 ðCO3Þ2� �mH2O.
½Zn1:5Cu1:5GaðOHÞ8�þ2 ðCO3Þ2� �mH2O was photocatalytically ac-
tive when the cutoff wavelength was less than 370 nm, but theactivity decreased to zero when the cutoff wavelength was420 nm (methanol formation) or 480 nm (CO formation)(Fig. 8B). This dependence is principally in accord with the UV–vis-ible absorption edge, which can be extrapolated to 354 nm, butslower CO formation when the cutoff wavelength was 420 nmcould be ascribed to a shoulder peak at the foot of the UV absorp-tion edge and/or small visible light absorption between 400 and480 nm (Fig. 3A-d). These trends are also clear in the action spectraas insets of Fig. 8A and B. Major product formation corresponded towavelengths less than 320 nm for ½Zn3GaðOHÞ8�
þ2 ðCO3Þ2� �mH2O,
whereas both methanol and CO formation corresponded to wave-lengths centered at 390 nm for ½Zn1:5Cu1:5GaðOHÞ8�
þ2 ðCO3Þ2� �mH2O.
132 N. Ahmed et al. / Journal of Catalysis 279 (2011) 123–135
Finally, the durability of the ½Zn1:5Cu1:5GaðOHÞ8�þ2 ðCO3Þ2� �mH2O
catalyst was tested for 20 h. The photocatalyst exhibited the bestselectivity to methanol (68 mol%) in 5 h (Table 3B and Fig. 6D).In the 20-h test, methanol formation continued and the selectivitywas 68–57 mol% (Fig. 9). In every 5 h, the methanol formation rategradually decreased, starting from 79, to 57, 30, and then19 nmol h�1 g�1
cat, whereas the CO formation rate remained constant(36 nmol h�1 g�1
catÞ for 20 h. Throughout the 20-h test, no otherproducts were found except for methanol, CO, and water.
4. Discussion
4.1. Catalyst syntheses and photocatalysis
LDH compounds were synthesized with chemical compositions½Zn3�xCuxMIIIðOHÞ8�
þ2 ðCO3Þ2� �mH2O, where M was Al or Ga and the
x value was 0–1.5. The synthesis of the LDH structure was con-firmed on the basis of the XRD spectra (Fig. 1a–c). The divalentCu was successfully incorporated into the octahedral sites in thecationic layers with a maximum Cu:Zn atomic ratio of 1:1, as con-firmed by Cu and Zn K-edge XANES spectra (Fig. 4A and B). Theincorporation of Cu with a maximum Cu:Zn atomic ratio of 7:3was reported for ½Zn3�xCuxAlIIIðOHÞ8�
þ2 ðCO3Þ2� �mH2O [27]. In the
case where M was Ga and the x value was 1.5, the diffraction peaksderived from the impurity phase(s) were observed in the XRDspectrum at 2hB = 27.9�, 30.3�, 35.7�, 57.3�, and 62.9� (Fig. 1d).The SBET value of ½Zn3GaIIIðOHÞ8�
þ2 ðCO3Þ2� �mH2O was slightly high-
er (70 m2 g�1) than that of ½Zn3AlIIIðOHÞ8�þ2 ðCO3Þ2� �mH2O
(57 m2 g�1; Table 1). The SBET value decreased by 19–34% whenequimolar amounts of Cu and Zn metal were included in the LDHsand when M was either Al or Ga. The coagulated flat flakes smallerthan 100 nm in the SEM images were suggested to be stacked lay-ers of ½Zn3AlðOHÞ8�
þ2 ðCO3Þ2� �mH2O (Fig. 2).
Synthesized LDHs formulated as ½Zn3�xCuxMIIIðOHÞ8�þ2 ðCO3Þ2��
mH2O were applied to the photocatalytic reduction of CO2 (Table 3and Fig. 6). First, the conversion of interlayer carbonate ions of½Zn3�xCuxGaðOHÞ8�
þ2 ðCO3Þ2� �mH2O (x = 0, 1.5) was tested in the
presence of H2 gas. Methanol formation was confirmed at rates of13—42 nmol h�1g�1
cat and the total conversion of carbonate to meth-anol + CO was 0.01–0.02% (Table 3A). The CO2 formation derivedfrom the carbonate ions was of the same or a slightly higher orderthan the formation of methanol and CO (Fig. 6A and B). Becausethe interlayer carbonate ions balance the charge with the½Zn3�xCuxGaðOHÞ8�
þ cation layers, it could be difficult to convertand remove carbonate ions from the interlayer space if an extra car-bonate source or alternative anion source were not provided.
Photocatalytic methanol formation tests were performed inthe presence of CO2 and H2 gases using several LDH samples incomparison to a conventional CuAZnO catalyst and Ga2O3, whichhave primarily an a-crystalline phase (Table 3B). This is the firstreport to synthesize methanol starting from CO2 and H2
using photocatalysts under only UV–visible light. When½Zn3�xCuxAlðOHÞ8�
þ2 ðCO3Þ2� �mH2O (x = 0, 1.5) catalysts were used,
CO (selectivity 94–74 mol%) was a major product. In this study,exclusive CO photoformation was reported using Rh/TiO2 [29],ZrO2 [30,31], MgO [32], and Ga2O3 [33], and was observed usingCuAZnO or Ga2O3 (Table 3B). Among the LDH samples tested inthis study, ½Zn3�xCuxAlðOHÞ8�
þ2 ðCO3Þ2� �mH2O catalysts were the
most active. The conversions (0.16–0.11%) were an order of mag-nitude greater than those obtained using references CuAZnO andGa2O3 (0.01–0.006%). The formation of methanol + CO was accel-erated by increasing the light intensity (500 nmol h�1 g�1
cat) to 2.5times (780 nmol h�1 g�1
cat) for ½Zn1:5Cu1:5AlðOHÞ8�2ðCO3Þ2� �mH2Oin the comparison of the whole wavelength region. Methanolwas the major product when the ½Zn1:5Cu1:5GaðOHÞ8�2ðCO3Þ2��
mH2O photocatalyst was used (selectivity 68 mol%; Table 3I-B).Photocatalytic conversion of CO2 into methanol in aqueous solu-tion was reported using Co-phthalocyanine/TiO2 [11] and Nd3+/TiO2 [12]. The maximum formation rates of methanol were 9.3and 23 lmol h�1 g�1
cat, respectively, in addition to a higher forma-tion rate of formic acid using CoPc/TiO2 (150 lmol h�1 g�1
cat). Thedisadvantage of LDH catalysts for slower photoconversion ofCO2 using hydrogen in this study may be due to slow gas diffu-sion in the interlayer space compared to the cases in thesereferences.
The dependence of the photocatalytic methanol formation rateon the light wavelength (Fig. 8) was compared to the UV–visibleabsorption spectra for ½Zn3GaðOHÞ8�2ðCO3Þ2� �mH2O (Fig. 3A-cand A-d). The higher limit of the wavelength used to form metha-nol was between 370 and 420 nm for ½Zn1:5Cu1:5GaðOHÞ8�
þ2 ðCO3Þ2��
mH2O (Fig. 8B), in accordance with the UV absorption edge extrap-olated to 354 nm or the foot (400 nm) of a smaller shoulder on theabsorption edge (Fig. 3A-d). The higher limit of wavelengths atwhich methanol formed was less than 320 nm for½Zn3GaðOHÞ8�
þ2 ðCO3Þ2� �mH2O (Fig. 8A), in accordance with the
UV absorption edge extrapolated to 222 nm (Fig. 3A-c). The COformation rates also decreased as the cutoff wavelength increased;however, the trend was less steep than for methanol, and thus,the CO selectivity was 100 mol% when the cutoff wavelengthwas 370 nm (½Zn3GaðOHÞ8�
þ2 ðCO3Þ2� �mH2O) and 420 nm
(½Zn1:5Cu1:5GaðOHÞ8�þ2 ðCO3Þ2� �mH2O) (Fig. 8). These minor differ-
ences probably occur because the UV–visible absorption is theelectronic transition to the energy level slightly below the bottomof the conduction band and this level was derived from the surfacesites selective for transforming CO2 into CO.
The action spectra in the insets of Fig. 8A and B were comparedto the light intensity distribution for Model UI-502Q obtainedusing a USR40 spectroradiometer (Ushio). Compared to the lightintensity peak centered at 380 nm (not shown), the quantum yieldfor methanol formation using ½Zn1:5Cu1:5GaðOHÞ8�
þ2 ðCO3Þ2� �mH2O
was evaluated at 1.5 ppm (Table 3I-B). The quantum yield for allproducts was 1.7 ppm. On the other hand, the action spectrumfor ½Zn3 GaðOHÞ8�
þ2 ðCO3Þ2� �mH2O (Fig. 8A, inset) was compared
to the light intensity peak centered at 315 nm. The quantum yieldsfor methanol and CO were 2.8 and 0.83 ppm, respectively(Table 3I-B). As the bandgap of LDHs that do not contain Cu waswider (5.6–5.7 eV), they would utilize UV light only between 200and 220 nm (Fig. 3A).
The methanol formation and minor CO formation using the½Zn1:5Cu1:5GaðOHÞ8�
þ2 ðCO3Þ2� �mH2O photocatalyst was confirmed
for as long as 20 h (Fig. 9), suggesting the suitability of the photo-catalysts to capturing CO2 and converting it to fuel under continu-ous natural light. The gradual decrease of the methanol formationrate may be affected by the readsorption of product methanol incontrast to the constant formation rate for CO, because productCO readsorption on ½Zn1:5Cu1:5GaðOHÞ8�
þ2 ðCO3Þ2� �mH2O catalyst
should be weaker.For ½Zn1:5Cu1:5GaðOHÞ8�
þ2 ðCO3Þ2� �mH2O under UV–visible light,
the methanol formation rates increased from 42 nmol h�1 g�1cat in
H2 to 170 nmol h�1 g�1cat in CO2 + H2 (Table 3). The presence of car-
bonate is possibly the key to methanol photosynthesis; however,gaseous CO2 promoted the formation rates by a factor of 4.0. Onthe other hand, the catalyst under UV–visible light produced noproduct in CO2 and the photocatalysis required the addition ofH2 to the system (Fig. 7). No methanol was detected after the cat-alyst was suspended in deionized water under UV–visible light for5 h (see the Supporting materials). Furthermore, no impurity thatcontained carbon was included in the reagents used throughoutthe LDH syntheses, except for sodium carbonate. Therefore, thesource of methanol was gaseous CO2 and interlayer carbonates.The photoconversion of carbonates to methanol was favorable in
N. Ahmed et al. / Journal of Catalysis 279 (2011) 123–135 133
the presence of gaseous CO2 and it most likely compensated for theinterlayer anions.
4.2. Spectroscopic insight and reaction mechanism of photocatalysis
The specific photocatalysis thus found to form methanol fromCO2 were correlated with the desorption trend of interlayer mole-cules (water and/or carbonates) and the adsorption of the sub-strate. The LDH structure is ultimately simple from the viewpointof heterogeneous catalysis because all the surface sites are hydroxygroups bound to [MO6] octahedra and the type of metal elements(Zn, Cu, Ga, or Al) is the only difference (Scheme 1A). The presenceor absence of interlayer molecules was difficult to monitor usingEXAFS. However, the first postedge peak (9688–9689 eV at theZn K-edge, 9016 eV at the Cu K-edge, and 10,397–10,398 eV atthe Ga K-edge) was found to be a critical indicator of the presenceor absence of these molecules (Fig. 5).
For the LDH compound ½Zn1:5Cu1:5GaðOHÞ8�þ2 ðCO3Þ2� �mH2O,
which was the most methanol-selective, the intensity of the firstpostedge peak at the Zn K-edge decreased to 65% of that for thefresh one in vacuum at 383 K due to the loss of structural watermolecules and/or carbonates. The Zn K postedge peak intensity de-creased similarly for Cu-free ½Zn3GaðOHÞ8�
þ2 ðCO3Þ2� �mH2O to 64%
of that for the fresh one. The peak intensity increased to 83% inCO2 at 423 K in the former Cu-containing LDH, whereas the peakremained unchanged for the latter Cu-free LDH in CO2 at 290–423 K.
The desorption–adsorption trend monitored at the Zn K-edgefor ½Zn1:5Cu1:5GaðOHÞ8�
þ2 ðCO3Þ2� �mH2O was also evident in both
the Cu and the Ga K-edge spectra. The recovery extent (=peakincrease due to CO2 sorption/peak decrease caused by the loss ofwater and carbonates) of the first postedge peak intensity in thenormalized XANES spectra was of the following order: Cu sites(63%) > Zn sites (51%) > Ga sites (11%). In contrast, the first Ga Kpostedge peak remained unchanged for Cu-free ½Zn3GaðOHÞ8�
þ2
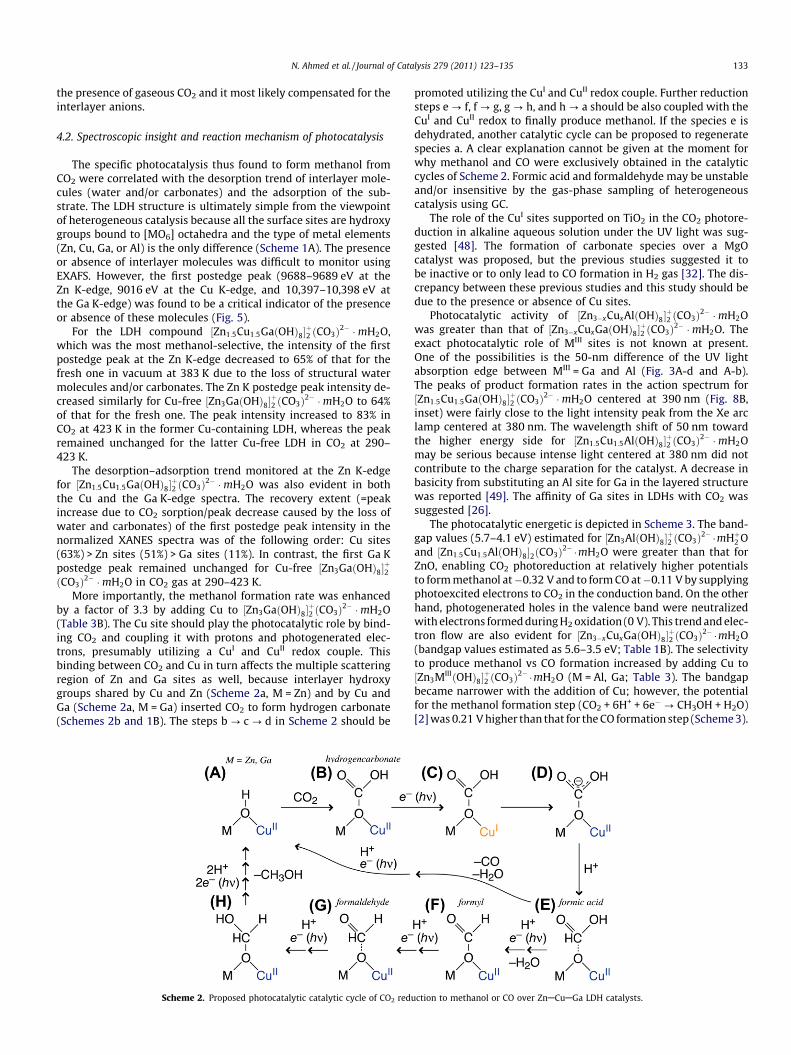
ðCO3Þ2� �mH2O in CO2 gas at 290–423 K.More importantly, the methanol formation rate was enhanced
by a factor of 3.3 by adding Cu to ½Zn3GaðOHÞ8�þ2 ðCO3Þ2� �mH2O
(Table 3B). The Cu site should play the photocatalytic role by bind-ing CO2 and coupling it with protons and photogenerated elec-trons, presumably utilizing a CuI and CuII redox couple. Thisbinding between CO2 and Cu in turn affects the multiple scatteringregion of Zn and Ga sites as well, because interlayer hydroxygroups shared by Cu and Zn (Scheme 2a, M = Zn) and by Cu andGa (Scheme 2a, M = Ga) inserted CO2 to form hydrogen carbonate(Schemes 2b and 1B). The steps b ? c ? d in Scheme 2 should be
Scheme 2. Proposed photocatalytic catalytic cycle of CO2 redu
promoted utilizing the CuI and CuII redox couple. Further reductionsteps e ? f, f ? g, g ? h, and h ? a should be also coupled with theCuI and CuII redox to finally produce methanol. If the species e isdehydrated, another catalytic cycle can be proposed to regeneratespecies a. A clear explanation cannot be given at the moment forwhy methanol and CO were exclusively obtained in the catalyticcycles of Scheme 2. Formic acid and formaldehyde may be unstableand/or insensitive by the gas-phase sampling of heterogeneouscatalysis using GC.
The role of the CuI sites supported on TiO2 in the CO2 photore-duction in alkaline aqueous solution under the UV light was sug-gested [48]. The formation of carbonate species over a MgOcatalyst was proposed, but the previous studies suggested it tobe inactive or to only lead to CO formation in H2 gas [32]. The dis-crepancy between these previous studies and this study should bedue to the presence or absence of Cu sites.
Photocatalytic activity of ½Zn3�xCuxAlðOHÞ8�þ2 ðCO3Þ2� �mH2O
was greater than that of ½Zn3�xCuxGaðOHÞ8�þ2 ðCO3Þ2� �mH2O. The
exact photocatalytic role of MIII sites is not known at present.One of the possibilities is the 50-nm difference of the UV lightabsorption edge between MIII = Ga and Al (Fig. 3A-d and A-b).The peaks of product formation rates in the action spectrum for½Zn1:5Cu1:5GaðOHÞ8�
þ2 ðCO3Þ2� �mH2O centered at 390 nm (Fig. 8B,
inset) were fairly close to the light intensity peak from the Xe arclamp centered at 380 nm. The wavelength shift of 50 nm towardthe higher energy side for ½Zn1:5Cu1:5AlðOHÞ8�
þ2 ðCO3Þ2� �mH2O
may be serious because intense light centered at 380 nm did notcontribute to the charge separation for the catalyst. A decrease inbasicity from substituting an Al site for Ga in the layered structurewas reported [49]. The affinity of Ga sites in LDHs with CO2 wassuggested [26].
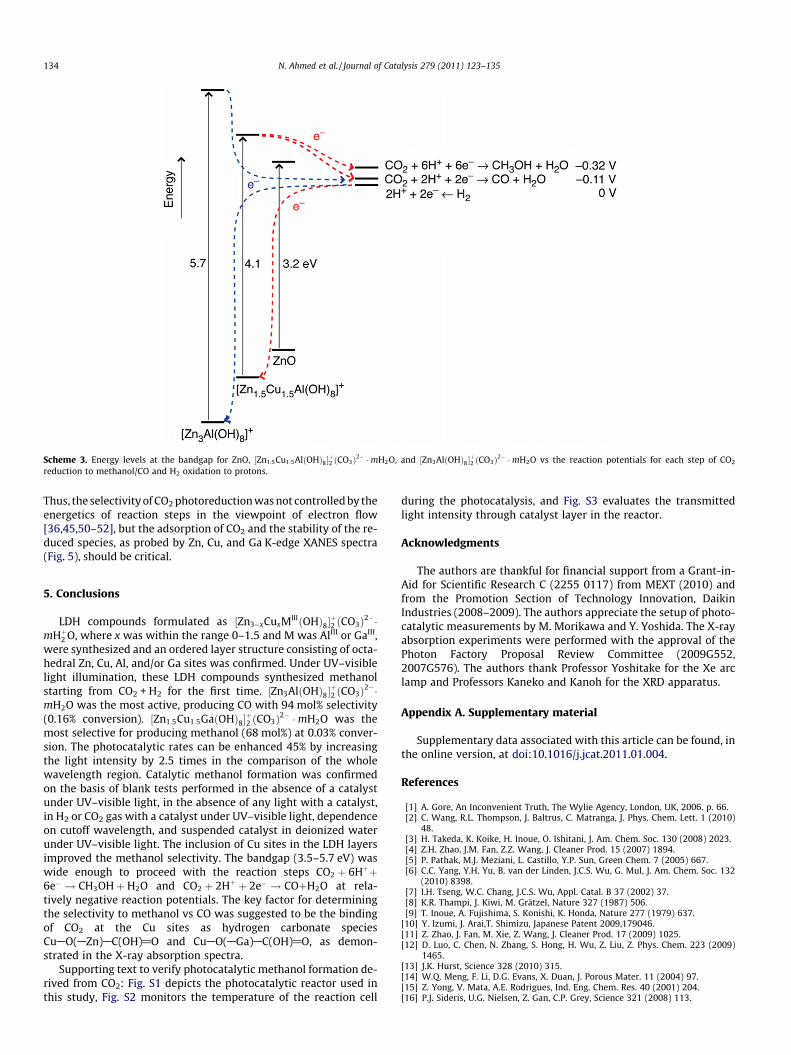
The photocatalytic energetic is depicted in Scheme 3. The band-gap values (5.7–4.1 eV) estimated for ½Zn3AlðOHÞ8�
þ2 ðCO3Þ2� �mHþ2 O
and ½Zn1:5Cu1:5AlðOHÞ8�2ðCO3Þ2� �mH2O were greater than that forZnO, enabling CO2 photoreduction at relatively higher potentialsto form methanol at�0.32 V and to form CO at�0.11 V by supplyingphotoexcited electrons to CO2 in the conduction band. On the otherhand, photogenerated holes in the valence band were neutralizedwith electrons formed during H2 oxidation (0 V). This trend and elec-tron flow are also evident for ½Zn3�xCuxGaðOHÞ8�
þ2 ðCO3Þ2� �mH2O
(bandgap values estimated as 5.6–3.5 eV; Table 1B). The selectivityto produce methanol vs CO formation increased by adding Cu to½Zn3MIIIðOHÞ8�
became narrower with the addition of Cu; however, the potentialfor the methanol formation step (CO2 + 6H+ + 6e�? CH3OH + H2O)[2] was 0.21 V higher than that for the CO formation step (Scheme 3).
ction to methanol or CO over ZnACuAGa LDH catalysts.
Scheme 3. Energy levels at the bandgap for ZnO, ½Zn1:5Cu1:5AlðOHÞ8�þ2 ðCO3Þ2� �mH2O, and ½Zn3AlðOHÞ8�
þ2 ðCO3Þ2� �mH2O vs the reaction potentials for each step of CO2
reduction to methanol/CO and H2 oxidation to protons.
134 N. Ahmed et al. / Journal of Catalysis 279 (2011) 123–135
Thus, the selectivity of CO2 photoreduction was not controlled by theenergetics of reaction steps in the viewpoint of electron flow[36,45,50–52], but the adsorption of CO2 and the stability of the re-duced species, as probed by Zn, Cu, and Ga K-edge XANES spectra(Fig. 5), should be critical.
5. Conclusions
LDH compounds formulated as ½Zn3�xCuxMIIIðOHÞ8�þ2 ðCO3Þ2��
mHþ2 O, where x was within the range 0–1.5 and M was AlIII or GaIII,were synthesized and an ordered layer structure consisting of octa-hedral Zn, Cu, Al, and/or Ga sites was confirmed. Under UV–visiblelight illumination, these LDH compounds synthesized methanolstarting from CO2 + H2 for the first time. ½Zn3AlðOHÞ8�
þ2 ðCO3Þ2��
mH2O was the most active, producing CO with 94 mol% selectivity(0.16% conversion). ½Zn1:5Cu1:5GaðOHÞ8�
þ2 ðCO3Þ2� �mH2O was the
most selective for producing methanol (68 mol%) at 0.03% conver-sion. The photocatalytic rates can be enhanced 45% by increasingthe light intensity by 2.5 times in the comparison of the wholewavelength region. Catalytic methanol formation was confirmedon the basis of blank tests performed in the absence of a catalystunder UV–visible light, in the absence of any light with a catalyst,in H2 or CO2 gas with a catalyst under UV–visible light, dependenceon cutoff wavelength, and suspended catalyst in deionized waterunder UV–visible light. The inclusion of Cu sites in the LDH layersimproved the methanol selectivity. The bandgap (3.5–5.7 eV) waswide enough to proceed with the reaction steps CO2 þ 6Hþþ6e� ! CH3OHþH2O and CO2 þ 2Hþ þ 2e� ! COþH2O at rela-tively negative reaction potentials. The key factor for determiningthe selectivity to methanol vs CO was suggested to be the bindingof CO2 at the Cu sites as hydrogen carbonate speciesCuAO(AZn)AC(OH)@O and CuAO(AGa)AC(OH)@O, as demon-strated in the X-ray absorption spectra.
Supporting text to verify photocatalytic methanol formation de-rived from CO2: Fig. S1 depicts the photocatalytic reactor used inthis study, Fig. S2 monitors the temperature of the reaction cell
during the photocatalysis, and Fig. S3 evaluates the transmittedlight intensity through catalyst layer in the reactor.
Acknowledgments
The authors are thankful for financial support from a Grant-in-Aid for Scientific Research C (2255 0117) from MEXT (2010) andfrom the Promotion Section of Technology Innovation, DaikinIndustries (2008–2009). The authors appreciate the setup of photo-catalytic measurements by M. Morikawa and Y. Yoshida. The X-rayabsorption experiments were performed with the approval of thePhoton Factory Proposal Review Committee (2009G552,2007G576). The authors thank Professor Yoshitake for the Xe arclamp and Professors Kaneko and Kanoh for the XRD apparatus.
Appendix A. Supplementary material
Supplementary data associated with this article can be found, inthe online version, at doi:10.1016/j.jcat.2011.01.004.
References
[1] A. Gore, An Inconvenient Truth, The Wylie Agency, London, UK, 2006. p. 66.[2] C. Wang, R.L. Thompson, J. Baltrus, C. Matranga, J. Phys. Chem. Lett. 1 (2010)
48.[3] H. Takeda, K. Koike, H. Inoue, O. Ishitani, J. Am. Chem. Soc. 130 (2008) 2023.[4] Z.H. Zhao, J.M. Fan, Z.Z. Wang, J. Cleaner Prod. 15 (2007) 1894.[5] P. Pathak, M.J. Meziani, L. Castillo, Y.P. Sun, Green Chem. 7 (2005) 667.[6] C.C. Yang, Y.H. Yu, B. van der Linden, J.C.S. Wu, G. Mul, J. Am. Chem. Soc. 132
(2010) 8398.[7] I.H. Tseng, W.C. Chang, J.C.S. Wu, Appl. Catal. B 37 (2002) 37.[8] K.R. Thampi, J. Kiwi, M. Grätzel, Nature 327 (1987) 506.[9] T. Inoue, A. Fujishima, S. Konishi, K. Honda, Nature 277 (1979) 637.
[10] Y. Izumi, J. Arai,T. Shimizu, Japanese Patent 2009,179046.[11] Z. Zhao, J. Fan, M. Xie, Z. Wang, J. Cleaner Prod. 17 (2009) 1025.[12] D. Luo, C. Chen, N. Zhang, S. Hong, H. Wu, Z. Liu, Z. Phys. Chem. 223 (2009)
1465.[13] J.K. Hurst, Science 328 (2010) 315.[14] W.Q. Meng, F. Li, D.G. Evans, X. Duan, J. Porous Mater. 11 (2004) 97.[15] Z. Yong, V. Mata, A.E. Rodrigues, Ind. Eng. Chem. Res. 40 (2001) 204.[16] P.J. Sideris, U.G. Nielsen, Z. Gan, C.P. Grey, Science 321 (2008) 113.
N. Ahmed et al. / Journal of Catalysis 279 (2011) 123–135 135
[17] T. Hongo, T. Iemura, A. Yamazaki, J. Ceram. Soc. Jpn. 116 (2008) 192.[18] L. Lv, P. Sun, Z. Gu, H. Du, X. Pang, X. Tao, R. Xu, L. Xu, J. Hazard. Mater. 161
(2009) 1444.[19] J.T. Klogregge, L. Hickey, R.L. Frost, J. Solid State Chem. 177 (2004) 4047.[20] N. Hiyoshi, K. Yogo, T. Yashima, Chem. Lett. 37 (2008) 1266.[21] B. Wang, A.P. Cote, H. Furukawa, M.O. Keefe, O.M. Yaghi, Nature 453 (2008) 207.[22] C. Volzone, J.O. Rinaldi, J. Ortiga, Mater. Res. 5 (2002) 475.[23] A. Azzouz, A. Ursu, D. Nistor, T. Sajin, E. Assaad, R. Roy, Thermochim. Acta 496
(2009) 45.[24] Z. Yong, A.E. Rodrigues, Energy Convers. Manage. 43 (2002) 1865.[25] E.R. van Selow, P.D. Cobden, P.A. Verbraeken, J.R. Hufton, R.W. van den Brink,
Ind. Eng. Chem. Res. 48 (2009) 4184.[26] C.T. Yavuz, B.D. Shinall, A.V. Iretskii, M.G. White, T. Golden, M. Atilhan, P.C.
Ford, G.D. Stucky, Chem. Mater. 21 (2009) 3473.[27] S. Fujita, M. Usui, H. Ito, N. Takezawa, J. Catal. 157 (1995) 403.[28] M. Behrens, I. Kasatkin, S. Kühl, G. Weinberg, Chem. Mater. 22 (2010) 386.[29] Y. Kohno, H. Hayashi, S. Takenaka, T. Tanaka, T. Funabiki, S. Yoshida, J.
Photochem. Photobiol. A 12 (1999) 117.[30] C.C. Lo, C.H. Hung, C.S. Yuan, J.F. Wu, Solar Energy Mater. Solar Cells 91 (2007)
1765.[31] Y. Kohno, T. Tanaka, T. Funabiki, S. Yoshida, Chem. Commun. (1997) 841.[32] K. Teramura, T. Tanaka, H. Ishikawa, Y. Kohno, T. Funabiki, J. Phys. Chem. B 108
(2004) 346.[33] K. Teramura, H. Tsuneoka, T. Shishido, T. Tanaka, Chem. Phys. Lett. 467 (2008) 191.
[34] M. Anpo, H. Yamashita, K. Ikeue, Y. Fujii, S.G. Zhang, Y. Ichihashi, D.R. Park, Y.Suzuki, K. Koyano, T. Tatsumi, Catal. Today 44 (1998) 327.
[35] G.S. Thomas, P.V. Kamath, Solid State Sci. 8 (2006) 1181.[36] Y. Izumi, T. Itoi, S. Peng, K. Oka, Y. Shibata, J. Phys. Chem. C 113 (2009) 6706.[37] X. Gao, I.E. Wachs, J. Phys. Chem. B 104 (2000) 1261.[38] J.A. Bearden, Rev. Mod. Phys. 39 (1967) 78.[39] G. Zschornack, Handbook of X-ray Data, Springer, Berlin/Heidelberg, 2007.[40] M. Vaarkamp, H. Linders, D. Koningsberger, XDAP version 2.2.7, XAFS Services
International, Woudenberg, The Netherlands, 2006.[41] N.J. Calos, J.S. Forrester, G.B. Schaffer, J. Solid State Chem. 122 (1996) 273.[42] B.G. Hyde, S. Andersson, Inorganic Crystal Structures, Wiley, New York, 1989.
p. 55.[43] L. Ankudinov, B. Ravel, J.J. Rehr, S.D. Condradson, Phys. Rev. B 58 (1998) 7565.[44] K.J. Hong, T.S. Jeong, J. Cryst. Growth 280 (2005) 545.[45] Y. Izumi, K. Konishi, H. Yoshitake, Bull. Chem. Soc. Jpn. 81 (2008) 1241.[46] Y. Sun, Y. Zhou, Z. Wang, X. Ye, Appl. Surf. Sci. 255 (2009) 6372.[47] A. Ennadi, A. Legrouri, A. De Roy, J.P. Besse, J. Solid State Chem. 152 (2000) 568.[48] I.H. Tseng, J.C.S. Wu, H.Y. Chou, J. Catal. 221 (2004) 432.[49] M.A. Aramendia, Y. Aviles, J.A. Benitez, V. Borau, C. Jimenez, J.M. Marinas, J.R.
Ruiz, F.J. Urbano, Micropor. Mesopor. Mater. 29 (1999) 319.[50] Y. Izumi, Y. Shibata, Chem. Lett. 38 (2009) 912.[51] Y. Izumi, K. Konishi, D. Obaid, T. Miyajima, H. Yoshitake, Anal. Chem. 79 (2007)
6933.[52] D. Masih, H. Yoshitake, Y. Izumi, Appl. Catal. A 325 (2007) 276.