Trichodesmium is a genus of filamentous non-hetero-cystous cyanobacteria that is considered responsible forthe majority of N2 fixation in the ocean (Capone et al.2005). The input of biologically available nitrogen tothe water column through N2 fixation tends to increasethe net primary production and hence the export of par-ticulate organic carbon (POC) to the deep ocean (Karlet al. 2002). Therefore, the N2 fixed by Trichodesmium
would contribute to 2 important processes at the globalscale: (1) increase in the biological sequestration of at-mospheric CO2, thus fuelling the biological pump (Epp-ley & Peterson 1979); (2) compensation for the probableimbalance in the modern ocean nitrogen budget due toN loss by denitrification (Codispoti et al. 2001).
To estimate diazotrophy at the global scale, the mainenvironmental factors that determine the distribution(including bloom formation) and growth of Tricho-desmium must be explained, especially in areas
Photosynthetic characteristics of Trichodesmiumin the southwest Pacific Ocean: importance and
significance
Italo Masotti1,*, Diana Ruiz-Pino1, Aubert Le Bouteiller2
1Laboratoire d’Océanographie et du Climat, Expérimentations et Approches Numériques (LOCEAN), Institut Pierre Simon Laplace, Université Pierre et Marie Curie, Boîte 134, 4 Place Jussieu, 75252 PARIS Cedex 05, France
2Institut de Recherche pour le Développement (IRD), Centre IRD de Nouméa, 101 Promenade Roger Laroque, BP A5 98848,Nouméa, New Caledonia
ABSTRACT: The photosynthetic capacities of Trichodesmium were investigated in a multidiscipli-nary study comprising 9 cruises in a region of the Coral Sea, southwest Pacific Ocean, where thesediazotrophic cyanobacteria are particularly abundant. Thirty specific measurements of photosynthe-sis in natural communities of Trichodesmium using an O2 electrode with the addition of a 14C-tracergave a mean photosynthetic quotient of 1.19, quite close to the theoretical value. Seven photosynthe-sis vs. irradiance curves exhibited typically high light-saturated and compensation photosyntheticparameters Ik and Ic (327 and 77 µE m–2 s–1, respectively), implying that Trichodesmium requires astronger irradiance for growth than other phytoplankton typical of oligotrophic systems. The verticalprofiles of in situ productivity of Trichodesmium generally showed a maximum at 10 or 20 m depthand a lower value at the surface, the latter probably being due to photoinhibition. Based on produc-tivity data and the mean measured C:chl a ratio of 188 g C g chl a–1, the maximum Trichodesmiumgrowth rate ranged between 0.18 and 0.32 d–1. The high level of energy required by these organismsto grow could explain why the vertical distribution of Trichodesmium colonies is generally restrictedto well-lit surface waters. Furthermore, our observations suggest that the presence of a shallowmixed-layer is a prerequisite for an optimal light regime and a maximum growth rate for this genus.Hence, the seasonal changes in both incident radiation and water column stratification wouldstrongly control the variations in the abundance of Trichodesmium populations, which tends to beminimum in winter and spring and maximum in summer.
Resale or republication not permitted without written consent of the publisher
Mar Ecol Prog Ser 338: 47–59, 2007
known to be favourable but poorly documented, suchas the southwest Pacific Ocean (LaRoche & Breitbarth2005, Campbell et al. 2005). Trichodesmium cells char-acteristically occur as filaments (trichomes) or colonies(Capone et al. 1997), which at times accumulate mas-sively at the sea surface, producing reddish water, withconcentrations up to 105 or 106 trichomes l–1 (Sournia1968, Revelante & Gilmartin 1982). This organism hasmost often been reported from regions between 30° Nand 30° S in the 3 major oceans (Capone et al. 2005,LaRoche & Breitbarth 2005). In the southwest Pacific(SWP), surface blooms have been observed duringnaval and aerial surveys (Dupouy et al. 2004). Exten-sive chlorophyll enrichments detected by the CoastalZone Color Scanner (CZCS; summer 1982) and Sea-viewing Wide Field-of-view Sensor (SeaWiFS; summer1998) that covered surfaces of up to 90 000 km2 aroundNew Caledonia were attributed to Trichodesmium(Dupouy et al. 1988). Blooms of Trichodesmium werealso reported in the spring-summer period in theTonga Islands (Bowman & Lancaster 1965) and in theGreat Barrier Reef of Australia, with concentrations of10 000 trichomes l–1 in surface accumulations (Reve-lante & Gilmartin 1982). Thus, in contrast to manyother large oligotrophic areas of the tropical oceanswhere these organisms are scarce or totally absent, theSWP appears to be remarkably favourable for Tricho-desmium development. Hence, this region is particu-larly convenient for an investigation of the main phy-sical, chemical and biological processes that controlTrichodesmium growth and population dynamics.
Several environmental factors have been suggestedto control Trichodesmium growth and N2 fixation,among which are temperature, nutrients such as phos-phorus and iron, and light. Trichodesmium growthseems to be favoured in warm seas (LaRoche & Breit-barth 2005). In the SWP, all Trichodesmium bloomswere observed in water in which the temperatureexceeded 22°C (Dupouy et al. 2004, Moutin et al.2005). Furthermore, Trichodesmium was shown to beadapted to the low concentrations of available phos-phate (Wu et al. 2000). In the SWP, a critical inorganicphosphate concentration as low as 9 nM was requiredby Trichodesmium populations for maintaining a sig-nificant positive growth rate (Moutin et al. 2005). Theconcentrations of phosphate in that region wereobserved to be higher than 9 nM in winter and spring,but generally lower than 9 nM in summer and autumn(Van den Broeck et al. 2004). Because most Tricho-desmium blooms occur in summer, precisely in theperiod when inorganic phosphate tends to fall belowthis critical level (Moutin et al. 2005), this observationsuggests that Trichodesmium would have the capacityto utilize other sources of P, such as dissolved organicphosphate (Mulholland et al. 2002).
Considering the aeolian distribution of iron in theocean and the high iron requirements of Tricho-desmium (Berman-Frank et al. 2001), nitrogen fixationby this organism would be iron-limited in large parts ofthe global ocean (Berman-Frank et al. 2001). However,in the SWP, relatively high iron concentrations (200 to400 pM) were observed at 1 station north of New Cale-donia by Nakayama et al. (1995); in contrast, Campbellet al. (2005) reported surface iron concentrations thatranged between less than the analytical detection limitof 60 and 320 pM at 4 stations north of New Caledonia.Without any information on in situ iron uptake kine-tics, it is difficult to determine when and where theiron needs of Trichodesmium are partially or totallysatisfied in the SWP.
As a possible consequence of nutrient stress (P, Fe orother), the Trichodesmium growth rate has beenreported to be very slow (Mague et al. 1977). However,some recent field studies suggest that Trichodesmiumwould have a carbon-doubling time ranging from 3 to5 d (LaRoche & Breitbarth 2005), which is faster thanpreviously found but significantly slower than thegrowth rate of most other phytoplankton species esti-mated in the western equatorial Pacific (Le Bouteilleret al. 2003). Growth rates of Trichodesmium have notbeen documented in the South Pacific. Assuming thesame pattern in the Pacific as in the Atlantic, it is nowimportant to gain an understanding of the formationof widespread and intense blooms by a slow-growingorganism such as Trichodesmium.
With only 1 or 2 cellular divisions per week, thecontrol of Trichodesmium photosynthesis and growthby light availability is expected to be preponderant. Anumber of studies in the Atlantic Ocean (Li et al. 1980,Kana 1993, Carpenter et al. 1993, Roenneberg & Car-penter 1993, Carpenter & Roenneberg 1995, Villareal1995) demonstrated that Trichodesmium spp. areadapted to growing under high levels of irradiance, asshown by a high mean value of the photosynthetic sat-uration parameter Ik (close to 300 µE m–2 s–1). Similarly,the light compensation index (Ic) is much higher in Tri-chodesmium spp. (59 to 280 µE m–2 s–1) than in otherphytoplankton species (typically <10 µE m–2 s–1), anddisplays highest values at midday and lowest values atnight (Kana 1993, Roenneberg & Carpenter 1993).
The purpose of this study was to describe the photo-synthetic characteristics of Trichodesmium in a regionwhere these properties were still unknown, usingresults of in situ, simulated in situ and laboratoryexperiments. Results were used to define the optimallight regime required for Trichodesmium growth andto determine whether this light regime could be one ofthe constraining environmental factors that accountsfor the space-time distribution of Trichodesmium inthe SWP.
48
Masotti et al.: Trichodesmium photosynthesis in the SW Pacific
MATERIALS AND METHODS
To obtain a robust evaluation of the photosyntheticcharacteristics of Trichodesmium in the SWP, the photo-synthetic capacities of natural populations of Tricho-desmium were determined in the laboratory and underin situ and simulated in situ conditions.
Sampling for laboratory and simulated in situ exper-iments. All sampling was conducted at only 1 location,in Saint Marie Bay (SW New Caledonia lagoon) withinan operating area of 1 km diameter (Fig. 1). The watercolumn (10 to 15 m depth) of this lagoon area was mostoften homogeneous. Samples were collected using a35 µm-mesh plankton net towed very slowly just underthe surface for 1 to several minutes, often crossing slicksof Trichodesmium on the sea surface. The content of thecollector was gently poured into a 10 l polycarbonatebottle maintained in the dark, pending its rapid returnto the laboratory (within 20 to 30 min). On most occa-sions, the predominant species in these samples wasT. erythraeum.
Measurement of photosynthesis vs. irradiance inthe laboratory. Seven experiments were carried out inDecember 2002, in order to obtain photosynthetic pro-duction per unit biomass (PB ) vs. irradiance (I ) curves.Sampling was conducted between 07:00 and 12:00 h.PB is the amount of O2 produced or carbon fixed perhour normalized to chlorophyll a (chl a), expressed inmg O2 mg chl a–1 or mg C mg chl a–1 h–1). In the labo-ratory, freshly collected samples were dispensed into 3or 4 plastic pails, in order to facilitate the removal ofthe Trichodesmium colonies coming up to the surface.
After 3 to 6 min, colonies were removed using a micro-pipette and transferred into a 210 ml glass flask previ-ously filled with the same seawater filtered through aWhatman GF/F filter. The water in the pails was gentlystirred every 2 or 3 min to prevent colonies from stick-ing to the walls, which causes a rapid degradation ofthe cells. Incubations were carried out in a tempera-ture-controlled laboratory (with mean temperature of26.0 ± 0.2°C during incubations). The glass flask con-taining colonies was gently shaken with a magneticagitator. The flask was closed with a silicone stopperequipped with a microelectrode (Clark type, Unisense)fitted to measure the change in O2 concentration con-tinuously (every 3 s), with a 90% response time of 1 s.The flask was illuminated with 2 light projectors(Osram HLX Xenophot lamp) controlled by a lightvariator previously calibrated manually for therequired intensities using a Biospherical quantumscalar meter QSP-2000. The glass flask was kept intotal darkness during the first 5 min of incubation, andthen the light intensity (I ) was progressively increasedevery 5 min over the range of 0 to 2200 µE m–2 s–1 (12 to20 different intensities by experiment), and oxygenproduction was recorded. The duration of incubationranged between 75 and 110 min, and the flask contentwas filtered onto a GF/F filter in order to obtain chl acontent via spectrofluorometric analysis.
Analysis of photosynthesis vs. irradiance curves. Tocalculate the PB vs. I curves and the different photosyn-thetic parameters, the data points were fitted to an expo-nential model with the photoinhibition parameter propo-sed by Platt et al. (1980), using the following algorithms:
49
Fig. 1. Study area in the South-west Pacific Ocean, showing sam-pling locations (q) in the lagoon(St. Marie Bay) and offshore(SW of Nouméa, Channel, SW ofOuvea, Santal Bay in the Island
of Lifou, and NE of Lifou)
Mar Ecol Prog Ser 338: 47–59, 2007
PB = {Ps[1 – exp(–αI/Ps)] [exp(–βI /Ps)]} – R (1)
PBmax = Ps[α /(α + β)] [β /(α + β)]β /α (2)
where Ps is the scaling parameter defined as the maxi-mum potential light-saturated photosynthetic rate; α isthe photosynthetic efficiency measured by the initialslope of the PB vs. I curve; β is the photoinhibitionindex and characterizes the negative slope of the curvefor high light irradiances (Platt et al. 1980); R is the rateof dark respiration, which was added to Platt’s equa-tion to obtain the net photosynthesis; PB
max is the max-imum photosynthetic rate, equivalent to Ps when β = 0;Ik is the irradiance saturation parameter, defined asirradiance at the junction of the initial slope and PB
max;and I c is the irradiance compensation point and wascalculated by setting PB = 0 in Eq. (1). All rates werenormalized to the chl a content of the colonies.
Measurement of the photosynthetic quotient in thelaboratory. The photosynthetic quotient (PQ) wasmeasured during 30 specific experiments conductedbetween 19 November and 12 December 2003, usingthe oxygen method with the addition of a 14C tracer.14C-bicarbonate (185 kBq) was injected into the 210 mlglass flask through the stopper adapted to the O2
microelectrode. Experimental conditions were similarto those of the PB vs. I experiments, except that lightintensity was fixed at 1000 µE m–2 s–1. Incubation dura-tion was 1 h and O2 concentration was recorded every10 s. During the first 5 min of incubation, colonies wereexposed to a low light intensity (200 µE m–2 s–1), inorder to verify the good physiological state of the cells.After incubation, samples were processed as for in situ14C production measurements (see below). The chl acontent was measured in duplicate 210 ml samples.
In situ and simulated in situ primary productionmeasurements. In situ measurements were carriedout during DIAPALIS cruises as part of the DIAPA-ZON programme (DIAzotrophy PAcific ZONe, 2001 to2003). The data used here corresponded to the periodfrom December 2001 to October 2003 and to samplinglocations in the vicinity of New Caledonia (Southwestof Nouméa) and around the Loyalty Islands (LoyaltyChannel, Southwest of the Island of Ouvea; SantalBay, in the Island of Lifou; and north-east of Lifou;Fig. 1). Seawater for in situ production measurementswas collected between 04:00 and 04:30 h, using arosette of twelve 8 l Niskin bottles. Sampling depthswere positioned every 5 m between the surface and20 m depth, and then every 20 m down to a depth of100 or 120 m. New sterile 265 ml plastic bottles weregently filled directly from the Niskin bottle tap. Thetracer solution was prepared according to the proce-dure recommended by Fitzwater et al. (1982), and 185to 370 kBq of 14C-bicarbonate were added to eachexperimental bottle. For each experiment, 1 to several
samples were inoculated with 14C solution and imme-diately filtered in order to determine incorporation ofabiotic particulate 14C. The in situ array was launchedbefore sunrise and picked up at about 18:00 h. Afterincubation, samples were collected on 25 mm GF/Ffilters using a vacuum pressure of <50 hPa. Duplicatesamples were fractionated onto 10 µm polycarbonatefilters by gravity alone. Filters were then processedand counted on a liquid scintillation counter accordingto the procedure described in detail by Le Bouteilleret al. (2003).
Experiments under simulated in situ conditions wereconducted under natural light using an incubatormade of Acrylite 625-5 blue Plexiglas to reduce lightintensity to 30% of photosynthetically available radia-tion (PAR). The incubator temperature was regulatedby a circulating water system. Between 6 and 10replicate samples were taken for each experimentusing new 125 ml sterile plastic flasks; 18.5 kBq of14C-bicarbonate were added, and incubation timeranged from 30 min to 5 h. After incubation, sampleswere processed as for in situ incubations.
Pigments. For in situ experiments using the materialfrom the DIAPALIS cruises, 265 ml seawater sampleswere filtered onto GF/F filters (25 mm in diameter) fortotal pigment analysis, while 577 ml were collected forsize fractionation onto 10 µm polycarbonate filters.After filtration, the filters were stored in cryotubes andkept in a liquid nitrogen container. For pigment extrac-tion, GF/F filters were dipped in a centrifuge tube con-taining 5 ml of 93% acetone (the final concentrationwas approximately 90%, after taking into accountwater retention in the filter), ground with a freshly bro-ken end of a glass rod, and left in the dark at 4°C for a12 h extraction. Polycarbonate filters were simply leftin the dark at 4°C for 24 h in 5 ml of 90% dimethylformamide. Following extraction, the tubes were cen-trifuged for 5 min at a speed of 3500 rpm, and thefluorescence of the extracted material was measuredwith a HITACHI® F4500 spectrofluorometer. Concen-trations of chlorophyll pigments, such as monovinyl-chl a, -chl b and -chl c (c1 + c2; c3), divinyl-chl a and-chl b and phaeopigments derived from these differentchlorophylls, were assessed using a modified versionof Neveux & Lantoine’s (1993) method described byTenório et al. (2005) and Neveux et al. (2006). Onlytotal chl a (the sum of monovinyl- and divinyl-chl aconcentrations) will be considered here. The proce-dure for pigment analysis was similar for laboratoryand simulated in situ experiments, but the samplevolume was adapted to the chlorophyll content.
Trichodesmium counts. To compare the pigmentcontent with the Trichodesmium abundance duringthe DIAPALIS cruises, the contents of two 8 l Niskinbottles were entirely filtered in parallel: one for pig-
50
Masotti et al.: Trichodesmium photosynthesis in the SW Pacific
ment analysis (see above) and the other for cell counts.Trichodesmium filaments were generally collected at 4depths between 0 and 60 m by in-line gravity filtrationonto 10 µm-pore size polycarbonate filters (47 mm indiameter). The filters were introduced into glass vials(25 ml) and immediately fixed by addition of a 4%formalin solution. In the laboratory, Trichodesmiumfilaments were recovered by washing the filters withfiltered seawater and preserved with 0.4% acidformaldehyde solution. Trichodesmium filaments werecounted in the whole chamber at a magnification of100 × using an inverted microscope (Olympus IM)following the Utermöhl (1958) technique.
Particulate carbon. Aliquots (5 ml in triplicate) ofconcentrated Trichodesmium cells were directly fil-tered onto 25 mm GF/F filters for pigment analysis andonto precombusted GF/F filters for POC analysis. Thelatter filters were dried at 40°C for 24 h and later keptfrozen at –20°C until analysis. The POC concentrationwas determined on a Perkin Elmer 2400 CHN analyzer.
RESULTS
Photosynthesis vs. irradiance and photosynthetic quotient
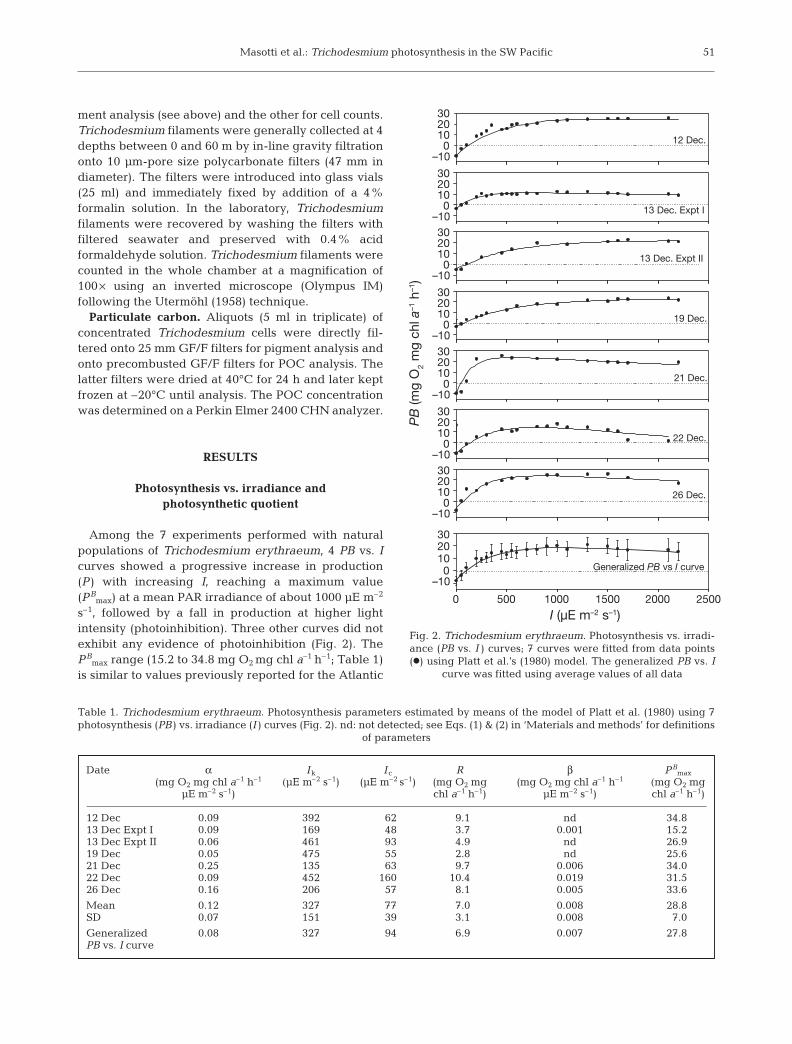
Among the 7 experiments performed with naturalpopulations of Trichodesmium erythraeum, 4 PB vs. Icurves showed a progressive increase in production(P ) with increasing I, reaching a maximum value(PB
max) at a mean PAR irradiance of about 1000 µE m–2
s–1, followed by a fall in production at higher lightintensity (photoinhibition). Three other curves did notexhibit any evidence of photoinhibition (Fig. 2). ThePB
max range (15.2 to 34.8 mg O2 mg chl a–1 h–1; Table 1)is similar to values previously reported for the Atlantic
51
0 500 1000 1500 2000 2500
0 500 1000 1500 2000 2500
0 500 1000 1500 2000 2500
0 500 1000 1500 2000 2500
I (µE m–2 s–1)0 500 1000 1500 2000 2500
–100
102030
–100
102030
–100
102030
–100
102030
–100
102030
–100
102030
–100
102030
–100
102030
12 Dec.
21 Dec.
13 Dec. Expt II
13 Dec. Expt I
19 Dec.
22 Dec.
26 Dec.
PB
(mg
O2
mg
chl a
–1 h
–1)
Generalized PB vs I curve
Fig. 2. Trichodesmium erythraeum. Photosynthesis vs. irradi-ance (PB vs. I ) curves; 7 curves were fitted from data points(d) using Platt et al.’s (1980) model. The generalized PB vs. I
curve was fitted using average values of all data
Table 1. Trichodesmium erythraeum. Photosynthesis parameters estimated by means of the model of Platt et al. (1980) using 7photosynthesis (PB ) vs. irradiance (I ) curves (Fig. 2). nd: not detected; see Eqs. (1) & (2) in ‘Materials and methods’ for definitions
Generalized 0.08 327 94 6.9 0.007 27.8PB vs. I curve
Mar Ecol Prog Ser 338: 47–59, 2007
Ocean (Carpenter et al. 1993). Most of the experimentspresented a PB
max for PAR close to 1000 µE m–2 s–1, andone curve exhibited a PB
max for PAR of 450 µE m–2 s–1.These PB
max values attained under strong irradiancesuggest high light requirements in order to reach max-imum values of photosynthesis. All experiments pre-sented a consumption of oxygen in the dark due torespiration (R ). R values ranged from 2.8 to 10.4 mg O2
mg chl a–1 h–1 (Table 1). The light compensation index(P = R ) was observed for PAR ranging from 48 to160 µE m–2 s–1. The ranges of values showed that theseR and P rates can change from day to day (Fig. 2).R seemed to be directly related to PB
max (Fig. 3). Thedecrease in production at a PAR >1600 µE m–2 s–1
showed that photoinhibition can be relatively intense,up to 80% of PB
max. These observations suggest that,paradoxically, photoinhibition would be relatively fre-quent in T. erythraeum present in surface waters.
Thirty experiments using natural Trichodesmiumerythraeum colonies were performed under fixed con-ditions of temperature (26°C) and irradiance (1000 µEm–2 s–1). Oxygen production and carbon fixation mea-sured together on the same samples were closely cor-related (R2 = 0.88). Data were best fitted with a linearregression (Fig. 4) with a slope of 1.191 (mol O2 molCO2
–1), which corresponded to the PQ.The productivity varied slightly with time in the labo-
ratory, PB values being first higher and then lower than4 mg C mg chl a–1 h–1 from the beginning to the end ofthe series (Fig. 5a). The mean calculated with all PBdata was 4.4 mg C mg chl a–1 h–1 (SD = 1.3, n = 30), witha range between 1.62 and 6.36 mg C mg chl a–1 h–1.
Photosynthesis under simulated in situ conditions
Experiments performed with Trichodesmium undersimulated in situ conditions (30% of incident PAR) dis-
played maximum PB values after midday when PARexceeded 300 µE m–2 s–1, and lower values in the earlymorning and late afternoon when PAR ranged from100 to 200 µE m–2 s–1 (Fig. 5b). Hence, PB was observedto be maximised for about 9 h, i.e. almost 60% of the
52
PBmax (mg O2 mg chl a–1 h–1)
10 15 20 25 30 35 40
R (m
g O
2 m
g ch
l a–1
h–1
)
0
2
4
6
8
10
12
Fig. 3. Trichodesmium erythraeum. Variations in dark respira-tion (R ) with maximum photosynthesis (PB
max)
Carbon fixation (µmol C µg chl a–1 h–1)
0.0 0.1 0.2 0.3 0.4 0.5 0.6
Oxy
gen
pro
duc
tion
(µm
ol O
2 µg
chl
a–1
h–1
)
0.0
0.1
0.2
0.3
0.4
0.5
0.6
0.7
0.8
Fig. 4. Trichodesmium erythraeum. Variations in photosyn-thetic oxygen production with carbon fixation rate. Slope ofthe linear regression is photosynthetic quotient PQ (1.19 mol
Fig. 5. Trichodesmium erythraeum. (a) Daily and (b) mean diel variations in production per unit biomass PB
Masotti et al.: Trichodesmium photosynthesis in the SW Pacific
summer daytime period. The mean of all PB data(n = 48) was 3.1 mg C mg chl a–1 h–1 (SD = 0.94), andmaximal PB was 5.1 mg C mg chl a–1 h–1.
C:chl a ratio
The mean C:chl a ratio measured from concentratedaliquots (in triplicate) of Trichodesmium erythraeumcolonies collected at the sea surface was 188 g C gchl a–1 (SD = 52, n = 11 samples). This C:chl a ratio isespecially important when calculating growth ratein terms of carbon from CO2 fixation and chlorophyllcontent of Trichodesmium cells.
Photosynthesis under in situ conditions
Trichodesmium abundances were determined insummer (February) at 4 depths (0, 20, 40 and 60 m)and at 4 locations (Santal Bay, north-east of Lifou,Southwest of Ouvea and Southwest of Nouméa) andin winter (August) at 4 depths (0, 20, 50 and 80 m) at2 locations (Santal Bay and Loyalty Channel) (Fig. 1).In summer, the mixed layer was shallow (ca. 40 m),and abundances were on average 2390 trichomes l–1
(SD = 1400, n = 16) in the upper water column (0 to
40 m) and about 2-fold lower at 60 m. The maximumvalue was observed at the Southwest Ouvea station(4578 trichomes l–1) (Fig. 6a). In winter, the mixedlayer was generally deep (100 or 120 m) and abun-dances ranged from 38 to 76 trichomes l–1 (Fig. 6c).In the >10 µm size fraction (or Trichos biomass;Fig. 6), which mainly comprised Trichodesmium tri-chomes and colonies in such waters (J. Neveux pers.comm.), the summer chl a concentration rangedbetween 0.010 and 0.260 mg m–3 in the first 40 m(Fig. 6b). The percentage of chl a in the >10 µm sizefraction varied from 9 to 83% of total chl a inthe upper layer (0 to 40 m) with a mean of 46%(SD = 20%), decreasing to 6% on average at 80 m(Fig. 6b). Such a result suggests a frequent predomi-nance of Trichodesmium populations in summer inthe upper layer with respect to other phytoplanktonspecies such as Synechococcus, Prochlorococcus andpicoeukaryotes typical of this region, as shown by LeBouteiller et al. (2003). In winter, chl a (>10 µm)remained around 7.5% (Fig. 6d), corresponding tolow Trichodesmium abundance. Summer experi-ments showed that, at the 4 locations, PB in the>10 µm size fraction generally increased from thesurface to depths of 10 or 20 m and then decreasedwith increasing depth (Fig. 7a). The mean summermaximum PB (PBmax) measured in situ was 3.3 mg
53
0.0 0.1 0.2 0.3 0.4 0.5
0.0 0.1 0.2 0.3 0.4 0.50.0 0.1 0.2
0.0 0.1 0.2
0
20
40
60
80
100
120
Abundance (trichomes l–1)
0 1000 2000 3000 4000 5000 6000
0 1000 2000 3000 4000 5000 6000
Dep
th (m
)
0
20
40
60
80
100
120
NE LifouSantal BaySW OuveaSW Nouméa
Biomass (mg chl a m–3)
a) b)
c) d)
Trichos biomass Total biomass % Trichos biomass/total biomass
0 20 40 60 80 100
0 20 40 60 80 100
Fig. 6. Trichodesmium spp. Abundance and biomass (chl a in >10 µm size fraction, Trichos biomass) and total biomass (all phyto-plankton) during (a,b) summer (February 2003) and (c,d) winter (August 2002). See Fig. 1 for sampling locations
Mar Ecol Prog Ser 338: 47–59, 2007
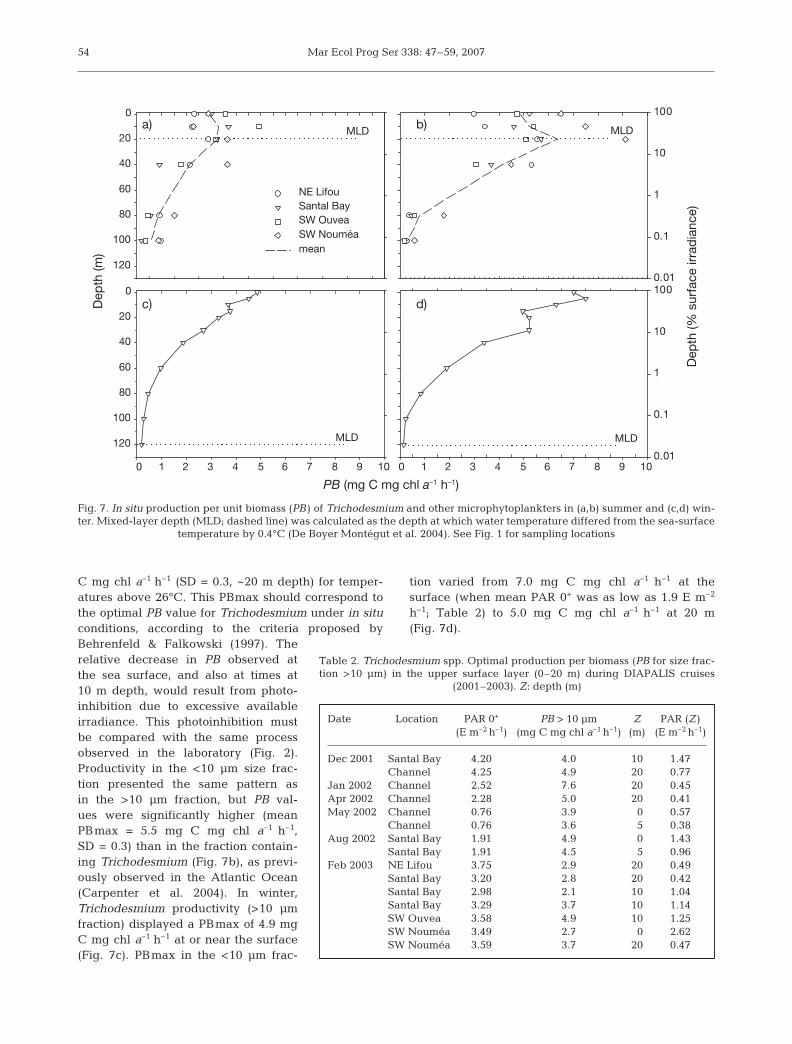
C mg chl a–1 h–1 (SD = 0.3, ~20 m depth) for temper-atures above 26°C. This PBmax should correspond tothe optimal PB value for Trichodesmium under in situconditions, according to the criteria proposed byBehrenfeld & Falkowski (1997). Therelative decrease in PB observed atthe sea surface, and also at times at10 m depth, would result from photo-inhibition due to excessive availableirradiance. This photoinhibition mustbe compared with the same processobserved in the laboratory (Fig. 2).Productivity in the <10 µm size frac-tion presented the same pattern asin the >10 µm fraction, but PB val-ues were significantly higher (meanPBmax = 5.5 mg C mg chl a–1 h–1,SD = 0.3) than in the fraction contain-ing Trichodesmium (Fig. 7b), as previ-ously observed in the Atlantic Ocean(Carpenter et al. 2004). In winter,Trichodesmium productivity (>10 µmfraction) displayed a PBmax of 4.9 mgC mg chl a–1 h–1 at or near the surface(Fig. 7c). PBmax in the <10 µm frac-
tion varied from 7.0 mg C mg chl a–1 h–1 at thesurface (when mean PAR 0+ was as low as 1.9 E m–2
h–1; Table 2) to 5.0 mg C mg chl a–1 h–1 at 20 m(Fig. 7d).
54
Dep
th (m
)0
20
40
60
80
100
120
Dep
th (%
sur
face
irra
dia
nce)
NE LifouSantal BaySW OuveaSW Nouméamean
0.01
0.1
1
10
100
0.01
0.1
1
10
100
PB (mg C mg chl a–1 h–1)
0 1 2 3 4 5 6 7 8 9 10 0 1 2 3 4 5 6 7 8 9 10
0
20
40
60
80
100
120 MLD MLD
MLD MLDa) b)
c) d)
Fig. 7. In situ production per unit biomass (PB ) of Trichodesmium and other microphytoplankters in (a,b) summer and (c,d) win-ter. Mixed-layer depth (MLD; dashed line) was calculated as the depth at which water temperature differed from the sea-surface
temperature by 0.4°C (De Boyer Montégut et al. 2004). See Fig. 1 for sampling locations
Table 2. Trichodesmium spp. Optimal production per biomass (PB for size frac-tion >10 µm) in the upper surface layer (0–20 m) during DIAPALIS cruises
(2001–2003). Z: depth (m)
Date Location PAR 0+ PB > 10 µm Z PAR (Z )(E m–2 h–1) (mg C mg chl a–1 h–1) (m) (E m–2 h–1)
Dec 2001 Santal Bay 4.20 4.0 10 1.47Channel 4.25 4.9 20 0.77
Masotti et al.: Trichodesmium photosynthesis in the SW Pacific
DISCUSSION
Photosynthesis vs. irradiance and the photosyntheticcharacteristics of Trichodesmium
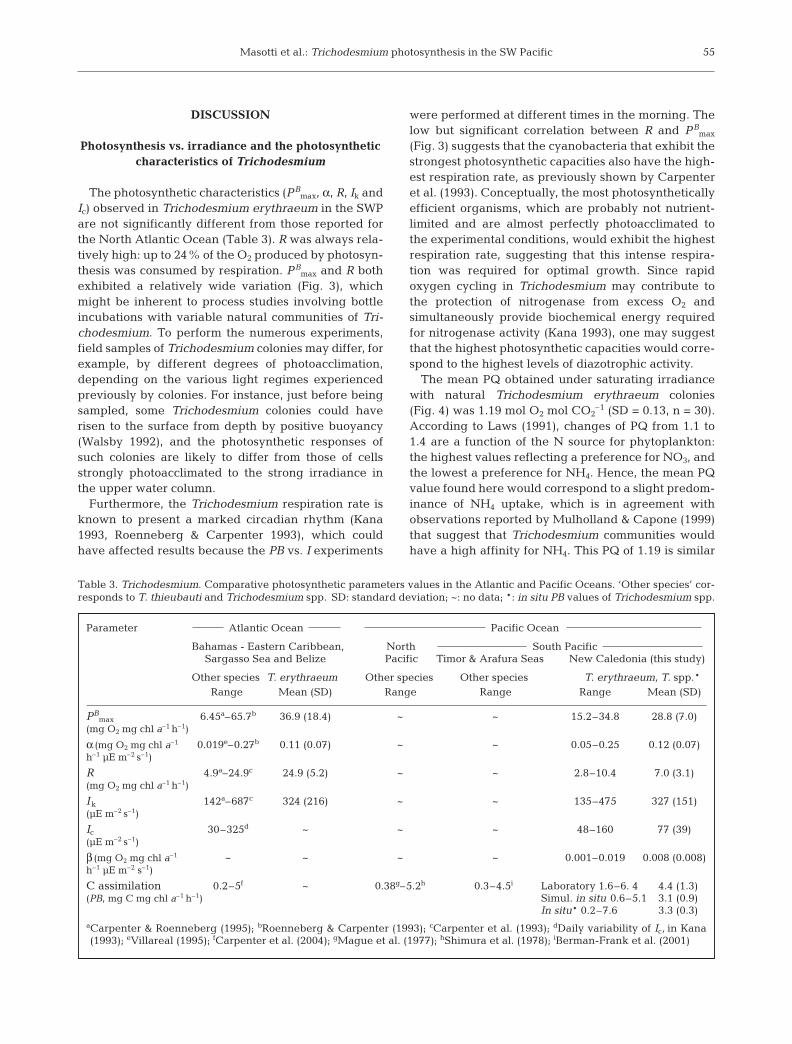
The photosynthetic characteristics (PBmax, α, R, Ik and
Ic) observed in Trichodesmium erythraeum in the SWPare not significantly different from those reported forthe North Atlantic Ocean (Table 3). R was always rela-tively high: up to 24% of the O2 produced by photosyn-thesis was consumed by respiration. PB
max and R bothexhibited a relatively wide variation (Fig. 3), whichmight be inherent to process studies involving bottleincubations with variable natural communities of Tri-chodesmium. To perform the numerous experiments,field samples of Trichodesmium colonies may differ, forexample, by different degrees of photoacclimation,depending on the various light regimes experiencedpreviously by colonies. For instance, just before beingsampled, some Trichodesmium colonies could haverisen to the surface from depth by positive buoyancy(Walsby 1992), and the photosynthetic responses ofsuch colonies are likely to differ from those of cellsstrongly photoacclimated to the strong irradiance inthe upper water column.
Furthermore, the Trichodesmium respiration rate isknown to present a marked circadian rhythm (Kana1993, Roenneberg & Carpenter 1993), which couldhave affected results because the PB vs. I experiments
were performed at different times in the morning. Thelow but significant correlation between R and PB
max
(Fig. 3) suggests that the cyanobacteria that exhibit thestrongest photosynthetic capacities also have the high-est respiration rate, as previously shown by Carpenteret al. (1993). Conceptually, the most photosyntheticallyefficient organisms, which are probably not nutrient-limited and are almost perfectly photoacclimated tothe experimental conditions, would exhibit the highestrespiration rate, suggesting that this intense respira-tion was required for optimal growth. Since rapidoxygen cycling in Trichodesmium may contribute tothe protection of nitrogenase from excess O2 andsimultaneously provide biochemical energy requiredfor nitrogenase activity (Kana 1993), one may suggestthat the highest photosynthetic capacities would corre-spond to the highest levels of diazotrophic activity.
The mean PQ obtained under saturating irradiancewith natural Trichodesmium erythraeum colonies(Fig. 4) was 1.19 mol O2 mol CO2
–1 (SD = 0.13, n = 30).According to Laws (1991), changes of PQ from 1.1 to1.4 are a function of the N source for phytoplankton:the highest values reflecting a preference for NO3, andthe lowest a preference for NH4. Hence, the mean PQvalue found here would correspond to a slight predom-inance of NH4 uptake, which is in agreement withobservations reported by Mulholland & Capone (1999)that suggest that Trichodesmium communities wouldhave a high affinity for NH4. This PQ of 1.19 is similar
55
Table 3. Trichodesmium. Comparative photosynthetic parameters values in the Atlantic and Pacific Oceans. ‘Other species’ cor-responds to T. thieubauti and Trichodesmium spp. SD: standard deviation; ~: no data; *: in situ PB values of Trichodesmium spp.
Parameter Atlantic Ocean Pacific Ocean
Bahamas - Eastern Caribbean, North South PacificSargasso Sea and Belize Pacific Timor & Arafura Seas New Caledonia (this study)
Other species T. erythraeum Other species Other species T. erythraeum, T. spp.*Range Mean (SD) Range Range Range Mean (SD)
C assimilation 0.2–5f ~ 0.38g–5.2h 0.3–4.5i Laboratory 1.6–6. 4 4.4 (1.3)(PB, mg C mg chl a–1 h–1) Simul. in situ 0.6–5.1 3.1 (0.9)
In situ* 0.2–7.6 3.3 (0.3)aCarpenter & Roenneberg (1995); bRoenneberg & Carpenter (1993); cCarpenter et al. (1993); dDaily variability of Ic, in Kana(1993); eVillareal (1995); fCarpenter et al. (2004); gMague et al. (1977); hShimura et al. (1978); iBerman-Frank et al. (2001)
Mar Ecol Prog Ser 338: 47–59, 2007
to the value of 1.2 that is commonly accepted as typicalfor most phytoplankton (Laws 1991). However, thisvalue of PQ is nearly 2-fold higher than those reportedby Carpenter & Roenneberg (1995) for Trichodesmiumspp. in the Caribbean Sea. The PQ may be influencedby excretion of C and N (Laws 1991); however, we didnot measure excretion in the present study. If not dueto a difference in experimental protocol, such a dis-crepancy is difficult to account for without moreinformation.
In situ primary productivity of Trichodesmium
In the open SWP, the vertical profiles of in situ pri-mary productivity for the >10 µm size fraction contain-ing Trichodesmium trichomes and colonies exhibitedPBmax values that ranged from 2 to 7.6 mg C mg chla–1 h–1 (Table 2). Photoinhibition (ca. 10% of PBmax)affected Trichodesmium photosynthesis in the upperwater column, as determined from PAR values (Fig. 7a)that, when averaged over the daytime, exceeded about500 µE m–2 s–1. This photoinhibition decreased orcompletely vanished in cloudy weather, especially inwinter (Fig. 7c). As a consequence, PBmax generallyoccurred at about 20 m depth and rose towards the sur-face in response to any occasional decrease in the inci-dent irradiance. The climatological variations of PARpresent a maximum/minimum seasonal amplitude of1.4 at the latitude of the studied region (21 to 22° S).Clearly, the photoinhibition evidenced both in situ andin the laboratory (Fig. 2) might dramatically affect themassive surface accumulations of Trichodesmium dur-ing blooms. In summer, as in winter, all the verticalprofiles of productivity showed the same pattern, witha regular decrease in PB values from PBmax to the bot-tom of the euphotic layer, whose depth varied between60 and 95 m (Fig. 7a,c). Much the same range of valuesand the same variation in productivity were observedin Trichodesmium during a series of 3 cruises in thetropical North Atlantic (Carpenter et al. 2004). SimilarPB values were also reported from 2 days of experi-ments on T. erythraeum colonies conducted in theTimor and Arafura Seas in the western equatorialPacific (Berman-Frank et al. 2001).
The similarity between in situ and simulated in situproductivity values suggests that, in spite of differentenvironments (lagoon and open-ocean) and species, allTrichodesmium populations present equivalent photo-synthetic performances in the region. The mean PBmaxvalue (3.3 mg C mg chl a–1 h–1, SD = 0.3) from in situincubations did not differ significantly from results ofsimulated in situ experiments (PBmax = 3.1 mg C mgchl a–1 h–1, SD = 0.9), whereas laboratory experimentsproduced a slightly higher mean PBmax (4.4 mg C mg
chl a–1 h–1, SD = 1.3) under optimal light and tem-perature conditions. PBmax observed in situ wouldcorrespond to the Trichodesmium optimal productivityunder favourable light conditions, following Behren-feld & Falkowski’s (1997) criteria. All these results leadto the conclusion that the photosynthetic capacities ofTrichodesmium do not differ significantly between theAtlantic and the Pacific, and appear to be characteris-tic of this genus. In the future it would be interesting toconsider these particular photosynthetic characteris-tics in the ocean models that include Trichodesmiumand N2 fixation, as well as in models of carbon andnitrogen cycles.
The optimal PB of Trichodesmium measured in the>10 µm size fraction (Fig. 7a,c) was generally lowerthan the PB of the <10 µm fraction, containing nano-and picoplankton communities (Fig. 7b,d). This smallfraction is mainly composed of Synechococcus, Pro-chlorococcus and picoeukaryotes, whose distributionsin the western tropical Pacific have been described indetail by Le Bouteiller et al. (1992). The difference inPBmax between the >10 and <10 µm fractions may becompared with observations made in the NorthAtlantic: using quite different experimental proce-dures, Carpenter et al. (2004) found that the PBmaxvalues of isolated Trichodesmium colonies were 2 to4 times lower than PBmax measured in samples with-out colonies. They suggested that, in spite of Tricho-desmium ’s active photosynthesis, a relatively lowPBmax could be due to a weak efficiency of carbonmetabolism and assimilation. This low efficiency couldresult from a strong excretion rate (Li et al. 1980) or ahigh respiration rate (Kana 1993). However, othercauses of variability may explain low PB.
According to Laws & Wong (1978), PB may be writ-ten as the product of the fractional rate of increase incellular C and the C:chl a ratio:
PB = (1/C × dC/dt)(C/chl a)
where C is the cell carbon content in Trichodesmium.On average, the term ‘1/C × dC/dt ’ can be approxi-mated by the growth rate (μ). Assuming that theC:chl a ratio is more or less equal in all phytoplanktonsubjected to the same light regime in the upper watercolumn, then PB would be positively correlated withgrowth rate. In the SWP, the mean C:chl a ratio of Tri-chodesmium sampled at the sea surface was 188 g C gchl a–1 (SD = 52), which is not significantly differentfrom the C:chl a ratio estimated for the <3 µm size frac-tion at the sea surface in the western equatorial Pacificby Le Bouteiller et al. (2003) (144 g C g chl a–1, SD =40). As reflected by lower PBmax, Trichodesmiumwould have a slower growth rate than the other phyto-plankters. In the SWP, the Trichodesmium growth ratewas estimated as ranging between 0.18 and 0.32 d–1
56
Masotti et al.: Trichodesmium photosynthesis in the SW Pacific
(mean 0.21 d–1) in optimal light conditions, whereas μin phytoplankton as a whole averaged 0.55 d–1 at sub-surface depths in the western equatorial Pacific (LeBouteiller et al. 2003).
High light requirements for Trichodesmium growth
Under simulated in situ conditions, the productivityof Trichodesmium was maximised when PAR ex-ceeded 300 µE m–2 s–1 (Fig. 5b). This irradiance is inagreement with the photosynthetic saturation para-meter (Ik = 327 µE m–2 s–1, SD = 151) obtained from PBvs. I experiments with T. erythraeum (Table 1). Thismean Ik value is similar to those reported for Tricho-desmium in previous studies conducted in the AtlanticOcean (see Table 3; Carpenter et al. 1993, Carpenter &Roenneberg 1995). Typically, this Ik value is muchhigher than the Ik for cultures of Synechococcus (range77 to 130; Glover et al. 1987), for Prochlorococcus(range 40 to 80; Moore & Chisholm 1999) and for pi-coeukaryotes (range 143 to 267; Glover et al. 1987).Field data may be used to determine at what depthssuch light levels are observed in the studied region.At the latitude of the study and in clear weather, themean incident daytime irradiance PAR 0+ ranges be-tween ~625 and 1200 µE m–2 s–1 in winter and summerrespectively. Taking these changes into account andassuming a constant mean incident radiation through-out the daytime, the mean optimal PAR of 300 µE m–2
s–1 was estimated (depending on the range of potentialeuphotic layer depths, which could vary from 60 to95 m) to be available at depths between 10 and 20 m inwinter, and between 15 and 25 m in summer. Thus, infine weather, the optimal depth for Trichodesmiumphotosynthesis in the region would be between 10 and25 m. In cloudy weather, and depending on cloud-cover intensity and duration, this optimal light levelbecomes more shallow, eventually occupying the sur-face. In situ measurements showed that the PBmax ofTrichodesmium was systematically observed at orabove a depth of 20 m, exactly as expected from resultsof simulated in situ and laboratory experiments.
As for Ik, the depth at which the available solar radi-ation equalled Ic was estimated in the water column. Ic
was chosen as the lowest value found in the SWP (Ic =48 µE m–2 s–1; Table 1, 13 December, Expt I). Hence,the depth at which O2 consumption by Trichodesmiumrespiration equals O2 production by photosynthesis isthe compensation depth, and was conservatively esti-mated to range between 20 m in winter, in the case ofa shallow euphotic zone (60 m), and 55 m in summer,when the euphotic zone was deepest (95 m). The appli-cation of the results of PB vs. I experiments to fieldobservations leads us to conclude that the maximum
depth of the photosynthetic layer for Trichodesmiumis quite shallow, even without any cloud cover, and ismost often between depths of 40 and 50 m. Theseresults suggest that Trichodesmium would not presentany significant growth below a specific compensationdepth situated well above the compensation depthof most other typical tropical phytoplankton species,which is classically defined as the bottom of theeuphotic layer.
Field data showed that, in agreement with their pho-tosynthetic characteristics, Trichodesmium generallypredominated in the top 20 or 30 m layer, as alsoobserved in the Atlantic (Carpenter et al. 2004). How-ever, colonies were at times observed to be relativelyabundant at depths of 40 m or even 60 m (Fig. 6a), i.e.at the level of or quite below the compensation depth,which is also close to the bottom of the mixed layer insummer. Although no acclimation was demonstrated atdepth during the same field study (Neveux et al. 2006),some acclimation may occur in Trichodesmium col-onies, allowing them to photosynthesize under condi-tions of low PAR. This hypothesis is supported by insitu observational data that indicated that a significantcarbon fixation in the >10 µm fraction occurred at 80 mor even 100 m depth (Fig. 7a,c). However, this carbonfixation does not necessarily signify a positive netcarbon production. The extremely low photosyntheticrate detected under a very dim light regime probablydoes not allow Trichodesmium to sustain any signifi-cant development of populations at a depth close to thebottom of the euphotic zone, and hence would nothave any effect in the food web.
In some cases, and in spite of their potential positivebuoyancy (Walsby 1992), some colonies could havebeen swept downward by eddy-induced convergentmotions related to the circulation of the South Equato-rial Current, which flows over or among the numerousseamounts and islands of the New Caledonian archi-pelago. Similarly, Trichodesmium colonies have beendetected at depth in cyclonic eddies of the AtlanticOcean (Davis & McGillicuddy 2006). In addition, vari-able buoyancy has been put forward to explain howTrichodesmium colonies could migrate through thewater column (Walsby 1992), possibly in order to minenutrients abundant at the depth of the nutricline (Le-telier & Karl 1998). However, Trichodesmium colonieswere generally observed to be scarce or totally absentat 80 m in the SWP, precisely at a depth where phos-phate generally appears in the region (Moutin et al.2005). On the contrary, its admittedly strong energyrequirements force Trichodesmium to stay in the upperwater column. Only the organisms present in thisupper layer would have the capacity to succeed in cel-lular division in adequate time to maintain or improvethe population. Furthermore, results of the present
57
Mar Ecol Prog Ser 338: 47–59, 2007
study are in agreement with most previous field stud-ies in considering that the Trichodesmium growth rate,even under the best light regime, is typically slow, withat best 1 cellular division every 2 or 3 d. Therefore,such a slow growth rate determines the time-scale ofthe population dynamics of Trichodesmium. To be ableto proceed with cell division, Trichodesmium coloniesrequire a strong incident radiation; in addition, suchenergy must be available for a long time, enough forcell division to be effective, i.e. at least 2 or 3 consecu-tive days. That is the reason why the vertical stratifica-tion of the water column is so important for maintain-ing Trichodesmium at the optimum light level for atime period sufficient for the necessary photoacclima-tion and cell division.
Hood et al. (2001) conceived a mathematical modelthat relates the seasonal variations in Trichodesmiumconcentration to the seasonal changes in both lightavailability and stratification of the water column. Thismodel was applied to North Atlantic observations,where Trichodesmium abundance seems to be effec-tively higher when the mixed layer is shallower duringthe summer/early autumn, and where concentrationsare much lower in winter/early spring when lightavailability is low and deep mixing occurs. Such obser-vations suggest that the capacity of Trichodesmium toregulate its buoyancy is not sufficient to maintain tri-chomes at a constant light level in a turbulent mixedlayer. In contrast, if the light regime is propitious overan extended time with optimal nutrient availability,cells divide and the Trichodesmium population slowlygrows, and a gradual development of the biomassoccurs. However, in an oligotrophic environmentwhere all auto- and heterotrophic organisms arestrongly interdependent, an increase in the biomass ofa particular compartment of the food-web is only pos-sible if the growth rate exceeds the loss rate. The lossrate of Trichodesmium due to grazing would be highlydependent on biomass, being low when colonies arescarce and potentially high during blooms (O’Neil1998). In the SWP, concentrations of Trichodesmiumare relatively low and most Trichodesmium is presentas free trichomes. Furthermore, the main grazer of Tri-chodesmium, the copepod Macrosetella gracilis, hasnever been observed in the 5 l samples used for count-ing trichomes (M. Tenório pers. comm.). The loss rateby sedimentation has been observed to be very low inthe NW Pacific (Wu et al. 2003) and in the SWP, whereneither Trichodesmium colonies nor specific pigmenttraces have been detected in sediment traps deployedduring our study (M. Rodier pers. comm.). These obser-vations suggest that, in the SWP, the loss rate due tograzing and sedimentation would be slower than theTrichodesmium growth rate, at least when the lightregime is optimal in the summer period.
Acknowledgements. We thank O. Pringault, E. Rochelle-Newall and M. Tenório for their help with laboratory experi-ments. Thanks to C. Provost and the Support Committee forintegrating the present study into the team programmeDynamique de l’Océan et Climat (DOC, LOCEAN). We alsothank the crew of RV ‘Alis’ for their outstanding shipboardsupport for the operations at sea. This study was supported bythe Institut de Recherche pour le Développement (IRD), INSUand by the French programme PROOF (PROcessus bio-géochimiques dans l’Océan et Flux).
LITERATURE CITED
Behrenfeld MJ, Falkowski PG (1997) A consumer’s guide tophytoplankton primary production models. LimnolOceanogr 42:1479–1491
Berman-Frank I, Cullen JT, Shaked Y, Sherrell RM, Fal-kowski PG (2001) Iron availability, cellular iron quotas,and nitrogen fixation in Trichodesmium. Limnol Oceanogr46:1249–1260
Bowman TE, Lancaster LJ (1965) A bloom of the planktonicblue-green alga, Trichodesmium erythraeum, in theTonga Islands. Limnol Oceanogr 10:291–293
Campbell L, Carpenter EJ, Montoya JP, Kustka AB, CaponeDG (2005) Picoplankton community structure within andoutside a Trichodesmium bloom in the southwesternPacific Ocean. Vie Milieu 55:185–195
Capone DG, Burns JA, Montoya JP, Subramaniam A, Mahaf-fey C, Gunderson T, Michaels AF, Carpenter EJ (2005)Nitrogen fixation by Trichodesmium spp.: an importantsource of new nitrogen to the tropical and subtropicalNorth Atlantic Ocean. Global Biogeochem Cycles 19:GB2024, doi:10.1029/2004GB002331
Carpenter EJ, Roenneberg T (1995) The marine planktoniccyanobacteria Trichodesmium spp.: photosynthetic ratemeasurements in the NW Atlantic Ocean. Mar Ecol ProgSer 118:267–273
Carpenter EJ, O’Neil JM, Dawson R, Capone DG, Siddiqui PJA,Roenneberg T, Bergman B (1993) The tropical diazotrophicphytoplankter Trichodesmium: biological characteristics oftwo common species. Mar Ecol Prog Ser 95:295–304
Carpenter EJ, Subramaniam A, Capone DG (2004) Biomassand primary productivity of the cyanobacterium Tricho-desmium spp. in the tropical N Atlantic Ocean. Deep-SeaRes I 51:173–203
Codispoti LA, Brandes JA, Christensen JP, Devol AH, NaquiSWA, Paerl HW, Yoshinari T (2001) The oceanic fixednitrogen and nitrous oxide budgets: moving targets as weenter the anthropocene? Sci Mar 65:85–105
Davis CS, McGillicuddy DJ (2006) Transatlantic abundance ofthe N2-fixing colonial cyanobacterium Trichodesmium.Science 312:1517–1520
De Boyer Montégut C, Madec G, Fischer AS, Lazar A, Iudi-cone D (2004) Mixed layer depth over the global ocean:an examination of profile data and a profile-basedclimatology. J Geophys Res 109:C12003, doi:10.1029/2004JC002378
Dupouy C, Petit M, Dandonneau Y (1988) Satellite detectedcyanobacteria bloom in the southwestern tropical Pacific.Implication for oceanic nitrogen fixation. Int J RemoteSens 9:389–396
Dupouy C, Dirgerg G, Tenório M, Neveux J, Le Bouteiller A(2004) Surveillance des Trichodesmium autour de la
58
Masotti et al.: Trichodesmium photosynthesis in the SW Pacific
Nouvelle-Calédonie, du Vanuatu, de Fidji et de Tonga(1998–2004). Arch Sci Mer 7
Eppley RW, Peterson BJ (1979) Particulate organic matter fluxand planktonic new production in the deep ocean. Nature282:677–680
Fitzwater SE, Knauer GA, Martin JH (1982) Metal contamina-tion and its effect on primary production measurements.Limnol Oceanogr 27:544–551
Glover HE, Keller MD, Spinrad RW (1987) The effects of lightquality and intensity on photosynthesis and growth ofmarine eukaryotic and prokaryotic phytoplankton clones.J Exp Mar Biol Ecol 105:137–159
Hood RR, Bates NR, Capone DG, Olson DB (2001) Modelingthe effect of nitrogen fixation on carbon and nitrogenfluxes at BATS. Deep-Sea Res II 48:1609–1648
Kana TM (1993) Rapid oxygen cycling in Trichodesmiumthiebautii. Limnol Oceanogr 38:18–24
Karl D, Michaels A, Bergman B, Capone D and 6 others (2002)Dinitrogen fixation in the world’s oceans. Biogeochemistry57/58:47–98
LaRoche J, Breitbarth E (2005) Importance of the diazotrophsas a source of new nitrogen in the ocean. J Sea Res 53:67–91
Laws EA (1991) Photosynthetic quotients, new productionand net community production in the open ocean. Deep-Sea Res 38:143–167
Laws EA, Wong DC (1978) Studies of carbon and nitrogenmetabolism by three marine phytoplankton species innitrate-limited continuous culture. J Phycol 14:406–416
Le Bouteiller A, Blanchot J, Rodier M (1992) Size distributionpatterns of phytoplankton in the western Pacific: towardsa generalization for the tropical open ocean. Deep-Sea Res39:805–823
Le Bouteiller A, Leynaert A, Landry M, Le Borgne R,Neveux J, Rodier M, Blanchot J, Brown SL (2003) Pri-mary production, new production, and growth rate inthe equatorial Pacfic: changes from mesotrophic to olig-otrophic regime. J Geophys Res 108:8141, doi:101029/2001J000914
Letelier RM, Karl DM (1998) Trichodesmium spp. physiologyand nutrient fluxes in the North Pacific subtropical gyre.Aquat Microb Ecol 15:265–276
Li WKW, Glover HE, Morris I (1980) Physiology of carbonphotoassimilation by Oscillatoria thiebautii in the Carib-bean Sea. Limnol Oceanogr 25:447–456
Mague TH, Mague FC, Holm-Hansen O (1977) Physiologyand chemical composition of nitrogen-fixing phytoplank-ton in the central North Pacific Ocean. Mar Biol 41:213–227
Moore LR, Chisholm SW (1999) Photophysiology of themarine cyanobacterium Prochlorococcus: ecotypic differ-ences among cultured isolates. Limnol Oceanogr 44:628–638
Moutin T, Van den Broeck N, Beker B, Dupouy C, RimmelinP, Le Bouteiller A (2005) Phosphate availability controlsTrichodesmium spp. biomass in the SW Pacific Ocean.Mar Ecol Prog Ser 207:15–21
Mulholland MR, Capone DG (1999) Nitrogen fixation, uptakeand metabolism in natural and cultured populations ofTrichodesmium spp. Mar Ecol Prog Ser 188:33–49
Mulholland MR, Floge S, Carpenter EJ, Capone DG (2002)Phosphorus dynamics in cultures and natural popula-tions of Trichodesmium spp. Mar Ecol Prog Ser 239:45–55
Nakayama E, Obata H, Okamura K, Isshiki K, Karatani H,Kimoto T (1995) Iron and manganese in the atmosphereand oceanic waters. In: Sakai H, Osaki N (eds) Biogeo-chemical processes and ocean flux in the western Pacific.Terra Scientific Publishing Company (TERRAPUB), Tokyo,p 53–68
Neveux J, Tenório M, Dupouy C, Villareal TA (2006) Spectraldiversity of phycoerythrins and diazotroph abundance intropical waters. Limnol Oceanogr 51:1689–1698
O’Neil JM (1998) The colonial cyanobacterium Trichodes-mium as a physical and nutritional substrate for theharpacticoid copepod Macrosetella gracilis. J PlanktonRes 20:43–59
Platt T, Gallegos CL, Harrison WG (1980) Photoinhibition ofphotosynthesis in natural assemblages of marine phyto-plankton. J Mar Res 38:687–701
Revelante N, Gilmartin M (1982) Dynamics of phytoplank-ton in the Great Barrier Reef lagoon. J Plankton Res 4:47–76
Roenneberg T, Carpenter EJ (1993) Daily rhythm of O2-evolu-tion in the cyanobacterium Trichodesmium thiebautiiunder natural and constant conditions. Mar Biol 117:693–697
Shimura S, Yamaguchi Y, Aruga Y, Fujita Y, Ichimura S (1978)Extracellular release of photosynthetic products by apelagic blue-green alga, Trichodesmium thiebautii.J Oceanogr Soc Jpn 34:181–188
Sournia A (1968) La cyanophycée Oscillatoria (= Tricho-desmium) dans le plancton marin. Nova Hedwigia 15:1–12
Tenório MB, Le Borgne R, Rodier M, Neveux J (2005) Theimpact of terrigeneous inputs on the Bay of Ouinné (NewCaledonia) phytoplankton communities: a spectrofluoro-metric and microscopic approach. Estuar Coast Shelf Sci64:531–545
Utermöhl H (1958) Zur Vervollkommnung der quantitativenPhytoplankton-Methodik. Mitt Int Ver Limnol 9:1–38
Van den Broeck N, Moutin T, Rodier M, Le Bouteiller A (2004)Seasonal variations of phosphate availability in the SWPacific Ocean near New Caledonia. Mar Ecol Prog Ser268:1–12
Villareal TA (1995) Abundance and photosynthetic character-istics of Trichodesmium spp. along the Atlantic BarrierReef at Carrie Bow Cay, Belize. PSZN I: Mar Ecol 16:259–271
Walsby AE (1992) The gas vesicles and buoyancy of Trichodes-mium. In: Carpenter EJ, Capone D, Rueter J (eds) Marinepelagic cyanobacterium: Trichodesmium and other diazo-trophs. Kluwer Academic, Dordrecht, p 141–162
Wu J, Sunda W, Boyle EA, Karl DM (2000) Phosphate deple-tion in the western North Atlantic Ocean. Science 289:759–762
Wu J, Chung SW, Wen LS, Liu KK, Lee Chen YL, Chen HY,Karl DM (2003) Dissolved inorganic phosphorus, dissolvediron, and Trichodesmium in the oligotrophic South ChinaSea. Global Biogeochem Cycles 17:1008, doi:10.1029/2002GB001924
59
Editorial responsibility: Alain Vézina (Contributing Editor),Dartmouth, Nova Scotia, Canada
Submitted: May 12, 2006; Accepted: October 2, 2006Proofs received from author(s): May 4, 2007