Louisiana State University LSU Digital Commons LSU Master's eses Graduate School 2007 Phylogenetic systematics, biogeography, and evolutionary ecology of the true crocodiles (Eusuchia: Crocodylidae: Crocodylus) Jamie Richard Oaks Louisiana State University and Agricultural and Mechanical College Follow this and additional works at: hps://digitalcommons.lsu.edu/gradschool_theses is esis is brought to you for free and open access by the Graduate School at LSU Digital Commons. It has been accepted for inclusion in LSU Master's eses by an authorized graduate school editor of LSU Digital Commons. For more information, please contact [email protected]. Recommended Citation Oaks, Jamie Richard, "Phylogenetic systematics, biogeography, and evolutionary ecology of the true crocodiles (Eusuchia: Crocodylidae: Crocodylus)" (2007). LSU Master's eses. 674. hps://digitalcommons.lsu.edu/gradschool_theses/674
Transcript
Louisiana State UniversityLSU Digital Commons
LSU Master's Theses Graduate School
2007
Phylogenetic systematics, biogeography, andevolutionary ecology of the true crocodiles(Eusuchia: Crocodylidae: Crocodylus)Jamie Richard OaksLouisiana State University and Agricultural and Mechanical College
Follow this and additional works at: https://digitalcommons.lsu.edu/gradschool_theses
This Thesis is brought to you for free and open access by the Graduate School at LSU Digital Commons. It has been accepted for inclusion in LSUMaster's Theses by an authorized graduate school editor of LSU Digital Commons. For more information, please contact [email protected].
Recommended CitationOaks, Jamie Richard, "Phylogenetic systematics, biogeography, and evolutionary ecology of the true crocodiles (Eusuchia:Crocodylidae: Crocodylus)" (2007). LSU Master's Theses. 674.https://digitalcommons.lsu.edu/gradschool_theses/674
PHYLOGENETIC SYSTEMATICS, BIOGEOGRAPHY, AND EVOLUTIONARY ECOLOGY OF THE TRUE CROCODILES (EUSUCHIA: CROCODYLIDAE: CROCODYLUS)
A Thesis
Submitted to the Graduate Faculty of the Louisiana State University and
Agricultural and Mechanical College in partial fulfillment of the
requirements for the degree of Master of Science
in
The Department of Biological Sciences
by Jamie Richard Oaks
B.S., University of Wisconsin Oshkosh, 2004 August 2007
ii
ACKNOWLEDGMENTS
I would like to thank the members of my advisory committee, Christopher Austin, Robb
Brumfield, Mark Hafner, and Fred Sheldon for their patience and helpful advice. I especially
acknowledge Robb for his generosity with computer software and resources, and help with
primer design, lab protocols, computer programming, and analyses. For tissue samples, I thank
the crew of the LSUMNS Genetic Resources Collection: Donna Dittmann, Robb Brumfield, and
Fred Sheldon. Additionally, I am indebted to Kent Vliet of the University of Florida Department
of Zoology for providing the remaining tissue samples, without which this thesis would not have
been possible.
I would like to extend thanks to Jesse Grismer, CJ Hayden, Ali Hamilton, Nathan
Jackson, Jesse Prejean, Nanette Crochet, Susan Murray, Ron Eytan, Zac Cheviron, Matt Carling,
Josh Meyer, Curt Burney, and James Maley for help with project ideas, lab protocols, analyses,
and for being good friends. I am especially grateful to James Maley for his generosity with
computational resources. I thank Mike Hellberg for suggesting relevant literature on marine
phylogeography. I must credit Prissy Milligan, Peggy Simms, Gwen Mahon, and Tammie
Jackson for helping ensure I stayed enrolled and received paychecks.
I am indebted to professors Scott Snyder, Colleen McDermott, and Greg Adler for
invaluable undergraduate research experience. Scott introduced me to science and academia, and
also informed me of the monetary benefits of postgraduate education; if I did not know I would
be paid for this stuff, I may never have enrolled in graduate school. I thank Greg for accepting
me into the Tropical Rat Lab, and helping formulate my career and research interests.
iii
For funding, I am grateful to the Sigma Xi Scientific Research Society, LSUMNS, and
BioGrads. I also thank Chris Austin for funding a portion of my lab expenses (NSF grant DEB
0445213).
I am forever grateful to my parents and siblings, especially my brother Bill, for
encouraging my early interest in herpetology. I must extend a heartfelt thanks to Amaya, Bos,
Jinx, Chloe, and especially my wife, Liz, for helping preserve my sanity while living in Baton
Rouge. Also, an extra thanks is owed to Liz for tolerating my bizarre and mostly nocturnal work
schedule during the final year of my thesis research.
iv
TABLE OF CONTENTS
ACKNOWLEDGMENTS.......................................................................................................... ii ABSTRACT.... .........................................................................................................................vii CHAPTER 1 REVIEW OF CROCODYLIAN SYSTEMATIC LITERATURE .........................1
INTRODUCTION TO CROCODYLIAN SYSTEMATICS ..................................................1 THE TAXONOMY OF CROCODYLIA...............................................................................5 REVIEW OF PHYLOGENETIC ESTIMATES OF CROCODYLUS.....................................5 MONOPHYLY OF CROCODYLUS ...................................................................................14 A RECENT RADIATION AND TRANSOCEANIC DISPERSAL EVENTS .....................15 OUT OF AFRICA?.............................................................................................................20 SURVIVING EXTINCTION ..............................................................................................22 THE NILE CROCODILE(S)...............................................................................................23 THE NEW GUINEA CROCODILE(S) ...............................................................................24 THE BORNEO CROCODILE ............................................................................................24 THE EVOLUTION OF NESTING HABIT.........................................................................25 THE EVOLUTION OF BODY SIZE AND HABITAT PREFERENCE..............................25 SUMMARY AND RESEARCH OBJECTIVES BY CHAPTER.........................................26
MONOPHYLY OF CROCODYLUS ............................................................................31 ISSUES OF DIVERSITY WITHIN CROCODYLUS....................................................31 A RECENT RADIATION AND TRANSOCEANIC DISPERSAL EVENTS ..............33 OUT OF AFRICA?......................................................................................................35 A NOTE ON CROCODYLIAN TAXONOMY ...........................................................36 MIXED-MODELS IN PHYLOGENETICS .................................................................38 OBJECTIVES..............................................................................................................40
METHODS.........................................................................................................................40 SAMPLING AND DATA COLLECTION...................................................................40 SEQUENCE ANALYSIS ............................................................................................44 BAYESIAN PHYLOGENETIC ANALYSES OF THE FULL DATASET ..................48 BAYESIAN PHYLOGENETIC ANALYSES OF THE ROOT DATASET .................50 PARTITIONED MAXIMUM-LIKELIHOOD PHYLOGENETIC ANALYSES..........50 DETERMINING THE OPTIMAL PARTITIONING SCHEME FOR BAYESIAN ANALYSES ................................................................................................................52 DETERMINING THE OPTIMAL PARTITIONING SCHEME FOR MAXIMUM-LIKELIHOOD ANALYSES........................................................................................55 TESTING OF PHYLOGENETIC HYPOTHESES.......................................................57 BIOGEOGRAPHIC ANALYSES OF CROCODYLUS ................................................58
v
DATING DIVERGENCES WITHIN CROCODYLIA.................................................64 RESULTS...........................................................................................................................68
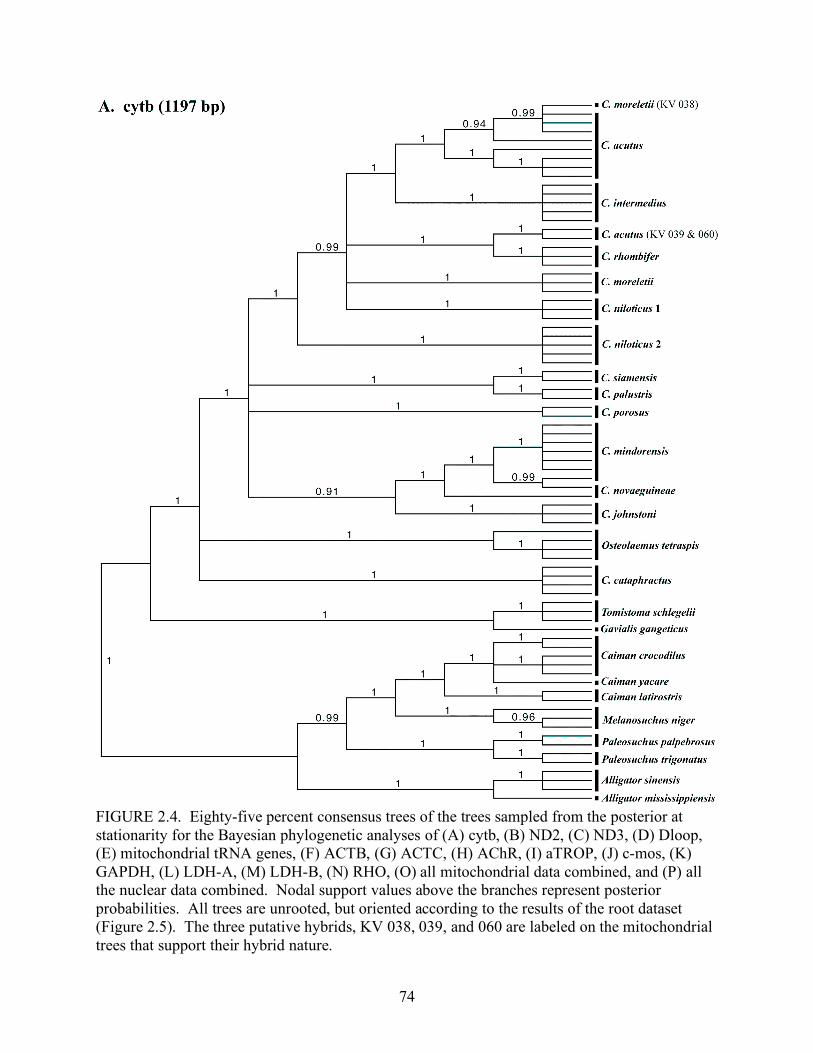
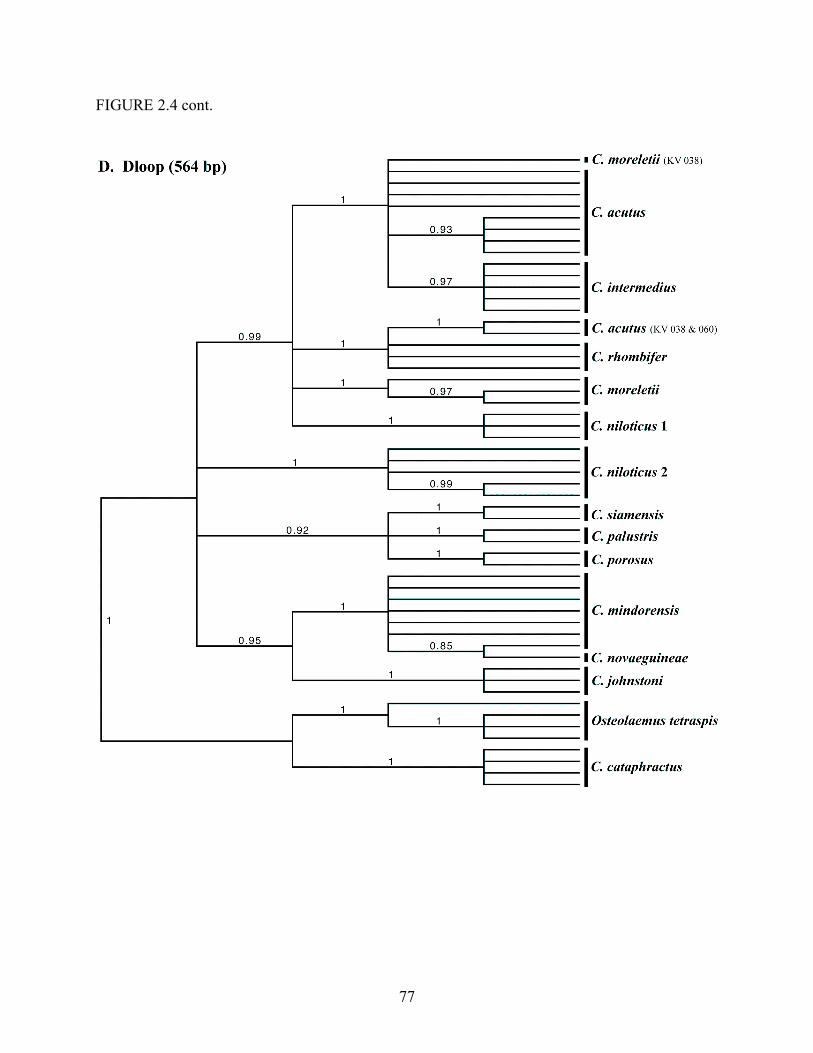
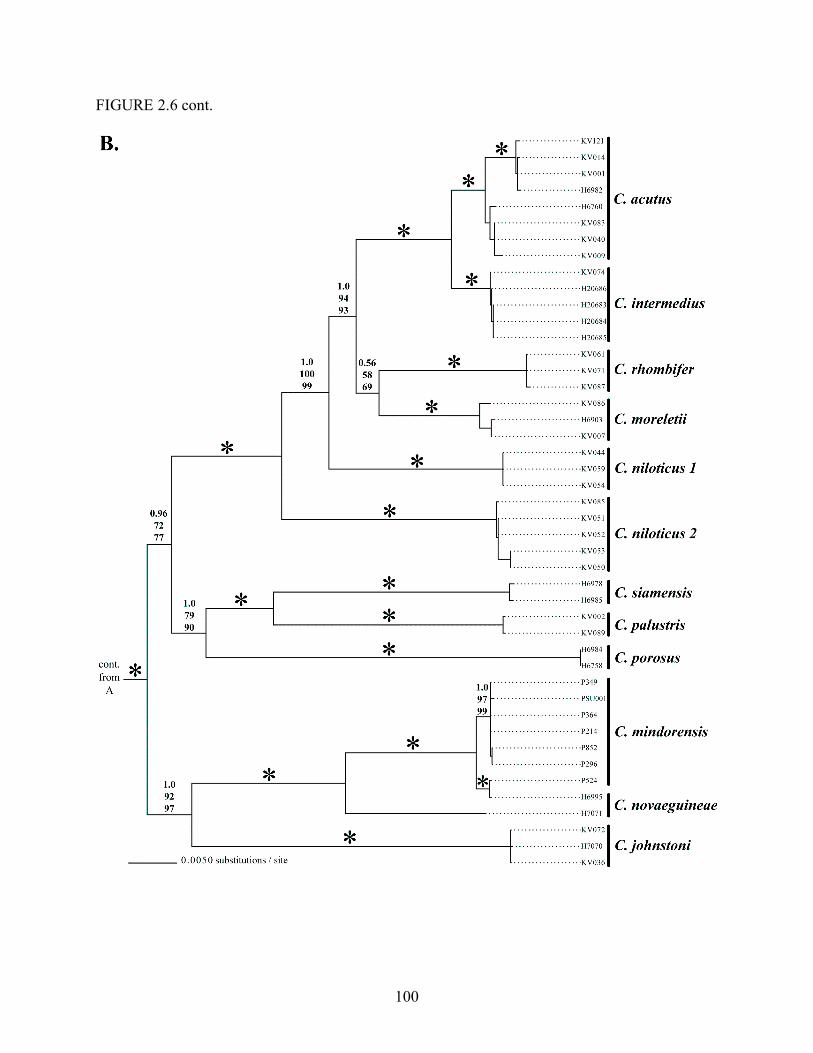
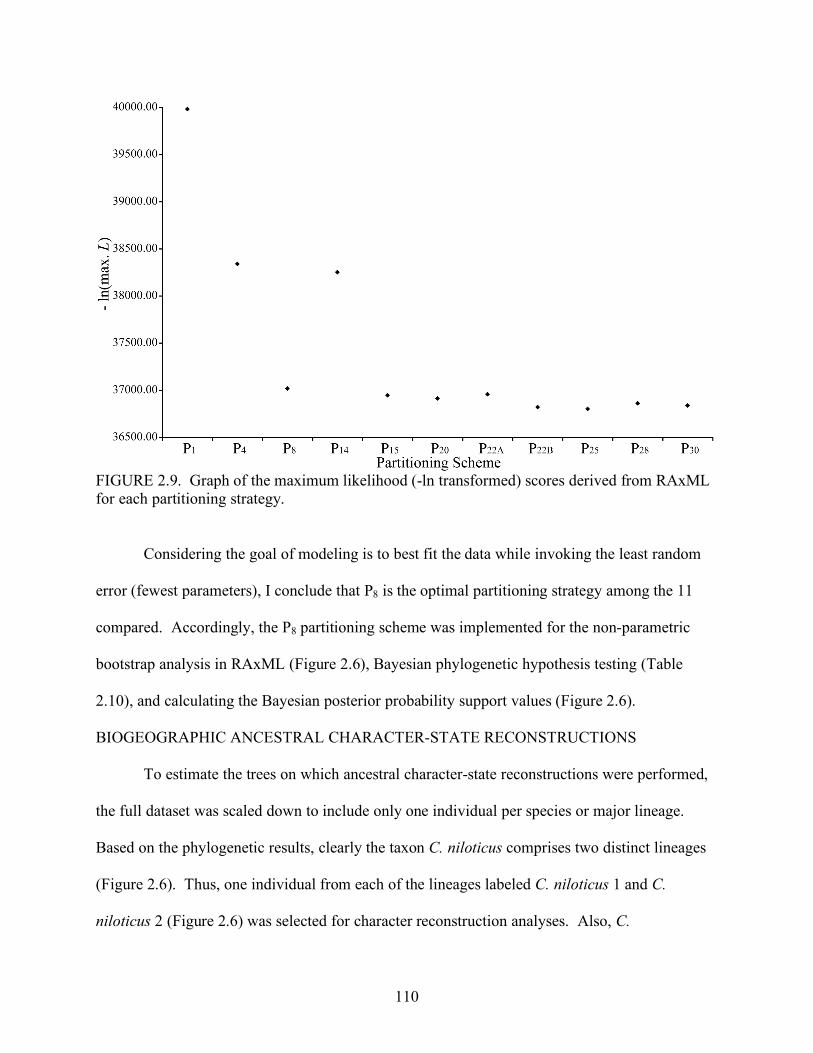
SEQUENCE ALIGNMENTS ......................................................................................68 PHYLOGENETICS.....................................................................................................72 SELECTION OF THE OPTIMAL PARTITIONING STRATEGY............................107 BIOGEOGRAPHIC ANCESTRAL CHARACTER-STATE RECONSTRUCTIONS 110 DIVERGENCE DATING..........................................................................................121
DISCUSSION...................................................................................................................127 MODEL SELECTION CRITERIA AND PARTITION CHOICE ..............................127 HARMONIC MEANS AND THE BAYES FACTOR................................................129 ML AND BAYESIAN ANCESTRAL CHARACTER-STATE RECONSTRUCTIONS..................................................................................................................................130 PUTATIVE HYBRIDS..............................................................................................132 MONOPHYLY OF CROCODYLUS ..........................................................................132 THE NILE CROCODILES........................................................................................133 THE FRESHWATER CROCODILES OF THE NEW GUINEA AND PHILIPPINE ISLANDS..................................................................................................................133 RECENT RADIATION.............................................................................................134 BIOGEOGRAPHY....................................................................................................135 SURVIVING EXTINCTION.....................................................................................138 OTHER RELATIONSHIPS WITHIN CROCODYLIA..............................................139
CONCLUSIONS...............................................................................................................140 EVOLUTIONARY HISTORY OF CROCODYLUS...................................................140 TAXONOMIC RECOMMENDATIONS FOR OSTEOLAEMUS...............................141 MODELING IN PARTITIONED PHYLOGENETIC ANALYSES...........................142
CHAPTER 3 ECOLOGICAL CHARACTER EVOLUTION IN THE TRUE CROCODILES ................................................................................................144
INTRODUCTION ............................................................................................................144 NESTING HABIT .....................................................................................................145 HABITAT PREFERENCE AND BODY SIZE ..........................................................146 OBJECTIVES............................................................................................................147
METHODS.......................................................................................................................147 THE PHYLOGENY ..................................................................................................147 THE CHARACTERS ................................................................................................148 ANCESTRAL CHARACTER-STATE RECONSTRUCTIONS ................................149 TESTING FOR CORRELATION..............................................................................150
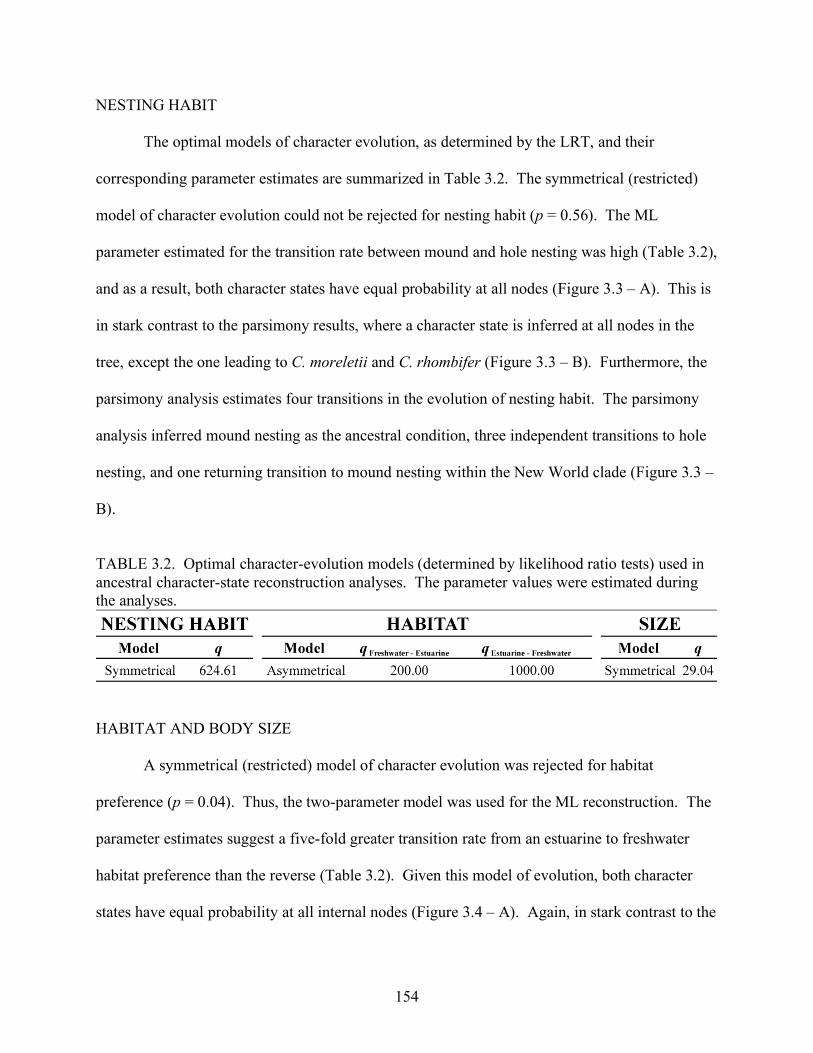
RESULTS.........................................................................................................................151 NESTING HABIT .....................................................................................................154 HABITAT AND BODY SIZE ...................................................................................154
CHAPTER 4 MAIN CONCLUSIONS...................................................................................163 LITERATURE CITED ...........................................................................................................164 APPENDIX..... .......................................................................................................................181 VITA.......................................................................................................................................184
vii
ABSTRACT Modern crocodylian systematics has been dominated by investigations of higher-level
relationships aimed at resolving the disparity between morphological and molecular data,
especially regarding the true gharial (Gavialis). Consequently, no studies to date have provided
adequate resolution of the interspecific relationships within the most broadly distributed,
ecologically diverse, and species-rich crocodylian genus, Crocodylus. In this study, Bayesian
and ML partitioned phylogenetic analyses were performed on a DNA sequence dataset of 7,282
base pairs representing four mitochondrial regions, nine nuclear loci, and all 23 crocodylian
species. The analyses were performed on a suite of partitioning strategies to investigate the
modeling effects of partition choice in phylogenetic analyses. Bayesian lognormal relaxed-clock
dating analyses also were performed on the dataset, calibrated from the rich crocodylian fossil
record. A robust interspecific phylogeny of Crocodylus is reconstructed, and subsequently used
in ML and Bayesian ancestral character-state reconstructions to test hypotheses about the
biogeographic history and evolutionary ecology of the genus. The results demonstrate that the
genus originated from an ancestor in the tropics of the Late Miocene Indo-Pacific, and rapidly
radiated and dispersed around the globe during a period marked by mass extinctions of fellow
crocodylians. The results also prove paraphyly of Crocodylus, and reveal more diversity within
the genus than recognized by current taxonomy. This study also establishes a baseline for
assessing the utility of various model selection criteria for objectively selecting the optimal
partitioning strategy within ML and Bayesian frameworks. The results indicate that gene
identity is a poor method of partition choice. Furthermore, the results of the ancestral character-
state reconstructions suggest ML and Bayesian methods produce more realistic and reliable
results than parsimony.
1
CHAPTER 1 REVIEW OF CROCODYLIAN SYSTEMATIC LITERATURE
Although the huge dragon-like dinosaurs or “terrible reptiles” (...) became extinct during the Mesozoic epoch, (...) we have one group of reptiles [Crocodylia] still living in certain parts of the earth of which the Mesozoic lords of creation need not feel ashamed. (Reese, 1915)
INTRODUCTION TO CROCODYLIAN SYSTEMATICS
Other than birds, eusuchian crocodylians represent the only surviving members of the
once dominant class Archosauria. Over the last two decades, a large literature has amassed
regarding the evolutionary history of the crown-group order Crocodylia, which is defined by all
23 extant crocodylian species. This growth has largely been due to the exhaustive efforts of
systematists to resolve the disparity between molecular and morphological data regarding the
phylogenetic placement of the true gharial (Gavialis) and its affinities with the false gharial
(Tomistoma). Although some paleontologists still support Gavialis as the basal-most member of
crown-group crocodylians based on morphological data (Figure 1.1A; Brochu, 2003; Buscalioni
et al., 2001), overwhelming molecular evidence suggests that Gavialis is sister to Tomistoma,
and the lineage leading to these species split from crocodylids after a basal split from
Alligatoridae (Figure 1.1B; Aggarwal et al., 1994; Densmore, 1983; Densmore and Dessauer,
1984; Densmore and Owen, 1989; Densmore and White, 1991; Gatesy et al., 2003; Gatesy and
Amato, 1992; Gatesy et al., 2004; Gatesy et al., 1993; Harshman et al., 2003; Hass et al., 1992;
Janke et al., 2005; Li et al., 2007; McAliley et al., 2006; Poe, 1996; White, 1992; White and
Densmore, 2000; Willis et al., 2007).
2
FIGURE 1.1. The upper-level crocodylian phylogenetic relationships supported by (A) morphological and (B) molecular data.
So much focus has been placed on the Gavialis debate that many issues concerning the
lower-level relationships within Crocodylia have gone unresolved. One such example is the
interspecific relationships among the caimans (Caimaninae). Some phylogenetic estimates
suggest that the genus Caiman is monophyletic (Brochu and Densmore, 2000; Densmore, 1983;
Gatesy et al., 2003; Gatesy et al., 1993; Poe, 1996; White, 1992; White and Densmore, 2000),
whereas others nest Melanosuchus within Caiman, rendering it paraphyletic (Brochu, 1997;
Buscalioni et al., 2001; Densmore, 1983; Gatesy et al., 2003; Gatesy et al., 2004; Gatesy et al.,
1993; Poe, 1996). Another example of unresolved lower-level crocodylian relationships is the
interspecific affinities within the most broadly distributed, ecologically diverse, and species-rich
crocodylian genus, Crocodylus.
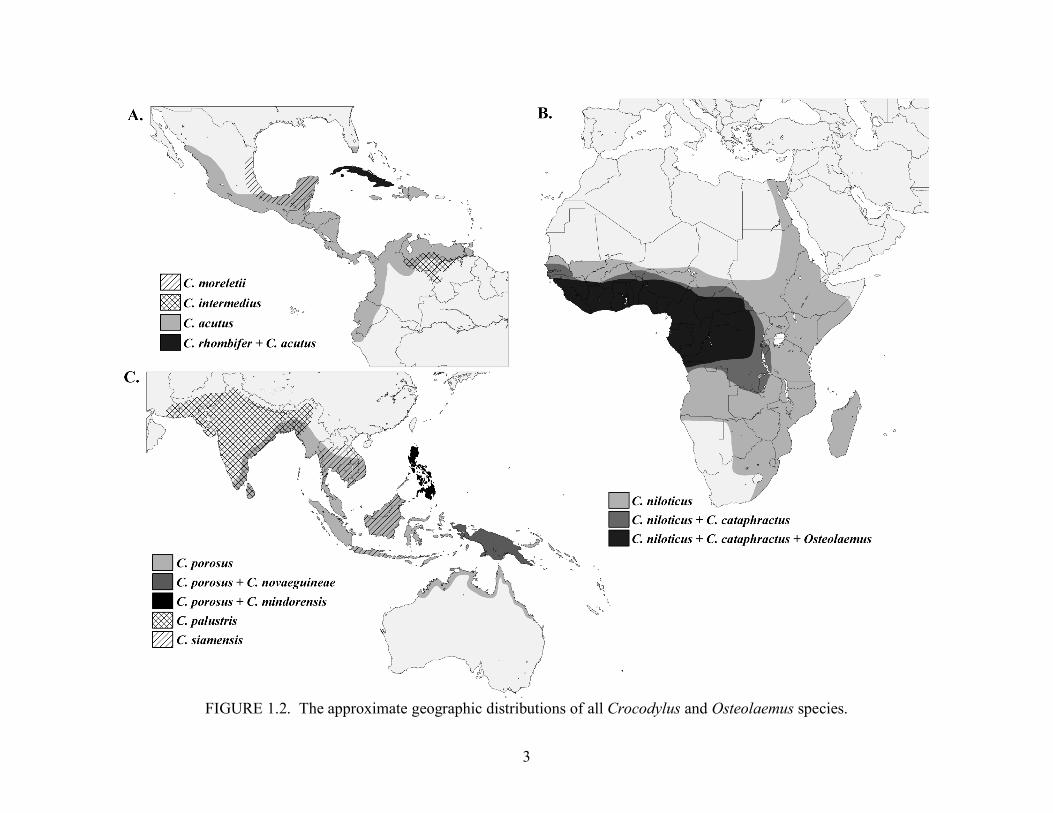
The genus Crocodylus is distributed circumtropically (Figure 1.2) and comprised of 12
named species (commonly referred to as the true crocodiles) that range from the largest living
reptile and broadly distributed C. porosus, to small-bodied, narrowly distributed island endemics
(e.g. C. novaeguineae, C. mindorensis, and C. rhombifer) (Neill, 1971). All early molecular
3
FIGURE 1.2. The approximate geographic distributions of all Crocodylus and Osteolaemus species.
4
phylogenetic studies of Crocodylia either included only a subset of the 12 named Crocodylus
species (Aggarwal et al., 1994; Brochu, 1997; Brochu and Densmore, 2000; Gatesy et al., 2003;
Gatesy and Amato, 1992; Gatesy et al., 1993; Harshman et al., 2003; Hass et al., 1992), or lacked
adequate resolution and/or support of the interspecific relationships within the genus (Densmore,
1983; Densmore and Owen, 1989; Densmore and White, 1991; Gatesy et al., 2004; Poe, 1996;
White, 1992; White and Densmore, 2000).
The preoccupation with the Gavialis debate is not entirely to blame for the unresolved
relationships within Crocodylus. Early molecular datasets demonstrated exceptionally low levels
of interspecific genetic divergence within Crocodylus, either as a result of a recent radiation or
an extremely slow rate of molecular evolution within the genus compared to the rest of the order
(Brochu, 2000a; Brochu and Densmore, 2000; Densmore, 1983; Dessauer et al., 2002; Poe,
1996; White, 1992). As a result, molecular markers appropriate for resolving upper-level
relationships within Crocodylia were unable to provide the resolution necessary for discerning
the relationships within Crocodylus. Even recent molecular phylogenetic studies aimed
specifically at resolving the relationships within this genus using moderately sized genetic
datasets were unable to reconstruct robust estimates of its evolutionary history (Gratten, 2003;
McAliley et al., 2006)
In this chapter, I review current crocodylian phylogenetic information, focusing
specifically on the genus Crocodylus. Crocodylian phylogenetic studies that contain little or no
information regarding the interspecific affinities of Crocodylus have not been included. I use
this review to point out a few areas of congruence, but mostly to demonstrate the dearth of
knowledge regarding Crocodylus phylogenetics. After this review, I subsequently discuss a
5
variety of unanswered questions regarding the evolutionary history of the genus. I conclude with
a discussion of objectives and hypotheses that will be the focus of subsequent chapters.
THE TAXONOMY OF CROCODYLIA
To avoid confusion, a taxonomic discussion should be based on an explicit classification.
This is especially important in this case as the taxonomy within Crocodylia has been very
unstable, with different classification schemes grouping the extant species into 1-3 families and
0-4 subfamilies (Ditmars, 1933; Dowling and Duellman, 1978; Groombridge, 1987; King and
Burke, 1989; Pope, 1955; Zug et al., 2001). This problem was only exacerbated by the onset of
the Gavialis debate. Recently, Willis et al. (2007) proposed placing Tomistoma within
Gavialidae in light of their sister relationship. However, because Gavialis was the taxon to
change its position on the crocodylian tree (from the base to being nested within Crocodylidae),
whereas Tomistoma remained in its historical position, it seems more logical to revise the family-
level classification of Gavialis. Thus, I adhere to the taxonomy of Janke et al. (2005), which
includes two families within Crocodylia, Alligatoridae and Crocodylidae, and considers Gavialis
as part of the latter. Furthermore, I propose a complete and novel higher-level classification of
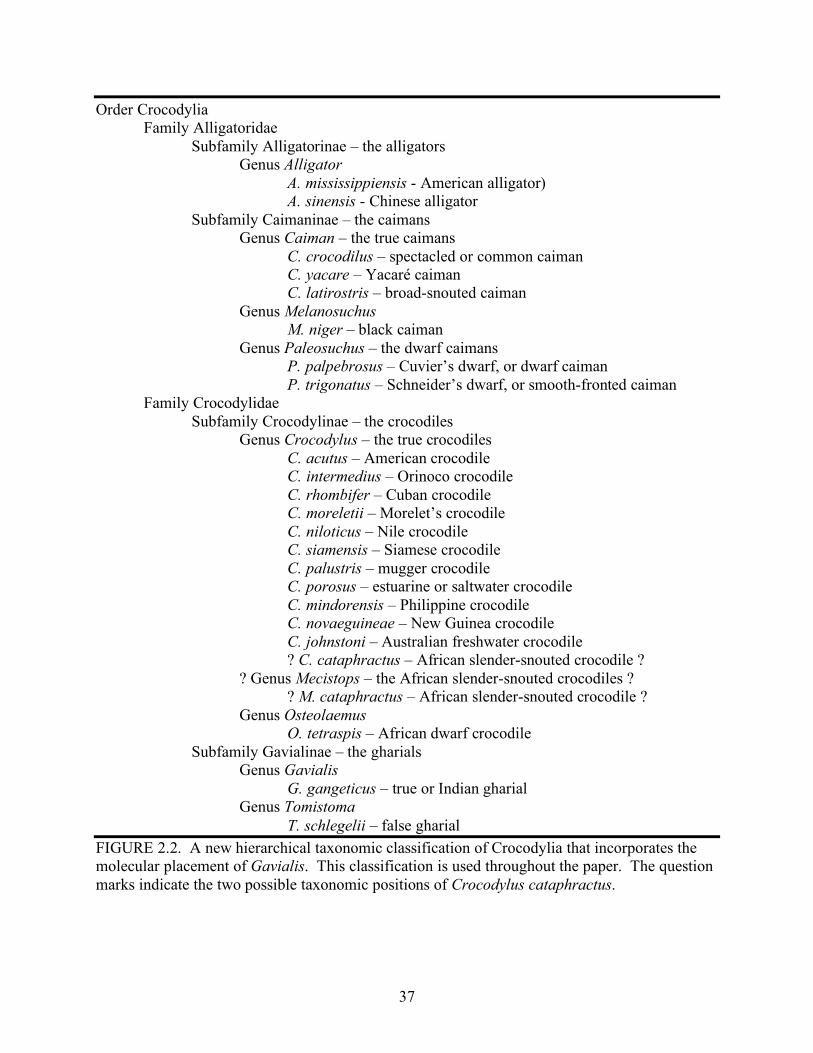
the order Crocodylia (Figure 1.3), and I adhere to this scheme throughout this work.
REVIEW OF PHYLOGENETIC ESTIMATES OF CROCODYLUS
The first thorough phylogenetic analysis of all named crocodilian species was that of
Densmore (1983). His seminal work was based on four protein datasets: Qualitative distances
based on immunodiffusion analyses of 1) albumin and 2) transferrin proteins, 3) differences
among electrophoretic patterns of tryptic globin digests, and 4) Nei genetic distances calculated
from electrophoretic phenotypes of 17 red cell and plasma proteins. Some problems with
Densmore’s work included the lack of an outgroup and the use of phenetic analyses (UPGMA).
6
Order Crocodylia Family Alligatoridae Subfamily Alligatorinae – the alligators Genus Alligator A. mississippiensis - American alligator) A. sinensis - Chinese alligator Subfamily Caimaninae – the caimans Genus Caiman – the true caimans C. crocodilus – spectacled or common caiman C. yacare – Yacaré caiman C. latirostris – broad-snouted caiman Genus Melanosuchus M. niger – black caiman Genus Paleosuchus – the dwarf caimans P. palpebrosus – Cuvier’s dwarf, or dwarf caiman P. trigonatus – Schneider’s dwarf, or smooth-fronted caiman Family Crocodylidae Subfamily Crocodylinae – the crocodiles Genus Crocodylus – the true crocodiles C. acutus – American crocodile C. intermedius – Orinoco crocodile C. rhombifer – Cuban crocodile C. moreletii – Morelet’s crocodile C. niloticus – Nile crocodile C. siamensis – Siamese crocodile C. palustris – mugger crocodile C. porosus – estuarine or saltwater crocodile C. mindorensis – Philippine crocodile C. novaeguineae – New Guinea crocodile C. johnstoni – Australian freshwater crocodile ? C. cataphractus – African slender-snouted crocodile ? ? Genus Mecistops – the African slender-snouted crocodiles ? ? M. cataphractus – African slender-snouted crocodile ? Genus Osteolaemus O. tetraspis – African dwarf crocodile Subfamily Gavialinae – the gharials Genus Gavialis G. gangeticus – true or Indian gharial Genus Tomistoma T. schlegelii – false gharial FIGURE 1.3. A new hierarchical taxonomic classification of Crocodylia that incorporates the molecular placement of Gavialis. This classification is used throughout the paper. The question marks indicate the two possible taxonomic positions of Crocodylus cataphractus.
7
Also, as Poe (1996) points out, the phylogenetic estimates based on the transferrin protein,
globin digest, and Nei genetic distance datasets were not obtained independently of the albumin
immunodiffusion results. Consequently, the only cogent result of this study regarding
Crocodylus was that the genus is comprised of the most closely related species in the order
Crocodylia, suggestive of a relatively recent radiation.
Densmore and White (1991) inferred phylogenies based on 18s nuclear ribosomal DNA
(rDNA), 28s nuclear rDNA, and mitochondrial DNA (mtDNA) restriction-fragment length
polymorphisms (RFLPs) using phenetic and compatibility analyses. These results likely suffered
problems of non-homology since the restriction sites where not mapped. The compatibility-
based results offered poor resolution of Crocodylus, but did support monophyly of the genus.
White (1992) obtained the first phylogeny based on DNA sequence data that contained multiple
Crocodylus species. Using equally weighted and threshold parsimony, he analyzed a 347 bp
mtDNA sequence alignment (ND6 – cytb) that included all but one (C. palustris) of the 12
named Crocodylus species. The resulting trees from both analytical methods were fully
resolved, however there was no nodal support within the threshold parsimony tree and very low
bootstrap support for the equally weighted parsimony tree. Bootstrap values were as low as
16%, and six of the nine Crocodylus nodes had bootstrap values less than 55%. Contrary to the
RFLP data, the equally weighted parsimony analysis of the mtDNA supported paraphyly of
Crocodylus, placing C. cataphractus sister to Osteolaemus (the threshold parsimony tree only
included Crocodylus species).
Using equally weighted parsimony, Poe (1996) reanalyzed Gatesy and Amato’s (1992)
12s mtDNA alignment (this only contained a single Crocodylus species), the mitochondrial and
nuclear RFLP datasets of Densmore and White (1991), osteological data from Norell (1988;
8
1989) and Clark (1994), dentition data from Iordansky (1973), and external morphological data
from Brazaitis (1973) and Ross and Mayer (1983). The trees resulting from the parsimony
analyses of the RFLP data were almost entirely unresolved with respect to Crocodylus.
However, the sister relationship between C. novaeguineae and C. mindorensis was supported by
all three RFLP trees with moderate to high (62-96%) bootstrap values. The tree resulting from
the combined parsimony analysis of all the morphological data left Crocodylus as a complete
polytomy. When Poe included all the molecular and morphological data in a single combined
parsimony analysis, Crocodylus was fully resolved, but had low bootstrap support. Not
surprisingly, the C. mindorensis-C. novaeguineae sister relationship was one node that did
receive strong (100%) bootstrap support. The total combined tree also provided strong bootstrap
support (92%) for monophyly of Crocodylus, nesting C. cataphractus well within the genus and
placing Osteolaemus sister to all the true crocodiles.
Preliminary analyses of a 300 bp mtDNA sequence were presented by Brochu and
Densmore (2000) and White and Densmore (2000) based on data cited as White and Densmore
(in review) that still remain unpublished. The preliminary maximum parsimony tree of White
and Densmore (2000) includes all but one (C. palustris) named Crocodylus species and is
completely resolved other than one trichotomy, but the authors did not provide support values.
This tree suggests a sister relationship between C. cataphractus and Osteolaemus, rendering
Crocodylus paraphyletic. Brochu and Densmore (2000) presented a phylogenetic estimate of
Crocodylus based on strict parsimony analysis of a combined dataset of the same preliminary
mtDNA data and 164 morphological characters. Their tree included all but one named
Crocodylus species (C. palustris), was fully resolved, and provided strong bootstrap support for
monophyly of Crocodylus (96%) and the sister relationships of C. mindorensis-C. novaeguineae
9
(100%) and C. acutus-C. intermedius (92%). Brochu (2000b) provided a phylogenetic estimate
of all Crocodylus species based solely on the morphological dataset of 164 characters. The
resulting tree of his parsimony analysis supported Crocodylus monophyly, but was poorly
resolved and only three of the nodes within Crocodylus had bootstrap values greater than 50%.
Using ML and Bayesian inference methods, Schmitz et al. (2003) analyzed a dataset
comprised of ~400 bp of the mt 12S rDNA gene that included three Crocodylus species (C.
cataphractus, C. niloticus, and C. johnstoni) and Osteolaemus tetraspis. Their results suggested
that C. niloticus might contain multiple species (this will be discussed in more detail in the
section below on Nile crocodiles), and barely supported paraphyly of Crocodylus by grouping C.
cataphractus and Osteolaemus with a posterior probability and bootstrap support of 0.55 and
51%, respectively. Despite these low support values, the authors recommend generic rank of the
species and resurrection of the genus Mecistops (Gray 1844) for that purpose.
Gatesy et al. (2004) presented a phylogeny based on the parsimony analysis of a
supermatrix, which included five nuclear DNA loci, seven mtDNA regions, morphological
characters, RFLPs, chromosome morphology, nesting behavior, and two allozyme datasets (See
Gatesy et al. (2004) and references therein for specifics). However, only the 18s and 28s rDNA
RFLP datasets from Densmore and White (1991) and one of the allozyme datasets from
Densmore (1983) provided data on all named Crocodylus species. The rest of the datasets within
the supermatrix provided information on only a subset of Crocodylus species. Of the 20
individual datasets used by Gatesy et al. (2004), 15 of them contained the necessary taxa
(Osteolaemus, C. cataphractus, and at least one other Crocodylus) to provide information
regarding monophyly of the genus. When these datasets were analyzed separately using
parsimony, three supported monophyly (mt 12S rDNA, 18S rDNA RFLPs, and 28S rDNA
10
RFLPs), four supported paraphyly (BDNF nuDNA, cytb, mt 16S rDNA, and digenean parasites),
and the rest were ambiguous. The strict consensus tree from the parsimony analysis on the
combined dataset (i.e. the supermatrix) was resolved with respect to extant Crocodylus, except
for a single trichotomy, and supported paraphyly of Crocodylus with a sister relationship
between C. cataphractus and Osteolaemus. However, it lacked nodal support and five of the
nodes were not stable to exclusion of the unmapped RFLP character data (Gatesy et al., 2004).
Recently, two molecular phylogenetic studies focused specifically on resolving the
interspecific relationships among the true crocodiles (Gratten, 2003; McAliley et al., 2006).
Gratten (2003) performed maximum likelihood (ML) and Bayesian phylogenetic analyses on
1245 bp of mtDNA (706 bp of ND4 and 539 bp of Dloop) for all 12 named species. This study
lacked an outgroup (i.e. the trees were rooted with C. cataphractus) and thus could not address
monophyly of the genus, however it provided strong support (i.e. ≥ 0.95 posterior probability or
≥ 70% ML bootstrap support) for a number of relationships within the Crocodylus, including
monophyly of the four New World species (C. acutus, C. intermedius, C. moreletii, and C.
rhombifer), monophyly of the New World species + C. niloticus, monophyly of C. johnstoni, C.
mindorensis, and C. novaeguineae, and sister relationships between C. acutus – C. intermedius
and C. mindorensis – C. novaeguineae. Because the analyses used a single C. cataphractus as
the outgroup, the rooting of the rest of the Crocodylus was unsupported and several of the basal
divergences of the genus received poor support. Nonetheless, until the present study, this
represented the best estimate of the interspecific relationships among the true crocodiles.
The goal of McAliley et al. (2006) was to elucidate the placement of C. cataphractus and
thus determine whether Crocodylus was in fact monophyletic. However, with the dataset used
they were unable to resolve this issue. Their dataset included mtDNA sequence data from two
11
regions, Dloop (457 bp; originally from Ray and Densmore [2002]) and ND6 – cytb (347 bp;
originally from White [1992]), and two nuclear loci, c-mos (302 bp) and ODC (294 bp). They
also reanalyzed the morphological dataset of Brochu (2000) using maximum parsimony. Of
these five datasets, only the morphological data included representatives of all 12 Crocodylus
species. The molecular datasets were missing Crocodylus species as follows: Dloop (C.
palustris), ND6 – cytb (C. novaeguineae), c-mos (C. moreletii, C. novaeguineae, and C.
siamensis), and ODC (C. acutus, C. intermedius, C. mindorensis, C. niloticus, C. novaeguineae,
and C. porosus). McAliley et al. (2006) performed ML and Bayesian analyses on each of the
molecular datasets individually and on concatenated datasets of c-mos + ODC and Dloop + ND6
– cytb. Analyses of their c-mos dataset should be considered with caution. They state that their
final alignment of c-mos contained several 1-3 bp indels. The one and two base pair indels
would cause shifts in the reading frame of the entirely exonic c-mos gene, which seems
biologically implausible. Furthermore, the region of c-mos sequenced for this study entirely
encompasses the region used by McAliley et al. (2006) and only exhibited a single,
synapomorphic 3 bp deletion in Crocodylus and Osteolaemus (see Chapter 2).
That being said, the tree resulting from their analysis of c-mos portrayed several bizarre
relationships within Crocodylus, none of which was well supported. The tree also showed weak
support for paraphyly of Crocodylus by placing C. cataphractus outside of a largely unresolved
clade of the remaining Crocodylus + Osteolaemus. The ODC tree only contained six Crocodylus
species, but did provide strong support for monophyly of the genus, with C. cataphractus as the
basal most member and Osteolaemus the sister to Crocodylus. Unlike when White (1992)
analyzed it, the ND6 – cytb data supported monophyly of Crocodylus, with curiously strong
support (0.98 posterior probability). Additionally, several other odd, well supported
12
relationships appear in McAliley et al.’s (2006) ND6 – cytb Bayesian tree that are incongruent
with White’s (1992) tree: C. johnstoni is nested within a clade with three New World species; C.
moreletii is outside of the New World clade and sister to C. mindorensis; and C. niloticus does
not fall out with New World taxa, but is instead part of a basal clade and sister to C. palustris.
Also, there seems to be a large discrepancy between the low levels of bootstrap support on
White’s (1992) tree and the high values of posterior probabilities on McAliley’s tree, even
beyond the normal differences observed between these support measures (i.e. 70% bootstrap
support is generally accepted as being approximately equivalent to 95% Bayesian posterior
support [Leaché and Reeder, 2002]). Even relationships outside of Crocodylus are very unusual
on the ND6 – cytb tree; Tomistoma and Gavialis are well supported as consecutive outgroups of
the Crocodylus + Osteolaemus clade rather than being sister taxa. Much like c-mos, the results
of this dataset seem dubious. McAliley et al.’s (2006) analysis of the Dloop dataset weakly
supported (0.72 posterior probability) the sister relationship between C. cataphractus and
Osteolaemus, rendering Crocodylus paraphyletic. The relationships within the rest of
Crocodylus were not well supported except for a New World + C. niloticus clade, and sister
relationships between C. mindorensis – C. novaeguineae and C. acutus – C. intermedius.
McAliley et al.’s (2006) analysis of the combined c-mos + ODC dataset provided little
information regarding relationships within the Crocodylus + Osteolaemus clade. This result is
not surprising when considering this was an analysis of two clearly incongruent datasets. The
result was a compromise between the two loci, with C. Cataphractus, Osteolaemus, and the
remaining Crocodylus (only 4 Crocodylus species were in this analysis) represented by a
polytomy. Likewise, the tree resulting from the combined analysis of the incongruent mtDNA
datasets had little to say about Crocodylus relationships. Again, Osteolaemus, C. cataphractus,
13
and the remaining Crocodylus species were represented by a basal trichotomy, allowing no
inferences to be made regarding monophyly of the genus. As when Brochu (2000) analyzed it,
the morphological dataset supported monophyly of Crocodylus with Osteolaemus as its sister,
but supported little else. Despite the mixed results regarding monophyly of Crocodylus (c-mos =
= no information, combined mtDNA = no information, morphology = monophyly), McAliley et
al. (2006) seem to arbitrarily favor the paraphyly results and place C. cataphractus into the
resurrected genus Mecistops, without reference to Schmitz et al.’s (2003) recommendation. This
taxonomic revision seemed a bit capricious, given that more data could potentially solidify
Crocodylus as a monophyletic genus.
Another recent study bearing relevance to Crocodylus systematics is that of Willis et al.
(2007). In this study, they reanalyze the c-mos dataset of McAliley et al. (2006), including more
individuals of Gavialis and Tomistoma, and present data from a new nuclear locus, DMP1 (352
bp), which was sequenced for 8 of the 12 Crocodylus species. These two nuclear loci were
analyzed separately and combined using ML and Bayesian inference methods. The reanalysis of
c-mos provided no new information regarding Crocodylus, and the DMP1 dataset produced a
tree in which all Crocodylus were part of a large polytomy along with Osteolaemus. The
combined analysis supported paraphyly of Crocodylus, with C. cataphractus sister to clade
comprised of Osteolaemus and the remaining Crocodylus, but provided very little information
regarding the relationships within this Osteolaemus + non-cataphractus Crocodylus clade.
Li et al. (2007) recently published a crocodylian phylogeny based on the conserved
region of Dloop that included all but one (C. novaeguineae) species of Crocodylus. Their
maximum parsimony analysis yielded very little bootstrap support for relationships within the
14
genus Crocodylus. The resulting topology suggested paraphyly of the genus by placing C.
cataphractus sister to a clade containing the rest of Crocodylus + Osteolaemus, but lacked
support for this relationship. Their neighbor-joining analysis suggested monophyly of
Crocodylus by placing Osteolaemus sister to all Crocodylus, but again, this relationship was
weakly supported (62% bootstrap). The only relationship that received strong support in both
analyses was the sister relationship between C. acutus and C. intermedius. Much like McAliley
et al. (2006) and Schmitz et al. (2003), but without reference to either, Li et al. (2007)
recommend placing C. cataphractus into its own genus despite the ambiguity of their results
regarding its phylogenetic placement.
To demonstrate how poorly known the phylogenetic relationships within Crocodylus are,
I constructed a strict consensus tree (Figure 1.4) of what are arguably the two best phylogenetic
estimates that include all named species of Crocodylus and Osteolaemus, the supermatrix
parsimony tree of Gatesy et al. (2004) and combined parsimony tree of Poe (1996). These two
topologies are only congruent regarding the sister relationships between C. acutus – C.
intermedius, C. porosus – C. palustris and C. novaeguineae – C. mindorensis. Overall, It is quite
clear that there is little agreement regarding the intrageneric phylogenetic relationships of
Crocodylus, including whether or not the genus is monophyletic.
MONOPHYLY OF CROCODYLUS
As discussed in detail in the previous section, great uncertainty remains regarding the
monophyly of Crocodylus. To summarize the phylogenetic support for and against monophyly
of Crocodylus, I have compiled the results of the studies discussed above that provide
information on this issue into Table 1.1. This table illustrates the need for further research to
resolve this issue, which likely will require a large molecular dataset. Despite the ambiguity
15
FIGURE 1.4. A strict consensus tree of two Crocodylus phylogenetic topologies presented by Poe (1996) and Gatesy et al. (2004). regarding the placement of C. cataphractus, Schmitz et al. (2003) and McAliley et al. (2006)
have recommended resurrecting the genus Mecistops for this species. Due to the uncertain need
for this taxonomic revision (i.e. Crocodylus may be monophyletic), I refrain from adhering to
this recommendation until it is either validated or refuted by the results of Chapter 2 of this work.
In other words, I will use the taxonomic name C. cataphractus through the end of Chapter 2,
after which point I will use the generic name supported by the results.
A RECENT RADIATION AND TRANSOCEANIC DISPERSAL EVENTS
Traditional taxonomic treatments of Crocodylus stereotyped the genus as being
comprised of ancient, conserved species (“living fossils”) that date back to the Cretaceous period
(Kälin, 1955; Lydekker, 1886; Mook, 1927; Mook, 1933; Sill, 1968). Adhering to this notion
and the assumption that crocodiles were incapable of crossing marine barriers, early
16
TABLE 1.1. Summary of the published phylogenetic estimates of Crocodylus that support monophyly or paraphyly of the genus. Note that many of the results shown in the table are not independent of one another. Dataset Monophyly Paraphyly albumin distances (Densmore, 1983) ✔ globin peptide distances (Densmore, 1983) ✔ combined RFLPs (Densmore and White, 1991) ✔ ND6 – cytb mtDNA (White, 1992) ✔ combined dataset (Poe, 1996) ✔ 18S rDNA RFLPs ✔ 28S rDNA RFLPs ✔ mtDNA (White and Densmore, 2000) ✔ morphology (Brochu, 2000b) ✔ mtDNA + morphology (Brochu and Densmore, 2000) ✔ mt 12S rDNA (Schmitz et al., 2003) ✔ supermatrix (Gatesy et al., 2004) ✔ mt 12S rDNA RFLPs ✔ 18S rDNA RFLPs ✔ 28S rDNA RFLPs ✔ BDNF ✔ cytb ✔ mt 16S rDNA ✔ digenean parasites ✔ c-mos (McAliley et al., 2006) ✔ ODC (McAliley et al., 2006) ✔ ND6 – cytb (McAliley et al., 2006) ✔ Dloop (McAliley et al., 2006) ✔ c-mos + DMP1 (Willis et al., 2007) ✔ Dloop (MP; Li et al. 2007) ✔ Dloop (NJ; Li et al. 2007) ✔ biogeographic explanations of the genus’s distribution invoked dispersal via ancient landbridges
(Schmidt, 1924; Sill, 1968). However, after the general acceptance of plate tectonic theory, the
biogeographic paradigm shifted to a vicariant explanation that assumed extant Crocodylus
species were ancient relicts that predated continental breakup (Brooks, 1979; Brooks and
O'Grady, 1989). The notion that Crocodylus may represent a relatively recent radiation,
evidenced by the low levels of divergence found in early molecular studies (Densmore, 1983;
Densmore and White, 1991; White, 1992), fueled reassessment of the morphological evidence by
17
use of rigorous cladistic methods (Brochu, 1997; Brochu, 2000b; Salisbury and Willis, 1996).
The results of these analyses demonstrated that paleontologists had been applying the name
“Crocodylus” to a wide variety of non-alligatorid fossil taxa based on general gestalt and
plesiomorphic characters (Brochu, 2000a; Brochu, 2000b). Thus, the ancient “Crocodylus” upon
which the traditional theories of crocodile evolution were based were not part of the crown-group
lineage of true crocodiles. After these misnamed taxa were identified, and only fossil taxa
placed within the lineage of extant Crocodylus by cladistic analyses were considered, the
molecular and paleontological evidence were strikingly congruent (Brochu, 2000a; Brochu,
2003).
Multiple estimates of the time to the most recent common ancestor of Crocodylus, based
on constant rates of amino acid (Densmore, 1983) and nucleotide (Gratten, 2003; White, 1992)
sequence evolution, all were less than 10 million years, suggesting the genus represents a post-
Middle-Miocene radiation. Concordant with these molecular data, the oldest fossils belonging to
the crown-genus (excluding C. cataphractus and relatives due to uncertain affinities) date from
the Miocene-Pliocene boundary or later (Brochu, 2000a; Delfino et al., 2007; Lydekker, 1886;
Mead et al., 2006; Miller, 1980; Molnar, 1979; Mook, 1933; Salisbury et al., 2006; Willis, 1997).
Interestingly, by the early Pliocene, putative Crocodylus fossils are known from Africa (Brochu,
2000a; Tchernov, 1986), Australia (Molnar, 1979; Willis, 1997), Asia (Brochu, 2000a;
Lydekker, 1886; Mook, 1933), and the New World (Miller, 1980), suggesting that if the genus
originated in the Late Miocene, it colonized the globe quite rapidly. Although these data are
vulnerable to errors associated with molecular clocks and fossil sampling, dating, and
identification, the fact that they concur may warrant the conservative conclusion that Crocodylus
has speciated well after continental breakup and formation of the Atlantic Ocean. This would
18
render traditional explanations of the circumtropical distribution of Crocodylus based on
vicariance theory untenable. Rather, the African, Indo-Asian and Australasian distributions of
Crocodylus require the crossing of many marine barriers. More significantly, at least one
transoceanic dispersal event via the Atlantic or Pacific is necessary to explain the four
Crocodylus species of the Americas and Caribbean.
There is growing physiological evidence that supports the plausibility of transoceanic
movements of Crocodylus species. Crocodylids possess a suite of synapomorphic
specializations that make them better suited for hyperosmotic environments than alligatorids.
Crocodylids have lingual salt-secreting glands (Taplin, 1988; Taplin and Grigg, 1981; Taplin et
al., 1982; Taplin and Loveridge, 1988), a heavily keratinized buccal epithelium (Taplin and
Grigg, 1989), a highly adapted osmoregulatory cloaca (Pidcock et al., 1997), and the ability to
distinguish and drink freshwater from seawater (Jackson et al., 1996). Crocodylus species have
been maintained in seawater for 5 months with no detrimental effects (Dunson, 1970), and have
been documented to swim 800 km (Bustard and Choudhury, 1982) and 1360 km (Allen, 1974)
across open ocean. Additionally, Elsworth et al. (2003) demonstrated that crocodiles have a
broad range of thermal independence in swimming efficiency, allowing animals to disperse at
suboptimal body temperatures. All of this evidence demonstrates that Crocodylus species are
better adapted to a marine environment than other extant crocodylians, and perhaps capable of
transoceanic dispersals suggested by molecular and fossil evidence.
Physiologists and molecular systematists have interpreted this physiological evidence in
very different ways, which led to the formation of two different hypotheses that attempt to
explain the distribution of Crocodylus. Some physiologists hypothesize a marine phase in
crocodylid evolution, and that Crocodylus species evolved from a circumtropically-distributed
19
marine ancestor (Taplin and Grigg, 1989; Taplin et al., 1985). Molecular systematists
hypothesize that the suite of osmoregulatory characters possessed by crocodylids represent
adaptations to an estuarine environment by an ancestor, which in turn gave its descendents the
ability to survive rare transoceanic dispersals (Densmore, 1983; Dessauer et al., 2002).
Other evidence of the capability of ancestral Crocodylus species to cross extensive
marine barriers comes from crocodylian reproductive biology. Multiple paternity has been
demonstrated in Alligator mississippiensis (Davis et al., 2001), and there is anecdotal evidence of
sperm storage in the dwarf caiman, Paleosuchus palpebrosus (Davenport, 1995). If these traits
are possessed by Crocodylus species, it would increase the likelihood of a lone female
establishing a viable population in a novel habitat, for stored sperm from multiple males could
fertilize her eggs, producing a more diverse and adaptable clutch. However, the occurrence of
either of these traits within Crocodylus is little explored, although recent work has demonstrated
multiple paternity in C. moreletii (John McVay, personal communication).
Despite all this evidence in favor of transoceanic dispersals, results of recent work based
on whole mitochondrial genomes suggest such dispersals may not be necessary to explain the
distribution of Crocodylus. Using protein-coding sequences from whole mitochondrial genomes
of 7 crocodylians, including two Crocodylus (C. niloticus and C. porosus), Janke et al. (2005)
estimated the divergence times among crocodylian lineages with penalized likelihood and
Bayesian relaxed-clock methods. The confidence interval for the divergence between the Nile
and saltwater crocodiles goes as far back as 39 million years before present. Depending on
where these two species fall in the Crocodylus phylogeny, this suggests that some divergences
within Crocodylus may extend back prior to the opening of the Atlantic Ocean, or at least to a
period when its breadth was much narrower. However, the results of Janke et al. (2005) are
20
potentially plagued with problems. First, all of the fossil calibration points used in their analyses
fall well outside of Crocodylia. The nearest calibration used was the divergence between
crocodylians and birds, two groups that have approximately 490 – 510 million years of evolution
between them. Using such deep calibration points for a rapidly evolving marker like the
mitochondrial genome may drastically underestimate mutation rates due to saturation and
consequently overestimate divergence times. All of Janke et al.’s (2005) divergence time
estimates within Crocodylia are far older than the fossil record suggests. For example, the
divergence between Alligatorinae and Caimaninae is thought to be among the best fossil
calibration dates among all vertebrates (Muller and Reisz, 2005), with a narrow range of 64 – 71
mya (Brochu, 1999; Brochu, 2003; Brochu, 2004c; Muller and Reisz, 2005). Janke et al.’s
(2005) Bayesian estimate of this divergence time was 101 – 135 mya. Janke et al.’s (2005)
divergence estimates would require long gaps in the fossil record for all the major crocodylian
lineages, which given the apparent richness of crocodylian fossils and conduciveness of
crocodile habitat and morphology to fossilization, seems highly unlikely. Nonetheless, the
results of Janke et al. (2005) demand this issue be addressed. Accurate dating of the divergences
within Crocodylus likely will require a large molecular dataset that includes nuclear DNA and
more appropriate calibrations.
OUT OF AFRICA?
Currently, there is an “out of Africa” paradigm regarding the biogeographic origin of
Crocodylus (Brochu, 2000a; Delfino et al., 2007). However, this assertion is based largely on
the ambiguous basal relationships of Crocodylinae. This hypothesis stems from the phylogenetic
hypothesis supported by morphological data (Brochu, 2000a; Brochu, 2000b), which places the
African dwarf crocodile (Osteolaemus tetraspis) as sister to Crocodylus, and the African slender-
21
snouted crocodile (C. cataphractus) as the basal-most member of Crocodylus. Thus, according
to the morphological tree, the two basal-most crocodyline lineages currently reside in Africa.
However, this topology may be inaccurate and therefore misleading. As discussed above,
molecular evidence suggests C. cataphractus may be sister to Osteolaemus tetraspis (Gatesy et
al., 2004; Li et al., 2007; McAliley et al., 2006; Schmitz et al., 2003; White, 1992; White and
Densmore, 2000; Willis et al., 2007), which would make these two taxa a deeply divergent sister
group (at least 20 mya [Brochu, 2004c]) to the remaining, relatively young Crocodylus species.
If the molecular data are correct, it would render the “out of Africa” hypothesis doubtful, based
solely on the fact that the distant, and likely relictual, outgroup to Crocodylus (Osteolaemus + C.
cataphractus) currently is restricted to Africa.
The fossil record is also cited as supporting the “out of Africa” hypothesis (Brochu,
2000a). Some of the oldest Crocodylus fossils date to the Late Miocene of Africa. However,
these fossils are of C. cataphractus (Brochu, 2000a; Tchernov, 1986), and thus may not belong
within Crocodylus. The first appearance of an unequivocal Crocodylus in Africa is that of C.
niloticus, which does not appear in the fossil record until the Late Pliocene (2-3 mya; Tchernov,
1986), well after the appearance of the genus in Asia (Brochu, 2000a; Lydekker, 1886; Mook,
1933), Australia (Molnar, 1979; Willis, 1997), and the New World (Miller, 1980). Furthermore,
the oldest fossils that appear to belong within the non-cataphractus Crocodylus clade are that of
C. palaeindicus (Brochu, 2000b) from India and Southeast Asia. Thus, depending on the true
placement of C. cataphractus, the fossil record may actually refute the “out of Africa”
hypothesis.
22
SURVIVING EXTINCTION
Perhaps the most intriguing aspect of Crocodylus evolution is the fact that the genus was
able to speciate and disperse around the globe during a period when crocodilians underwent a
massive extinction. At the Pliocene-Pleistocene boundary, there was a precipitous decline in
crocodilian diversity coincident with global cooling and glacial advancement (Markwick, 1998).
The number of genera is estimated to have dropped from approximately 26 to eight during this
short period, which represents the highest per-genus crocodilian extinction rate over the last 100
million years (Markwick, 1998). As a result, most extant crocodilians represent the surviving
relicts of successful pre-Pleistocene lineages, both in terms of diversity and distribution. For
example, a great diversity of Caimaninae, Gavialis-related taxa, Tomistominae, Osteolaemus-
related taxa, and the currently unrepresented Mekosuchinae vanish from the fossil record near
the end of the Tertiary (Brochu, 2003). However, the true crocodiles exhibit a much different
pattern. When fossils assignable to the crown-group Crocodylus (excluding C. cataphractus)
finally appear in the Pliocene many are designated directly to living species (Miller, 1980;
Molnar, 1979; Tchernov, 1986), thus there is no evidence for a tremendous loss of diversity in
this genus at the end of the Tertiary. To determine if Crocodylus maintained or increased
diversity through the most dismal period in crocodylian evolution, an accurate phylogeny and
accompanying divergence estimates of the entire genus are necessary. If the genus did in fact
diversify during this time, the phylogeny can be used to analyze the evolution of ecologically
important characters to begin to understand how the true crocodiles were successful when so
many of their relatives were not.
23
THE NILE CROCODILE(S)
The recent discovery of small isolated populations of crocodiles living in ephemeral
water holes in the sub-Saharan desert habitat of Southeastern Mauritania raised the question of
whether these newly discovered populations represented a distinct species (Shine et al., 2001).
Schmitz et al. (2003) analyzed a mitochondrial 12S rDNA sequence of C. niloticus from 13
different populations throughout its range, including the newly discovered Mauritania
populations, to determine if sub-Saharan populations were distinct or merely represent small,
relict populations of C. niloticus. Their results were surprising, suggesting C. niloticus
represents two distinct eastern and western species, divided along central Africa. Even more
interestingly, western C. niloticus were sister to C. johnstoni (the intended outgroup) rather than
eastern C. niloticus in both the maximum likelihood and Bayesian inference trees. Similarly, the
sequence divergence between eastern C. niloticus and C. johnstoni was nearly equidistant as that
between the two Nile crocodiles (Schmitz et al., 2003). A more rigorous phylogenetic analysis
of the genus needs to be performed to determine if the Nile crocodile is in fact two distinct
species, and whether or not they are each other’s closest relatives.
Brochu (2000a) has speculated that the Nile crocodile may represent a reinvasion of
Africa from the New World. In some molecular analyses, C. niloticus resides in a clade with
New World species (Brochu and Densmore, 2000; Gatesy et al., 2004; White, 1992; White and
Densmore, 2000), and paleontological evidence suggests that C. niloticus has only been present
in Africa since the Late Pliocene (2-3 mya; Tchernov, 1986), whereas the presence of
Crocodylus fossils in the New World dates back to 4 mya (Miller, 1980). Thus, it is possible that
C. niloticus represents two different reinvasions of Africa, both perhaps, from the New World.
24
This is entirely speculative, and requires rigorous phylogenetic and biogeographic analyses to be
elucidated.
THE NEW GUINEA CROCODILE(S)
Evidence suggests northern and southern populations of the endemic New Guinea
freshwater crocodile, C. novaeguineae, are distinct forms and may represent two separate
species. Cox (1984) noted striking differences in reproductive biology and cranial osteology
between populations of C. novaeguineae occurring north and south of the central cordillera of
New Guinea. Hall (1989) followed up on Cox’s findings and revealed statistically significant
differences in palatal structure and cervical squamation between northern and southern forms,
which are perhaps isolated by New Guinea’s central cordillera. Hall (1989) also demonstrated
differences between the forms based on reproductive biology; southern C. novaeguineae laid
significantly fewer and larger eggs than the northern form. The two forms also nest during
opposite seasons, whereas northern and southern sympatric C. porosus populations nest in unison
(Hall, 1989). To further complicate this matter, C. novaeguineae has often been considered
conspecific with the Philippine crocodile, C. mindorensis (Wermuth, 1953; Wermuth and Fuchs,
1978; Wermuth and Mertens, 1961). A molecular analyses with appropriate taxonomic sampling
is required to determine if the northern and southern populations of New Guinea crocodile are
distinct, and whether either or both is distinct from the Philippine crocodile.
THE BORNEO CROCODILE
A freshwater crocodile endemic to Borneo was originally described by Muller and
Schlegel (1844) as Crocodylus raninus. The syntypes from this original description have not
been located, and most authors have assumed C. raninus to be synonymous with C. porosus
(Boulenger, 1889; Gray, 1844; Gray, 1862; Gray, 1869), C. siamensis (Gray, 1869), or C.
25
palustris (Bartlett, 1895; Gray, 1844; Gray, 1862), and not a distinct species. However, Ross
(1990) discovered three specimens that he diagnosed as C. raninus, and later (1992) designated
one of these specimens as the lectotype of C. raninus, apparently reaffirming its taxonomic
validity as a distinct Bornean-endemic, freshwater crocodile. Given the ambiguity surrounding
this taxon, fieldwork is necessary to determine if populations of freshwater crocodile still exist in
Borneo, and if so, whether or not they are deserving of species status.
THE EVOLUTION OF NESTING HABIT
Crocodylians are oviparous and females deposit their eggs into a nest. Females of each
species construct these nests in one of two ways: 1) by excavating a hole in the ground (hole
nesting), or 2) constructing a mounded nest from mud or vegetative matter (mound nesting)
(Neill, 1971). Other than two exceptions (C. acutus and C. rhombifer), each crocodylian species
adopts only one of these two strategies. Previously, this was thought to be a phylogenetically
conserved characteristic, and was even used as a character for phylogenetic inference (Gatesy et
al., 2004; Greer, 1970; Poe, 1996). Others have posited that nesting habit is determined to some
extent by the environment inhabited by a species rather than phylogenetic inertia, and as a result,
is likely an evolutionarily labile trait (Campbell, 1972; Neill, 1971). To resolve this debate, the
evolutionary history of nesting habit within crocodylians needs to be inferred by mapping this
character onto a robust phylogeny of the group that is based on an independent dataset of
neutrally or near-neutrally evolving molecular markers.
THE EVOLUTION OF BODY SIZE AND HABITAT PREFERENCE
The American (C. acutus), saltwater (C. porosus), and Nile (C. niloticus) crocodiles are
unique among extant crocodylians in that they regularly inhabit coastal, brackish environments
(Cott, 1961; Ross, 1998). The remaining species, though they can occasionally be found in
26
estuarine environments, are predominantly inland, freshwater-restricted species (Groombridge,
1987; Ross, 1998). Interestingly, all three estuary inhabiting species are among the largest
crocodylians and, along with C. intermedius, are substantially larger than all the other
Crocodylus and Osteolaemus species (Cott, 1961; Greer, 1974; Ross, 1998). In other words,
within the crocodyline clade, “saltwater” crocodile species tend also to be the largest, with the
exception of the large, predominantly freshwater C. intermedius. This pattern raises the question
of whether maximum body size and habitat preference are evolutionarily correlated. Thanks to
recent advances in maximum-likelihood and Bayesian ancestral character-state reconstruction
techniques (Pagel, 1994; Pagel, 1999; Pagel and Meade, 2007; Pagel et al., 2004), these types of
evolutionary hypotheses can now be tested using a phylogeny.
SUMMARY AND RESEARCH OBJECTIVES BY CHAPTER
SUMMARY A great paucity of knowledge exists regarding the evolutionary history of the most
species-rich crocodylian genus, Crocodylus. Much of this lack of knowledge can be attributed to
two phenomena: 1) the tremendous focus placed on the upper-level phylogenetic relationships
of Crocodylia during the last two decades in an attempt to resolve the debate between
morphology and molecules regarding the placement and affinities of Gavialis, and 2) the
extremely low levels of genetic divergence among Crocodylus species in comparison to the rest
of Crocodylia. As a result, many intriguing questions of Crocodylus evolution remain, and the
answers to all of which begin with a good phylogeny. Thus, rigorous molecular phylogenetic
analyses seem like a logical first step. These analyses should include nuclear loci to complement
mitochondrial data in accurately elucidating the evolutionary history of the genus. Larger
sample sizes also are required to ensure that the true diversity of the genus is realized in such
27
analyses. I believe significant findings await further investigation of the genus Crocodylus.
Understanding the evolutionary history of a vertebrate genus that potentially established such an
impressive distribution independent of vicariant events during a period of evolutionary history
marked by mass extinctions of closely related taxa may have broad implications on evolutionary
and conservation biology. As such, my research objectives are as follows.
CHAPTER 2
1) Resolve the interspecific phylogenetic relationships within Crocodylus using a large
molecular dataset composed of mitochondrial DNA and multiple, independent
nuclear loci, and in doing so, address the following questions:
a. Is Crocodylus monophyletic?
b. Does C. niloticus represent multiple distinct species?
c. Is C. novaeguineae distinct from C. mindorensis and comprised of multiple
species?
2) Estimate the divergence times within Crocodylia using a large molecular dataset and
Bayesian relaxed-clock methods, and in doing so, address the following questions:
a. Is vicariance a tenable explanation of the circumtropical distribution of
Crocodylus, or do transoceanic dispersals need to be invoked?
3) Infer the biogeographic history of Crocodylus by reconstructing ancestral
distributions within the genus using parsimony, dispersal-vicariance, maximum-
likelihood, and Bayesian analyses, and in so doing answer the following questions:
a. If vicariance is untenable, what is the minimum number of transoceanic
dispersals required to explain the contemporary distribution of the genus?
28
b. Did Crocodylus originate in Africa as suggested by the current “out-of-
Africa” paradigm?
4) Further develop objective methods for partition choice in mixed-model phylogenetic
analyses.
CHAPTER 3
1) Investigate ecological character evolution within Crocodylus, using the phylogeny
estimated in Chapter 1 and parsimony and maximum-likelihood ancestral character-
state reconstruction methods, to answer the following questions:
a. Is nesting habit a phylogenetically conserved character?
b. Is body size evolutionarily correlated with habitat preference?
29
CHAPTER 2 MOLECULAR PHYLOGENETICS AND BIOGEOGRAPHY OF
CROCODYLIA
INTRODUCTION
Other than birds, eusuchian crocodylians represent the only surviving members of the
once dominant class Archosauria. Over the last 25 years, a large literature has amassed
regarding the evolutionary history of the order Crocodylia, largely due to the exhaustive efforts
of systematists to resolve the disparity between molecular and morphological data regarding the
phylogenetic placement of the true gharial, Gavialis gangeticus. Morphological data supported
the traditional placement of Gavialis as the basal-most extant crocodylian (Brochu, 1997; Norell,
1989), but overwhelming molecular evidence has solidified Gavialis as the sister of Tomistoma
and a basal split between alligatorids and crocodylids (Aggarwal et al., 1994; Densmore, 1983;
Densmore and Dessauer, 1984; Densmore and Owen, 1989; Densmore and White, 1991; Gatesy
et al., 2003; Gatesy and Amato, 1992; Gatesy et al., 2004; Gatesy et al., 1993; Harshman et al.,
2003; Hass et al., 1992; Janke et al., 2005; Li et al., 2007; McAliley et al., 2006; Poe, 1996;
White, 1992; White and Densmore, 2000; Willis et al., 2007). The Gavialis debate has received
so much focus that many issues concerning the lower-level relationships within Crocodylia have
gone unresolved. One example is the interspecific affinities within the most broadly distributed,
ecologically diverse, and species-rich crocodylian genus, Crocodylus.
Crocodylus is distributed circumtropically (Figure 2.1) and comprises more than half (12
of 23 species) of all crocodylian diversity (Figure 2.2). The 12 named species of Crocodylus,
commonly called the true crocodiles, range from the broadly distributed largest living reptile, the
saltwater crocodile (C. porosus), to relatively small-bodied, narrowly distributed, freshwater
island endemics (e.g. C. novaeguineae, C. mindorensis, and C. rhombifer) (Neill, 1971). Most
30
FIGURE 2.1. The approximate geographic distributions of all Crocodylus and Osteolaemus species.
31
molecular phylogenetic studies of Crocodylia included only a subset of the 12 named Crocodylus
species (Aggarwal et al., 1994; Brochu, 1997; Brochu and Densmore, 2000; Gatesy et al., 2003;
Gatesy and Amato, 1992; Gatesy et al., 1993; Harshman et al., 2003; Hass et al., 1992; Janke et
al., 2005; Li et al., 2007; McAliley et al., 2006; Schmitz et al., 2003; Willis et al., 2007). Due to
the low genetic divergence among the true crocodiles, those studies that have included all 12
species were unable to resolve and/or support the interspecific relationships within the genus and
have yielded largely incongruent results (Densmore, 1983; Densmore and Owen, 1989;
Densmore and White, 1991; Gatesy et al., 2004; Gratten, 2003; Poe, 1996; White, 1992; White
and Densmore, 2000). As a result, much uncertainty remains regarding the evolutionary history
of this genus.
MONOPHYLY OF CROCODYLUS
Uncertainty remains regarding the monophyly of Crocodylus. Some phylogenetic
estimates support monophyly of the genus, whereas others place the African slender-snouted
crocodile, C. cataphractus, sister to the African dwarf crocodile, Osteolaemus tetraspis, or
outside a clade comprising Osteolaemus and the remaining Crocodylus, rendering the genus
paraphyletic (Table 2.1). Despite the ambiguity regarding the placement of C. cataphractus,
Schmitz et al. (2003) and McAliley et al. (2006) have recommended elevating this species into
the resurrected genus Mecistops. However, it remains to be seen if this taxonomic revision is in
fact necessary. As such I will refer to the African slender-snouted crocodile as C. cataphractus
throughout this chapter, and will address the need for this revision in the discussion.
ISSUES OF DIVERSITY WITHIN CROCODYLUS There is substantial uncertainty regarding the number of extant species within
Crocodylus. For example, recent molecular work suggests the Nile crocodile, C. niloticus, may
32
TABLE 2.1. Summary of the published phylogenetic estimates of Crocodylus that support monophyly or paraphyly of the genus. Note that many of the results shown in the table are not independent of one another. Dataset Monophyly Paraphyly albumin distances (Densmore, 1983) ✔ globin peptide distances (Densmore, 1983) ✔ combined RFLPs (Densmore and White, 1991) ✔ ND6 – cytb mtDNA (White, 1992) ✔ combined dataset (Poe, 1996) ✔ 18S rDNA RFLPs ✔ 28S rDNA RFLPs ✔ mtDNA (White and Densmore, 2000) ✔ morphology (Brochu, 2000b) ✔ mtDNA + morphology (Brochu and Densmore, 2000) ✔ mt 12S rDNA (Schmitz et al., 2003) ✔ supermatrix (Gatesy et al., 2004) ✔ mt 12S rDNA RFLPs ✔ 18S rDNA RFLPs ✔ 28S rDNA RFLPs ✔ BDNF ✔ cytb ✔ mt 16S rDNA ✔ digenean parasites ✔ c-mos (McAliley et al., 2006) ✔ ODC (McAliley et al., 2006) ✔ ND6 – cytb (McAliley et al., 2006) ✔ Dloop (McAliley et al., 2006) ✔ c-mos + DMP1 (Willis et al., 2007) ✔ Dloop (MP; Li et al. 2007) ✔ Dloop (NJ; Li et al. 2007) ✔ represent multiple species that may not be sister taxa (Schmitz et al., 2003). Also, morphological
and ecological evidence suggests northern and southern populations of the New Guinea
crocodile, C. novaeguineae, may represent distinct lineages (Cox, 1984; Hall, 1989). To further
complicate this matter, C. novaeguineae has often been considered conspecific with the
Philippine crocodile, C. mindorensis (Wermuth, 1953; Wermuth and Fuchs, 1978; Wermuth and
Mertens, 1961). To date, no phylogenetic study has included the necessary intraspecific
sampling necessary to determine if the current taxonomy within the genus is accurate.
33
A RECENT RADIATION AND TRANSOCEANIC DISPERSAL EVENTS Traditional taxonomic treatments of Crocodylus stereotyped the genus as a group of
ancient, conserved species (“living fossils”) that date back to the Cretaceous period (Kälin, 1955;
Lydekker, 1886; Mook, 1927; Mook, 1933; Sill, 1968). Adhering to this notion and the
assumption that crocodiles were incapable of crossing marine barriers, early biogeographic
explanations of the genus’s distribution invoked dispersal via ancient landbridges (Schmidt,
1924; Sill, 1968). However, after the general acceptance of plate tectonic theory, the
biogeographic paradigm shifted to a vicariant explanation that assumed extant Crocodylus
species were ancient relicts that predated continental breakup (Brooks, 1979; Brooks and
O'Grady, 1989). The notion that Crocodylus may represent a relatively recent radiation, was
introduced by early molecular studies demonstrating strikingly low levels of interspecific genetic
divergence (Densmore, 1983; Densmore and White, 1991; White, 1992). These molecular
results fueled reassessment of the paleontological evidence by use of rigorous cladistic methods
(Brochu, 1997; Brochu, 2000b; Salisbury and Willis, 1996), the results of which demonstrated
that paleontologists had been applying the name “Crocodylus” to a wide variety of non-
alligatorid fossil taxa based on general gestalt and plesiomorphic characters (Brochu, 2000a;
Brochu, 2000b). Thus, the ancient “Crocodylus” upon which the traditional theories of crocodile
evolution were based, were not part of the crown-group genus of true crocodiles. After these
misnamed taxa were identified, and only fossil taxa placed within the clade of extant Crocodylus
by cladistic analyses were considered, the molecular and paleontological data were strikingly
congruent (Brochu, 2000a; Brochu, 2003).
Multiple basal divergence time estimates of Crocodylus, based on constant rates of amino
acid (Densmore, 1983) and nucleotide (Gratten, 2003; White, 1992) sequence evolution, all were
34
less than 10 million years, suggesting the genus represents a post-Middle-Miocene radiation.
Concordant with these molecular data, the oldest fossils belonging to the crown-genus date from
the Miocene-Pliocene boundary or later (Brochu, 2000a; Delfino et al., 2007; Lydekker, 1886;
Mead et al., 2006; Miller, 1980; Molnar, 1979; Mook, 1933; Salisbury et al., 2006; Willis, 1997).
Interestingly, by the early Pliocene, putative Crocodylus fossils are known from Africa (Brochu,
2000a; Tchernov, 1986), Australia (Molnar, 1979; Willis, 1997), Asia (Brochu, 2000a;
Lydekker, 1886; Mook, 1933), and the New World (Miller, 1980), suggesting that if the genus
originated in the Late Miocene, it colonized the globe quite rapidly. If these concordant
molecular and paleontological data are correct, Crocodylus speciated well after continental
breakup and formation of the Atlantic Ocean. This would render traditional explanations of the
circumtropical distribution of Crocodylus based on vicariance untenable. Rather, the African,
Indo-Asian and Australasian distributions of Crocodylus require the crossing of many marine
barriers, and more significantly, at least one transoceanic dispersal event via the Atlantic or
Pacific is necessary to explain the four Crocodylus species of the Americas and Caribbean.
Contrary to the growing acceptance of long distance, overwater dispersal in Crocodylus
evolution (Brochu, 2000a; Dessauer et al., 2002), the results of recent work based on whole
mitochondrial genomes suggest such dispersal events may not be required to explain the current
distribution of the genus. Using protein-coding sequences from whole mitochondrial genomes of
7 crocodylians, including two Crocodylus (C. niloticus and C. porosus), Janke et al. (2005)
estimated the divergence times among crocodylian lineages with penalized likelihood and
Bayesian relaxed-clock methods. The confidence interval for the divergence between the Nile
and saltwater crocodiles goes as far back as 39 million years before present. Depending on
where these two species fall in the Crocodylus phylogeny, this suggests that some divergences
35
within Crocodylus may extend back prior to the opening of the Atlantic Ocean, or at least to a
period when its breadth was much narrower. However, all of Janke et al.’s (2005) divergence
time estimates are much older than suggested by the fossil record, and may have been plagued by
homoplasy (see discussion). Nonetheless, their results demonstrate the need for further work on
this issue before any hypotheses can be accepted.
OUT OF AFRICA?
Currently, there is an “out of Africa” paradigm regarding the biogeographic origin of
Crocodylus (Brochu, 2000a; Delfino et al., 2007). However, this assertion is based largely on
the ambiguous basal relationships of Crocodylinae. This hypothesis stems from the phylogenetic
hypothesis supported by morphological data (Brochu, 2000a; Brochu, 2000b), which places the
African dwarf crocodile (Osteolaemus tetraspis) as sister to Crocodylus, and the African slender-
snouted crocodile (C. cataphractus) as the basal-most member of Crocodylus. Thus, according
to the morphological tree, the two basal-most crocodyline lineages currently reside in Africa.
However, this topology may be inaccurate and therefore misleading. As discussed above,
molecular evidence suggests C. cataphractus may be sister to Osteolaemus tetraspis (Gatesy et
al., 2004; Li et al., 2007; McAliley et al., 2006; Schmitz et al., 2003; White, 1992; White and
Densmore, 2000; Willis et al., 2007), which would make these two taxa a deeply divergent sister
group (at least 20 mya [Brochu, 2004c]) to the remaining, relatively young Crocodylus species.
If the molecular data are correct, it would render the “out of Africa” hypothesis doubtful, based
solely on the fact that the distant, and likely relictual, outgroup to the genus (Osteolaemus + C.
cataphractus) currently is restricted to Africa.
The fossil record is also cited as supporting the “out of Africa” hypothesis (Brochu,
2000a). Some of the oldest Crocodylus fossils date to the Late Miocene of Africa. However,
36
these fossils are of C. cataphractus (Brochu, 2000a; Tchernov, 1986), and thus may not belong
within Crocodylus. The first appearance of unequivocal Crocodylus in Africa is that of C.
niloticus, which does not appear in the fossil record until the Late Pliocene (2-3 mya; Tchernov,
1986), well after the appearance of the genus in Asia (Brochu, 2000a; Lydekker, 1886; Mook,
1933), Australia (Molnar, 1979; Willis, 1997), and the New World (Miller, 1980). Furthermore,
the oldest fossils that appear to belong within the non-cataphractus Crocodylus clade are that of
C. palaeindicus (Brochu, 2000b) from India and Southeast Asia. Thus, depending on the true
placement of C. cataphractus, the fossil record may actually refute the “out of Africa”
hypothesis.
A NOTE ON CROCODYLIAN TAXONOMY The higher-level classification of Crocodylia has been very unstable, with different
classification schemes grouping the extant species into 1-3 families and 0-4 subfamilies
(Ditmars, 1933; Dowling and Duellman, 1978; Groombridge, 1987; King and Burke, 1989;
Pope, 1955; Zug et al., 2001). This situation has only been exacerbated by the change in
phylogenetic position of Gavialis. Recently, Willis et al. (2007) proposed placing Tomistoma
within Gavialidae in light of their sister relationship. However, since Gavialis was the taxon to
change its position on the crocodylian tree (from the base to being nested within Crocodylidae),
whereas Tomistoma remained in its historical position, it seems more logical to revise the family-
level classification of Gavialis. Thus, I adhere to the taxonomy of Janke et al. (2005), which
includes two families within Crocodylia, Alligatoridae and Crocodylidae, and considers Gavialis
as part of the latter. Furthermore, I propose a complete and novel higher-level classification of
the order Crocodylia (Figure 2.2), and I adhere to this scheme throughout this work.
37
Order Crocodylia Family Alligatoridae Subfamily Alligatorinae – the alligators Genus Alligator A. mississippiensis - American alligator) A. sinensis - Chinese alligator Subfamily Caimaninae – the caimans Genus Caiman – the true caimans C. crocodilus – spectacled or common caiman C. yacare – Yacaré caiman C. latirostris – broad-snouted caiman Genus Melanosuchus M. niger – black caiman Genus Paleosuchus – the dwarf caimans P. palpebrosus – Cuvier’s dwarf, or dwarf caiman P. trigonatus – Schneider’s dwarf, or smooth-fronted caiman Family Crocodylidae Subfamily Crocodylinae – the crocodiles Genus Crocodylus – the true crocodiles C. acutus – American crocodile C. intermedius – Orinoco crocodile C. rhombifer – Cuban crocodile C. moreletii – Morelet’s crocodile C. niloticus – Nile crocodile C. siamensis – Siamese crocodile C. palustris – mugger crocodile C. porosus – estuarine or saltwater crocodile C. mindorensis – Philippine crocodile C. novaeguineae – New Guinea crocodile C. johnstoni – Australian freshwater crocodile ? C. cataphractus – African slender-snouted crocodile ? ? Genus Mecistops – the African slender-snouted crocodiles ? ? M. cataphractus – African slender-snouted crocodile ? Genus Osteolaemus O. tetraspis – African dwarf crocodile Subfamily Gavialinae – the gharials Genus Gavialis G. gangeticus – true or Indian gharial Genus Tomistoma T. schlegelii – false gharial FIGURE 2.2. A new hierarchical taxonomic classification of Crocodylia that incorporates the molecular placement of Gavialis. This classification is used throughout the paper. The question marks indicate the two possible taxonomic positions of Crocodylus cataphractus.
38
MIXED-MODELS IN PHYLOGENETICS
Mixed-model or partitioned (used interchangeably throughout) phylogenetic analyses
incorporate multiple evolutionary submodels, which fit different subsets of the data, into a single
complex model used during the tree search (Yang, 1996). Such analyses are becoming
increasingly common, especially in a Bayesian context. With the advent of readily available
software allowing partitioned analyses within a maximum likelihood (ML) framework (e.g.
RAxML [Stamatakis, 2006], TREEFINDER [Jobb, 2007], HyPhy [Pond et al., 2005]), it appears
this method will soon be the phylogenetic standard. This is not surprising, considering that
partitioned analyses are potentially less susceptible to the problem of mismodeling that occurs
when a single “compromise” model is forced to fit large, evolutionarily heterogeneous datasets
(Brandley et al., 2005; Nylander et al., 2004; Wilgenbusch and de Queiroz, 2000). Such
mismodeling can introduce statistical inconsistency as a result of systematic error misleading the
phylogenetic estimate (Bull et al., 1993; Huelsenbeck and Rannala, 2004; Nylander et al., 2004;
Reeder, 2003; Wilgenbusch and de Queiroz, 2000). This problem is potentially mitigated in
mixed-model analyses by fitting multiple, partially or completely independent submodels of
nucleotide evolution to more homogeneously evolving subsets of a dataset (Brandley et al.,
2005; Nylander et al., 2004; Yang, 1996). Despite this potential, mixed-model analyses are only
as good as the data-partitioning scheme to which they are applied.
As more partitions and accompanying submodels are incorporated into a single analysis,
the complexity of the overall model of evolution increases, as does the complexity of model
selection (Nylander et al., 2004). The additional model selection complexities introduced by
partitioning include, but are not limited to: determining the optimum number of partitions for a
dataset, determining the optimum strategy of assigning characters to a given number of partitions
39
(e.g. by gene identity, codon position, genome, etc.), determining which submodels to apply to
each partition, and determining which model parameters will be estimated independently among
the various partitions. The first two issues are the least explored, and particularly difficult to
solve considering there are nearly infinite ways to partition a large sequence alignment. The
objective should be to determine the minimum number of partitions, submodels, and parameters
that best explain the data, and thus avoid introducing unnecessary random error to the analysis,
which can potentially mislead the results (Burnham and Anderson, 2002; Cunningham et al.,
1998; Lemmon and Moriarty, 2004; Nylander et al., 2004; Posada and Buckley, 2004).
Additionally, the characters (e.g. nucleotide sites) should be partitioned into groups evolving
under similar biochemical and evolutionary constraints. If not, and the partitions still comprise
heterogeneously evolving characters, we are essentially using multiple “compromise” models.
This may only exacerbate the problem of mismodeling present in single model analyses by
adding more compromised parameters. Worryingly, the current norm in mixed-model analyses
is to assign a partitioning scheme subjectively based on general knowledge of sequence
evolution. Very little work has been done to explore objective methods of choosing the optimal
partitioning strategy that best fits the data while invoking the fewest partitions/parameters.
The studies of Nylander et al. (2004), Brandley et al. (2005), Castoe et al. (2005), and
Castoe and Parkinson (2006) represent attempts to employ objective model-selection statistics
for the purpose of selecting among a priori partitioning schemes. These seminal studies,
although clearly a step in the right direction, only deal with two model-selection statistics (Bayes
factors and Akaike weights) and Bayesian analyses. In all cases, the most partitioned strategy
was determined to be optimal, suggesting that either further partitioning would be beneficial, or
the model selection methods are not conservative enough within a Bayesian framework and are
40
allowing overparameterization. More work is needed to better understand the behavior of
various model-selection criteria when applied to the problem of partition choice. Specifically,
the use of larger datasets comprised of more heterogeneous sequence data (i.e. nuclear and
mitochondrial data), and multiple analytical frameworks (ML and Bayesian) would prove
insightful. Also, more model-selection criteria need to be explored to determine the limits of
partitioning and ensure we are not exceeding these limits by overparameterizing.
OBJECTIVES This study uses the largest crocodylian DNA sequence alignment to date, both in terms of
taxonomic sampling and base pairs of sequence data, to infer the relationships of all Crocodylia,
with a particular focus on obtaining a robust phylogeny of Crocodylinae. The dataset is also
used to estimate accurate divergence times across Crocodylia to test the dispersal or vicariance
hypotheses regarding the evolutionary history of Crocodylus. ML and Bayesian methods of
ancestral character-state reconstruction, including character-state constraint tests, are used to test
the “out of Africa” hypothesis of the biogeographic origin of Crocodylus. Topological constraint
tests are used to test various hypotheses regarding relationships of the crocodylines, including
monophyly of the genus. Furthermore, the effect of the degree and strategy of data partitioning
on both ML and Bayesian phylogenetic inference is explored using a suite of model selection
statistics and a large, concatenated mitochondrial and nuclear sequence dataset of all extant
crocodylians.
METHODS
SAMPLING AND DATA COLLECTION Tissue samples were obtained from all 23 described crocodylian species. The number of
samples per species ranged from one to ten, for a total of 80 individuals (Appendix A). Many of
41
the tissues used in this study were frozen-preserved samples borrowed from the Genetic
Resources Collection of the Louisiana State University Museum of Natural Science (LSUMZ).
The remaining tissues were provided by Kent A. Vliet of the Department of Zoology, University
of Florida. Most of the tissues are not vouchered (Appendix A).
DNA sequences were obtained from four regions of the mitochondrial genome. These
regions include the cytochrome b (cytb) gene and portions of flanking tRNA genes for glutamic
acid (tRNAGlu) and threonine (tRNAThr), nicotinamide adenine dinucleotide dehydrogenase
subunit 2 (ND2) and portions of flanking tRNA genes for methionine (tRNAMet) and tryptophan
(tRNATrp), nicotinamide adenine dinucleotide dehydrogenase subunit 3 (ND3) and portions of
flanking tRNA genes for glycine (tRNAGly) and arginine (tRNAArg), and the 5′ end of the control
region (Dloop) and portion of adjacent tRNA gene for phenylalanine (tRNAPhe). DNA
sequences were obtained from nine regions of the nuclear genome, including a portion of the
entirely exonic oocyte maturation factor c-mos, and eight exon primed, intron-crossing loci
(Appendix A), for which LDHBexon6intF/LDHBexon7intR (48°C) was used. Primer
44
combination LAI7_F1/LAI7_R1 was used to amplify LDH-A following the PCR thermocycle
program described by Gatesy et al. (2004). Primer combinations ACTBexon3F/ACTBexon4R,
AChRexon7F/AChRexon8R, and RHOexon2F/RHOexon3R were used to amplify ACTB,
AChR, and RHO, respectively, under the following “touchdown” thermocycle conditions: 1)
95°C for 2 min, 2) 17 cycles of 94°C for 0:45 min, the annealing temperature for 0:45 min, and
72°C for 1 min, starting with an annealing temperature of 65°C and decreasing by 1°C per cycle,
3) 28 cycles of 94°C for 0:45 min, 48°C for 0:45 min, and 72°C for 1 min, and 4) ending with a
6 min 72°C extension.
SEQUENCE ANALYSIS Sequences were edited and aligned using Sequencher 4.7 (Gene Codes Corporation, Ann
Arbor, MI). The reading frames of all protein-coding regions were identified and translated into
amino acids to confirm the absence of stop codons. For non-protein-coding loci that contained
indels, alignments were produced with Sequencher 4.7, ClustalW (Thompson et al., 1994), and
T-Coffee 4.85 (Notredame et al., 2000), and used to guide a manual alignment. Any regions that
could not be unambiguously aligned were removed. Complete mitochondrial genomes of six
crocodylian species (Janke and Arnason, 1997; Janke et al., 2001; Janke et al., 2005) were
obtained from GenBank, and used to aid alignments and identification of gene borders for all
mitochondrial sequences. For nuclear EPIC loci, homologous cDNA sequences of Gallus gallus
(and crocodylians when available) were obtained from GenBank and aligned with the collected
sequences. These alignments, along with the “GT-AG rule”, were used to identify intron splice
sites and determine the reading frame of the flanking exons. Furthermore, homologous
sequences of G. gallus obtained from GenBank were aligned with all the crocodylian protein-
coding regions (mitochondrial and nuclear). MESQUITE (Maddison and Maddison, 2006) was
45
Table 2.2. Summary of primers used in PCR and cycle sequence reactions. The numbers used in all mitochondrial primer names refer to the position of the 3′ base in the Alligator mississippiensis mitochondrial genome (Janke and Arnason, 1997). References are as follows: 1 = this work; 2 = Ray and Densmore (2002); 3 = Gratten (2003); 4 = Waltari and Edwards (2002); 5 = Friesen et al. (1999); 6 = Friesen et al. (1997) 6* = modified from Friesen et al. (1997); 7 = Gatesy et al. (2004)
Locus Location Primer Sequence (5′ → 3′) Ref ND6 L14086 GCA AAR AGC ARA CTW AYY ACC CCA TA 1 tRNAGlu L14174 AAW GYM ATT YCC ATT ATT YTC ACT TGG 1 tRNAGlu L14198 TTC AAC CAA AAC CTG AGG YCT G 1 cytb L14508 GCA AAC GGA GCY TCY CTA TTC TTC 1 cytb L14547 ATC GGA CGA GGC CTA TAC TAC 1 cytb L14900 CYG ACA AAR TYC CRT TYC ACC C 1 cytb H14638 CCC TCA GAA TGA TAT TTG TCC TCA 1 cytb H14653 GTR ATY ACG GTT GCC CCT CAG AA 1 cytb H15046 TAG GCR AAT AGG AAR TAT CAT TC 1
Cytb
tRNAThr H15443 YTC TGT CTT ACA AGG CCA GYG CTT 1 tRNAMet L3854 AAA RCT ATT GGG CCC ATA CCC C 1 tRNAMet L3856 AAR CTW TTG GGY CCA TRC CCC AA 1 ND2 L4234 CCA TTY CAC TTC TGA GTR CCA G 1 ND2 L4451 TCC ATY GCC CAA ATR GCA TG 1 ND2 L4453 TCV ATT GCC CAA ATA GCH TGA A 1 ND2 L4454cat TCA ATC GCT CAG ATA GCT TGA AC 1 ND2 L4454siam TCA ATT GCC CAA ATA TCT TGA AC 1 ND2 H4431melano TTC ATG CTA TTT GGG CGA CTG AG 1 ND2 H4432 TTC ADG CTA TTT GGG CAA TBG A 1 ND2 H4433cat GTT CAA GCT ATC TGA GCG ATT G 1 ND2 H4758 GAG TTG TAT CAT AGT CGD AGG TAR AAG 1 ND2 H4815 TTT TCG TCA RAG GCG GGT TRT G 1 tRNATrp H4972 GGC TTT GAA GGC CCT CGG YTT 1
The full dataset as a whole was analyzed under 11 different partitioning schemes (Table
2.3). There are nearly infinite ways even moderately sized datasets may be partitioned, with one
extreme applying a single model to the entire dataset, and the other extreme applying a separate
model to every character. Accordingly, the a priori selection of the 11 partitioning schemes was
guided by general knowledge of biochemical and evolutionary constraints on sequence
evolution. In general, partitions were selected by gene identity (e.g. P14), as sequence regions
50
that may likely evolve similarly (e.g. P8), or some combination of the two. For all 11
partitioning schemes, MrBayes analyses were run for 2.0 × 10⁷ generations.
Several criteria were used to assess stationarity of the cold Markov chain for all MrBayes
analyses. First, negative natural log likelihood (-lnL) versus generation time plots were
visualized using Tracer (Rambaut and Drummond, 2005). Second, the cumulative and non-
overlapping posterior probabilities of the 20 most variable nodes (the cumulative and slide
commands, respectively) were plotted in Are We There Yet? [AWTY (Wilgenbusch et al.,
2004)]. Third, node posterior probabilities were compared between the two independent runs
using the compare command in AWTY. Lastly, consensus trees from the two independent runs
were compared to ensure congruence. A run was assumed to reach stationarity when all of these
criteria yielded patterns congruent with stationarity. All posterior samples of a run prior to this
point were discarded as burn-in. If a run failed to show a pattern congruent with stationarity for
any of these criteria throughout the chain, it was assumed that it failed to converge.
BAYESIAN PHYLOGENETIC ANALYSES OF THE ROOT DATASET The root dataset was analyzed in MrBayes under a single partitioning scheme composed
of 12 partitions: exons by codon position, and cytb, ND2, and ND3 by codon position. Two
independent analyses were run for 19,872,000 generations, sampling every 1000 generations.
All other settings and stationarity assessment were as above.
PARTITIONED MAXIMUM-LIKELIHOOD PHYLOGENETIC ANALYSES All of the partitioning schemes in Table 2.3 also were analyzed using hill-climbing
heuristic searches under the maximum-likelihood optimality criterion using the program
RAxML-VI-HPC-2.2.3 (Stamatakis, 2006). RAxML is a maximum likelihood-based program
that implements computationally efficient branch-swapping algorithms that allow heuristic
51
searches to proceed much faster than traditional ML heuristics for large datasets (Stamatakis et
al., 2005). Additionally, RAxML also allows partitioned analyses within a ML framework.
In all RAxML analyses, the GTR + Γ model of nucleotide substitution was applied to all
partitions. Other than GTR + CAT, this is the only model implemented in RAxML (CAT is a
more computationally efficient approximation of Γ). Model parameters were estimated
separately for each partition as part of the heuristic search. RAxML will only analyze unique
sequences, thus some individuals with identical sequences across the entire dataset were
consolidated and represented as a single sequence in all RAxML analyses. Random starting
trees were used, and the initial rearrangement setting was determined automatically during the
beginning of the search. All analyses were run three times independently to ensure the algorithm
consistently yielded the same topology and was not finding local optima. After the optimal
partitioning strategy was determined (see below), a non-parametric bootstrap analysis with 100
replicates was run using the same settings as the initial searches and the best partitioning scheme
to determine nodal support.
As a third measure of nodal support, a non-parametric bootstrap analysis with 100
replicates was run on the full dataset (treated as one partition) using GARLI v.0.95 [available at
www.bio.utexas.edu/faculty/antisense/garli/Garli.html (Zwickl, 2006)]. GARLI is a program
that utilizes a genetic algorithm to simultaneously explore model parameter, branch length, and
topological space to maximize the likelihood function. It accomplishes this by evolving
populations of trees, in which the fitness of each individual (really a set of parameter estimates,
branch lengths, and a topology) is determined by its lnL score. After many generations of
mutation, selection, and reproduction, each population should converge on the same ML tree.
Three initial, independent ML searches were performed using 4 populations with 4 individuals
52
each, the GTR + I + Γ substitution model, and random starting trees. The searches automatically
terminated when no lnL improvement greater than 0.01 had been encountered in 10,000
generations. After confirming that all three independent analyses yielded the same tree and
nearly identical lnL scores (all within 0.01 lnL of one another), these same settings were used for
the non-parametric bootstrap analysis.
DETERMINING THE OPTIMAL PARTITIONING SCHEME FOR BAYESIAN ANALYSES The Bayes factor (BF) has been used previously as an objective criterion for selecting
among partitioning schemes in mixed-model phylogenetic analyses (Brandley et al., 2005;
Castoe and Parkinson, 2006; Castoe et al., 2005; Nylander et al., 2004). BFs were used in this
study as the primary means of selecting the optimal partitioning strategy from the Bayesian
mixed-model analyses. BFs are more appropriate for comparing posterior distributions of
likelihood scores produced by Bayesian Markov chain Monte Carlo analyses than the likelihood
ratio test (LRT), Akaike information criterion (AIC; [Akaike, 1974]), or Bayesian Information
Criterion (BIC; also called the Schwarz criterion [Schwarz, 1978]). The reason for this is that
BFs compare model (or marginal) likelihoods rather than maximum or near-maximum
likelihoods, for which the LRT, AIC, and BIC are designed to compare (Kass and Raftery, 1995;
Newton and Raftery, 1994; Nylander et al., 2004). The marginal likelihood, which is an integral
over all possible model parameters (and also the denominator of the Bayes theorem), is a better
representation of a posterior distribution of likelihoods than maximum or near-maximum
likelihood scores (Holder and Lewis, 2003; Nylander et al., 2004; Raftery, 1996). The marginal
likelihood represents an “average” of the entire posterior distribution, whereas near-maximum
likelihoods fall in the upper tail of posterior distribution, and thus have very small probabilities.
53
The BF was developed by Jeffreys (1935) as a Bayesian approach to hypothesis testing.
It can be defined as a summary of the evidence from the data in favor of one hypothesis
represented by a statistical model, as opposed to another (Kass and Raftery, 1995). When
comparing model i to model j, the BF is the ratio of their marginal likelihoods:
!
BFij =P(D |Mi)
P(D |M j )
where D is the data, which is assumed to have arisen under one of the two models (Mi and Mj)
according to a probability density P(D|Mi) or P(D|Mj) (Kass and Raftery, 1995). In the case of
the present study, the marginal likelihood of a model (or a given partitioning scheme) is the
integral of the model likelihoods over all possible model parameter values and trees. Needless to
say, calculating the marginal likelihoods directly is not practical. However, it has been
demonstrated that the marginal likelihood is well approximated by the harmonic mean of the
posterior distribution of likelihoods (Newton and Raftery, 1994). Using this approximation, the
BF is the ratio of the harmonic means of the posterior likelihoods sampled at stationarity for the
two partitioned analyses being compared (Brandley et al., 2005):
!
BFij =Harmonic Mean Li
Harmonic Mean L j
The test statistic of the BF is normally 2ln-tranformed. Derivation of 2lnBF may be expressed
as:
!
2lnBFij = 2(ln[Harmonic Mean Li]" ln[Harmonic Mean L j ])
All of the post burn-in posterior lnLs sampled in MrBayes for each partitioned analysis
were input into Mathematica, where they were transformed into likelihoods. Then, the harmonic
mean of the likelihoods from each analysis was calculated and subsequently ln-transformed. The
resulting ln-transformed harmonic mean likelihoods were used to calculate the 2lnBF test
54
statistic for all pairwise comparisons of the 11 partitioning schemes. This method was used
rather than simply using the harmonic mean provided by MrBayes, because Brandley et al.
(2005) demonstrated that the values provided by MrBayes maybe different due to the exclusion
of extreme values (however, see discussion).
Unlike common frequentist (or Neyman-Pearson) statistics (e.g. LRT), when using BFs
the rejection of the null hypothesis is not based on familiar critical P values (e.g. 0.05). Rather,
the significance of a resulting BF is evaluated using a table derived by Jeffreys (1935; 1961) and
modified by Kass and Raftery (1995). See Table 2.4 for a modified version of this table. The
investigator must choose a cutoff value for rejecting the null hypothesis. This is analogous to
arbitrarily selecting a P value in frequentist statistics (Brandley et al., 2005). In this study, if a
2lnBF was greater than 10, the null hypothesis was rejected in favor of the alternative. The
optimal partitioning scheme was considered as the one with the fewest partitions that was not
significantly worse than the scheme with the best harmonic mean likelihood.
TABLE 2.4. Guidelines for interpreting the 2ln Bayes factor (2lnBF). Modified from Kass and Raftery (1995)
2lnBF Evidence against null hypothesis <0 Supports null hypothesis 0 to 2 Weak 2 to 6 Positive 6 to 10 Strong >10 Very Strong
The performance of the BF for selecting the optimal partitioning strategy is not well
explored. In the only cases where it was applied to this problem, the BF selected the most
partitioned analysis (Brandley et al., 2005; Castoe and Parkinson, 2006; Castoe et al., 2005;
Nylander et al., 2004). For this reason, the AIC and BIC methods (see below) of model selection
also were applied to the arithmetic mean of posterior likelihoods of the mixed-model Bayesian
55
analyses. The AIC and BIC were applied to the arithmetic mean rather than the harmonic mean,
which has been used previously for Akaike weights (Castoe and Parkinson, 2006; Castoe et al.,
2005), because the arithmetic mean is an unbiased estimator of the posterior mean of the
likelihood function (Aitkin, 1991; Newton and Raftery, 1994), and is more similar to the
maximum likelihood for which these statistics are designed to compare. Note, these methods are
potentially inappropriate for comparing mean likelihoods of a posterior distribution.
Nonetheless, they are invoked here to serve as a comparison to the BF.
DETERMINING THE OPTIMAL PARTITIONING SCHEME FOR MAXIMUM-LIKELIHOOD ANALYSES
Three methods of model selection were applied to the ML scores of the best tree found in
each of the 11 mixed-model ML analyses run in RAxML: AIC, second-order AIC (AICc
[Hurvich and Tsai, 1989; Sugiura, 1978]), and BIC. The AIC (Akaike, 1974) is an
asymptotically unbiased estimator of he Kullback-Leibler information quantity (Kullback and
Leibler, 1951; Posada and Buckley, 2004), which is a measure of the information lost when
reality is approximated by a model (Posada and Buckley, 2004). The AIC for a given model i is
calculated as:
!
AICi= "2lnL
i+ 2K
i
where Li is the maximum-likelihood of the data under the model i, and Ki is the number of free
parameters in model i. Generally, as more parameters are added to a model, the first term
becomes smaller due to improved fit, whereas the second term becomes larger, serving as a
penalty for the increased random error associated with more parameters. In addition to the free
parameters in the model(s) of nucleotide substitution, the number of branches in the phylogeny
was included in K as recommended by Posada and Buckley (2004), because branch lengths were
56
estimated for each analysis. This will not change the order of AIC values, but can change the
order of values (and thus model selection) for the AICc (see below).
A second-order AIC (AICc [Hurvich and Tsai, 1989; Sugiura, 1978]) is more appropriate
when the sample size is small compared to the number of free parameters. Since the number of
free parameters is large for some of the most partitioned analyses, AICc was also calculated as:
!
AICc
= AIC +2K(K +1)
n "K "1
where n is the sample size, which was approximated in this study by the number of variable sites
in the full dataset alignment.
The Bayesian information criterion (BIC) or Schwarz criterion (Schwarz, 1978) was
designed as an approximation to the log marginal likelihood of a model, and is calculated as:
!
BICi= "2lnL
i+ K
ilnn
where the sample size n was again approximated by the number of segregating sites and K
included the number of branches plus the number of free parameters of the substitution model(s).
Because the BIC is an approximation of the log marginal likelihood, the difference between two
BIC estimates is an approximation of the lnBF [see above (Kass and Wasserman, 1995)]. The
model with the smallest BIC is the model with the maximum posterior probability, if the
competing models have equal priors (Posada and Buckley, 2004). The BIC tends to select less
complex models than the AIC (Forster and Sober, 2004; Kass and Raftery, 1995) and BF
(Raftery 1999; Weakliem, 1999). All else being equal, these three criteria tend to rank in order
from least to most conservative as follows: AIC, AICC, then BIC (Forster and Sober, 2004; Kass
and Raftery, 1995; Posada and Buckley, 2004).
57
TESTING OF PHYLOGENETIC HYPOTHESES
Because Bayesian MCMC methods produce sets of trees proportional to their posterior
probability, support for any given hypothesis can be determined by the proportion of its
occurrence in the posterior (at stationarity). This proportion is simply the P value that
determines whether this hypothesis can be rejected. For the sake of simplicity, I will refer to this
method of hypothesis testing as the Bayesian posterior probability (BPP) test.
Phylogenetic hypotheses also were tested using ML constraint tests. ML heuristic
searches were executed in PAUP* using the same settings as the aforementioned unconstrained
searches, except the topology was constrained to be congruent with a given hypothesis. Site-
wise lnL scores were then estimated on the optimal tree found from the unconstrained and
constrained searches and compared in CONSEL (Shimodaira and Hasegawa, 2001) using the
Shimodaira-Hasegawa (SH) and the approximately unbiased (AU) tests (Shimodaira, 2002;
Shimodaira and Hasegawa, 1999). The SH test is a multiple comparisons test designed to adjust
for the selection bias to which the Kishino-Hasegawa (KH; [Kishino and Hasegawa, 1989]) and
bootstrap probability (BP; [Felsenstein, 1985]) tests are susceptible (Felsenstein and Kishino,
1993; Goldman et al., 2000; Hillis and Bull, 1993; Shimodaira and Hasegawa, 1999). The
selection bias of the KH and BP test often yields overconfidence in poor trees. However, the SH
test is also biased, tending to be overly conservative (Strimmer and Rambaut, 2002). The AU
test uses a multiscale bootstrap procedure that is able to adjust for the selection bias ignored by
BP and KH tests without being overly conservative like the SH test (Shimodaira, 2002).
These methods were used to determine whether monophyly of Crocodylus (including C.
cataphractus), monophyly of C. niloticus, and monophyly of C. novaeguineae could be
statistically rejected. Furthermore, using the root dataset, these methods were used to test
58
whether hypotheses consistent with the morphologically supported rooting of Crocodylia (Gallus
gallus constrained to the Gavialis gangeticus terminal branch, and Gallus gallus constrained to
the internal branch leading to Gavialis gangeticus and Tomistoma schlegelii) could be
statistically rejected. Also, hypothesis testing was used to ascertain whether phylogenetic
incongruence (if any) among loci was significant. All AU and SH tests were performed using
100,000 bootstrap replicates, and if ML heuristic searches yielded multiple optimal trees, all
were included in the test and the range of resulting P-values are reported.
BIOGEOGRAPHIC ANALYSES OF CROCODYLUS All biogeographic ancestral character-state reconstructions were performed only on the
Crocodylus clade, not only because this genus is of particular focus to this study, but also
because it likely represents the only group of extant crocodylians on which such analyses can be
reliably performed. As mentioned in the introduction, Crocodylus is paleontologically unique
among crocodylians in that it only appeared recently in the fossil record and thus seems to
represent a relatively recent radiation. All remaining crocodylians likely represent relicts of
lineages that were previously much more diverse and widespread up until as recently as the
beginning of the Pleistocene (see Brochu (2003) for a review). As a result, these taxa represent a
poor sampling of the geographic extent and center of their lineages, and trying to reconstruct
ancestral character-states across all Crocodylia based only on these extant relicts would be
inappropriate.
To reconstruct the biogeographic history of Crocodylus (excluding C. cataphractus), the
distribution of each species was coded as a character with four states: Neotropics, Africa,
Indomalaya, and Australasia (Table 2.5). This coding scheme is based on the terrestrial
biogeographic realms or biomes (Olson et al., 2001; Sclater, 1858; Udvardy, 1975; Wallace,
59
1876) inhabited by each species. Despite the crudeness of this coding scheme, it is sufficient to
yield information on the most likely region of the world from which the most recent common
ancestor originated by using ancestral character-state reconstruction techniques, and will allow
the “out of Africa” hypothesis to be tested (see below). Given this coding scheme, there is
substantial ambiguity regarding the character state of C. mindorensis. This species is endemic to
the Philippine Islands, which have biogeographic affinities with both Indomalaya and Australasia
(Brown and Alcala, 1980; Inger, 1954). Several attempts have been made to try and delineate
the boundary of the Australian and Asian biota, some of which associated the Philippines with
TABLE 2.5. The geographic character states used in all ancestral character-state reconstruction analyses. Single letter distribution codes are as follows: N = Neotropics, A = Africa, I = Indomalaya, and U = Australasia. See Figure 2.1 for a detailed illustration of the species’ distributions.
Species Distribution Crocodylus acutus N C. intermedius N C. moreletii N C. rhombifer N C. niloticus A C. siamensis I C. palustris I C. porosus UI C. mindorensis U and I * C. novaeguineae U C. johnstoni U C. cataphractus A Osteolaemus tetraspis A
*The distribution of C. mindorensis was coded as U and I in separate analyses.
Asia (Wallace’s line [Wallace, 1860], Weber’s line, Lydekker’s line), whereas others have
considered the oceanic islands of the Philippines as part of the Australian region (Huxley’s line
[Huxley, 1868]). In reality, the Philippines are a geologically complex aggregation of islands
centered in a zone of gradation between the biotas of these regions. Accordingly, all
60
biogeographic reconstructions were performed twice, coding C. mindorensis as either
Indomalayan or Australasian.
To obtain a tree appropriate for ancestral character-state reconstruction, another ML
heuristic search was performed on the full dataset with the number of taxa reduced to one
individual per species (or major lineage; see results). I used the same substitution model,
successively optimized parameters, and PAUP* settings that were used in the ML heuristic
search on the full dataset described previously. The resulting tree was trimmed to consist solely
of the Crocodylus and Osteolaemus clade. This tree, with Osteolaemus tetraspis and C.
cataphractus serving as outgroups, was used for all character-state reconstruction analyses,
except for those using Bayesian methods (see below). Ancestral character-state reconstructions
were inferred upon this topology using parsimony (Maddison, 1990), as implemented in
MacClade 4.05 (Maddison and Maddison, 2000), assuming unordered character states. This
method simply reconstructs the states of ancestral nodes in the manner that minimizes the
number of character-state changes across the tree. A dispersal-vicariance approach (Ronquist,
1997) as implemented in DIVA (Ronquist, 1996) also was used to infer the geographic states of
ancestral nodes. This method optimizes a three-dimensional cost matrix based on a simple
biogeographic model that seeks to minimize the occurrence of dispersal and extinction events.
DIVA analyses were run with maxareas set to two, which allows any ancestral node to persist in
a maximum of two character states. This setting was based on the maximum number of
geographic states assumed by any extant crocodylian (i.e. C. porosus; see Table 2.5). All other
parameters were left at default settings. If a vicariant explanation of the distribution of
Crocodylus can be rejected by the dating analyses, the DIVA analysis may be inappropriate, as it
will always preferentially invoke vicariance over dispersal. Nonetheless, the analysis provides
61
another perspective on the reconstructions, and may demonstrate the danger of assuming
vicariance as the null hypothesis.
Maximum-likelihood (Pagel, 1999) and Bayesian (Pagel et al., 2004) methods of
ancestral state reconstruction were implemented in the BayesMultiState module of BayesTraits
(Pagel and Meade, 2007). These methods reconstruct the character-states of ancestral nodes
based on a model of the character’s evolution that is estimated from the data. The maximum-
likelihood method estimates the model of character evolution (i.e. transition rates among states)
and the probability of each state at specified internal nodes that maximize the likelihood of the
data, which comprise the tree, its branch lengths, and the distribution of the character states
across the terminal nodes. The Bayesian method implements MCMC, and thus yields posterior
probability distributions of the model parameters and probabilities of each state at a given node.
Furthermore, if the Bayesian method is provided with a posterior sample of trees, phylogenetic
uncertainty is incorporated into ancestral state posterior probabilities by accounting for the
proportion of trees in which the specified taxa form a clade (Pagel et al., 2004).
All ML ancestral character-state reconstruction analyses were performed on the same
trimmed ML tree used for the parsimony and dispersal-vicariance analyses, however branch
lengths were now incorporated. The number of ML replicates for each analysis was set to 1000,
and each analysis was run three times to ensure consistent results. The model of character
evolution that best fit the data while using the fewest number of free parameters was determined
using a series of nested LRTs as follows: 1) The analysis was performed with a fully-
parameterized model. Since there are four character states, there were a total of 12 transition
rates. 2) The transition rates with the most similar estimates from the previous run were set to be
equal. If there were multiple rates with identical values (e.g. 0), all of these rates were set to be
62
equal. The next analysis was run invoking these new constraints, and the resulting lnL score was
compared to that of the previous, less-constrained run using a LRT:
!
"ij = 2(lnLi # lnL j )
Where
!
"ij is the likelihood ratio test statistic of the comparison of the lnLs of model i and j,
which was subjected to a χ2 test with the degrees of freedom equal to the difference in the
number of free parameters. A standard Bonferroni correction of (α/the total number of LRTs)
was used to determine the critical α for each test. If presented with a most similar transition rate
estimate that was approximately equidistant from two other estimates, both pathways were tried
and the one that resulted in the best lnL score was favored and pursued further. 3) This process
was repeated until either the new model was rejected by the LRT, or there was only one
transition rate (i.e. all rates were set equal).
Once the optimal model was found, it was used to infer the character-states of all the
internal nodes of the Crocodylus clade and for hypothesis testing. Hypotheses were tested
simply by constraining a given node to a certain state and observing the change in lnL. Because
the models being compared are not nested, LRTs cannot be applied. Thus, the conventional
change of 2 lnL units or more was considered a ‘significant’ difference (Pagel, 1999). The basal
most node of Crocodylus (excluding C. cataphractus) was constrained to each of the four
possible character states. Furthermore, the basal node of the New World species + C. niloticus
clade was constrained to the Neotropics and Africa.
MrBayes was used to obtain a sample of trees on which to perform the Bayesian methods
of ancestral character-state reconstruction. I used the full dataset with all taxa removed except
one individual per Crocodylus species and Osteolaemus tetraspis (the same individuals used in
the ML tree for the parsimony, DIVA, and ML reconstructions). The dataset was treated as 6
63
partitions: exons; introns; mitochondrial protein-coding codon positions; and mitochondrial non-
protein-coding. Using the aligned full dataset with only crocodylids included, and a modified
version of the PAUP* block provided with MrModeltest 2.2, the likelihood scores of 24
nucleotide substitution models were estimated for each partition. The PAUP* block was
modified to calculate the scores using a ML tree (including branch lengths) of all the crocodylids
(this tree was estimated in PAUP using the same methods described previously for the full
dataset, but with alligatorids excluded). The AIC in MrModeltest was used to select the optimal
model for each partition from the resulting scores. Two independent mixed-model phylogenetic
analyses were run for 1.0 × 10⁷ generations, sampling every 1000 generations. The temperature
parameter that controls the incremental heating scheme was adjusted to 0.1. In preliminary
analyses, this setting, which decreases the disparity of the Metropolis-Hastings proposal
mechanism among the coupled chains, yielded more swapping events among the chains early in
the analysis, allowing the cold chain to achieve stationarity more efficiently. The first 2 × 10⁶
were discarded as burn-in (stationarity assessed using the same abovementioned criteria),
yielding a posterior sample of 8,000 trees per run. A sub-sample of trees was extracted from the
8,000 trees of each run, by taking every 10th tree (this is equivalent to sampling every 10,000
generations in the MrBayes analysis) for a final, combined sample of 1,600 trees. The sub-
sampling was done to reduce autocorrelation between samples, ensuring each sample is
essentially independent, and to produce a manageably sized set of trees for the character-state
reconstruction analyses.
For the Bayesian ancestral character-state reconstructions, a single transition rate
parameter model was implemented whether C. mindorensis was coded as Australasian or
Indomalayan (these were the optimal models selected by the LRTs described above). To aid in
64
the selection of an appropriate prior for the rate parameter, the ML model was estimated on all
1,600 trees in the sample using 1,000 replicates each. The average transition rate and 95 %
confidence limits were then calculated over all 1,600 estimates, and a conservative uniform prior
was designed to safely encompass these values. The average ML transition rate estimate was
6.25 (5.29-7.25) when C. mindorensis was coded as Australasian, and 10.26 (8.89-11.83) when
coded as Indomalayan. For the Bayesian analyses, the transition rate parameter was given a
uniform prior of 0 to 15 when C. mindorensis was coded as Australasian, and 0 to 20 when
coded as Indomalayan. Preliminary analyses were run, adjusting the ratedev parameter until the
acceptance rates of proposed changes was ~20%. A ratedev setting of 100.0 worked well when
C. mindorensis was coded as Australasian, and 120.0 worked well when coded as Indomalayan.
Using these settings, the final character-state reconstruction analyses were run for 1.0 × 10⁸
generations, sampling every 1,000 generations, with a burn-in of 4.0 × 10⁷. Both analyses were
run three independent times to ensure consistency, and post burn-in stationarity was confirmed
by plotting lnLs versus generations using Tracer.
Using these same settings, the same constraint tests were performed as with the ML
method. The significance of these tests was determined by calculating 2lnBF from the
ln(harmonic mean L) values provided in the BayesTraits output as follows:
!
2lnBFij = 2(ln[Harmonic Mean Li]" ln[Harmonic Mean L j ])
The support of the alternative hypothesis was assessed according to Table 2.4 (Jeffreys, 1935;
Jeffreys, 1961; Kass and Raftery, 1995).
DATING DIVERGENCES WITHIN CROCODYLIA Using the ML phylogram reconstructed in PAUP* from the full dataset, parameters of the
nucleotide substitution model used in the original heuristic search were estimated with and
65
without a clock constraint, and the lnL scores calculated (Felsenstein, 1988). To test the
hypothesis of a molecular clock, a χ2 test was performed with a test statistic of twice the absolute
difference in lnL scores and the degrees of freedom equal to the number of taxa in the phylogeny
minus two.
Because a molecular clock was rejected, I employed a Bayesian MCMC approach
(Drummond et al., 2002) under a uncorrelated lognormal relaxed-clock model (Drummond et al.,
2006) to estimate divergence times within the Crocodylia phylogeny, using BEAST v1.4.1
(Drummond and Rambaut, 2003). The analysis was run using an aligned dataset comprised of
one individual per species (or major lineage; see results) and all the nuclear data, but only the
second codon position of the mitochondrial protein-coding genes (cytb, ND2, and ND3). The
other codon positions were not included because they showed evidence of saturation (Figure
2.14). Inclusion of these data in preliminary BEAST analyses clearly down-biased rate
estimates, causing divergence dates to be upward-biased (results not shown). Mitochondrial
tRNAs and Dloop were not included, because they were only available for a portion of
crocodylians.
The dataset was treated as a single partition under the GTR + I + Γ model of nucleotide
substitution with 6 rate categories. A uniform prior of 0-10 was applied to the uncorrelated
lognormal relaxed clock mean, with an initial value of 0.005 substitutions/site/mya. This initial
value was obtained by dividing the average divergence (substitutions/site) across the basal node
of the crocodylian phylogeny by 157 mya. The 157 mya denominator was based on a 78.5 mya
divergence between Alligatoridae and Crocodylidae (Brochu, 2004b; 2004c). Note, 0.005 is
only an initial value and in no way limits the exploration of the parameter space set by the
uniform prior. Uniform priors were assigned to various node ages in the crocodylian phylogeny
66
and are discussed in detail below. All other priors and MCMC operators were left at their default
settings, and the MCMC operators were allowed to automatically optimize over the run. The
tree topology was constrained to that found in the ML and Bayesian phylogenetic analyses
described above. Two independent analyses were run for 2.0 × 10⁷ generations, sampling every
1,000 generations. Convergence of both runs was diagnosed and compared with Tracer. A third
run was performed with the data excluded, forcing the analysis to sample wholly from the prior
distribution. Prior distributions from the dataless analysis were then compared to posterior
distributions to gauge the relative influence of the data and priors on the results (Drummond et
al., 2006).
The rich crocodylian fossil record guided the assignment of uniform age priors to several
nodes of the tree (Figure 2.3). The split between the Alligatorinae (Alligator) and Caimaninae
(Caiman, Melanosuchus, and Paleosuchus) is considered among the best vertebrate fossil
calibration points (Muller and Reisz, 2005). The lower bound of this divergence is based on the
appearance of Navajosuchus mooki during the Early Paleocene, approximately 64 mya. This is
the oldest fossil that can be assigned to one of these lineages (Brochu, 2003; Brochu, 2004c).
The upper bound is based on Stangerochampsa mccabei from the Lower Maastrichtian,
approximately 70 mya. Stangerochampsa mccabei is sister to all Alligatoridae based on cladistic
morphological analyses (Brochu, 1999; Brochu, 2003). Thus, a highly informative prior of 64-
71 mya was set for this node.
A uniform prior of 15-64 mya ago was set for the divergence between Alligator
mississippiensis and A. sinensis. The lower bound of this prior is based on the first appearance
of fossils assignable to A. mississippiensis from the Middle Miocene of Nebraska (Brochu, 1999;
Brochu, 2004a), whereas the upper bound is conservatively set to the lower bound of the
67
Alligatorinae-Caimaninae split. Because the fossil record of the caiman lineage is the poorest
among crocodylians (Brochu, 2003), a conservative prior of 4-20 mya was set for the divergence
of Caiman and Melanosuchus. The lower bound is based on the oldest fossils of extant species
in this group (Brochu, 2003; Brochu, 2004c), whereas the upper bound was obtained by doubling
that proposed by Brochu (2004c). A prior of 12-30 mya was used for the divergence of
Osteolaemus and Crocodylus cataphractus from the rest of Crocodylus. The lower bound is
based on the first appearance of members of this clade in the Siwaliks sequence of Pakistan
(Brochu, 2004c), and the upper bound was obtained by conservatively adding 10 mya to that
proposed by Brochu (2004c). A conservative prior of 12-64 mya was set for the divergence of
Gavialis and Tomistoma from the rest of Crocodylidae. This prior is simply based on the fact
that this divergence had to occur before the split of Osteolaemus and C. cataphractus from the
rest of Crocodylus, and after the basal most split of Crocodylia (see below).
A conservative prior of 65-90 mya was also used for the basal-most node of Crocodylia,
which is the split between Alligatoridae and Crocodylidae. The lower bound is based on the
presence of many fossils diagnosable to Alligatoroidea and Crocodyloidea prior to the
cretaceous-tertiary boundary (Brochu, 1999; Brochu, 2004c; Salisbury et al., 2006), and the
upper bound safely extends the likely Campanian origin of Crocodylia (Brochu, 2003; Salisbury
et al., 2006) by 6.5 my. Because this is the most basal divergence of the crocodylian tree, it
represents the “root height” parameter for the BEAST analysis. In addition to the uniform prior
of 65-90 mya, this parameter was assigned an initial value of 78.5 mya (Brochu, 2004c). Again,
this initial value does not inhibit the exploration of the parameter space of 65-90 mya set by the
uniform prior.
68
FIGURE 2.3. Uniform priors used to calibrate the age of divergences in the relaxed-clock divergence date estimates performed in BEAST.
RESULTS
SEQUENCE ALIGNMENTS The following discussion of the collected sequence data regards all individuals in
Appendix A, except two individual Paleosuchus palpebrosus (LSUMZ H-6997 and LSUMZ H-
6998), which are discussed near the end of this section. Additionally, all numbers referring to
positions of codons represent the position of the 3rd nucleotide. For cytb, 1197 bp
(corresponding to bases 14,283-15,479 of the C. niloticus mitochondrial genome [GenBank
accession # AJ810452]) of open reading frame were collected and aligned across all crocodylids.
Paleosuchus palpebrosus possesses a stop codon at site 1137, after which alligatorids were no
longer alignable with the crocodylids. Thus the last 60 bp of cytb were coded as missing data for
all alligatorids. The cytb alignment had no insertions or deletions (indels). For ND2, 1056 bp
(corresponding to bases 3898-4953 of the C. niloticus mitochondrial genome) of open reading
frame were sequenced and aligned across all crocodylids. Paleosuchus possessed an early stop
69
codon at site 1044, after which alligatorids were no longer alignable with the crocodylids. Thus,
the last 12 bp were coded as missing data for all alligatorids. The ND2 alignment had no indels.
For ND3, 348 bp (corresponding to bases 9488-9835 of the C. niloticus mitochondrial genome)
of open reading frame were sequenced and aligned for all individuals with one anomaly. All
three individuals of Melanosuchus niger possess an insertion of a cytosine at the 87th position of
the reading frame, causing a frameshift and premature stop codons at positions 90, 96, 249, 309,
336, and 345. This does not seem to be an artifact due to the amplification of a nuclear
pseudogene, because the sequences of all three individuals possess no other anomalies diagnostic
of nuclear translocated copies (i.e. no heterozygous sites, no other indels, no stop codons if the
87th base is removed, both flanking tRNAs are identifiable to other alligatorids). Additionally,
all three individuals had an identical sequence, except for a single synonymous substitution at a
3rd codon position. When these three Melanosuchus are aligned to all individuals of the three
Caiman species (the sister clade of Melanosuchus), 7, 2, and 41 of substitutions that differentiate
Melanosuchus from any of the Caiman species occur at the 1st, 2nd, and 3rd codon positions,
respectively. Furthermore, of these 50 substitutions, only 8 of them are nonsynonymous,
yielding a KA/KS ratio of 0.19. All of these numbers are consistent with a protein-coding gene
under purifying selection, and not a nuclear translocated pseudogene.
Interestingly, if translation of ND3 in these individuals was to occur within the proper
reading frame downstream of the insertion, the last 279 bp of the mRNA may produce a protein
that is only truncated by 20% compared to other species. Additionally, of the 8 nonsynonymous
substitutions differentiating them from the caiman species, 5 of them occur within the 87 bp prior
to the insertion, and only 3 of them occur in the remaining 261 bp, perhaps suggesting the first
20% of the original reading frame is no longer functional. Whether or not this insertion
70
represents a real frameshift mutation warrants further investigation. For the purposes of this
study, the cytosine at the 87th position in these three individuals was removed and the remaining
alignment used in subsequent analyses. Due to the possibility that the ND3 sequences for M.
niger are nuclear pseudogenes, a separate Bayesian phylogenetic analysis was performed under
the optimal partitioning scheme (see results) and with ND3 coded as missing data for these three
individuals. The results of this analysis did not effect the placement or nodal support for
Melanosuchus, ensuring the placement of this genus is not driven by this locus (data not shown).
Five hundred and forty-four bp of Dloop and 20 bp of the adjacent tRNAPhe (a total of
564 bp, corresponding to bases 15707-16268 of the C. niloticus mitochondrial genome) were
sequenced and aligned only for Crocodylus and Osteolaemus. This region contained indels, but
all were easily aligned without ambiguity. Hereafter, the 20 bp of tRNAPhe are simply treated as
part of Dloop. Fifty-nine bp of tRNAGlu, 24 bp of tRNAMet, 20 bp of tRNATrp, 28 bp of tRNAGly,
and 39 bp tRNAArg were aligned for all crocodylids.
The following nuclear sequence data were collected and aligned for all individuals:
ACTC: 8 bp of exon 4, 120 bp of intron 4, and 56 bp of exon5; aTROP: 60 bp of exon 5, 168
bp of intron 5, and 79 bp of exon 6; AChR: 74 bp of exon 7, 412 bp of intron 7, and 36 bp of
exon 8; c-mos: 579 bp; GAPDH: 33 bp of exon 11, 408 bp of intron 11, and 19 bp of exon 12;
LDH-A: 35 bp of exon 7, 550 bp of intron 7, and 122 bp of exon 8; LDH-B: 47 bp of exon 6,
552 bp of intron 6, and 26 bp of exon 7; RHO: 91 bp of exon 2, 132 bp of intron 2, and 40 bp
of exon 3. For LDH-B, some individuals lack the first 25 bp, whereas two individuals (KV 045
and KV 046) lack the first 46 and last 26 bp (these gaps were coded as missing data). For
ACTB, 32 bp of exon 3, 134 bp of intron 3, and 134 bp of exon 4 were obtained and aligned for
all crocodylids and five alligatorids (A.m. # 1, Alligator mississippiensis; LSUMZ H-7868, A.
71
sinensis; KV 077, A. sinensis; KV 081, A. sinensis; LSUMZ H-6997, Paleosuchus palpebrosus).
Most intron alignments possessed some indels, but all were easily aligned without ambiguity.
All nuclear exons were easily aligned across all individuals, with no indels except one apparent
three bp deletion of a codon for methionine at the 510th position in c-mos for all Crocodylus
(excluding C. cataphractus).
Sequence data were obtained for LSUMZ H-6998 (Paleosuchus palpebrosus) for all loci
except ACTB, for which it would not amplify. However, sequence data were gathered for
ACTB from a conspecific individual (LSUMZ H-6997). Thus, the ACTB sequence of H-6997
was concatenated with the rest of the sequence data of H-6998, to form a chimerical sequence
that was used in all subsequent analyses. To ensure this action was justified, I compared loci for
which both individuals had sequence data (AChR, aTROP, c-mos, and RHO; 1608 bp). Across
1608 bp of nuclear data, these two individuals shared an identical sequence that was unique from
all other individuals in the dataset.
The resulting full dataset was an alignment of 3335 bp of mitochondrial data and 3947 bp
of nuclear data, for a total of 7282 bp for 79 individuals (including gaps and missing data). All
gaps were treated as missing data in subsequent analyses. For construction of the root dataset, all
nuclear exons were easily aligned with Gallus gallus with no indels (except the deletion already
present in c-mos for Crocodylus). For cytb, Gallus was easily aligned to the first 1141 bp of the
crocodylian dataset with no indels. The last 57 bp of Gallus were not alignable, and were coded
as missing data. The first 50 and last 111 bp of ND2 for Gallus could not be unambiguously
aligned with the crocodylian dataset, and were coded as missing data. The remaining 895 bp
were easily aligned without indels. The first 76 bp of ND3 for Gallus could not be aligned with
the crocodylians, whereas the remaining 272 bp were aligned without indels. The resulting root
72
dataset consisted of 2601 bp and 1471 bp of mitochondrial and nuclear data, respectively, for a
total of 4072 bp for 80 individuals (including gaps and missing data).
PHYLOGENETICS The Bayesian analyses of cytb, ND2, ND3, Dloop, MT tRNAs, ACTC, aTROP, AChR,
c-mos, GAPDH, LDH-A, LDH-B, RHO, ACTB, the combined mitochondrial data, and
combined nuclear data all successively converged (see Table 2.6 for burn-in periods).
Furthermore, the two independent runs for each of these analyses yielded nearly identical trees,
posterior lnL distributions, and posterior probability estimates of clade support (i.e. linear
posterior probability comparison plots). Accordingly, the posterior samples of the independent
runs were combined for all these analyses, and the results are shown in Figure 2.4. The ML
heuristic search on the combined mitochondrial data yielded a single optimal tree that was
congruent with the Bayesian results (Figure 2.4 – O). The site-wise lnL scores estimated from
this tree were used in all AU and SH constraint tests on the mitochondrial dataset. The ML
heuristic search on the combined nuclear dataset yielded eight optimal trees that differed only in
the intraspecific relationships within C. intermedius and C. rhombifer, and were congruent with
the Bayesian results Figure 2.4 – P). The site-wise lnL scores of all eight trees were used in all
AU and SH constraint tests on the nuclear dataset. See Table 2.7 for the selected substitution
models and optimized parameters used in all unconstrained and constrained ML heuristic
searches implemented in PAUP*. For all successive approximations (ND2, combined
mitochondrial, combined nuclear, full dataset, and root dataset), the lnL score and parameter
estimates did not change beyond those calculated on the tree obtained from the second heuristic
search. Furthermore, the interspecific topology did not change beyond the initial heuristic
search, and in all cases this topology was the same as that recovered from the final heuristic
73
TABLE 2.6. The length and burn-in period, in generations, of all Bayesian phylogenetic analyses performed in MrBayes. All MrBayes analyses were sampled every 1000 generations. Analysis Run length Burn-in period
Root dataset 1.9872 × 10⁷ 1.0 × 10⁷ Crocodylinae only (for 1.0 × 10⁷ 2.0 × 10⁶ character reconstructions)
74
FIGURE 2.4. Eighty-five percent consensus trees of the trees sampled from the posterior at stationarity for the Bayesian phylogenetic analyses of (A) cytb, (B) ND2, (C) ND3, (D) Dloop, (E) mitochondrial tRNA genes, (F) ACTB, (G) ACTC, (H) AChR, (I) aTROP, (J) c-mos, (K) GAPDH, (L) LDH-A, (M) LDH-B, (N) RHO, (O) all mitochondrial data combined, and (P) all the nuclear data combined. Nodal support values above the branches represent posterior probabilities. All trees are unrooted, but oriented according to the results of the root dataset (Figure 2.5). The three putative hybrids, KV 038, 039, and 060 are labeled on the mitochondrial trees that support their hybrid nature.
75
FIGURE 2.4 cont.
76
FIGURE 2.4 cont.
77
FIGURE 2.4 cont.
78
FIGURE 2.4 cont.
79
FIGURE 2.4 cont.
80
FIGURE 2.4 cont.
81
FIGURE 2.4 cont.
82
FIGURE 2.4 cont.
83
FIGURE 2.4 cont.
84
FIGURE 2.4 cont.
85
FIGURE 2.4 cont.
86
FIGURE 2.4 cont.
87
FIGURE 2.4 cont.
88
FIGURE 2.4 cont.
89
FIGURE 2.4 cont.
90
TABLE 2.7. The selected nucleotide substitution models and successively optimized parameters used in all constrained and unconstrained maximum likelihood heuristic searches in PAUP*. ND2 Combined MT Combined
nuclear Full dataset Root dataset
Model GTR + I + Γ GTR + I + Γ HKY + Γ TVM + I + Γ TIM + I + Γ rAC 0.52634630 0.69911117 NA 1.66416560 1.00000000 rAG 11.08062381 12.83135584 NA 10.24574428 10.94881299 rAT 0.23607389 0.40465692 NA 0.96983814 0.53541057 rCG 0.42626759 0.45426263 NA 0.70836002 0.53541057 rCT 4.43338236 5.74701386 NA 10.24574428 7.67006549 kappa NA NA 2.43341849 NA NA α 0.771014 0.843812 0.397466 0.433440 0.318434 Pinv 0.21604739 0.32897120 NA 0.41524736 0.23168466 pi(A) 0.35097992 0.33897391 0.23662388 0.29549882 0.33262171 pi(C) 0.35285421 0.34877958 0.23354710 0.29412958 0.33659628 pi(G) 0.08402610 0.09047685 0.26974094 0.17628278 0.12297149 pi(T) 0.21213978 0.22176965 0.26008809 0.23408881 0.20781052
search implementing 100 random-addition replicates. Thus, the resulting phylograms from the
final round of successive approximations for the full and root datasets, used to estimate the
likelihoods of substitution models for each data partition, were robust estimates and
topologically identical (allowing for minor intraspecific differences) to the ML results.
There is consistent disagreement between the mitochondrial and nuclear topologies
regarding the placement of one C. moreletii (KV 038) and two C. acutus (KV 039 and KV 060)
(Figure 2.4 – O&P). The mitochondrial data places the two C. acutus (KV 039 and KV 060)
with C. rhombifer, and nests the C. moreletii (KV 038) within the remaining C. acutus, both with
strong support. The nuclear dataset places these three individuals within their respective
conspecific clades with strong support. This pattern suggests these three individuals may be
hybrids. Ancestral polymorphisms are another potential explanation, but in this case seem much
less likely because the nuclear data place the individuals within their respective species, whereas
the mitochondrial data do not. Because the mitochondrial genome is effectively haploid and
91
uniparentally inherited, its effective population size is approximately ¼ that of nuclear loci, and
thus according to coalescent theory should complete lineage sorting approximately four times
faster (assuming neutrality and constant population size) following reproductive isolation (Birky
et al., 1989; Palumbi et al., 2001). Thus, if incomplete lineage sorting was the cause for the
incongruence, the ancestral polymorphisms should appear in the nuclear data and not the
mitochondrial data, but we see the opposite. A selective sweep could cause rapid lineage sorting
in a nuclear locus, however support for the placement of these putative hybrids into their
conspecific clades comes from multiple, independent nuclear loci (Table 2.8). Thus,
introgression is the more likely explanation in this case.
To look at this issue more closely, all variable nuclear sites were examined to determine
if the putative hybrids were heterozygous at sites with fixed differences among the species three
species in question (Table 2.8). Also, appropriate constraint tests for both the nuclear and
mitochondrial data were used to determine if the phylogenetic incongruence that suggests
hybridization is statistically significant (Table 2.10). All but one of these constraint tests were
significant (Table 2.10). The only result that was not significant was the SH test of the constraint
of KV 038 (C. moreletii) to the C. acutus clade for the nuclear dataset (Table 2.10).
Nonetheless, the AU and BPP tests for this constraint were significant and, since the SH test is
known to be conservative, take precedence over the SH test. Thus, the incongruence between the
mitochondrial and nuclear data regarding these three putative hybrids is statistically significant.
If KV 039 and 060 are hybrids, they are likely not F1s. For all seven nuclear fixed
differences between C. rhombifer and C. acutus, these individuals are homozygous for the C.
acutus allele (Table 2.8). Likewise, KV 038 is homozygous for the C. moreletii allele in two
cases where there is a fixed (or nearly fixed) difference between C. moreletii and C. acutus.
92
TABLE 2.8. All of the polymorphic nuclear sites for which at least one of the three species involved in the putative hybridizations (Crocodylus moreletii, C. acutus, and C. rhombifer) have a fixed difference. The numbers at the top of each column represent the site’s location within the respective locus. The three putative hybrids are highlighted in gray. In mitochondrial analyses, C. moreletii KV 038 nested within the C. acutus clade, whereas C. acutus KV 039 and 060 grouped with C. rhombifer.
However, KV 038 does express the heterozygous genotype along with conspecific KV 007 for
three other sites (Table 2.8). Fixed differences here may well be an artifact of poor sampling,
and complete exclusion of the possibility of F1 status is not possible.
Even if these three individuals are assumed to be hybrids, the nature of their
hybridization is unknown. All three tissue samples in question came from captive animals and
lack vouchers and locality information (Appendix A). Thus, hybridization may have occurred in
captivity, which would not be of interest in the present study. Due to the ambiguity associated
with these three individuals (KV 038, KV 039, and KV 060), they were excluded from all
93
subsequent analyses on the combined datasets. After their exclusion, none of the three partition
homogeneity tests were significant (Table 2.9).
TABLE 2.9. The results of the partition homogeneity tests. The three putative hybrids were excluded from these tests.
Partitions tested P-value All 13 loci 1.0 All 9 nuclear loci 0.45 Combined mitochondrial vs. combined nuclear 0.79
A second well-supported difference between the mitochondrial and nuclear topologies
regards the placement of the ‘C. niloticus 2’ lineage (see Figure 2.4). In the mitochondrial
analyses, this clade is consistently supported as the sister group of the New World + C. niloticus
1 clade (Figure 2.4 – O). In the nuclear analysis, this clade assumes a more basal position, and
C. siamensis, C. palustris, and C. porosus become sister of the New World + C. niloticus 1 clade
(Figure 2.4 – P). Although this difference is significant according to the BPP test, the AU and
SH tests are far from significant (Table 2.10).
A third difference between the mitochondrial and nuclear inferences involves the
relationships among the New World species. The mitochondrial data support a sister relationship
between C. intermedius and C. acutus (Figure 2.4 – O). The nuclear data support a sister
relationship between C. acutus and the C. rhombifer + C. moreletii clade, with all C. intermedius
individuals part of a basal polytomy within the New World clade (Figure 2.4 – P). When C.
intermedius in constrained to be monophyletic with C. acutus for the nuclear data, it is
significantly worse than the unconstrained results according to the BPP test, but not significant
according to both the AU and SH tests (Table 2.10).
The New World clade is also a source of incongruence within the mitochondrial data.
The ND2 data support a sister relationship between C. moreletii and the C. acutus + C.
94
TABLE 2.10. Results of tests of phylogenetic hypotheses. KV 038 is the tissue number of the C. moreletii that grouped with C. acutus, and KV 039 and KV 060 are the C. acutus that grouped with C. rhombifer in mitochondrial analyses. Testing method abbreviations are as follows: AU = approximately unbiased test, SH = Shimodaira-Hasegawa test, and BPP = Bayesian posterior probability test. Significant tests (α = 0.05) are shaded in gray.
Dataset Constraint Test P value AU 8.0 × 10-73 SH 0 KV 038 constrained to C. moreletii clade
BPP 0 AU 2.0 × 10⁻⁷ SH 0
Mitochondrial combined
KV 039 and KV 060 constrained to C. acutus clade
BPP 0 AU 0.001 SH 0.020 KV 039 and KV 060 constrained to C.
rhombifer clade BPP 0 AU 0.033 SH 0.080 KV 038 constrained to C. acutus clade
BPP 1.0 × 10⁻⁴ AU 0.225 SH 0.248 New World species + C. niloticus monophyly
BPP 0.008 AU 0.173 SH 0.200
Nuclear combined
C. acutus + C. intermedius monophyly BPP 0 AU 0.125 SH 0.144 ND2 C. moreletii + C. rhombifer monophyly (KV
039 and KV 060 included) BPP 0.001 AU 0.026 SH 0.034 Gallus restricted to Gavialis branch
BPP 0 AU 0.062 SH 0.076
Root dataset Gallus restricted to Gavialis + Tomistoma
branch BPP 0 AU 0.006 SH 0.012 Crocodylus monophyly (including C.
cataphractus BPP 0 AU 0.002 SH 0.012 C. niloticus monophyly
BPP 0 AU 0.002 SH 0
Full dataset
C. novaeguineae monophyly BPP 0
95
intermedius clade, with the C. rhombifer clade (and putative C. acutus hybrids) part of a basal
polytomy of the New World species + C. niloticus clade (Figure 2.4 – B). This is opposed to the
C. moreletii - C. rhombifer sister relationship supported by the combined mitochondrial data
(Figure 2.4 – O). Constraining the ND2 topology to match that of the combined mitochondrial
data can be rejected according to the BPP test (Table 2.10). In order to obtain AU and SH test
results, a ML heuristic search was performed on the ND2 dataset in PAUP as described in the
methods section (i.e. substitution model selected with AIC in ModelTest, model parameters
successively optimized [Table 2.7], and heuristic search with TBR branch swapping for 100
random-addition replicates). This resulted in a single optimal tree. The search was then
performed with C. moreletii – C. rhombifer monophyly constrained, which also produced one
optimal tree. The site-wise lnLs estimated on both the constrained and unconstrained tree were
compared using AU and SH tests in CONSEL. Neither of these tests was significant.
Based on the constraint tests and PHT results, I conclude that phylogenetic incongruence
among the different gene regions is due to insufficient data within each, and not conflicting
evolutionary histories, with the exception of the differences due to the putative hybrids. Thus,
combining the datasets (with the exclusion of the hybrids) should yield a more robust
phylogenetic estimate rather than a compromise between or among gene regions. Accordingly,
analyses of the concatenated data were pursued.
Root Dataset Results
The PAUP* ML heuristic search performed on the unpartitioned root dataset produced a
single optimal tree (Figure 2.5 – B). The cold chain of both independent runs in the partitioned
Bayesian analysis of the root dataset successfully converged after 1.0 × 10⁻⁷ generations (Table
2.6). However, they converged at different lnL values (see section on full dataset for more
96
details on this pattern). Nonetheless, both runs yielded the same topologies, posterior
probabilities, and branch lengths. As a result, the post-burn-in posteriors of the two independent
runs were combined for computing the Bayesian consensus tree, which was congruent with the
ML results (Figure 2.5). The AIC selected partition models used in the MrBayes analysis and
the resulting parameter estimates are summarized in Table 2.11. Both analyses supported the
FIGURE 2.5. (A) Eighty-five percent consensus tree of the posterior sample at stationarity from the Bayesian phylogenetic analyses of the root dataset. Node support values above branches represent posterior probabilities. (B) Unrooted ML tree of the PAUP* heuristic search.
97
“molecular-rooting” of Crocodylia, and BPP, AU, and SH tests rejected the “morphological-
rooting” (i.e. Gallus restricted to the Gavialis branch; Table 2.10). When Gallus was constrained
to the Gavialis + Tomistoma branch, the results of BPP are significant, whereas the AU and SH
tests are marginally nonsignficant (Table 2.10). These results demonstrate that Gavialis is not
the basal most lineage of Crocodylia, nor is Gavialinae. Thus, Gavialis is sister to Tomistoma,
and these two species represent the sister to Crocodylinae, all of which comprise Crocodylidae.
Full Dataset Results
The PAUP* ML heuristic search on the unpartitioned full dataset produced three optimal
trees that differed only in the intraspecific relationships within C. intermedius (Figure 2.6). The
three independent RAxML analyses of all 11 partitioning schemes (33 analyses total) produced
identical ML trees, which were congruent with the PAUP* ML tree. Furthermore, for each
partitioning scheme, the range of the lnL scores produced by the three independent runs was less
than 0.5 lnL units, suggesting that the RAxML analyses successfully and consistently found the
global optima. The unpartitioned ML heuristic search implemented in GARLI yielded the same
topology as the PAUP* and RAxML analyses. The resulting ML phylogram from PAUP,
annotated with RAxML and GARLI bootstrap percentages is shown in Figure 2.6.
The AIC selected models for each partition used in all the Bayesian partitioned analyses
and resulting parameter estimates are summarized in Table 2.12. Eighteen of the 22 independent
MrBayes analyses (11 partitioning schemes with 2 runs each) yielded the same topology as all
the ML analyses (Figure 2.6). The two independent runs of the P25 partitioned analysis failed to
converge over 2.0 × 10⁷ generations, and will not be considered further. Both runs of the P4
analysis yielded a weakly supported (0.54 posterior probability) sister relationship between C.
moreletii and the C. acutus + C. intermedius clade, making C. rhombifer the basal-most New
98
FIGURE 2.6. Consensus of the three ML trees found in the PAUP* heuristic search on the full dataset. The support values above the branches represent the posterior probabilities (top; P8 analysis) and percent of 100 bootstrap replicates performed in RAxML (middle) and GARLI (bottom). The gray box in A indicates the clade that is shown in more detail in B. Asterisks represent clades with “perfect” support (i.e. 1.0, 100, and 100)
99
100
FIGURE 2.6 cont.
101
TABLE 2.11. Selected models and parameter estimate 95% confidence intervals for the partitions used in the Bayesian analysis of the root dataset. NA stands for not applicable (i.e. the parameter is not part of the model), whereas NC stands for no convergence (i.e. the analysis in which the partition was implemented failed to converge).
TABLE 2.12. Selected models and parameter estimate 95% confidence intervals for all partitions used in the Bayesian analyses of the full dataset. NA stands for not applicable (i.e. the parameter is not part of the model), whereas NC stands for no convergence (i.e. the analysis in which the partition was implemented failed to converge).
102
TABLE 2.12 cont.
103
TABLE 2.13. Selected models and parameter estimate 95% confidence intervals for the partitions used in the Bayesian analysis of Crocodylinae (the analysis which produced the set of trees used in the Bayesian biogeographic ancestral character-state reconstructions). NA stands for not applicable (i.e. the parameter is not part of the model), whereas NC stands for no convergence (i.e. the analysis in which the partition was implemented failed to converge).
104
World species (data not shown), rather than the sister of C. moreletii, as in all other analyses.
Not surprisingly, the position of C. moreletii within the New World clade is the weakest
supported node within Crocodylus in all analyses (Figure 2.6).
The independent runs of the P1, P4, and P28 Bayesian analyses successfully converged
with similar posterior lnL values (see Figure 2.7 – A&B for an example of this pattern), after 4.0
× 106, 6.0 × 10⁶, and 1.2 × 10⁷ generations, respectively (Table 2.6). Accordingly, the posterior
FIGURE 2.7. Plots of the natural log likelihood (lnL) scores of the two independent runs over time (A&C), and the resulting distributions of lnL scores (B&D) from the P28 (A&B) and P8 (C&D) partitioned Bayesian phylogenetic analyses. P28 represents an example of an analysis where both runs converged on the same lnL distribution, whereas P8 is an example of an analysis where they converged at different lnL distributions.
105
samples of the independent runs were combined for each of these analyses. For all other
partitioning schemes (except P25), both independent runs successfully converged according to all
the criteria discussed in the methods, but at different lnL distributions (see Figure 2.7 – C&D for
an example). In all these cases, the two independent runs produced the same topology, with
similar branch lengths and node posterior probability estimates. Several adjustments were
attempted to get the independent runs to converge on the same lnL distributions, including
changing the incremental heating scheme of the Metropolis-coupled Markov chains to yield
higher acceptance rates of proposed chain swaps, and running more Metropolis-coupled Markov
chains per run. However, these adjustments did not alleviate the problem. To investigate the
cause of this convergence pattern, plots of all parameter estimates vs. generation time were
compared between the two independent runs for all 11 partitioned analyses in Tracer. For all
analyses where the independent runs converged at different lnL scores, there are clear differences
between the runs in the estimation of the shape parameter (α) of the Γ distribution and the
proportion of invariable sites (Pinv) for some of the partitions that contained both of these
parameters in their model. For all other parameters, the posterior samples appear to be drawn
from the same distribution. This pattern is interesting in light of growing concerns regarding the
use of both Pinv and Γ within the same model (see RAxML user manual [Stamatakis, 2006]).
Pinv and Γ represent two mathematical methods of accounting for the same phenomenon, rate
heterogeneity. Thus, each of these parameters is very sensitive to changes in the other, which
may lead to a “ping-pong” effect that can introduce convergence problems. Due to such
concerns, some recent phylogenetic software do not implement Pinv (e.g. RAxML [Stamatakis,
2006] and Treefinder [Jobb, 2007]). The interactions between Pinv and Γ likely caused the
convergence anomaly in this study, because every analysis that converged at different lnL
106
distributions showed clear discrepancies in these parameters between the two runs, whereas the
remaining analyses did not. Overparameterization is a less likely cause, because every
independent run (except P25) converged, and the pattern does not seem correlated with the
number of parameters (i.e. both simple (P1 & P4) and complex models (P28) showed normal
convergence patterns).
Interestingly, in some preliminary analyses where only Γ was used in place of all Pinv +
Γ models, the two independent runs converge on the same lnL scores (data not shown). A
manuscript dealing specifically with this phenomenon is forthcoming. For the purposes of this
study, when an analysis resulted in two different lnL posterior distributions (i.e. P8, P14, P15, P22a,
P22b, and P30), I simply used the posterior samples of the independent run that yielded the better
lnL scores for calculating all the model-selection criteria (BF, AIC, AICc, and BIC) rather than
combining the two runs. Combining the posterior samples of these runs, which clearly originate
from different distributions (Figure 2.7 – D), would violate the assumption that the harmonic
mean is a good estimator of the model’s marginal likelihood (Newton and Raftery, 1994), and
that the arithmetic mean is an unbiased estimator of the mean posterior likelihood function
(Aitkin, 1991; Newton and Raftery, 1994), and thus could obfuscate the BF, AIC, AICc, and BIC
results.
All three hypothesis tests on the full dataset strongly reject monophyly of Crocodylus
(Table 2.10). Rather, the genus is rendered paraphyletic, because C. cataphractus is the sister of
Osteolaemus tetraspis (Figure 2.6). Additionally, monophyly of C. niloticus is also strongly
rejected (Table 2.10), rather this taxon clearly consists of two species, which represent
consecutive outgroups to the New World clade (Figure 2.6). Monophyly of C. novaeguineae is
107
also rejected by all three constraint tests (Table 2.10), because the Philippine crocodile is nested
within C. novaeguineae with strong support (Figure 2.6).
SELECTION OF THE OPTIMAL PARTITIONING STRATEGY
Of all 11 partitioned Bayesian analyses, the P8 partitioning scheme yielded the best lnL
posterior distribution (Figure 2.8, Table 2.15). Additionally, the BF, AIC, AICc, and BIC model
selection criteria all selected P8 as the optimal partitioning strategy based on the Bayesian results
(Tables 2.14 and 2.15). The 2lnBF comparing P8 to the next best Bayesian partitioning scheme,
P15, is 164 (Table 2.14), which is more than an order of magnitude greater than the significance
limit of 10 (Table 2.4). Likewise, the P8 Bayesian partitioning scheme has a much better AIC,
AICC, and BIC score than the next best scheme (P15 in all three cases), and notably, the disparity
between the P8 and P15 scores is in the order expected based on the conservativeness of the three
criteria, with BIC most conservative, AIC the least, and AICC in the middle (Table 2.15). This
FIGURE 2.8. The 95% confidence intervals of the negative log likelihood scores (-lnL) sampled from the stationary posterior for each partitioning strategy.
108
TABLE 2.14. The Bayes factor test statistic (2lnBF) for all pairwise comparisons of the ten partitioning schemes that successfully converged (P25 excluded). The alternative hypotheses are by columns and the null hypotheses are by rows. Thus, a value >10 rejects the null hypothesis (row) in favor of the alternative hypothesis (column). Alternatively, a value < -10 rejects the alternative hypothesis (column) in favor of the null hypothesis (row). The rightmost column compares the optimal partitioning scheme (P8) against all others.
result, along with the fact that the AIC, AICC, and BIC yield almost the identical ordering of the
partitioning schemes as the Bayes factor (Table 2.15), suggests these three model selection
criteria can perform quite well when applied to the arithmetic mean of a posterior of lnL scores.
Overall, the maximum lnL scores from the 11 partitioned analyses are quite similar to the
mean lnL scores from the Bayesian analyses (Figures 2.8 and 2.9). For the partitioned ML
analyses, the AIC and AICc, selected a more complex model (P22B), but the BIC selected the P8
strategy (Table 2.15). The way P8 is ranked among the three ML model selection criteria is
again consistent with their conservatism, with the AIC ranking it as forth, the AICC as third, and
the BIC as first (Table 2.15). Considering the difference between two BIC estimates is an
approximation of the lnBF (Kass and Wasserman, 1995), it is very interesting to note that both
selection criteria selected the same model and ranked the remaining models in very similar
orders (Table 2.15). All model selection criteria for both the Bayesian and ML results rank the
three worst models as P1, P14, and P4 (Tables 2.14 and 2.15).
109
TABLE 2.15. The model selection criteria comparing among the 11 partitioning strategies analyzed under Bayesian and ML frameworks. Criteria values are presented as the overall change in score from the strategy with the best score. Strategies are arranged in descending order from best to worst within each criterion.
110
FIGURE 2.9. Graph of the maximum likelihood (-ln transformed) scores derived from RAxML for each partitioning strategy.
Considering the goal of modeling is to best fit the data while invoking the least random
error (fewest parameters), I conclude that P8 is the optimal partitioning strategy among the 11
compared. Accordingly, the P8 partitioning scheme was implemented for the non-parametric
2.10), and calculating the Bayesian posterior probability support values (Figure 2.6).
BIOGEOGRAPHIC ANCESTRAL CHARACTER-STATE RECONSTRUCTIONS To estimate the trees on which ancestral character-state reconstructions were performed,
the full dataset was scaled down to include only one individual per species or major lineage.
Based on the phylogenetic results, clearly the taxon C. niloticus comprises two distinct lineages
(Figure 2.6). Thus, one individual from each of the lineages labeled C. niloticus 1 and C.
niloticus 2 (Figure 2.6) was selected for character reconstruction analyses. Also, C.
111
novaeguineae is strongly supported as paraphyletic, with one of the individuals (LSUMZ H-
6995) falling within the Philippine crocodiles whereas the other (LSUMZ H-7071) is the distinct
sister of that clade (Figure 2.6). Thus, despite the paraphyly, the C. novaeguineae + C.
mindorensis clade represents two distinct lineages. Accordingly, the distinct C. novaeguineae
(LSUMZ H-7071) and one of the C. mindorensis were selected to be included in the character
reconstructions. Additionally, C. cataphractus clearly does not belong within Crocodylus
(Figure 2.6), and so it, along with Osteolaemus, is used as the outgroup for all the character-state
reconstructions. The results of the ML and Bayesian phylogenetic reconstructions performed on
this scaled dataset are illustrated in Figure 2.10. The AIC selected partition models used in the
MrBayes analysis and the resulting parameter estimates are summarized in Table 2.13.
The parsimony ancestral character-state reconstruction supported an African origin of
Crocodylus whether C. mindorensis was coded as Australasian or Indomalayan (Figure 2.11 –
A&B). However, these results are driven by the African outgroup, and when it is excluded, the
origin of the genus is ambiguous (Figure 2.11 – C&D). Given that parsimony character-state
reconstruction analyses do not account for branch lengths, and considering the outgroup to
Crocodylus (Osteolaemus and C. cataphractus) is divergent and likely relictual, the analyses
performed with the outgroup excluded are likely more appropriate.
The DIVA reconstruction analyses support an Australasian origin of Crocodylus and four
dispersal events when C. mindorensis is coded as Australasian, and an Indomalayan origin and
six dispersal events when C. mindorensis is coded as Indomalayan (Figure 2.12). The DIVA
results also support vicariant events to explain the divergence of the largely Indomalayan clade
of C. siamensis, C. palustris, and C. porosus from the New World + C. niloticus clade, and the
112
FIGURE 2.10. The ML tree from the PAUP* heuristic search on the dataset with one individual per species or major lineage. The portion shaded in (A) represents the tree used in all parsimony, DIVA, and ML character-state reconstruction analyses, and is shown in detail in (B). The support values in A and B (upper) represent the percentage of 400 bootstrap replicates with 10 random addition replicates each, implemented in PAUP*. The lower support values in B represent the posterior probabilities from the MrBayes analysis on this subset of taxa. The set of trees produced by the MrBayes analysis was used in all Bayesian character-state reconstructions.
113
114
FIGURE 2.11. The results of the parsimony biogeographic ancestral character-state reconstructions when Crocodylus mindorensis is coded as Australasian (A & C), and Indomalayan (B & D). The outgroup is included in A & B and excluded in C & D.
115
FIGURE 2.12. The biogeographic ancestral character-state reconstruction results from DIVA when Crocodylus mindorensis is coded as Australasian (A) and Indomalayan (B).
116
divergence of C. niloticus 1 from the New World clade (Figure 2.12). Given the results of the
divergence dating analysis (see below) these vicariant events are impossible.
Whether C. mindorensis was coded as Australasian or Indomalayan, the hierarchical
LRTs selected the simplest model of character evolution, which consisted of a single transition
rate (Table 2.16). Accordingly, in all ML and Bayesian ancestral character-state reconstructions,
all 12 possible character-state transition rates were restricted to be equal. The estimated
character-state transition rates from the ML and Bayesian character reconstructions are
summarized in Table 2.16. When C. mindorensis is coded as Indomalayan, the transition rate is
higher. This is not surprising, because this coding scheme requires an additional transition from
Australasia to Indomalaya. Whether C. mindorensis was coded as Australasian or Indomalayan,
the Markov chain of the Bayesian analysis reached stationarity prior to the end of the 2.0 × 10⁻⁶
generation burn-in period. The narrow 95% confidence intervals of the transition rates estimated
during the Bayesian analyses (Table 2.16) clearly demonstrate that the uniform rate priors (see
methods) were not overly informative.
TABLE 2.16. Optimal model of character evolution selected by hierarchical LRTs, and used in all ML and Bayesian ancestral character-state reconstruction analyses. The model parameters were estimated during the analyses. For the Bayesian parameter estimates, the 95% confidence intervals from the posterior distribution are provided.
When C. mindorensis is coded as Australasian, both the ML and Bayesian
reconstructions support the same character-states at all of the nodes within Crocodylus (Figure
2.13 – A). Furthermore, both methods support an Australasian origin of Crocodylus, five
dispersal events, and a reinvasion of Africa by C. niloticus 1 from the New World (Figure 2.13 –
117
A). More specifically, these analyses support an initial dispersal to Indomalaya, followed by
dispersal from Indomalaya to Africa, then dispersal from Africa to the New World, followed by
a final dispersal from the New world to Africa (Figure (2.14 – A). However, dispersal from
Indomalaya to the New World, followed by two dispersals from the New World to Africa is
almost equally probable (Figure 2.13 – A).
When C. mindorensis is coded as Indomalayan, the ML and Bayesian reconstructions
support the same character-states at all of the nodes within Crocodylus, except the node leading
to C. mindorensis and C. novaeguineae, for which both methods are ambiguous as to whether
this ancestral character is Australasian or Indomalayan (Figure 2.13 – B). Both methods support
an Indomalayan origin of Crocodylus, six dispersal events, and two independent dispersals to
Africa from the New World (Figure 2.13 – B). More specifically, the results support an initial
dispersal from Indomalaya to Australasia, followed by dispersal to the New World from
Indomalaya, and then two dispersals to Africa from the New World (Figure 2.14 – B).
Under both coding schemes, the Bayesian results yield less decisive (more conservative)
ancestral character-state probabilities than the ML results (Figure 2.13). This pattern is not
entirely due to the Bayesian reconstructions accounting for phylogenetic uncertainty, because the
Bayesian results are less decisive even at nodes that occur in all the trees sampled by the Markov
chain (Figures 2.10 and 2.13). Despite supporting impossible vicariant events, the DIVA results
are quite similar to the ML and Bayesian results (Figures 2.12 and 2.13).
According to the ML ancestral character-state constraint tests, when C. mindorensis is
coded as Australasian, an African origin of Crocodylus can be marginally ‘rejected’ according to
the ∆lnL > 2 rule of thumb (Table 2.17). When C. mindorensis is coded as Indomalayan, an
African origin constraint is marginally nonsignificant (Table 2.17). For the Bayesian analyses,
118
FIGURE 2.13. Results of the ML and Bayesian biogeographic character-state reconstructions when C. mindorensis is coded as (A) Australasian and (B) Indomalayan. The ML (first) and Bayesian posterior (second) probabilities of each state are provided at every node. The probability values for all three independent runs performed for each ML and Bayesian analysis were identical to the second decimal place. The 95% confidence intervals of the posterior probabilities were all less than ± 0.002.
119
120
FIGURE 2.14. The interspecific Crocodylus topology overlain on a world map in a manner consistent with the biogeographic scenario suggested by both ML and Bayesian ancestral character-state reconstructions when Crocodylus mindorensis is coded as (A) Australasian and (B) Indomalayan. The purpose of this figure is to illustrate the general biogeographic trends suggested by the character-state reconstructions. It is not intended to represent specific dispersal pathways.
121
an African origin constraint compared to the unconstrained analysis yields a 2lnBF of 3.66 and
3.20 when C. mindorensis is coded as Australasian and Indomalayan, respectively. According to
these values, there is “positive support” against an African origin (Table 2.4). It is also worth
noting an African character-state at the basal node of Crocodylus (excluding C. cataphractus)
receives the lowest probability in all four analyses (Table 2.17). Considering all of these results,
the “out of Africa” hypothesis can be marginally rejected in favor of an Indo-Pacific origin.
TABLE 2.17. Results of the ML and Bayesian biogeographic hypothesis tests. For each constraint, the 2lnBF and ∆lnL were calculated in comparison with the unconstrained results. The constraints are listed in descending order from worst (top) to best (bottom). ML constraints that yielded a decrease in lnL of >2 are shaded.
DIVERGENCE DATING
The hypothesis that the rate of nucleotide substitution is constant across the tree (i.e. a
molecular clock) was strongly rejected (P = 4.55 × 10⁻³⁰). The same individuals illustrated in
Figure 2.10 – A were used for the Bayesian relaxed-clock divergent dating analyses. The
mitochondrial non-protein-coding data (Dloop and tRNAs) were excluded from the dating
analyses, because they were only represented by crocodylids. Additionally, the first and third
codon positions of all mitochondrial protein-coding genes (cytb, ND2, and ND3) were excluded,
because in preliminary analyses these data clearly suffered from saturation effects (Figure 2.15).
122
FIGURE 2.15. Saturation plots of sequence data partitions. For the x-axis of A, B, C, and D, the pairwise nuclear distances were corrected using the same model as the ML heuristic tree search (see Table 2.7). For the X-axis of E, F, G, and H, the exonic pairwise distances were corrected using the F81 model of nucleotide substitution. All pairwise comparisons involving Gallus are shaded in gray.
123
124
When the first or third codon positions were included rate estimates were downward biased do to
the homoplasy in these characters, which caused divergence dates to be upward-biased (results
not shown).
The two independent BEAST runs successfully converged on the same posterior
distributions for all parameter estimates and lnL scores. Accordingly, after a burn-in period of
5.0 × 10⁶ generations was discarded, the posterior samples of both runs were combined for
calculating the results. Additionally, the third run that did not include any data also successfully
converged and its results were compiled after the initial 5.0 × 10⁶ generations were discarded as
burn-in. The results indicate that the priors did not entirely drive the analysis, but rather the data
greatly influenced the results both in terms of accuracy and precision (Figure 2.16). The mean
posterior substitution rate was 5.72 × 10⁻⁴ substitutions/site/my, and the 95% confidence limits
were 4.89 × 10⁻⁴ – 6.65× 10⁻⁴ substitutions/site/my. This rate is an average across the dataset and
across all the branches of the tree. The 95% confidence limits for the basal divergence of
Crocodylus are 5.94 – 12.72 mya (Figure 2.16), which clearly rejects vicariant explanations of
the circumtropical distribution of the genus. The results also indicate that Osteolaemus tetraspis
and C. cataphractus represent a divergent outgroup (19 mya) of the closely related Crocodylus
species (Figure 2.16). Also, despite the apparent paraphyly of C. novaeguineae (Figure 2.6), one
individual is quite divergent (3.86 mya) from the other + C. mindorensis clade, suggesting these
taxa do in fact comprise two species, though the boundaries are not accurately defined by current
taxonomy. Overall, Crocodylus represents a very recent and rapid radiation in comparison with
other crocodylians. Perhaps most striking is how recently and rapidly the C. niloticus + New
World clade speciated (Figure 2.16).
125
FIGURE 2.16. The results of the Bayesian relaxed-clock divergence date analyses run (A) without data (i.e. sampling wholly from the prior distribution) and (B) with the combined nuclear data plus the second codon position of all three mitochondrial protein-coding genes. The mean age of each node is given in millions of years, followed by the 95% confidence limits in brackets. The divergence time for the basal node of Crocodylus is highlighted in bold typeface, and gray bars represent the 95% confidence intervals of divergence times.
126
127
DISCUSSION
To date, the DNA sequence dataset collected for this study represents the largest
molecular dataset used to estimate the phylogeny of Crocodylia in terms of the number of
characters, taxa, and individuals per taxon. Additionally, it is also the largest sequence dataset
used to investigate the modeling effects of, and objective criteria for, partition choice.
MODEL SELECTION CRITERIA AND PARTITION CHOICE
The 95% confidence intervals of the nucleotide substitution model parameters estimated
for the various partitions used in this study clearly demonstrate the importance and benefits of
partitioning in phylogenetic analyses. There are many examples of non-overlap in the
confidence intervals for a given parameter across partitions, demonstrating these partitions are
evolving under significantly different models of evolution (Table 2.12). More significantly,
there are several examples where parameter estimates from a partition do not overlap the
estimates from a subset of the same partition. For example, the 95% confidence intervals for five
of the six nucleotide transition rate parameters of the mitochondrial protein-coding partition do
not over lap with those of the partition comprised only of the 1st codon positions (Table 2.12).
Furthermore, in this same comparison, two of the four nucleotide frequency parameters do no
overlap (Table 2.12). Thus in the “compromise” model estimated from all codon positions, the
1st codon positions are clearly mismodelled, which may lead to systematic error.
There are also differences in posterior probability branch support values among the 11
Bayesian analyses of the different partitioning strategies. The two branches for which support
varies the most among the partitioning strategies are the branch leading to the sister species C.
moreletii and C. rhombifer and the branch leading to the remaining Crocodylus after the basal
split of the C. johnstoni + C. novaeguineae + C. mindorensis clade. Excluding the three worst
128
partitioning schemes (P1, P4, and P14; see Tables 2.14 and 2.15), the trend of change in branch
support values is nearly perfectly correlated with the ordering of the partitioning schemes as
determined by the Bayes factor (Table 2.14). As you move from the best partitioning strategy to
the worst, the support value for C. moreletii + C. rhombifer clade increases from 0.56 (P8; see
Figure 2.6) to 0.9 (P30). Interestingly, P1 yielded the highest support for this node at 0.95 (data
not shown). Also, as you move from the best to worst strategy, the support value for the clade
composed of all Crocodylus, except C. johnstoni, C. novaeguineae, and C. mindorensis,
decreases from 0.96 (P8; see Figure 2.6) to 0.83 (P30). Again, P1 yielded relatively high support
for this node (0.93). These results demonstrate that inappropriate partitioning can mislead nodal
confidence both positively and negatively, likely as a result of systematic error introduced by
mismodeling. Even more alarming, the P4 strategy, which was consistently one of the worst
according to all criteria (Tables 2.14 and 2.15), produced a different topology within the New
World species, where C. moreletii and C. rhombifer were consecutive outgroups to the C. acutus
+ C. intermedius clade, rather than sister species.
The results demonstrate that partitioning strategy is more important than partition
number. Simply adding more partitions does not necessarily improve the likelihood of an
analysis under ML or Bayesian frameworks (Figures 2.8 and 2.9). Perhaps the most salient
example is the comparison of the P8 and P14 partitioning schemes. Despite having fewer
partitions, the P8 strategy consistently outperformed the P14 strategy. It is also interesting to
compare these two analyses, because they represent the epitome of partitioning strategies
designed strictly by gene identity (P14) and strictly by knowledge of biochemical and
evolutionary constraints (P8; see Table 2.3). Based on the results of this study, gene identity is a
very poor guideline for partition choice, and it is far more propitious to partition data that evolve
129
under similar constraints. Additionally, this study represents the first investigation of partition
choice that did not select the most complex (i.e. most partitioned) analysis.
Two important results of the mixed-model analyses are: 1) adding more partitions does
not necessarily increase likelihood and 2) adding partitions has a clear affect on nodal support.
These results are important, because they demonstrate that partitioning is not simply modeling
random elements of the data (Brandley et al., 2005). In other words, adding more partitions and
parameters does not improve the model by simply accounting for random variance in the dataset.
Rather, partition choice and number clearly affect how well the process of nucleotide evolution
is modeled, and in doing so, affect the degree of systematic error present in analyses.
The methods used in this study to objectively determine the optimal partitioning strategy
are far from perfect. There is still a large degree of subjectivity involved in selecting the initial
set of partitioning schemes from a nearly infinite number of possibilities. Modeling in
partitioned phylogenetic analyses could be drastically improved by the development of computer
algorithms that make partition choice a truly objective process. A relatively simple computer
algorithm could group aligned nucleotide sites in a manner that minimizes the variance of
various substitution model parameters. This seems like an obvious next step in the future of
modeling nucleotide evolution, and based on the results of this study, may be a rather important
one.
HARMONIC MEANS AND THE BAYES FACTOR There is a notable difference in the results of this study and that of Brandley et al. (2005).
In the current study, the harmonic mean likelihoods calculated in Mathematica were identical to
those calculated by MrBayes. Brandley et al. (2005) observed subtle differences, which they
attributed to the exclusion of “extreme values” in the MrBayes calculations. Interestingly, I did
130
observe discrepancies in the harmonic mean when calculated from the combined independent
runs for those analyses that did not converge on the same lnL distribution (see Figure 2.7 – C&D
for an example). In such cases, MrBayes output contained the warning: “These estimates may be
unreliable because some extreme values were excluded.” However, for the analyses in which
both runs converged on the same lnL scores (see Figure 2.7 – A&B for an example), or when
independent runs were analyzed separately, this error message was not shown and the harmonic
means were identical to those calculated in Mathematica. Additionally, when I calculated the
harmonic mean likelihood from the combined independent runs for all 11 analyses (even those
that converged at different lnL scores), the resulting Bayes factors selected the second most
complex partitioning scheme as optimal (P28). This could potentially explain why the Bayes
factor selected the most complex model for Brandley et al. (2005). I bring attention to this
phenomenon to stress the importance of comparing the likelihood distributions of runs before
combining their results, otherwise the model selection criteria may be erroneous. It is also
important to note that the harmonic mean likelihoods calculated in MrBayes are accurate and
reliable as long as they are calculated from a single distribution of likelihoods (e.g. Figure 2.7 –
B).
ML AND BAYESIAN ANCESTRAL CHARACTER-STATE RECONSTRUCTIONS Another important methodological finding of this study is the disparity among the results
of the parsimony, dispersal-vicariance, and model-based ancestral character-state reconstruction
methods. In this study, the ML and Bayesian methods seemed most appropriate and yielded the
most reliable results. Both parsimony and DIVA analyses suffer from not using data as
efficiently as ML and Bayesian techniques. For example, these methods ignore branch length
information and restrict where transitions may occur across the tree. For the parsimony analyses,
131
not utilizing branch length information had a negative effect on the results. Due to the inability
of parsimony to consider how divergent Mecistops and Osteolaemus are from Crocodylus, the
character-state of the outgroup lineage seemingly biased the analysis to infer an African origin of
The American (C. acutus) and saltwater (C. porosus) crocodiles have broad distributions
that encompass vast areas of open sea. Within these distributions, both species are
predominantly found in coastal, brackish water habitats (Groombridge, 1987; Neill, 1971; Ross,
1998). Although both species are known to make use of inland habitats with low salinity, their
habitat preference is quite distinct from the rest of Crocodylinae. Other Crocodylus (with the
exception of C. niloticus), Mecistops cataphractus, and Osteolaemus tetraspis are predominantly
inland, freshwater-restricted species that are infrequently found in brackish environments
(Groombridge, 1987; Neill, 1971; Ross, 1998). The Crocodylinae exception to this dichotomy is
the Nile crocodile, C. niloticus. Despite the Nile crocodile inhabiting inland, freshwater habitats
across most of the African continent, it is also known to inhabit coastal, estuarine environments
(Cott, 1961; Neill, 1971; Ross, 1998). In fact, according to historical records, the Nile
crocodile’s range once extended into Israel, Jordan, and the Comoros Islands, indicating it
historically made even more use of Estuarine environments (Groombridge, 1987; Ross, 1998).
Interestingly, this pattern of habitat preference seems tightly correlated with another
approximate dichotomy in Crocodylinae, that of body size. Although maximum body size is
obviously a continuous character, there are four crocodyline species that are substantially larger
than their relatives. Crocodylus porosus, C. intermedius, C. acutus, and C. niloticus are all rivals
for the title of largest living reptile, approaching 7m in maximum total length and regularly (at
least historically) exceeding 5m (Cott, 1961; Greer, 1974; Ross, 1998). The remaining
crocodylines generally do not exceed 4m in total length (Neill, 1971; Ross, 1998). This
approximate 1+ m difference in total length between the four largest crocodylines and their
relatives is accompanied by an even greater disparity in body mass. For example, a 4.3m
147
crocodile weighs approximately 400kg, whereas a 5.5m crocodile weighs approximately 1000kg
(Grigg et al., 1998). When comparing the character-states of habitat preference and body size
across Crocodylinae, there appears to be a tight correlation. Three of the four “giants” (C.
acutus, C. porosus, and C. niloticus) also make use of estuarine environments. The only
exception to this “big and estuarine” pattern is C. intermedius, which is restricted to the
freshwater Orinoco drainage in Northern South America. This pattern begs the question of
whether body size may by evolutionarily correlated with habitat preference. In other words, do
crocodiles evolve to be large and estuarine, or small and palustrine?
OBJECTIVES This study will use the recently well-resolved and robust phylogeny of the true crocodiles
(Chapter 2) to explore the evolution of ecological characters in this group. Specifically, this
study will determine whether crocodile nesting habit is a phylogenetically conserved character
and whether transition between the two character states is symmetric. Additionally, this study
will test whether crocodile body size is evolutionarily correlated with habitat preference. This
study will also compare the utility of ML and parsimony ancestral character-state reconstruction
methods.
METHODS
THE PHYLOGENY
To obtain a tree appropriate for ML ancestral character-state reconstruction, a ML
heuristic search was performed in PAUP on an aligned dataset of 7282 base pairs of DNA
sequence data representing four mitochondrial regions and nine nuclear loci, as described
previously (see Chapter 2). This alignment consisted of one individual from each crocodylian
species or major lineage (see Chapter 2). The resulting tree was trimmed to consist solely of the
148
crocodyline (Crocodylus, Mecistops, and Osteolaemus) clade. This tree, with Osteolaemus
tetraspis and Mecistops cataphractus serving as outgroups, was used for all character-state
reconstruction analyses.
THE CHARACTERS
All crocodyline species were coded for three binary characters: nesting habit (mound
building or hole digging), body size (large or small), and habitat preference (estuarine or
freshwater). The character-states of each species were determined from the scientific literature
as described in the introduction, and are summarized in Table 3.1. Clearly, body size is not truly
dichotomous. However, as discussed in the introduction, this coding scheme captures a large
disparity in size between the four largest crocodiles (C. acutus, C. intermedius, C. porosus, and
C. niloticus) and the rest of the crocodylines. Additionally, habitat preference is also not
dichotomous. But again, as described in the introduction, as it relates to Crocodylinae, this
character can be well approximated by a binary coding scheme.
TABLE 3.1. The character states used in all ancestral character-state reconstruction analyses. For nesting habit, H = hole nesting and M = mound nesting. For habitat, E = estuarine and F = freshwater. For size, L = large and S = small. Any character-state with two letters represents polymorphy.
Species Nesting Habit Habitat Size Crocodylus acutus HM E L C. intermedius H F L C. moreletii M F S C. rhombifer HM F S C. niloticus H EF L C. siamensis M F S C. palustris H F S C. porosus M E L C. mindorensis M F S C. novaeguineae M F S C. johnstoni H F S Mecistops cataphractus M F S Osteolaemus tetraspis M F S
149
ANCESTRAL CHARACTER-STATE RECONSTRUCTIONS
Ancestral character-state reconstructions were inferred upon the phylogeny using
parsimony (Maddison, 1990), as implemented in MacClade 4.05 (Maddison and Maddison,
2000), assuming unordered character states. This method simply reconstructs the states of
ancestral nodes in the manner that minimizes the number of character-state changes across the
tree. ML (Pagel, 1999) methods of ancestral state reconstruction were implemented in the
BayesMultiState module of BayesTraits (Pagel and Meade, 2007). These methods reconstruct
the character-states of ancestral nodes based on a model of the character’s evolution that is
estimated from the data. The ML method estimates the model of character evolution (i.e.
transition rates among states) and the probability of each state at specified internal nodes that
maximize the likelihood of the data. The data are comprised of the tree, its branch lengths, and
the distribution of the character states across the terminal nodes.
All ML ancestral character-state reconstruction analyses were performed on the same
trimmed ML tree as the parsimony analyses, however branch lengths were incorporated. The
number of ML replicates for each analysis was set to 1000, and each analysis was run three times
to ensure consistent results. The model of character evolution that best fit the data while using
the fewest number of free parameters was determined using three steps: 1) The analysis was
performed with a model for which all possible character-state transition rates were estimated.
Because all characters are binary this fully parameterized model consisted of two transition rate
parameters. 2) The analysis was run with both character-state transition rates restricted as equal.
3) The resulting lnL scores from both analyses were compared using a LRT, for which the test
statistic was calculated as:
!
"ij = 2(lnLi # lnL j )
150
where
!
"ij is the likelihood ratio test statistic for the comparison of the lnLs of models i and j. A
χ2 test with the degrees of freedom equal to the difference in the number of free parameters (one
in all cases) was performed to determine if the LRT was significant. This LRT not only serves to
determine the best-fit model, but also tests an important hypothesis about the evolution of the
character. If the constrained model can be rejected, it also rejects the hypothesis that the
character evolves symmetrically. Once the optimal model was determined, it was used to infer
the character-states of all the internal nodes of the Crocodylus phylogeny. These methods of
ancestral character-state reconstruction were repeated for each of the three characters of interest.
TESTING FOR CORRELATION
The BayesDiscrete (Pagel, 1994; Pagel and Meade, 2006) module of BayesTraits was
used to determine if body size and habitat preference were evolutionarily correlated. Figure 3.1
shows the four possible state combinations of these two characters and the eight transition rates
(q) among them (modified from Pagel and Meade [2006]). Unlike parsimony reconstructions, in
ML analyses, character states can change anywhere on the tree over infinitesimally short time
intervals, thus it can be assumed impossible for both characters to change state in the same
instant (Pagel, 1994). If both characters evolve independently of one another, the two rate
parameters for the same character-state transition should be equal (qFE1 = qFE2 ; qEF1 = qEF2 ; qSL1
= qSL2 ; qLS1 = qLS2), and thus unaffected by the state of the other character. If one of these
equalities in rate change is violated, it suggests the rate of change between character states are
dependent upon, and thus correlated with, the evolution of the other character (Pagel, 1994;
Pagel and Meade, 2006).
151
FIGURE 3.1. Transition rates (q) among the four possible combinations of habitat (E = estuarine, F = freshwater) and size (L = large, S = small) character states. The subscripts E, F, S, and L denote the direction of the transition in state, whereas subscripts 1 and 2 represent the two, potentially different, transition rates dependent upon the background state of the other character.
In BayesTraits, the lnL score was obtained under a dependent model of character
evolution (i.e. all eight transition rates were allowed to vary) on the ML phylogeny with 1000
replicates. Next, four analyses were run, restricting one of the four possible independent
equalities (qFE1 = qFE2 , qEF1 = qEF2 , qSL1 = qSL2 or qLS1 = qLS2) in each. Each of the four
resulting scores was compared to the unrestricted (dependent) score using a LRT with 1 degree
of freedom. Lastly, an analysis was run with all four independent equalities restricted, and the
resulting score was compared to the unrestricted score with a LRT with 4 degrees of freedom. If
the analyses concordant with independent evolution (restricted) cannot be rejected in favor of the
dependent (unrestricted), it is assumed that the traits evolve independently of one another, and
are not correlated.
RESULTS
The ML tree from the PAUP* heuristic search is illustrated in Figure 3.2. The portion of
the tree shown in Figure 3.2 – B was used for all ancestral character-state reconstructions.
152
FIGURE 3.2. The ML tree from the PAUP* heuristic search. The portion shaded in (A) represents the tree used in all character-state reconstructions, and is shown in detail in (B). The support values in A and B (upper) represent the percentage of 400 bootstrap replicates. The lower support values in B represent posterior probabilities.
153
154
NESTING HABIT The optimal models of character evolution, as determined by the LRT, and their
corresponding parameter estimates are summarized in Table 3.2. The symmetrical (restricted)
model of character evolution could not be rejected for nesting habit (p = 0.56). The ML
parameter estimated for the transition rate between mound and hole nesting was high (Table 3.2),
and as a result, both character states have equal probability at all nodes (Figure 3.3 – A). This is
in stark contrast to the parsimony results, where a character state is inferred at all nodes in the
tree, except the one leading to C. moreletii and C. rhombifer (Figure 3.3 – B). Furthermore, the
parsimony analysis estimates four transitions in the evolution of nesting habit. The parsimony
analysis inferred mound nesting as the ancestral condition, three independent transitions to hole
nesting, and one returning transition to mound nesting within the New World clade (Figure 3.3 –
B).
TABLE 3.2. Optimal character-evolution models (determined by likelihood ratio tests) used in ancestral character-state reconstruction analyses. The parameter values were estimated during the analyses.
HABITAT AND BODY SIZE A symmetrical (restricted) model of character evolution was rejected for habitat
preference (p = 0.04). Thus, the two-parameter model was used for the ML reconstruction. The
parameter estimates suggest a five-fold greater transition rate from an estuarine to freshwater
habitat preference than the reverse (Table 3.2). Given this model of evolution, both character
states have equal probability at all internal nodes (Figure 3.4 – A). Again, in stark contrast to the
155
FIGURE 3.3. Results of the (A) ML and (B) parsimony nesting-habit ancestral character-state reconstructions.
156
FIGURE 3.4. The results of ML ancestral character-state reconstructions for (A) habitat and (B) size.
157
ML results, the parsimony results infer the character-state of every node in the tree. The
parsimony results support freshwater as the ancestral habitat, with two independent transitions to
estuarine habitat in C. acutus and C. porosus (Figure 3.5 – A).
FIGURE 3.5. The results of parsimony ancestral character-state reconstructions for (A) habitat and (B) size.
For body size, a symmetrical model of evolution could not be rejected (p = 0.19). The
ML parameter estimate for the rate of change between the size classes large and small is much
lower compared to other characters (Table 3.2). As a result, the character states at every node in
the tree have unequal probabilities (Figure 3.4 – B). The ML results suggest the ancestral size
class is small. Additionally, the results suggest a total of five transitions between size classes.
The evolution of large body size first occurs in the ancestor to all Crocodylus except C.
mindorensis, C. novaeguineae, and C. johnstoni (Figure 3.4 – B). Subsequently, leading to the
clade of C. siamensis, C. palustris, and C. porosus, there is a reversal to small size, followed by a
158
return to large body size by C. porosus (Figure 3.4 – B). There is also a reversal to small size
leading to the New World clade of C. acutus, C. intermedius, C. rhombifer, and C. moreletii,
followed by another return to large body size leading to the sister species C. acutus and C.
intermedius. However, both character states have nearly equal probabilities at several nodes in
the tree, demonstrating low confidence in some of the reconstructions (Figure 3.4 – B). The
parsimony results are quite similar to the ML reconstruction. Of the nodes at which a state was
inferred by parsimony (there are two ambiguous nodes), there is only one discrepancy with the
ML results (Figure 3.5 – B). The parsimony analysis infers small body size as the ancestral
condition of the New World clade, whereas large size is inferred in the ML results.
None of the models in which body size and habitat preference evolve independently
could be rejected in favor of the model in which these characters are evolutionarily correlated
(i.e. dependent; Table 3.3). These LRT results suggest that body size and habitat preference are
not evolutionarily correlated.
TABLE 3.3. Results of tests for correlated evolution between habitat and size. All constrained (independent) model lnL scores are compared to the unconstrained (dependent) model with LRTs. A p-value < 0.05 would reject the constrained model.
159
DISCUSSION
NESTING HABIT
At first glance, it may seem that parsimony “out-performed” ML in reconstructing the
ancestral nesting states. However, this may be deceiving, as the ML results may be more
biologically realistic. Based on the distribution of the character states across the Crocodylus tree,
nesting habit appears to be a very labile character. For example, the New World clade of
crocodiles represents four very closely related species resulting from a recent radiation (Figure
3.2; and see Chapter 2), yet these species exhibit considerable variation in nesting habit. Also,
there are two examples of extant species that utilize both nesting strategies, further evidencing
the lability of this character. The ML analysis clearly accounted for the changes in nesting habit
occurring along extremely short branches (like in the New World example), and thus estimated a
high transition rate to fit these data. Given this high transition rate, and the fact that the ML
analysis allows transitions to occur anywhere and any number of times on the tree, the results
expressed complete uncertainty in the ancestral reconstructions. Parsimony is unable to consider
branch lengths, and furthermore restricts every branch on the tree as either having no change or
one change. As a result, parsimony is largely incapable of considering a trait as highly plastic,
and will infer the states of nodes to minimize the number of changes across the tree. By making
full use of the data at hand, it seems that the ML analysis revealed a more biologically relevant
view of the evolution of nesting habit in crocodiles.
HABITAT PREFERENCE Habitat preference was another case in which parsimony resolved the ancestral character
states, whereas ML did not. However, the ML results may, again, be more plausible. The true
crocodiles possess many adaptations that make them better suited for estuarine environments
160
than other crocodylians. They possess lingual salt-secreting glands (Taplin, 1988; Taplin and
Grigg, 1981; Taplin et al., 1982; Taplin and Loveridge, 1988), a heavily keratinized buccal
epithelium (Taplin and Grigg, 1989), a highly adapted osmoregulatory cloaca (Pidcock et al.,
1997), and the ability to distinguish and drink freshwater from seawater. This is true for all
Crocodylus species, demonstrating that the entire genus is capable of utilizing estuarine
environments, making habitat preference potentially plastic. In other words, none of the extant
Crocodylus species are physiologically restricted to their current environment. Additionally, the
true crocodiles are the result of a recent radiation (within 6 – 13 mya; see Chapter 2), and thus
had to cross many marine barriers, including oceans, to establish their current distribution. It is
easy to imagine how wide-ranging, vagile, estuarine ancestors could have helped facilitate such a
history. Thus it is difficult to believe that there was no ancestral, estuarine condition throughout
the history of Crocodylus, which is suggested by the parsimony results. The parsimony results
suggest the suite of osmoregulatory characters possessed by all Crocodylus are an incredible
example of pre-adaptations, that were finally utilized for an estuarine existence by C. porosus, C.
acutus, and C. niloticus. The ML results on the other hand seem more plausible by
demonstrating that habitat preference is highly labile, which is evidenced by the physiology of
extant species. Furthermore, the ML analyses statistically rejected a symmetric model of habitat
preference evolution in preference of a model that favors the transition from estuarine to
freshwater habitats. This is congruent with the idea that ancestral Crocodylus were highly
marine-adapted, allowing them to rapidly colonize the world’s tropics and eventually give rise to
predominantly freshwater-inhabiting descendants.
161
BODY SIZE Reconstructing the evolution of body size is the one case where ML and parsimony
analyses were highly congruent. This is the only character for which the ML analysis estimated
a transition rate slow enough to be informative for nodal character state inference. This was
largely due to the absence of polymorphic extant species and transitions on extremely short
branches. It is not surprising that both methods inferred small body size as the ancestral
condition, because the outgroup and basal most Crocodylus clade (C. johnstoni, C. mindorensis,
and C. novaeguineae) are comprised entirely of small species.
UNCORRELATED EVOLUTION The ML analyses were unable to reject any of the independent (correlated) models of
evolution for body size and habitat preference. This is not surprising, considering the ML
ancestral reconstruction results for habitat preference. The ML analysis inferred habitat type as
an extremely plastic character. As a result, the character changes often across the tree, lacking
any phylogenetic pattern, thus making it impossible for habitat preference to be evolutionarily
correlated with any other character. Perhaps both characters are so phenotypically plastic, that
they are more likely to be ecologically correlated across very short time scales. For example,
estuarine environments may be richer in resources, allowing inhabiting crocodiles to attain larger
size. Perhaps the extant estuarine species have outcompeted their relatives for this primary
habitat. This is a possibility, because the distributions of all currently freshwater-restricted
Crocodylus species are entirely encompassed within the distributions of the two wide-ranging,
large-bodied, estuarine crocodiles; C. porosus in the Indo-Pacific and C. acutus in the
Neotropics. Competition with these species may have forced remaining Crocodylus to retreat
inland into freshwater environments. If this was true, and size was determined largely by
162
environmental conditions and competition with congeners, both body size and habitat preference
would be expected to change often and rapidly. Extinctions, changes in distribution,
environmental quality, temperature, and sea level could all alter which species have access to the
best resources and attain large size. Under such a scenario, one would not expect either character
to be evolutionarily conserved or correlated, which was found here.
CONCLUSIONS
Based on the results of this study, I recommend the use of model-based methods of
character reconstruction. These methods take full advantage of available data, provide
confidence in the results, and allow hypothesis testing. Although these methods may yield
unfavorable results (i.e. they may reveal uncertainty in ancestral conditions), such results may be
more biologically meaningful. The examples of crocodile nesting habit and habitat preference
should not be seen as failures of ML reconstruction analyses, but as results that provide new
insight into the evolution of these characters.
163
CHAPTER 4 MAIN CONCLUSIONS
This work represents the most thorough investigation into the evolutionary history of the
true crocodiles to date. The results of Chapters 2 and 3 revealed and confirmed many important
aspects of Crocodylus evolution. Phylogenetic and dating analyses confirmed that Crocodylus
represents a group of closely related species that were derived from a post-Middle Miocene
radiation. Thus, vicariance can no longer be invoked to explain the circumtropical distribution of
the genus. The results also demonstrated Crocodylus accomplished such an impressive radiation
during a period in crocodylian evolution marked by mass extinction. Additionally, the present
study included enough data and taxon sampling to finally disprove monophyly of Crocodylus.
Furthermore, the results proved C. niloticus represents two distinct species and that the current
taxonomic boundaries in other species may not be accurate. The biogeographic reconstructions
demonstrated that the true crocodiles likely did not originate in Africa, but rather from an
ancestor in the tropics of the Late Miocene Indo-Pacific.
From a methodological standpoint, the present study marks the first time in which model
selection criteria used for selecting among partitioning strategies did not choose the most
partitioned model as optimal. Furthermore, this study established a baseline for assessing the
utility of various model selection criteria for objectively selecting the optimal partitioning
strategy within ML and Bayesian frameworks. In doing so, the results indicate that gene identity
is a very poor method of partition choice, and that common biochemical and evolutionary
constraints are a much better guideline. The results of the ancestral character-state
reconstructions suggest ML and Bayesian methods consistently yield reliable and realistic
results, and are not as easily misled as parsimony methods.
164
LITERATURE CITED Aggarwal, R. K., K. C. Majumdar, J. W. Lang, and L. Singh. 1994. Generic affinities among
crocodilians as revealed by DNA fingerprinting with a Bkm-derived probe. Proceedings of the National Academy of Science 91:10601-10605.
Aitkin, M. 1991. Posterior Bayes factors. Journal of the Royal Statistical Society, Series B 53:111-142.
Akaike, H. 1974. A new look at the statistical model identification. IEEE Transactions on Automatic Control 19:716-723.
Allen, G. R. 1974. The marine crocodile, Crocodylus porosus, from Ponape, Eastern Caroline Islands, with notes on food habits of crocodiles from the Palau Archipelago. Copeia 1974:553.
Barber, P. H., and D. R. Bellwood. 2005. Biodiversity hotspots: evolutionary origins of biodiversity in wrasses (Halichoeres: Labridae) in the Indo-Pacific and new world tropics. Molecular Phylogenetics and Evolution 35:235-253.
Bartlett, E. 1895. The crocodiles and lizards of Borneo in the Sarawak Museum with descriptions of supposed new species, and the variation of colours in the several species during life. Journal of the Royal Asiatic Society, Straits Branch 28:73-96.
Birky, C. W., P. Fuerst, and T. Maruyama. 1989. Organelle gene diversity under migration, mutation and drift: equilibrium expectations, approach to equilibrium, effects of heteroplasmic cells, and comparison to nuclear genes. Genetics 121:613-627.
Boulenger, G. A. 1889. Catalogue of chelonians, rhynchocephalians, and crocodiles in the British Museum. Taylor and Francis, London.
Brandley, M. C., A. Schmitz, and T. W. Reeder. 2005. Partitioned Bayesian Analyses, Partition Choice, and the Phylogenetic Relationships of Scincid Lizards. Systematic Biology 54:373-390.
Brazaitis, P. 1973. The identification of living crocodilians. Zoologica 59:59-88.
Brochu, C. A. 1997. Morphology, fossils, divergence timing, and the phylogenetic relationships of Gavialis. Systematic Biology 46:479-522.
Brochu, C. A. 1999. Phylogenetics, taxonomy, and historical biogeography of Alligatoroidea.
Society of Vertebrate Paleontology Memoir 6:9-100.
Brochu, C. A. 2000a. Congruence between physiology, phylogenetics and the fossil record on crocodylian historical biogeography. Pages 9-28 in Crocodilian Biology and Evolution (G. C. Grigg, F. S. Seebacher, and C. E. Franklin, eds.). Surrey Beatty and Sons, Chipping Norton, New South Wales, Australia.
165
Brochu, C. A. 2000b. Phylogenetic relationships and divergence timing of Crocodylus based on morphology and the fossil record. Copeia 2000:657-673.
Brochu, C. A. 2003. Phylogenetic approaches toward crocodylian history. Annual Review of Earth Planetary Sciences 31:357-397.
Brochu, C. A. 2004a. Alligatorine phylogeny and the status of Allognathosuchus Mook, 1921. Journal of Vertebrate Paleontology 24:857-873.
Brochu, C. A. 2004b. Calibration age and quartet divergence date estimation. Evolution 58:1375-1382.
Brochu, C. A. 2004c. Patterns of Calibration Age Sensitivity with Quartet Dating Methods. Journal of Paleontology 78:7-30.
Brochu, C. A., and L. D. Densmore. 2000. Crocodile phylogenetics: a summary of current progress. Pages 3-8 in Crocodilian Biology and Evolution (G. C. Grigg, F. S. Seebacher, and C. E. Franklin, eds.). Surrey Beatty and Sons, Chipping Norton, New South Wales, Australia.
Brooks, D. R. 1979. Testing Hypotheses of Evolutionary Relationships among Parasites: The Digeneans of Crocodilians. American Zoologist 19:1225-1238.
Brooks, D. R., and R. T. O'Grady. 1989. Crocodilians and Their Helminth Parasites: Macroevolutionary Considerations. American Zoologist 29:873-883.
Brown, W. C., and A. C. Alcala. 1980. Philippine lizards of the family Scincidae. Silliman University, Dumaguete City, Philippines.
Bull, J. J., J. P. Huelsenbeck, C. W. Cunningham, D. L. Swofford, and P. J. Waddell. 1993. Partitioning and combining data in phylogenetic analysis. Systematic Biology 42:384-397.
Burnham, K. P., and D. R. Anderson. 2002. Model selection and multimodel inference, a practical information-theoretic approach, 2nd edition. Springer, New York.
Buscalioni, A. D., F. Ortega, D. B. Weishampel, and C. M. Jianu. 2001. A revision of the crocodyliform Allodaposuchus precedens from the upper cretaceous of the Hatig Basin, Romania: its relevance in the phylogeny of Eusuchia. Journal of Vertebrate Paleontology 21:74-86.
Bustard, H. R., and B. C. Choudhury. 1982. Long distance movement by a saltwater crocodile (Crocodylus porosus). British Journal of Herpetology 6:87.
Campbell, H. W. 1972. Ecological or Phylogenetic Interpretations of Crocodilian Nesting Habits. Nature 238:404-405.
166
Castoe, T. A., and C. L. Parkinson. 2006. Bayesian mixed models and the phylogeny of pitvipers (Viperidae: Serpentes). Molecular Phylogenetics and Evolution 39:91-110.
Castoe, T. A., M. M. Sasa, and C. L. Parkinson. 2005. Modeling nucleotide evolution at the mesoscale: The phylogeny of the Neotropical pitvipers of the Porthidium group (Viperidae: Crotalinae). Molecular Phylogenetics and Evolution 37:881-898.
Chavananikul, V., S. Wattanodorn, and U. Youngprapakorn. 1994. Karyotypes of 5 species of crocodile kept in Samutprakan Crocodile Farm and Zoo. Pages 58-62 in Crocodiles; Proceedings of the 12th Working Meeting of the Crocodile Specialist Group, IUCN - World Conservation Union. IUCN, Gland, Switzerland.
Clark, J. M. 1994. Patterns of evolution in Mesozoic Crocodyliformes. Pages Pp. 84-97 in In the Shadow of the Dinosaurs: Early Mesozoic Tetrapods (N. C. Fraser, and H. D. Sues, eds.). Cambridge University Press, Cambridge, England.
Compton, A. W. 1981. Courtship and nesting behaviour of the freshwater crocodile, Crocodylus johnstoni, under controlled conditions. Australian Wildlife Research 8:443-450.
Cott, H. b. 1961. Scientific results of an inquiry into the ecology and economic status of the Nile crocodile (Crocodylus niloticus) in Uganda and Northern Rhodesia. Transactions of the Zoological Society of London 29:257-310.
Cox, J. 1984. Crocodile nesting ecology in Papua New Guinea. Field Document No. 5, Livestock Division, Dept. of Primary Industry, and Food and Agriculture Organization of the United States, Port Moresby.
Cunningham, C. W. 1997. Can three incongruence tests predict when data should be combined? Molecular Biology and Evolution 14:733-740.
Cunningham, C. W., H. Zhu, and D. M. Hillis. 1998. Best-fit maximum-likelihood models for phylogenetic inference: Empirical tests with known phylogenies. Evolution 52:978-987.
Davenport, M. 1995. Evidence of possible sperm storage in the Caiman, Paleosuchus palpebrosus. Herpetological Review 26:14-15.
Davis, L. M., T. C. Glenn, R. M. Elsey, H. C. Dessauer, and R. H. Sawyer. 2001. Multiple paternity and mating patterns in the American alligator, Alligator mississippiensis. Molecular Ecology 10:1011-1024.
Delfino, M., M. Böhme, and L. Rook. 2007. First European evidence for transcontinental dispersal of Crocodylus (late Neogene of southern Italy). Zoological Journal of the Linnean Society 149:293-307.
Densmore, L. D. 1983. Biochemical and Immunological Systematics of the Order Crocodilia. Pages 397-496 in Evolutionary Biology (M. K. Hecht, B. Wallace, and G. T. Prance, eds.). Plenum Press, New York.
167
Densmore, L. D., and H. C. Dessauer. 1984. Low levels of protein divergence detected between Gavialis and Tomistoma: evidence for crocodilian monophyly? Comparative Biochemistry and Physiology 77B:715-720.
Densmore, L. D., and R. D. Owen. 1989. Molecular systematics of the order Crocodilia. American Zoologist 29:831-841.
Densmore, L. D., and P. S. White. 1991. The systematics and evolution of the Crocodilia as suggested by restriction endonuclease analysis of mitochondrial and nuclear ribosomal DNA. Copeia 1991:602-615.
Dessauer, H. C., T. C. Glenn, and L. D. Densmore. 2002. Studies on the molecular evolution of the Crocodylia: footprints in the sands of time. Journal of Experimental Zoology 294:302-311.
Ditmars, R. L. 1933. Reptiles of the World. MacMillan Company, New York.
Dowling, H. G., and W. E. Duellman. 1978. Systematic Herpetology: A Synopsis of Families and Higher Categories. HISS Publications, New York, NY, USA.
Drummond, A. J., S. Y. W. Ho, M. J. Phillips, and A. Rambaut. 2006. Relaxed Phylogenetics and Dating with Confidence. PLoS Biology 4:e88.
Drummond, A. J., G. K. Nicholls, A. G. Rodrigo, and W. Solomon. 2002. Estimating Mutation Parameters, Population History and Genealogy Simultaneously From Temporally Spaced Sequence Data. Genetics 161:1307-1320.
Drummond, A. J., and A. Rambaut. 2003. BEAST v1.0, Available from http://beast.bio.ed.ac.uk/.
Dunson, W. A. 1970. Some aspects of electrolyte and water balance in three estuarine reptiles, the diamondback terrapin, American and “salt water” crocodiles. Comparative Biochemistry and Physiology 32:161-174.
Elsworth, P. G., F. Seebacher, and C. E. Franklin. 2003. Sustained swimming performance in crocodiles (Crocodylus porosus): effects of body size and temperature. Journal of Herpetology 37:363-368.
Farris, J. S., M. Kallersjo, A. G. Kluge, and C. Bult. 1995. Testing significance of incongruence. Cladistics 10:315-319.
Farris, J. S., M. Källersjö, A. G. Kluge, and C. Bult. 1994. Testing significance of incongruence. Cladistics 10:315-319.
Felsenstein, J. 1985. Confidence limits on phylogenies: An approach using the bootstrap. Evolution 39:783-791.
168
Felsenstein, J. 1988. Phylogenies from molecular sequences: inference and reliability. Annual Review of Genetics 22:521-565.
Felsenstein, J., and H. Kishino. 1993. Is there something wrong with the bootstrap on phylogenies? A reply to Hillis and Bull. Systematic Biolgy 42:193-200.
Fitzsimmons, N. N., J. C. Buchan, P. V. Lam, G. Polet, T. T. Hung, N. Q. Thang, and J. Gratten. 2002. Identification of purebred Crocodylus siamensis for reintroduction in Vietnam. Journal of Experimental Zoology 294:373-381.
Forster, M., and E. Sober. 2004. Why likelihood?in The Nature of Scientific Evidence: Statistical, Philosophical, and Empirical Considerations (M. L. Taper, and S. R. Lele, eds.). The University of Chicago Press, Chicago, Illinois, USA.
Friesen, V. L., B. C. Congdon, M. G. Kidd, and T. P. Birt. 1999. Polymerase chain reaction (PCR) primers for the amplification of five nuclear introns in vertebrates. Molecular Ecology 8:2147-2149.
Friesen, V. L., B. C. Congdon, H. E. Walsh, and T. P. Birt. 1997. Intron variation in marbled murrelets detected using analyses of single-stranded conformational polymorphisms. Molecular Ecology 6:1047-1058.
Gatesy, J., G. Amato, M. Norell, R. DeSalle, and C. Hayashi. 2003. Combined support for wholesale taxic atavism in gavialine crocodylians. Systematic Biology 52:403-422.
Gatesy, J., and G. D. Amato. 1992. Sequence similarity of 12s ribosomal segment of mitochondrial DNAs of gharial and false gharial. Copeia 1992:241-243.
Gatesy, J., R. H. Baker, and C. Hayashi. 2004. Inconsistencies in arguments for the supertree approach: supermatrices versus supertrees of Crocodylia. Systematic Biology 53:342-355.
Gatesy, J., R. DeSalle, and W. Wheeler. 1993. Alignment-ambiguous nucleotide sites and the exclusion of systematic data. Molecular Phylogenetics and Evolution 2:152-157.
Goldman, N., J. P. Anderson, and A. G. Rodrigo. 2000. Likelihood-based tests of topologis in phylogenetics. Systematic Biology 49:652-670.
Gratten, J. 2003. The molecular systematics phylogeography and population genetics of Indo-Pacific Crocodylus. in PhD Dissertation University of Queensland, Queensland, Australia.
Gray, J. E. 1844. Catalogue of the Tortoises, Crocodiles, and Amphisbaenians in the collection of the British Museum. Edward Newman, London.
Gray, J. E. 1862. A synopsis of the species of crocodiles. Annals and Magazine of Natural History, Ser. 3 10:265-274.
169
Gray, J. E. 1869. Synopsis of the species of recent crocodilians or emydosaurians, chiefly founded on the specimens in the British Museum and the Royal College of Surgeons. Transactions of the Zoological Society of London 6:125-169.
Greer, A. E. 1970. Evolutionary and Systematic Significance of Crocodilian Nesting Habits. Nature 227:523-524.
Greer, A. E. 1974. On the maximum total length of the salt-water crocodile (Crocodylus porosus). Journal of Herpetology 8:381-384.
Grigg, G. C., F. Seebacher, L. A. Beard, and D. Morris. 1998. Thermal relations of large crocodiles, Crocodylus porosus, free-ranging in a naturalistic situation. Proceedings of the Royal Society of London, Series B 265:1793-1799.
Groombridge, B. 1987. The distribution and status of world crocodiliansin Wildlife Management: Crocodiles and Alligators (G. J. W. Webb, S. C. Manolis, and P. J. Whitehead, eds.). Surrey Beatty & Sons Pty Ltd, Chipping Norton, Australia.
Hall, P. M. 1989. Variation in geographic isolates of the New Guinea crocodile (Crocodylus novaeguineae Schmidt) compared with the similar, allopatric, Philippine crocodile (C. mindorensis Schmidt). Copeia 1989:71-80.
Hall, P. M., and D. R. Johnson. 1987. Nesting biology of Crocodylus novaeguineae in Lake Murray District, Papua New Guinea. Herpetologica 43:249-258.
Harshman, J., C. J. Huddleston, J. P. Bollback, T. J. Parsons, and M. J. Braun. 2003. True and false gharials: a nuclear gene phylogeny of Crocodylia. Systematic Biology 52:386-402.
Hass, C. A., M. A. Hoffman, L. D. Densmore, and L. R. Maxson. 1992. Crocodilian evolution: insights from immunological data. Molecular Phylogenetics and Evolution 1:193-201.
Hillis, D., and J. Bull. 1993. An empirical test of bootstrapping as a method for assessing confidence in phylogenetic analysis. Systematic Biology 42:182-192.
Holder, M., and P. O. Lewis. 2003. Phylogeny estimation: Traditional and Bayesian approaches. Nature Reviews Genetics 4:275-284.
Holland, B. R., D. Penny, and M. D. Hendy. 2003. Outgroup misplacement and phylogenetic inaccuracy under a molecular clock - a simulation study. Systematic Biology 52:229-238.
Huelsenbeck, J. P., and B. Rannala. 2004. Frequentist properties of Bayesian posterior probabilities of phylogenetic trees under simple and complex substitution models. Systematic Biology 53:904-913.
Huelsenbeck, J. P., and F. Ronquist. 2001. MrBayes: Bayesian inference of phylogeny. Biometrics 17:754-755.
170
Hunt, R. H. 1975. Maternal behavior in the Morelet's crocodile, Crocodylus moreleti. Copeia 1975:763-764.
Hunt, R. H. 1977. Aggressive behavior by adult Morelet's crocodiles Crocodylus moreleti toward young. Herpetologica 33:195-201.
Hunt, R. H. 1980. Propagation of Morelet's crocodile. Contributions to Herpetology 1980:161-165.
Hurvich, C. M., and C. Tsai. 1989. Regression and time series model selection in small samples. Biometrika 76:297-307.
Huxley, T. H. 1868. On the classification and the distribution of the Alectoromorphae and Heteromorphae. Proceedings of the Zoological Society of London 6:249-319.
Inger, R. F. 1948. The systematics of the crocodile, Osteoblepharon osborni. Copeia 1948:15-19.
Inger, R. I. 1954. Systematics and zoogeography of Philippine Amphibia. Fieldiana 33:182-531.
Iordansky, N. N. 1973. The skull of the Crocodilia. Pages 201-260 in Biology of the Reptilia (C. G. a. T. Parsons, ed.) Academic Press, London.
Jackson, K., D. G. Butler, and D. R. Brooks. 1996. Habitat and phylogeny influence salinity discrimination in crocodilians: implications for osmoregulatory physiology and historical biogeography. Biological Journal of the Linnean Society 58:371-383.
Janke, A., and U. Arnason. 1997. The complete mitochondrial genome of Alligator mississippiensis and the separation between recent Archosauria (birds and crocodiles). Molecular Biology and Evolution 14:1266-1272.
Janke, A., D. Erpenbeck, M. Nilsson, and U. Arnason. 2001. The mitochondrial genomes of the iguana (Iguana iguana) and the caiman (Caiman crocodylus): Implications for amniote phylogeny. Proceedings of the Royal Society of London, Series B 268:623-631.
Janke, A., A. Gullberg, S. Hughes, R. K. Aggarwal, and U. Arnason. 2005. Mitogenomic Analyses Place the Gharial (Gavialis gangeticus) on the Crocodile Tree and Provide Pre-K/T Divergence Times for Most Crocodilians. Journal of Molecular Evolution 61:620-626.
Jeffreys, H. 1935. Some tests of significance, treated by the theory of probability. Proceedings of the Cambridge Philosophy Society 31:203-222.
Jeffreys, H. 1961. Theory of Probability 3rd edition. Oxford University Press, Oxford, U.K.
Jobb, G. 2007. TREEFINDER version of May 2007. Munich, Germany. Distributed by the author at www.treefinder.de.
Kälin, J. A. 1955. Zur Stammesgeschichte der Crocodilia. Revue Suisse de Zoologie 62:347-356.
171
Kass, R. E., and A. E. Raftery. 1995. Bayes Factors. Journal of the American Statistical Association 90:773-795.
Kass, R. E., and L. Wasserman. 1995. A Reference Bayesian Test for Nested Hypotheses and its Relationship to the Schwarz Criterion. Journal of the American Statistical Association 90:928-934.
King, F. W., and R. L. Burke. 1989. Crocodilian, Tuatara, and Turtle Species of the World: A Taxonomic and Geographic Reference. Association of Systematics Collections, Washington DC, USA.
Kishino, H., and M. Hasegawa. 1989. Evaluation of the maximum-likelihood estimate of the evolutionary tree topologies from DNA sequence data, and the branching order in Hominoidea. Journal of Molecular Evolution 29:170-179.
Kofron, C. P. 1989. Nesting ecology of the Nile crocodile (Crocodylus niloticus). African Journal of Ecology 27:335-341.
Kullback, S., and R. A. Leibler. 1951. On information and sufficiency. Annals of Mathematical Statistics 22:79-86.
Kushlan, J. A., and F. J. Mazzotti. 1989. Population biology of the American crocodile. Journal of Herpetology 23:7-21.
Latiolais, J. M., M. S. Taylor, K. Roy, and M. E. Hellberg. 2006. A molecular phylogenetic analysis of strombid gastropod morphological diversity. Molecular Phylogenetics and Evolution 41:436-444.
Leaché, A. D., and T. W. Reeder. 2002. Molecular systematics of the eastern fence lizard (Sceloporus undulatus): a comparison of parsimony, likelihood, and Bayesian approaches. Systematic Biology 51:44-68.
Lemmon, A. R., and E. C. Moriarty. 2004. The importance of proper model assumption in Bayesian phylogenetics. Systematic Biology 53:265-277.
Lessios, H. A., B. D. Kessing, and D. R. Robertson. 1998. Massive gene flow across the world's most potent marine biogeographic barrier. Proceedings of the Royal Society of London, Series B 265:583-588.
Lessios, H. A., B. D. Kessing, D. R. Robertson, and G. Paulay. 1999. Phylogeography of the pantropical sea urchin Eucidaris in relation to land barriers and ocean currents. Evolution 53:806-817.
Lessios, H. A., B. D. Kessing, G. M. Wellington, and A. Gray-Beal. 1996. Indo-Pacific echinoids in the tropical Eastern Pacific. Coral Reefs 15:133-142.
172
Li, Y., X. Wu, X. Ji, P. Yan, and G. Amato. 2007. The complete mitochondrial genome of the salt-water crocodile (Crocodylus porosus) and phylogeny of crocodilians. Journal of Genetics and Genomics 34:119-128.
Lockhart, P. J., M. A. Steel, M. D. Hendy, and D. Penny. 1994. Recovering Evolutionary Trees under a More Realistic Model of Sequence Evolution Molecular Biology and Evolution 11:605-612.
Lydekker, R. 1886. Indian Tertiary and Post-Tertiary Vertebrata: Siwalik Crocodilia, Lacertilia and Ophidia. Palaeontologia Indica 10:209-240.
Maddison, D. R., and W. P. Maddison. 2000. MacClade: analysis of phylogeny and character evolution. Version 4.0. Sinauer, Sunderland, MA.
Maddison, W. P. 1990. A method for testing the correlated evolution of two binary characters: are gains and losses concentrated on certain branches of a phylogenetic tree. Evolution 44:539-557.
Maddison, W. P., and D. R. Maddison. 2006. Mesquite: a modular system for evolutionary analysis. Version 1.12. http://mesquiteproject.org.
Markwick, P. J. 1998. Crocodilian diversity in space and time: the role of climate in paleoecology and its implication for understanding K/T extinctions. Paleobiology 24:470-497.
McAliley, L. R., R. E. Willis, D. A. Ray, P. S. White, C. A. Brochu, and L. D. Densmore. 2006. Are crocodiles really monophyletic?—Evidence for subdivisions from sequence and morphological data. Molecular Phylogenetics and Evolution 39:16-32.
Mead, J. I., R. Cubero, A. L. V. Zamora, S. L. Swift, C. Laurito, and L. D. Gomex. 2006. Pio-Pleistocene Crocodylus (Crocodylia) form southwestern Costa Rica. Studies on Neotropical Fauna and Environment 41:1-7.
Mead, J. I., D. W. Steadman, S. H. Bedford, C. J. Bell, and M. Spriggs. 2002. New extinct mekosuchine crocodile from Vanuatu, South Pacific. Copeia 2002:632-641.
Medem, F. 1981. Los Crocodylia de Sur America. Vol. 1. Los Crocodylia de Colombia., Colciencias, Bogota.
Miller, W. E. 1980. The late Pliocene Las Tunas Local Fauna from southernmost Baja California, Mexico. Journal of Paleontology 54:762-805.
Molnar, R. E. 1979. Crocodylus porosus from the Pliocene Allingham Formation of North Queensland. Results of the Ray E. Lemley Expeditions, Part 5. Memoirs of the Queensland Museum 19:357-365.
Molnar, R. E., T. H. Worthy, and P. M. A. Willis. 2002. An extinct Pleistocene endemic mekosuchine crocodylian from Fiji. Journal of Vertebrate Paleontology 22:612-628.
173
Mook, C. C. 1927. The skull characters of Crocodylus megarhinus Andrews. American Museum Novitates 289:1-8.
Mook, C. C. 1933. A skull with jaws of Crocodilus sivalensis Lydekker. American Museum Novitates 670:1-10.
Muller, J., and R. R. Reisz. 2005. Four well-constrained calibration points from the vertebrate fossil recored for molecular clock estimates. BioEssays 27:1069-1075.
Muller, S., and H. Schlegel. 1844. Over de krokodillen van den Indischen Archipel. Pages 28 in Verhandelingen over de natuurlijke geschiedenis der Nederlandsche overzeesche bezittingen, door do leden der Natuurkundige Commissie in Indie en andere Schrijvers, Leiden.
Neill, W. T. 1971. The Last of the Ruling Reptiles: Alligators, Crocodiles and their kin. Columbia University Press, New York, USA.
Nettel, A., and R. S. Dodd. 2007. Drifting propagules and receding swamps: genetic footprints of mangrove recolonization and dispersal along tropical coasts. Evolution 61:958-971.
Newton, M. A., and A. E. Raftery. 1994. Approximate Bayesian Inference with the Weighted Likelihood Bootstrap. Journal of the Royal Statistical Society, Series B 56:3-48.
Norell, M. A. 1988. Cladistic approaches to paleobiology as applied to the phylogeny of alligatoridsYale University, New Haven, Connecticut.
Norell, M. A. 1989. The higher level relationships of the extant Crocodylia. Journal of Herpetology 23:325-335.
Notredame, C., D. G. Higgins, and J. Heringa. 2000. T-Coffee: A novel method for fast and accurate multiple sequence alignment. Journal of Molecular Biology 301:205-217.
Nylander, J. A. A. 2004. MrModletest v2. Program distributed by the author. Evolutionary Biology Centre, Uppsala University.
Nylander, J. A. A., F. Ronquist, J. P. Huelsenbeck, and J. L. Nieves-Aldrey. 2004. Bayesian phylogenetic analysis of combined data. Systematic Biology 53:47-67.
Olson, D. M., E. Dinerstein, E. D. Wikramanayake, N. D. Burgess, G. V. N. Powell, E. C. Underwood, J. A. D'Amico, I. Itoua, H. E. Strand, J. C. Morrison, C. J. Loucks, T. F. Allnutt, T. H. Ricketts, Y. Kura, J. F. Lamoreux, W. W. Wettengel, P. Hedao, and K. R. Kassem. 2001. Terrestrial Ecoregions of the World: A New Map of Life on Earth. BioScience 31:933-938.
Pagel, M. 1994. Detecting correlated evolution on phylogenies: a general method for the comparative analysis of discrete characters. Proceedings of the Royal Society of London, Series B 255:37-45.
174
Pagel, M. 1999. The maximum likelihood approach to reconstructing ancestral character states of discrete characters on phylogenies. Systematic Biology 48:612-622.
Pagel, M., and A. Meade. 2006. Bayesian analysis of correlated evolution of discrete characters by reversible-jump Markov chain Monte Carlo. American Naturalist 167:808-825.
Pagel, M., and A. Meade. 2007. BayesTraits: Available for download at www.evolution.rdg.ac.uk.
Pagel, M., A. Meade, and D. Barker. 2004. Bayesian estimation of ancestral character states on phylogenies. Systematic Biology 53:673-684.
Palumbi, S. R. 1996. Nucleic Acids II: The Polymerase Chain Reaction. Pages 205-247 in Molecular Systematics (D. M. Hillis, C. Moritz, and B. K. Mable, eds.). Sinauer Associates, Inc., Sunderland, Massachusetts, U.S.A.
Palumbi, S. R. 1997. Molecular biogeography of the Pacific. Pages 91-96 in Proceedings of the 8th International Coral Reef Symposium (H. A. Lessios, and I. G. Macintyre, eds.). Smithsonian Tropical Research Institute, Balboa, Panama.
Palumbi, S. R., and C. S. Baker. 1994. Contrasting Population Structure from Nuclear Intron Sequences and mtDNA of Humpback Whales Molecular Biology and Evolution 11:426-435.
Palumbi, S. R., F. Cipriano, and M. P. Hare. 2001. Predicting nuclear gene coalescence from mitochondrial data: the three-times rule. Evolution 55:859-868.
Pérez-Higareda, G. 1980. Notes on nesting of Crocodylus moreleti in Southern Veracruz, Mexico. Bulletin of the Maryland Herpetological Society 16:52-53.
Pidcock, S., L. E. Taplin, and G. C. Grigg. 1997. Differences in renal-cloacal function between Crocodylus porosus and Alligator mississippiensis have implications for crocodilian evolution. Journal of Comparative Physiology 167B:153-158.
Platt, S. G., H. Sovannara, L. Kheng, B. L. Stuart, and J. Walston. 2006. Crocodylus siamensis along the Sre Ambel River, Southern Cambodia: habitat, nesting, and conservation. Herpetological Natural Histoy 9:183-188.
Poe, S. 1996. Data set incongruence and the phylogeny of crocodilians. Systematic Biology 45:393-414.
Pond, S. L. K., S. D. W. Frost, and S. V. Muse. 2005. HyPhy: hypothesis testing using phylogenies. Bioinformatics 21:676-679.
Pope, C. H. 1955. The Reptile World: A Natural History of the Snakes, Lizards, Turtles, and Crocodilians. Alfred A. Knopf, New York.
175
Posada, D., and T. R. Buckley. 2004. Model selection and model averaging in phylogenetics: advantages of the AIC and Bayesian approaches over likelihood ratio tests. Systematic Biology 53:793-808.
Posada, D., and K. A. Crandall. 1998. Modeltest: testing the model of DNA substitution Bioinformatics 14:817-818.
Raftery, A. 1996. Hypothesis testing and model selection. Pages 163-187 in Markov Chain Monte Carlo in Practice (W. R. Gilks, S. Richardson, and D. J. Spiegelhalter, eds.). Chapman and Hall, New York, New York, USA.
Raftery , A. E. 1999. Bayes Factors and BIC: Comment on "A Critique of the Bayesian Information Criterion for Model Selection". Sociological Methods & Research 27:411-427.
Rambaut, A., and A. Drummond. 2005. Tracer v1.3, available from
www.evolve.zoo.ox.ac.uk/software.
Ray, D. A., and L. Densmore. 2002. The crocodilian mitochondrial control region: General structure, conserved sequences, and evolutionary implications. Journal of Experimental Zoology (Mol Dev Evol) 294:334-345.
Ray, D. A., J. A. Dever, S. G. Platt, T. R. Rainwater, A. G. Finger, S. T. McMurry, M. A. Batzer, B. Barr, P. J. Stafford, J. McKnight, and L. D. Densmore. 2004. Low levels of nucleotide diversity in Crocodylus moreletii and evidence of hybridization with C. acutus. Conservation Genetics 5:449-462.
Reeder, T. W. 2003. A phylogeny of the Australian Sphenomorphus group (Scincidae: Squamata) and the phylogenetic placement of the crocodile skinks (Tribolonotus): Bayesian approaches to assessing congruence and obtaining confidence in maximum likelihood inferred relationships. Molecular Phylogenetics and Evolution 27:384-397.
Reese, A. M. 1915. The Alligator and Its Allies. The Knickerbocker Press, New York, USA.
Ronquist, F. 1996. DIVA version 1.1. Computer program and manual available by anonymous FTP from Uppsala University (ftp.uu.se or ftp.systbot.uu.se).
Ronquist, F. 1997. Dispersal-vicariance analysis: A new approach to the quantification of historical biogeography. Systematic Biology 46:195-203.
Ross, C. A. 1990. Crocodylus raninus S. Muller and Schlegel, a valid species of crocodile (Reptilia: Crocodylidae) from Borneo. Proceedings of the Biological Society of Washington 103:955-961.
Ross, C. A. 1992. Designation of a lectotype for Crocodylus raninus S. Muller and Schlegel (Reptilia: Crocodylidae), the Borneo crocodile. Proceeding of the Biological Society of Washington 105:400-402.
176
Ross, F. D., and G. C. Mayer. 1983. On the dorsal armor of the Crocodilia. Pages 305-331 in Advances in Herpetology and Evolutionary Biology (A. Rhodin, and K. Miyata, eds.). Museum of Comparative Zoology, Cambridge, Massachusetts.
Ross, J. P. e. 1998. Crocodiles: Status Survey and Conservation Action Plan [Online], 2nd edition. International Union for Conservation of Nature and Natural Resources, Gland, Switzerland. Available: http://www.flmnh.ufl.edu/natsci/herpetology/act-plan/plan1998a.htm [6 July 1998].
Salisbury, S. W., R. E. Molnar, E. Frey, and P. M. A. Willis. 2006. The origin of modern crocodyliforms: new evidence from the Cretaceous of Australia. Proceedings of the Royal Society of London, Series B 273:2439-2448.
Salisbury, S. W., and P. M. A. Willis. 1996. A new crocodylian from the Early Eocene of Southeastern Queensland and a preliminary investigation of the phylogenetic relationships of crocoyloids. Alcheringa 20:179-227.
Sambrook, J., and D. W. Russell. 2001. Molecular Cloning: A Laboratory Manual, 3rd edition. Cold Spring Harbor, New York.
Sanderson, M. J., and H. B. Shaffer. 2002. Troubleshooting molecular phylogenetic analyses. Annual Review of Ecology and Systematics 33:49-72.
Schmidt, K. P. 1919. Contributions to the herpetology of the Belgian Congo. Part 1. Turtles, crocodiles, lizards and chameleons. Bulletin of the American Museum of Natural History 39:385-624.
Schmidt, K. P. 1924. Notes on Central American crocodiles. Field Museum of Natural History Zoological Series 12:79-92.
Schmitz, A., P. Mansfeld, E. Hekkala, T. Shine, H. Nickel, G. Amato, and W. Bohme. 2003. Molecular evidence for species level divergence in African Nile crocodiles Crocodylus niloticus (Laurenti, 1786). Comptes Rendus Palevol 2:703-712.
Schwarz, G. 1978. Estimating the Dimension of a Model. The Annals of Statistics 6:461-464.
Sclater, P. L. 1858. On the General Geographic Distribution of the Members of the Class Aves. Zoological Journal of the Linnean Society 2:130-145.
Shimodaira, H. 2002. An approximately unbiased test of phylogenetic tree selection. Systematic Biology 51:492-508.
Shimodaira, H., and M. Hasegawa. 1999. Multiple comparisons of log-likelihoods with applications to phylogenetic inference. Molecular Biololgy and Evolution 16:1114-1116.
Shimodaira, H., and M. Hasegawa. 2001. CONSEL: for assessing the confidence of phylogenetic tree selection. Bioinformatics 17:1246-1247.
177
Shine, T., W. Bohme, H. Nickel, D. F. Thies, and T. Wilms. 2001. Rediscovery of relict populations of the Nile crocodile Crocodylus niloticus in south-eastern Mauritania, with observations on their natural history. Oryx 35:260-262.
Sill, W. D. 1968. The Zoogeography of the Crocodilia. Copeia 1968:76-88.
Stamatakis, A. 2006. RAxML-VI-HPC: maximum likelihood-based phylogenetic analyses with thousands of taxa and mixed models. Bioinformatics 22:2688-2690.
Stamatakis, A., T. Ludwig, and H. Meier. 2005. RAxML-III: a fast program for maximum likelihood-based inference of large phylogenetic trees. Bioinformatics 21:456-463.
Strimmer, K., and A. Rambaut. 2002. Inferring confidence sets of possibly misspecified gene trees. Proceedings of the Royal Society of London, Series B 269:137-142.
Sugiura, N. 1978. Further analysis of the data by Akaike's information criterion and the finite corrections. Communications in Statistics, Theory and Methods A7:13-26.
Suvanakorn, P., and C. Youngprapakorn. 1987. Crocodile farming in Thailandin Wildlife Management: Crocodiles and Alligators (G. J. W. Webb, S. C. Manolis, and P. J. Whitehead, eds.). Surrey Beatty & Sons Pty Ltd, Chipping Norton, Australia.
Swanepoel, D. G. J., N. S. Ferguson, and M. R. Perrin. 2000. Nesting ecology of Nile crocodiles (Crocodylus niloticus) in the Olifants River, Kruger National Park. Koedoe 43:35-46.
Swofford, D. L. 2003. PAUP*. Phylogenetic Analysis Using Parsimony (*and Other Methods). Sinauer Associates, Sunderland, MA.
Swofford, D. L., G. J. Olsen, P. J. Waddell, and D. M. Hillis. 1996. Phylogenetic inference. Pages 407-514 in Molecular Systematics, Second Edition (D. M. Hillis, C. Moritz, and B. K. Mable, eds.). Sinauer Associates, Inc., Sunderland, Massachusetts, USA.
Taplin, L. E. 1988. Osmoregulation in crocodilians. Biol. Rev. 63:333-377.
Taplin, L. E., and G. C. Grigg. 1981. Salt glands in the tongue of the estuarine crocodile Crocodylus porosus. Science 212:1045-1047.
Taplin, L. E., and G. C. Grigg. 1989. Historical zoogeography of the eusuchian crocodilians: a physiological perspective. American Zoologist 29:885-901.
Taplin, L. E., G. C. Grigg, and L. Beard. 1985. Salt gland function in fresh water crocodiles: evidence for a marine phase in eusuchian evolution? Pages 403-410 in Biology of Australasian Frogs and Reptiles (G. Grigg, R. Shine, and H. Ehmann, eds.). Surrey Beatty and Sons, Chipping Norton, New South Wales, Australia.
Taplin, L. E., G. C. Grigg, P. Harlow, T. M. Ellis, and W. A. Dunson. 1982. Lingual salt glands in Crocodylus acutus and C. johnstoni and their absence from Alligator mississipiensis and Caiman crocodilus. Journal of Comparative Physiology 149:43-47.
178
Taplin, L. E., and J. P. Loveridge. 1988. Nile crocodiles, Crocodylus niloticus, and estuarine crocodiles, Crocodylus porosus, show similar osmoregulatory responses on exposure to seawater. Comparative Biochemistry and Physiology 89A:443-448.
Tarrio, R., F. Rodriguez-Trelles, and F. J. Ayala. 2000. Tree rooting with outgroups when they differ in their nucleotide composition from the ingroup: the Drosophila saltans and willistoni groups, a case study. Molecular Phylogenetics and Evolution 16:344-349.
Tchernov, E. 1986. Evolution of the crocodiles in East and North Africa. Editions du Centre national de la recherche scientifique, Paris, France.
Thang, N. Q. 1994. The status of Crocodylus rhombifer in the Socialist Republic of Vietnam. Pages 141-142 in Crocodiles; Proceedings of the 12th Working Meeting of the Crocodile Specialist Group, IUCN - World Conservation Union. IUCN, Gland, Switzerland.
Thompson, J. D., D. G. Higgins, and T. J. Gibson. 1994. CLUSTAL W: Improving the sensitivity of progressive multiple sequence alignment through sequence weighting, positions-specific gap penalties and weight matrix choice. Nucleic Acids Research 22:4673-4680.
Thorbjarnarson, J. B., and G. Hernández. 1993a. Reproductive ecology of the Orinoco crocodile (Crocodylus intermedius) in Venezuala. I. Nesting ecology and egg and clutch relationships. Journal of Herpetology 27:363-370.
Thorbjarnarson, J. B., and G. Hernández. 1993b. Reproductive ecology of the Orinoco crocodile (Crocodylus intermedius) in Venezuala. II. Reproductive and social behavior. Journal of Herpetology 27:371-379.
Thornton, J. W., and R. DeSalle. 2000. A new method to localize and test the significance of incongruence: detecting domain shuffling in the nuclear receptor superfamily. Systematic Biology 49:183-201.
Udvardy, M. D. F. 1975. A classification of the biogeographical provinces of the world. IUCN Occassional Paper no. 18 Morges, Switzerland.
Varona, L. 1986. Algunos datos sobre etologia de Crocodylus rhombifer (Reptilia, Crocodylidae). Poeyana 313:1-8.
Waitkuwait, W. E. 1985. Investigations of the breeding biology of the West-African slender-snouted crocodile Crocodylus cataphractus Cuvier, 1824. Amphibia-Reptilia 6:387-399.
Waitkuwait, W. E. 1989. Present knowledge on the West African slender-snouted crocodile, Crocodylus cataphractus Cuvier 1824 and the West African dwarf crocodile, Osteolaemus tetraspis, Cope 1861. Pages 259-275 in Crocodiles: Their Ecology, Management, and Conservation. A Special Publication of the IUCN/SSC Crocodile Specialist Group IUCN, Gland, Switzerland.
179
Wallace, A., R. 1860. On the zoological geography of the Malay archipelago. Journal of the Linnean Society, London 4:172-184.
Wallace, A. R. 1876. The Geographic Distribution of Animals. Macmillan, London.
Waltari, E., and S. V. Edwards. 2002. Evolutionary dynamics of intron size, genome size, and physiological correlates in archosaurs. The American Naturalist 160:539-552.
Weakliem, D. L. 1999. A critique of the Bayesian information criterion for model selection. Sociological Methods & Research 27:359-397.
Webb, G. J. W., R. Buckworth, and S. C. Manolis. 1983. Crocodylus johnstoni in the McKinlay River, N.T. VI.* Nesting biology. Australian Wildlife Research 10:607-637.
Webb, G. J. W., P. J. Whitehead, and S. C. Manolis. 1987. Crocodile management in the Northern Territory of Australia. Pages 107-124 in Wlidlife Management: Crocodiles and Alligators (G. J. W. Webb, S. C. Manolis, and P. J. Whitehead, eds.). Surrey Beatty & Sons Pty Ltd, Chipping Norton, Australia.
Wermuth, H. 1953. Systematik der Rezenten Krokodile. Mitteil. Zoolog. Mus. Berlin 29:375-514.
Wermuth, H., and K. Fuchs. 1978. Bestimmen von Krokodilen and ihrer Haute. Gustav Fischer-Verlag, New York, New York, USA.
Wermuth, H., and R. Mertens. 1961. Schildkroten, Krokodile, Bruckenechsen. Gustav Fischer-Verlag, Jena, West Germany.
Whitaker, R., and Z. Whitaker. 1984. Reproductive biology of the mugger (Crocodylus palustris). The Journal of the Bombay Natural History Society 81:297-316.
White, P. S. 1992. Relationships of extant Crocodylia as inferred by sequence analysis of mitochondrial DNAin PhD Dissertation Texas Tech University, Lubbock, Texas.
White, P. S., and L. D. Densmore. 2000. DNA sequence alignment and data analysis methods: their effect on the recovery of crocodylian relationships. Pages 29-37 in Crocodilian Biology and Evolution (G. C. Grigg, F. S. Seebacher, and C. E. Franklin, eds.). Surrey Beatty and Sons, Chipping Norton, New South Wales, Australia.
Wilgenbusch, J., and K. de Queiroz. 2000. Phylogenetic relationships among the phrynosomatid sand lizards inferred from mitochondrial DNA sequences generated by heterogeneous evolutionary processes. Systematic Biology 49:592-612.
Wilgenbusch, J. C., D. L. Warren, and D. L. Swofford. 2004. AWTY: A system for graphical exploration of MCMC convergence in Bayesian phylogenetic inference. http://ceb.csit.fsu.edu/awty.
180
Wilkerson, R. C., P. G. Foster, C. Li, and M. A. M. Sallum. 2005. Molecular Phylogeny of Neotropical Anopheles (Nyssorhynchus) albitarsis Species Complex (Diptera: Culicidae). Annals of the Entomological Society of America 98:918-925.
Willis, P. M. A. 1997. Review of fossil crocodilians from Australasia. Aust. Zool. 30:287-298.
Willis, R. E., L. R. McAliley, E. D. Neely, and L. D. Densmore. 2007. Evidence for placing the false gharial (Tomistoma schlegelii) into the family Gavialidae: Inferences from nuclear gene sequences. Molecular Phylogenetics and Evolution 43:787-794.
Yang, Z. 1996. Maximum likelihood models for combined analyses of multiple sequence data. Journal of Molecular Evolution 42.
Youngprapakorn, U., E. W. Cronin, and J. A. McNeely. 1971. Captive breeding of crocodiles in Thailand. Pages 98-101 in Crocodiles. Proceedings of the 1st Working Meeting of the IUCN/SSC Crocodile Specialist Group, New York International Union for Conservation of Nature and Natural Resources, Morges, Switzerland.
Zug, G. R., L. J. Vitt, and J. P. Caldwell. 2001. Herpetology: An Introductory Biology of Amphibians and Reptiles, 2nd edition. Academic Press, San Diego, California, USA.
Zwickl, D. J. 2006. Genetic algorithm approaches for the phylogenetic analysis of large biological sequence datasets under the maximum likelihood criterion. Ph.D. dissertation, University of Texas at Austin.
181
APPENDIX
TABLE A.1. List of all the tissue samples used in this study. Species Tissue Number Locality Tissue Type Collector or
Preparator Alligator mississippiensis A.m. # 1 (LSUMZ) USA: Louisiana; Rockefeller NWR Frozen blood Ty Bryan Alligator sinensis LSUMZ H-7868 Captive Frozen blood M. Brown KV 077 Captive Blood in lysis buffer K. Vliet KV 081 Captive Blood in lysis buffer K. Vliet Caiman crocodilus LSUMZ H-13961 Brazil: Amazonas; Rio Ituxi at the Madeirera Scheffer,
8° 20' 47", 65° 42' 57.9" Frozen liver L. J. Vitt
LSUMZ H-13962 Brazil: Amazonas; Rio Ituxi at the Madeirera Scheffer, 8° 20' 47", 65° 42' 57.9"
Frozen liver L. J. Vitt
LSUMZ H-13964 Brazil: Amazonas; Rio Ituxi at the Madeirera Scheffer, 8° 20' 47", 65° 42' 57.9"
Frozen liver L. J. Vitt
KV 012 Captive Blood in lysis buffer K. Vliet KV 021 Captive Blood in lysis buffer K. Vliet Caiman latirostris KV 015 Captive Blood in lysis buffer K. Vliet KV 016 Captive Blood in lysis buffer K. Vliet Caiman yacare KV 070 Captive Blood in lysis buffer K. Vliet Melanosuchus niger KV 062 Captive Blood in lysis buffer K. Vliet KV 076 Captive Blood in lysis buffer K. Vliet KV 082 Captive Blood in lysis buffer K. Vliet Paleosuchus palpebrosus LSUMZ H-6997 Captive Frozen blood L. S. Densmore LSUMZ H-6998 Captive Frozen blood L. S. Densmore KV 101 Captive Blood in lysis buffer K. Vliet Paleosuchus trigonatus LSUMZ H-6420 Captive Frozen blood J. Behler LSUMZ H-7873 Captive Frozen blood H. C. Dessauer Gavialis gangeticus KV 069 Captive Blood in lysis buffer K. Vliet Tomistoma schlegelii KV 065 Captive Blood in lysis buffer K. Vliet KV 067 Captive Blood in lysis buffer K. Vliet KV 068 Captive Blood in lysis buffer K. Vliet Crocodylus acutus LSUMZ H-6760 Captive Frozen blood H. C. Dessauer LSUMZ H-6982 Captive Frozen blood L. S. Densmore
182
TABLE A.1. continued Species Tissue Number Locality Tissue Type Collector or
Preparator Crocodylus acutus cont. KV 001 Captive Blood in lysis buffer K. Vliet KV 009 Captive Blood in lysis buffer K. Vliet KV 014 Captive Blood in lysis buffer K. Vliet KV 039 Captive Blood in lysis buffer K. Vliet KV 040 Captive Blood in lysis buffer K. Vliet KV 060 Captive Blood in lysis buffer K. Vliet KV 083 Captive Blood in lysis buffer K. Vliet KV 121 Captive Blood in lysis buffer K. Vliet Crocodylus cataphractus LSUMZ H-6976 Captive Frozen blood L. S. Densmore KV 011 Captive Blood in lysis buffer K. Vliet KV 013 Captive Blood in lysis buffer K. Vliet KV 058 Captive Blood in lysis buffer K. Vliet Crocodylus intermedius LSUMZ H-20683* Captive Frozen dermis/muscle J. Boundy LSUMZ H-20684* Captive Frozen dermis/muscle J. Boundy LSUMZ H-20685* Captive Frozen dermis/muscle J. Boundy LSUMZ H-20686* Captive Frozen dermis/muscle J. Boundy KV 074 Captive Blood in lysis buffer K. Vliet Crocodylus johnstoni LSUMZ H-7070 Captive Frozen blood L. S. Densmore KV 036 Captive Blood in lysis buffer K. Vliet KV 072 Captive Blood in lysis buffer K. Vliet Crocodylus moreletii LSUMZ H-6903 Mexico Frozen blood H. C. Dessauer KV 038 Captive Blood in lysis buffer K. Vliet KV 086 Captive Blood in lysis buffer K. Vliet Crocodylus niloticus KV 044 Captive Blood in lysis buffer K. Vliet KV 050 Captive Blood in lysis buffer K. Vliet KV 051 Captive Blood in lysis buffer K. Vliet KV 052 Captive Blood in lysis buffer K. Vliet KV 053 Captive Blood in lysis buffer K. Vliet KV 054 Captive Blood in lysis buffer K. Vliet KV 059 Captive Blood in lysis buffer K. Vliet KV 085 Captive Blood in lysis buffer K. Vliet
183
TABLE A.1. continued Species Tissue Number Locality Tissue Type Collector or
Preparator Crocodylus mindorensis P 214 (LSUMZ) Philippines: Maridagao Carmen North Cotabato Frozen blood F. Pontillas P 296 (LSUMZ) Philippines: Dalican Dinaig Maguindanao Frozen blood F. Pontillas P 349 (LSUMZ) Philippines: Davao Frozen blood F. Pontillas P 364 (LSUMZ) Philippines: Rio Grande Cotabato Maguindanao Frozen blood F. Pontillas P 524 (LSUMZ) Philippines: Busuanga Frozen blood F. Pontillas P 852 (LSUMZ) Philippines: Davao Frozen blood F. Pontillas P SU001 (LSUMZ) Philippines: Zamboanga Frozen blood F. Pontillas Crocodylus novaeguineae LSUMZ H-6995 Captive Frozen blood L. S. Densmore LSUMZ H-7071 Captive Frozen blood L. S. Densmore Crocodylus palustris KV 002 Captive Blood in lysis buffer K. Vliet KV 089 Captive Blood in lysis buffer K. Vliet Crocodylus porosus LSUMZ H-6758 Solomon Islands: Guadalcanal Province; Guadalcanal Frozen blood H. C. Dessauer LSUMZ H-6984 Captive Frozen blood L. S. Densmore Crocodylus rhombifer KV 061 Captive Blood in lysis buffer K. Vliet KV 071 Captive Blood in lysis buffer K. Vliet KV 087 Captive Blood in lysis buffer K. Vliet Crocodylus siamensis LSUMZ H-6978 Captive Frozen blood L. S. Densmore LSUMZ H-6985 Captive Frozen blood L. S. Densmore Osteolaemus tetraspis KV 045 Captive Blood in lysis buffer K. Vliet KV 046 Captive Blood in lysis buffer K. Vliet LSUMZ H-6990 Captive Frozen blood L. S. Densmore LSUMZ H-6992 Captive Frozen blood L. S. Densmore *Vouchered specimens.
184
VITA
Jamie was born the last of six progeny to William and Susan Oaks in Oshkosh,
Wisconsin, where he spent the first 23 years of his life. Soon after mastering bipedal
ambulation, he started collecting his first herpetological specimens; tadpoles, frogs, toads, turtles,
and snakes were all fair game, and captured Jamie’s curiosity, enthusiasm, and admiration.
Jamie, with the help of his Father and older brother, Bill, quickly learned the locations of garter
snake hibernacula around the Fox Valley, and when their inhabitants emerged in the spring.
Jamie was rarely captured in photographs of family reunions at Crystal River, because he was
predisposed catching snapping turtles along the river’s banks. Fortunately, his parents and
siblings were amateur naturalists, and actively fostered Jamie’s early propensity for herpetology.
After graduating from Oshkosh West High School, Jamie matriculated across the Fox
River to the University of Wisconsin Oshkosh. During his freshman year, Jamie was introduced
to science and academia by his zoology professor, Dr. Scott Snyder. In collaboration with Dr.
Snyder, he obtained a research grant to conduct a survey of turtles and their helminth parasites
around the Fox Valley. During his sophomore year, Jamie collaborated with Dr. Colleen
McDermott on an immunological and morphological study of the American alligator. Jamie
spent his last two undergraduate years as a Leslie-Allen Ecology and Evolutionary Biology
Fellow in the laboratory of Dr. Gregory Adler, where he developed a penchant interest in the
nexus between ecology and evolutionary biology. During this time, Jamie also met his future
wife, Elizabeth Woodworth.
After receiving his Bachelor of Science degree from the University of Wisconsin
Oshkosh, Jamie enrolled in the Biological Sciences graduate program at Louisiana State
University, where he conducted research in the Museum of Natural Science. While at LSU,
185
Jamie was well educated in evolutionary biology thanks to the teachings of Mohamed Noor,
Michael Hellberg, Frederick Sheldon, and Robb Brumfield. Upon completion of his Master of
Science Degree in Biological Sciences from Louisiana State University, Jamie will begin his
doctoral research at the University of Kansas Department of Ecology and Evolutionary Biology
and Museum of Natural History and Biodiversity Research Center, in the laboratory of Rafe