PRIMARY RESEARCH PAPER Physical and chemical limnology of alpine lakes and pools in the Rwenzori Mountains (Uganda–DR Congo) Hilde Eggermont James M. Russell Georg Schettler Kay Van Damme Ilse Bessems Dirk Verschuren Received: 14 November 2006 / Revised: 29 March 2007 / Accepted: 18 April 2007 / Published online: 18 July 2007 ȑ Springer Science+Business Media B.V. 2007 Abstract This study describes the physical and chemical properties of 17 Afroalpine lakes (>2 m deep) and 11 pools (<2 m deep) in the Rwenzori mountains, Uganda-DR Congo, with the aim to establish the baseline conditions against which to evaluate future environmental and biological changes in these unique tropical ecosystems, and to provide the foundation for lake-based paleoenvironmental studies. Most Rwenzori lakes are located above 3,500 m elevation, and dilute (5–52 lS/cm specific conductance at 25ŶC) open systems with surface in- and outflow. Multivariate ordination and pairwise correlations between environmental variables mainly differ- entiate between (1) lakes located near or above 4,000 m (3,890–4,487 m), with at least some direct input of glacial meltwater and surrounded by rocky catchments or alpine vegetation; and (2) lakes located mostly below 4,000 m (2,990– 4,054 m), remote from glaciers and surrounded by Ericaceous vegetation and/or bogs. The former group are mildly acidic to neutral clear- water lakes (surface pH: 5.80–7.82; Secchi depth: 120–280 cm) with often above-average dissolved ion concentrations (18–52 lS/cm). These lakes are (ultra-) oligotrophic to mesotrophic (TP: 3.1– 12.4 lg/l; Chl-a: 0.3–10.9 lg/l) and phosphorus- limited (mass TN/TP: 22.9–81.4). The latter group are mildly to strongly acidic (pH: 4.30– 6.69) waters stained by dissolved organic carbon (DOC: 6.8–13.6 mg/l) and more modest trans- parency (Secchi-disk depth: 60–132 cm). Ratios of particulate carbon, particulate nitrogen and chlorophyll a in these lakes indicate that organic matter in suspension is primarily derived from the lakes’ catchments rather than aquatic pri- mary productivity. Since key features in the Rwenzori lakes’ abiotic environment are strongly tied to temperature and catchment hydrology, these Afroalpine lake ecosystems can be expected to respond sensitively to climate change and glacier melting. Handling editor: S. Declerck Electronic supplementary material The online version of this article (doi: 10.1007/s10750-007-0741-3) contains supplementary material, which is available to authorized users. H. Eggermont (&) Á K. Van Damme Á I. Bessems Á D. Verschuren Limnology Unit, Department of Biology, Ghent University, K. L. Ledeganckstraat 35, 9000 Gent, Belgium e-mail: [email protected]J. M. Russell Department of Geological Sciences, Brown University, BOX 1846, Providence, RI 02912, USA G. Schettler Section Climate Dynamics and Sediments, GeoForschungsZentrum Potsdam, Telegrafenberg C328, Potsdam 14473, Germany 123 Hydrobiologia (2007) 592:151–173 DOI 10.1007/s10750-007-0741-3
Transcript
PRIMARY RESEARCH PAPER
Physical and chemical limnology of alpine lakes and poolsin the Rwenzori Mountains (Uganda–DR Congo)
Hilde Eggermont Æ James M. Russell ÆGeorg Schettler Æ Kay Van Damme ÆIlse Bessems Æ Dirk Verschuren
Received: 14 November 2006 / Revised: 29 March 2007 / Accepted: 18 April 2007 / Published online: 18 July 2007� Springer Science+Business Media B.V. 2007
Abstract This study describes the physical and
chemical properties of 17 Afroalpine lakes (>2 m
deep) and 11 pools (<2 m deep) in the Rwenzori
mountains, Uganda-DR Congo, with the aim to
establish the baseline conditions against which to
evaluate future environmental and biological
changes in these unique tropical ecosystems,
and to provide the foundation for lake-based
paleoenvironmental studies. Most Rwenzori
lakes are located above 3,500 m elevation, and
dilute (5–52 lS/cm specific conductance at 25�C)
open systems with surface in- and outflow.
Multivariate ordination and pairwise correlations
between environmental variables mainly differ-
entiate between (1) lakes located near or above
4,000 m (3,890–4,487 m), with at least some
direct input of glacial meltwater and surrounded
by rocky catchments or alpine vegetation; and (2)
lakes located mostly below 4,000 m (2,990–
4,054 m), remote from glaciers and surrounded
by Ericaceous vegetation and/or bogs. The
former group are mildly acidic to neutral clear-
water lakes (surface pH: 5.80–7.82; Secchi depth:
120–280 cm) with often above-average dissolved
ion concentrations (18–52 lS/cm). These lakes
are (ultra-) oligotrophic to mesotrophic (TP: 3.1–
12.4 lg/l; Chl-a: 0.3–10.9 lg/l) and phosphorus-
limited (mass TN/TP: 22.9–81.4). The latter
group are mildly to strongly acidic (pH: 4.30–
6.69) waters stained by dissolved organic carbon
(DOC: 6.8–13.6 mg/l) and more modest trans-
parency (Secchi-disk depth: 60–132 cm). Ratios
of particulate carbon, particulate nitrogen and
chlorophyll a in these lakes indicate that organic
matter in suspension is primarily derived from
the lakes’ catchments rather than aquatic pri-
mary productivity. Since key features in the
Rwenzori lakes’ abiotic environment are strongly
tied to temperature and catchment hydrology,
these Afroalpine lake ecosystems can be
expected to respond sensitively to climate change
and glacier melting.
Handling editor: S. Declerck
Electronic supplementary material The online version ofthis article (doi: 10.1007/s10750-007-0741-3) containssupplementary material, which is available to authorizedusers.
H. Eggermont (&) � K. Van Damme �I. Bessems � D. VerschurenLimnology Unit, Department of Biology, GhentUniversity, K. L. Ledeganckstraat 35, 9000 Gent,Belgiume-mail: [email protected]
J. M. RussellDepartment of Geological Sciences, BrownUniversity, BOX 1846, Providence, RI 02912, USA
G. SchettlerSection Climate Dynamics and Sediments,GeoForschungsZentrum Potsdam, TelegrafenbergC328, Potsdam 14473, Germany
123
Hydrobiologia (2007) 592:151–173
DOI 10.1007/s10750-007-0741-3
Keywords Alpine lakes � Afro-alpine zone �Climate change � East African mountains �Limnology � Pools � Rwenzori � Water chemistry
Introduction
The Rwenzori Mountains, the legendary ‘Moun-
tains of the Moon’, straddle the equator along the
border between Uganda and the Democratic
Republic of Congo. Though surpassed in height
by both Kilimanjaro (5,996 m) and Mt. Kenya
(5,199 m), the high-mountain range as a whole is
more extensive than either of these (Osmaston,
1989). Unlike the other mountains in equatorial
East Africa, the Rwenzoris are not an extinct
volcano, but comprise an uplifted complex of
Precambrian rock (Ebinger, 1989). This complex
has subsequently been dissected by erosion,
resulting in six separate mountains all rising over
4,500 m: Mts. Stanley (5,109 m), Speke (4,889 m),
Baker (4,842 m), Gessi (4,715 m), Emin
(4,791 m) and Luigi di Savoia (4,626 m). Each
of these consists of several peaks, the highest
being Margharita on Mt. Stanley. All mountains
were glaciated until historic times, but ice caps on
Mts. Gessi, Emin and Luigi di Savoia have now
completely disappeared. The Rwenzoris are dot-
ted with numerous lakes mainly occupying gla-
cially-excavated and moraine-dammed basins
formed after the last glacial period (Osmaston,
1989; Osmaston & Kaser, 2001). Streams
descending from the eastern slopes of the moun-
tain range are generally small (Busulwa & Bailey,
2004), yet their sheer number discharges a large
volume of water to the economically important
Lakes Edward and George, and constitute the
most important headwaters of the White Nile
River north of Lake Victoria (Yeoman, 1989). As
in other tropical high-mountain regions, the
glaciers themselves are also important freshwater
reservoirs that store precipitation during the wet
season and release meltwaters during dry periods,
thus buffering seasonal stream flow (Bradley
et al., 2006). The Rwenzori therefore comprise a
vital water catchment, upon which an estimated
500,000 Ugandans directly depend for their water
supply (Howard, 1991). In addition, the mountain
range holds an outstanding diversity of biota, with
many species endemic to the Albertine Rift
region (Kingdom, 1989). Recognising this impor-
tance, the Rwenzori were gazetted as a UNESCO
World Heritage site in 1994.
Climate change and the associated retreat of
Rwenzori’s glaciers may constitute an immediate
threat to its mountain ecosystems. Observations
of glacial termini confirm rapid glacial regression
from 1906 to present. The retreat is consistent
with warming of the tropical middle troposphere
in recent decades (Hastenrath & Kruss, 1992;
Gaffen et al., 2000; Taylor et al., 2006), though a
longer-term decrease in precipitation and in-
creased air humidity may also have affected
glacier mass balance (Hastenrath, 2001; Kaser
et al., 2004). At the current pace, all remaining
glaciers will disappear within the next two
decades (Kaser & Osmaston, 2002; Taylor et al.,
2006). This in turn will directly affect hydrological
processes and biology in the mountain lakes
immediately downstream from these glaciers
(e.g., Hauer et al., 1997; Koinig et al., 2002).
Other factors that may increasingly affect these
alpine lakes are the long-range atmospheric
deposition of toxic pollutants, acids (e.g., Psenner
& Schmidt, 1992; Mosello et al., 2001; Rogora
et al., 2001) and dust (e.g., Psenner, 1999). Hence,
establishing baseline data for the now still rela-
tively pristine Rwenzori lakes will be critical to
our understanding of the ecological and biodiver-
sity effects of future climate and environmental
changes in the region.
Previous scientific expeditions to the Rwenzori,
primarily conducted during the early 20th century,
focused almost exclusively on terrestrial biodiver-
material were folded in half, placed in plastic Petri
dishes and wrapped in aluminium foil. All water
samples were kept dark and cool (filters were
stored frozen) during the field campaign and until
their shipment to the laboratory.
Cations, Si, PO4-P and TS were analysed by
Inductively Coupled Plasma Atom Emission
Spectrometry (ICP-AES; IRIS, Thermo Elemen-
tal). F, Cl, NO3 and SO4 were analysed by ion-
exchange chromatography (DX100, Dionex). The
highly dilute nature of the studied waters (5–
52 lS/cm specific conductance at 25�C) resulted
in measured values for several chemical species
(K, Na, PO4-P, F, Cl, SO4, NO3) that are close to
or below the detection limit of the analytical
methods employed. Risk of contamination was
minimized by repeated pre-flushing of membrane
filters and autosampler vials with the individual
waters. We also took account of the non-linearity
of IC calibration curves by increasing the density
of calibration points in the low-concentration
range. Summation of all the measured ion con-
centrations yielded a systematic excess of calcu-
lated conductivity relative to conductivity
measured in the field. We tentatively attribute
this to the leaching of cations from microscopic
(<0.45 lm) organic particles remaining in the
filtered water samples, after field addition of nitric
acid. However, no systematic variation in cation
excess occurs in relation to the time elapsed
between sample collection and analysis.
DIC and DOC (excluding volatile organic
carbon components, i.e. the Non-Purgeable
Organic Carbon or NPOC) were measured by
IR-spectrometry (TOC-2000A, Shimadzu). The
NPOC measurement protocol included acidificat-
ion of the sample by addition of hydrochloric acid,
sparging of the sample with high purity air, and
catalytic burning of the sample aliquots at 680�C.
DIC and field pH data were combined to calculate
the in situ HCO3, CO3 and CO2 concentrations,
following Wetzel & Likens (1990). TP was deter-
mined by wet oxidation in an acid persulphate
solution (120�C, 30 min), and TN (as nitrate plus
nitrite) by wet oxidation in an alkaline persul-
phate solution (120�C, 30 min), both following
Grasshoff et al. (1983). Chl-a was determined by
high-pressure liquid chromatography (HPLC),
following the protocol of Wright et al. (1991,
1997). POC and PON were measured by flash
combustion/thermal conductivity in a CE Instru-
ments NC2100 elemental analyzer. The reported
POC and PON values are means of duplicate
measurements, using subsamples of each filter.
Data screening and statistical analyses
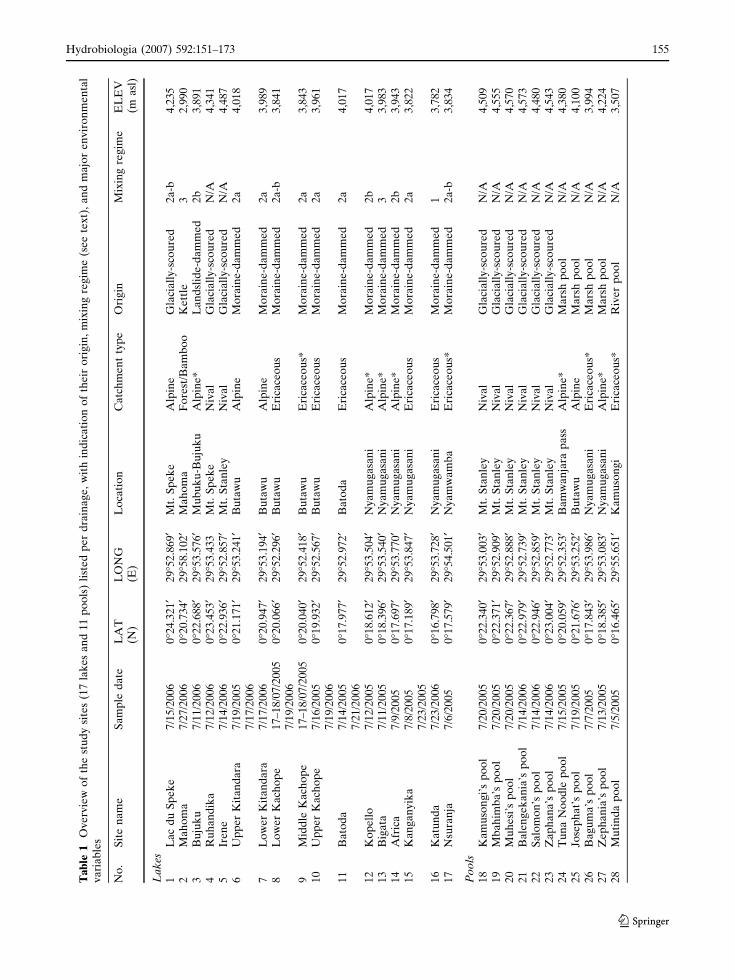
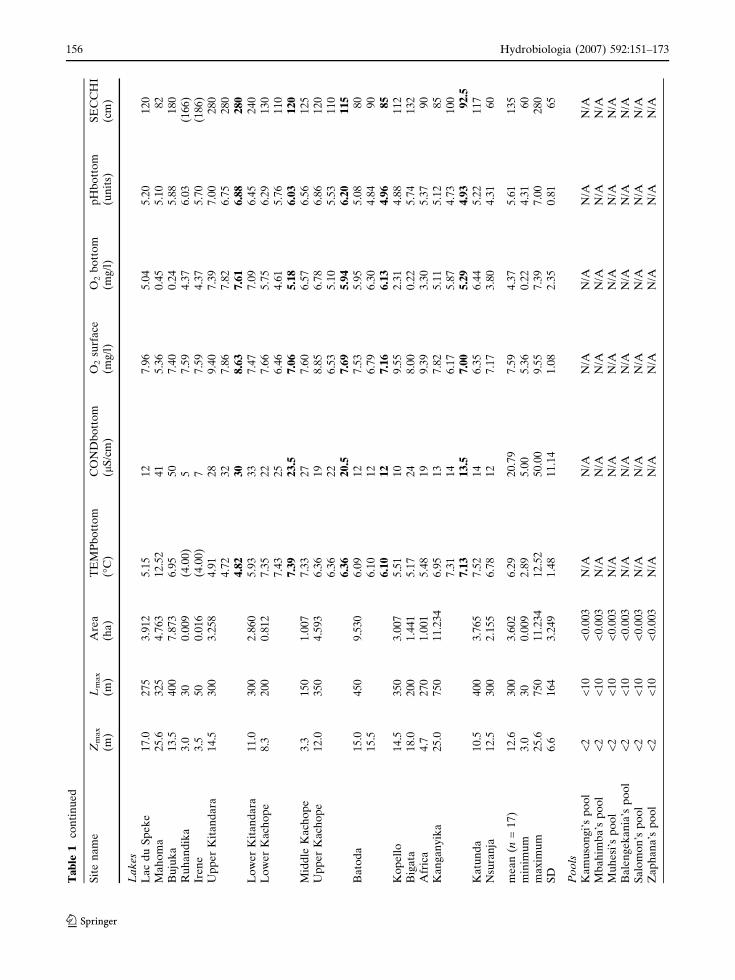
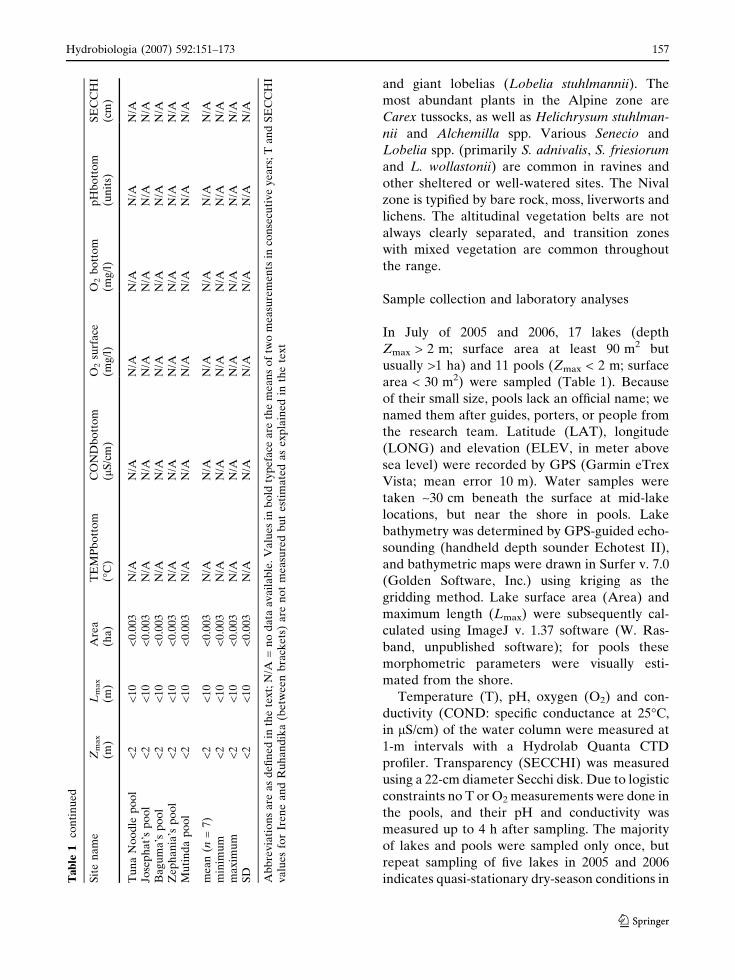
The substantial differences in size and depth
ranges of Rwenzori lakes and pools (Table 1)
justifies separate analysis of their thermal and
chemical regimes. This study focuses on the
comparative limnology of the true lakes, with
pools referred to only in passing. The initial data
set thus includes 17 sites and 39 environmental
variables (see Electronic supplementary mate-
rial). In lakes sampled twice, we use the average
values of the two measurement series. Four
variables were removed because their concentra-
tions were below detection limit at more than half
of the study sites (NO3, PO4-P, Li) or were
calculated as negligible (CO3, due to low pH).
The remaining variables were tested for normal-
ity using Shapiro–Wilk tests (Shapiro et al., 1968).
Eight variables were normalized using either log
(Tsurface, Tbottom, CONDsurface) or log
(x + 1) transformation (SO4, TS, TPU, H2CO3,
HCO3). Two variables (F and Mn) had to be
158 Hydrobiologia (2007) 592:151–173
123
excluded because their distribution could not be
normalized.
We calculated a Pearson correlation matrix to
quantify relationships between the 33 environ-
mental variables retained for multivariate analy-
sis. We then used principal components analysis
(PCA) to identify the principal environmental
gradients structuring the data set. Some variables
which are intrinsically strongly correlated with
others were excluded to avoid distortion of the
analysis due to redundancy. Specifically, Lmax was
removed in favour of lake Area. Surface-water
measurements of T, COND and pH were
removed in favour of the corresponding bottom
water measurements, because the latter reflect
long-term conditions while surface-water data are
more subject to daily (i.e. depending on the time
of day) and seasonal fluctuations (i.e. whether the
measurement occurred just before or after a
deep-mixing event). Surface and bottom water
measurements of oxygen, on the other hand, were
both kept in because lack of correlation between
the two suggests that site-specific basin morphom-
etry or primary production affects local bottom
oxygen regimes. Missing Tsurface and SECCHI
data for Lakes Irene and Ruhandika were esti-
mated using the significant regressions between
Tsurface and ELEV and between SECCHI and
DOC at the other 15 sites. The Tbottom for these
two lakes was set at 4�C, because (1) the
regression between Tbottom and ELEV in the
other lakes indicated that their Tbottom is
unlikely to be significantly higher than 4�C; and
(2) estimated Tsurface suggests at least daytime
warming of their water surface.
For PCA analysis we further added a set of
categorical variables representing the dominant
vegetation type in each lake catchment, namely:
bare rocks (Nival), alpine vegetation (Alpine),
alpine vegetation dominated by Carex swamp
(Alpine*), Ericaceous vegetation (Ericaceous),
Ericaceous vegetation dominated by Carex
swamp (Ericaceous*), and a mix of montane
and bamboo forest (Forest/Bamboo). The final
set of 35 variables was centred and standardized
to allow comparison of disparate variables (ter
Braak & Smilauer, 1998). We refrained from
testing the significance of the PCA ordination
axes since the theory that has been developed for
these tests suffers intrinsic methodological flaws
(ter Braak & Smilauer, 2002). Finally, we per-
formed redundancy analysis (RDA) to assess
whether selected external variables significantly
influenced the physical and chemical properties of
Rwenzori lakes. For this we used six predictor
variables (ELEV; Ericaceous; Erica-
ceous* + Alpine*, Alpine, Nival, and Forest/
Bamboo) and 26 response variables (the same
set as for the PCA, but excluding the predictor
variables and morphometric parameters), and
performed a series of RDAs constrained to one
single predictor at a time. Statistical testing of
every predictor variable was done with the
random permutation procedure of CANOCO
(reduced model, 999 permutations; ter Braak &
Smilauer, 2002) with manual variable selection.
Ternary graphs, correlation matrices and nor-
mality tests were generated using the software
package STATISTICA 5.5 (Statsoft, 2000). Multi-
variate statistics were performed using the package
CANOCO v. 4.5 (ter Braak & Smilauer, 2002).
Results
Multivariate statistical analysis
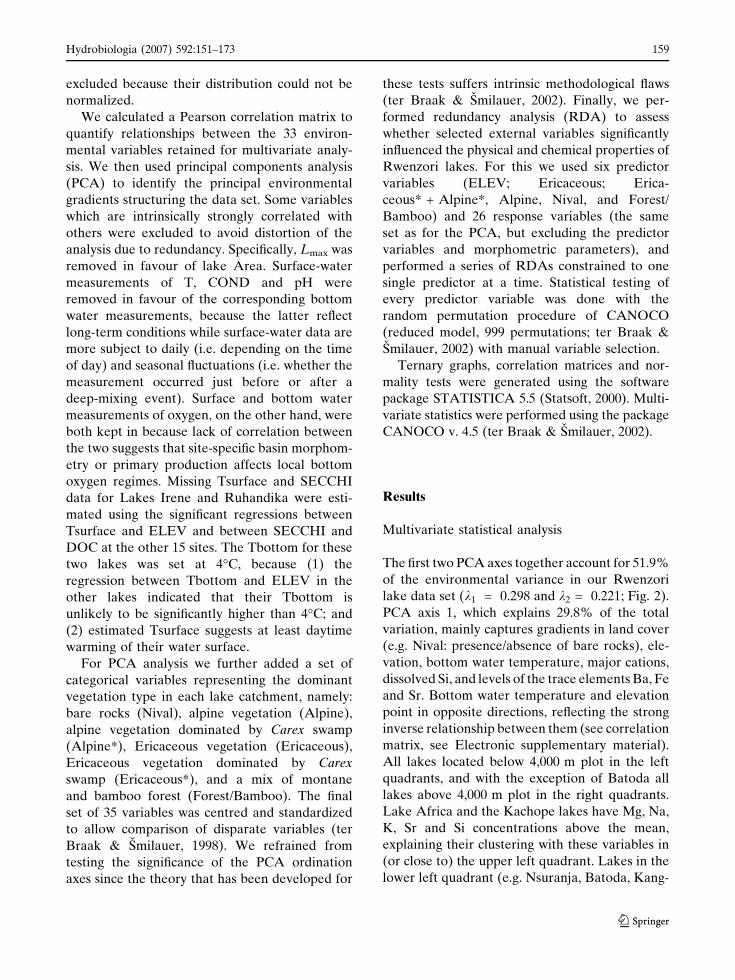
The first two PCA axes together account for 51.9%
of the environmental variance in our Rwenzori
lake data set (k1 = 0.298 and k2 = 0.221; Fig. 2).
PCA axis 1, which explains 29.8% of the total
variation, mainly captures gradients in land cover
(e.g. Nival: presence/absence of bare rocks), ele-
vation, bottom water temperature, major cations,
dissolved Si, and levels of the trace elements Ba, Fe
and Sr. Bottom water temperature and elevation
point in opposite directions, reflecting the strong
inverse relationship between them (see correlation
matrix, see Electronic supplementary material).
All lakes located below 4,000 m plot in the left
quadrants, and with the exception of Batoda all
lakes above 4,000 m plot in the right quadrants.
Lake Africa and the Kachope lakes have Mg, Na,
K, Sr and Si concentrations above the mean,
explaining their clustering with these variables in
(or close to) the upper left quadrant. Lakes in the
lower left quadrant (e.g. Nsuranja, Batoda, Kang-
Hydrobiologia (2007) 592:151–173 159
123
anyika) are typified by enhanced Ba and Fe
concentrations. PCA axis 2, which explains 22.1%
of the total variation, predominantly captures
gradients of Secchi depth, DOC, TN, TP, major
anions, and bottom pH. Here, Secchi depth and
DOC point in opposite directions, reflecting the
strong inverse relationship between them. As
reflected by the narrow angles between variables
pointing towards the lower left quadrant, less
transparant lakes (high DOC content) are more
acidic and hold more nutrients (high TP and TN);
they also tend to be larger and deeper than other
lakes. The opposite is true for lakes clustering in (or
close to) the upper right quadrant. As indicated by
the land-cover centroids, the former type of lakes
are predominantly surrounded by Forest/Bamboo,
Ericaceous vegetation and/or Carex swamp,
whereas the latter type are enclosed by bare rocks
or Alpine vegetation. Some lakes from the same
valley (drainage) but in different vegetation zones
plot in the same quadrant, e.g. Africa, Kanganyika
and Katoda.
RDA analysis indicates that elevation
(F = 3.400, P = 0.003) and Nival (i.e. presence/
absence of bare rocks; F = 3.915, P = 0.007), Alpine
(F = 2.297; P = 0.026) and Ericaceous* + Alpine*
vegetation (i.e. presence/absence of Carex swamps;
F = 2.376, P = 0.035) contribute significantly and
independently to explained variation in within-lake
environmental conditions: RDA axes 1 and 2
together explain 41.1% of the observed variance
(k1 = 0.277 and k2 = 0.134).
Lake morphometry and catchment
characteristics
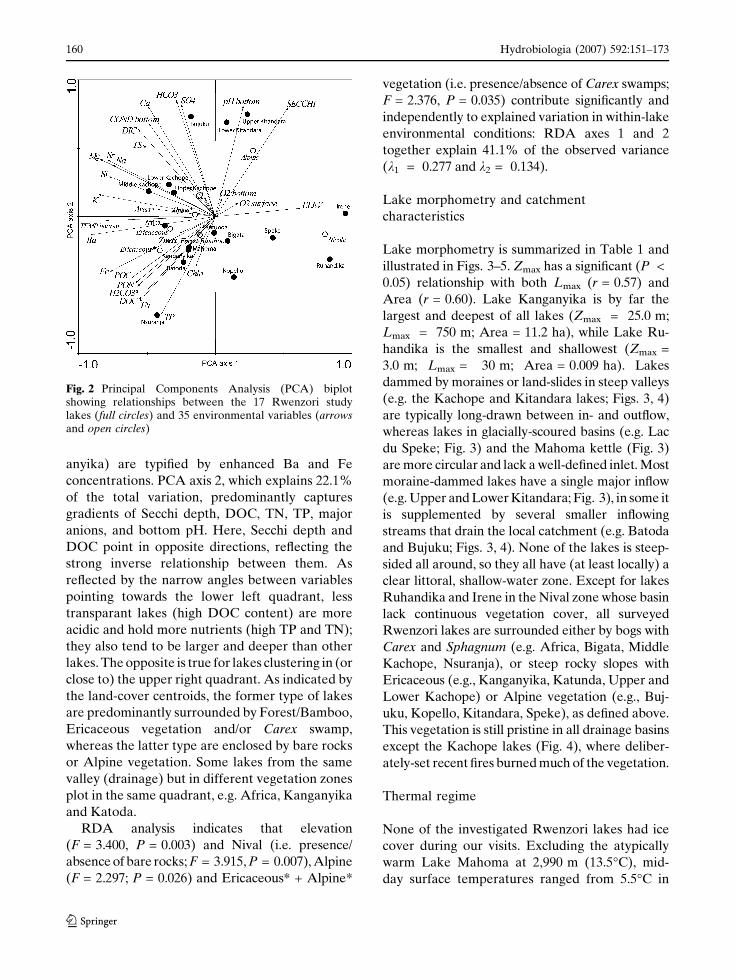
Lake morphometry is summarized in Table 1 and
illustrated in Figs. 3–5. Zmax has a significant (P <
0.05) relationship with both Lmax (r = 0.57) and
Area (r = 0.60). Lake Kanganyika is by far the
largest and deepest of all lakes (Zmax = 25.0 m;
Lmax = 750 m; Area = 11.2 ha), while Lake Ru-
handika is the smallest and shallowest (Zmax =
3.0 m; Lmax = 30 m; Area = 0.009 ha). Lakes
dammed by moraines or land-slides in steep valleys
(e.g. the Kachope and Kitandara lakes; Figs. 3, 4)
are typically long-drawn between in- and outflow,
whereas lakes in glacially-scoured basins (e.g. Lac
du Speke; Fig. 3) and the Mahoma kettle (Fig. 3)
are more circular and lack a well-defined inlet. Most
moraine-dammed lakes have a single major inflow
(e.g. Upper and Lower Kitandara; Fig. 3), in some it
is supplemented by several smaller inflowing
streams that drain the local catchment (e.g. Batoda
and Bujuku; Figs. 3, 4). None of the lakes is steep-
sided all around, so they all have (at least locally) a
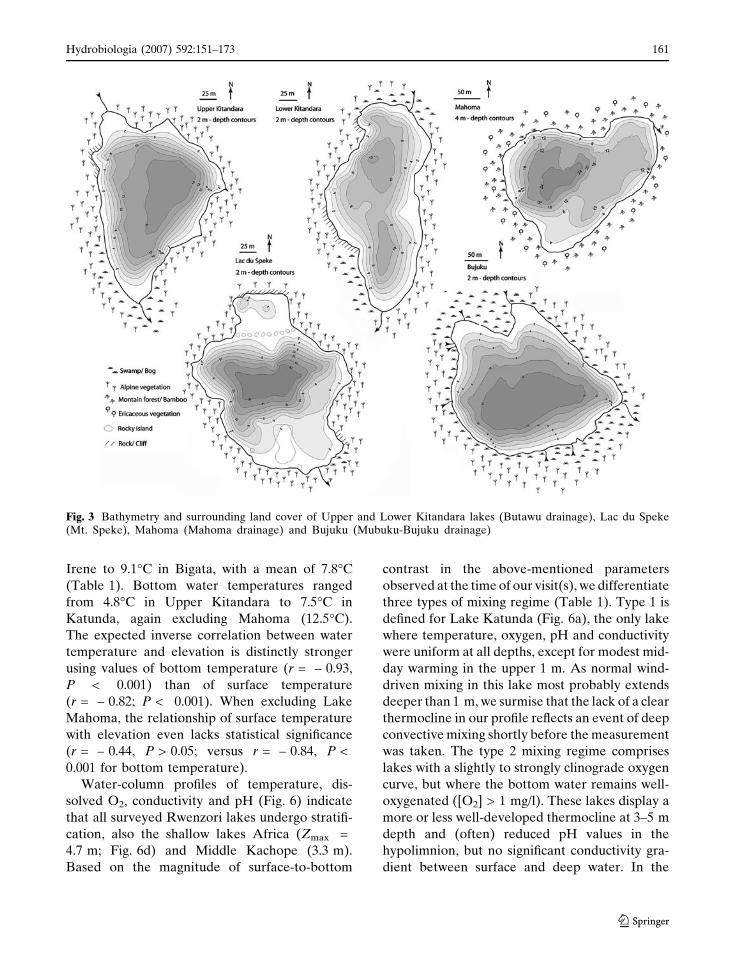
clear littoral, shallow-water zone. Except for lakes
Ruhandika and Irene in the Nival zone whose basin
lack continuous vegetation cover, all surveyed
Rwenzori lakes are surrounded either by bogs with
Carex and Sphagnum (e.g. Africa, Bigata, Middle
Kachope, Nsuranja), or steep rocky slopes with
Ericaceous (e.g., Kanganyika, Katunda, Upper and
Lower Kachope) or Alpine vegetation (e.g., Buj-
uku, Kopello, Kitandara, Speke), as defined above.
This vegetation is still pristine in all drainage basins
except the Kachope lakes (Fig. 4), where deliber-
ately-set recent fires burned much of the vegetation.
Thermal regime
None of the investigated Rwenzori lakes had ice
cover during our visits. Excluding the atypically
warm Lake Mahoma at 2,990 m (13.5�C), mid-
day surface temperatures ranged from 5.5�C in
Fig. 2 Principal Components Analysis (PCA) biplotshowing relationships between the 17 Rwenzori studylakes (full circles) and 35 environmental variables (arrowsand open circles)
160 Hydrobiologia (2007) 592:151–173
123
Irene to 9.1�C in Bigata, with a mean of 7.8�C
(Table 1). Bottom water temperatures ranged
from 4.8�C in Upper Kitandara to 7.5�C in
Katunda, again excluding Mahoma (12.5�C).
The expected inverse correlation between water
temperature and elevation is distinctly stronger
using values of bottom temperature (r = – 0.93,
P < 0.001) than of surface temperature
(r = – 0.82; P < 0.001). When excluding Lake
Mahoma, the relationship of surface temperature
with elevation even lacks statistical significance
(r = – 0.44, P > 0.05; versus r = – 0.84, P <
0.001 for bottom temperature).
Water-column profiles of temperature, dis-
solved O2, conductivity and pH (Fig. 6) indicate
that all surveyed Rwenzori lakes undergo stratifi-
cation, also the shallow lakes Africa (Zmax =
4.7 m; Fig. 6d) and Middle Kachope (3.3 m).
Based on the magnitude of surface-to-bottom
contrast in the above-mentioned parameters
observed at the time of our visit(s), we differentiate
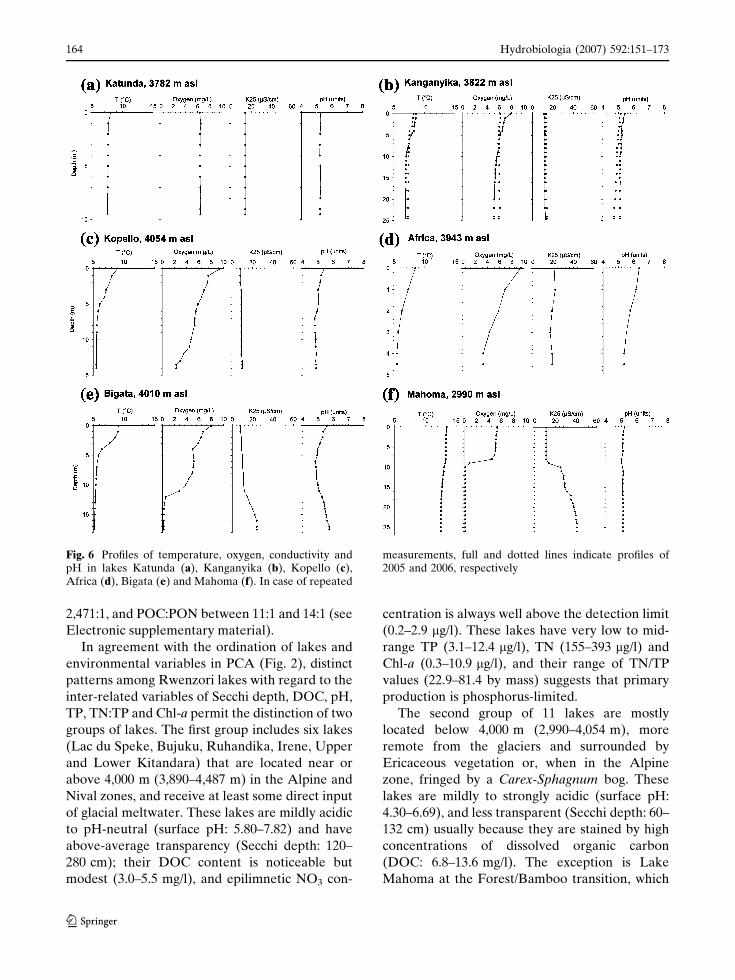
three types of mixing regime (Table 1). Type 1 is
defined for Lake Katunda (Fig. 6a), the only lake
where temperature, oxygen, pH and conductivity
were uniform at all depths, except for modest mid-
day warming in the upper 1 m. As normal wind-
driven mixing in this lake most probably extends
deeper than 1 m, we surmise that the lack of a clear
thermocline in our profile reflects an event of deep
convective mixing shortly before the measurement
was taken. The type 2 mixing regime comprises
lakes with a slightly to strongly clinograde oxygen
curve, but where the bottom water remains well-
oxygenated ([O2] > 1 mg/l). These lakes display a
more or less well-developed thermocline at 3–5 m
depth and (often) reduced pH values in the
hypolimnion, but no significant conductivity gra-
dient between surface and deep water. In the
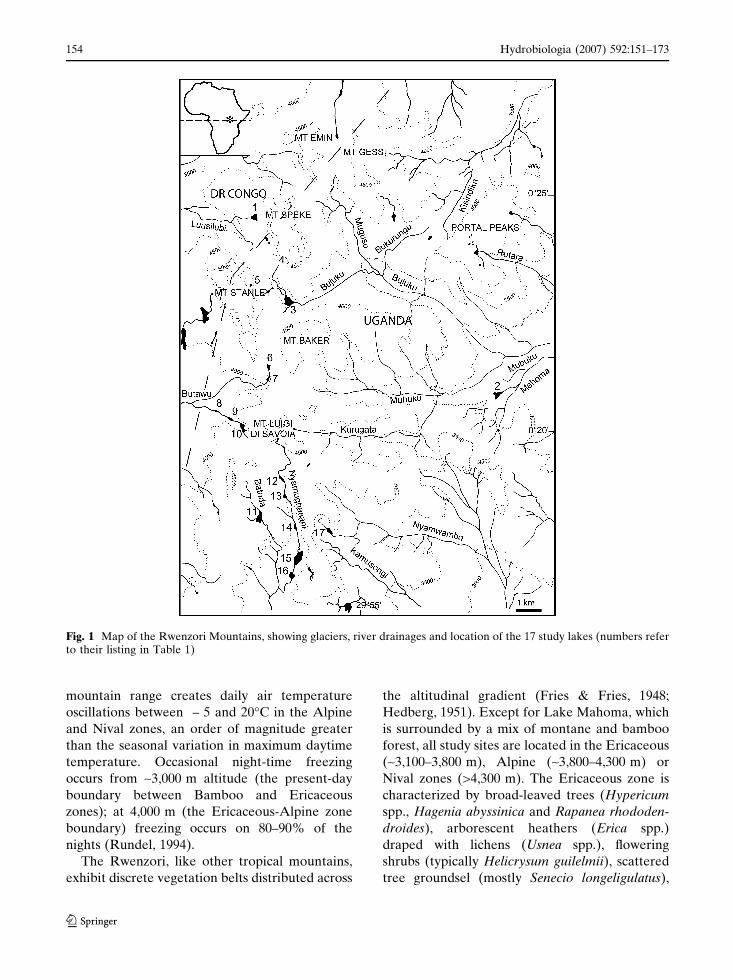
Fig. 3 Bathymetry and surrounding land cover of Upper and Lower Kitandara lakes (Butawu drainage), Lac du Speke(Mt. Speke), Mahoma (Mahoma drainage) and Bujuku (Mubuku-Bujuku drainage)
Hydrobiologia (2007) 592:151–173 161
123
context of benthic habitat conditions we further
differentiate between lakes with hypolimnetic O2
concentrations close to those at the surface (Type
2a; e.g., Kanganyika, Fig. 6b) and lakes where
hypolimnetic O2 has been markedly depleted
(Type 2b; e.g., Kopello and Africa, Fig. 6c, d).
Type 3 comprises lakes with a strongly clinograde
oxygen curve, and anoxic bottom waters with
significantly higher conductivity than surface
waters (Fig. 6e, d).
Transparency, water chemistry and primary
production
Secchi depth transparency in the 17 study lakes
ranged from 60 to 280 cm (Table 1), and DOC
ranged from 3 to 13.6 mg/l (see Electronic
supplementary material). F. Secchi depth was
significantly correlated with both DOC
(r = – 0.66; P < 0.01) and Fe (r = – 0.61; P <
0.05), which also co-vary among them (r = 0.79;
P < 0.001). Low-transparency lakes were either
tea-coloured (e.g. Nsuranja, Batoda, Africa,
Kanganyika) or green (Mahoma only).
Surface-water conductivity ranged from 5 to
52 lS/cm (mean 17.3 lS/cm) in the lakes, and
from 5 to 18 lS/cm (mean 9.6 lS/cm) in the pools
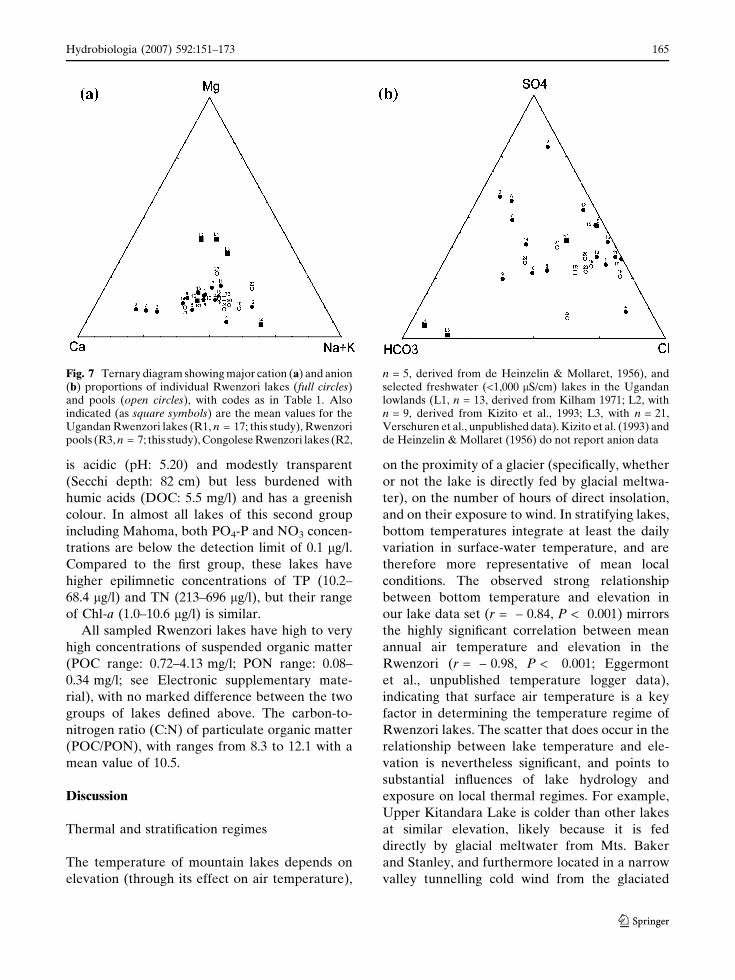
(Table 1). The principal cation concentration
sequence in the lakes is Ca > K > Na > Mg, with
means of 1.953, 0.511, 0.420 and 0.346 mg/l,
respectively (see Electronic supplementary mate-
rial for individual values). Pools display a similar
cation concentration pattern (Fig. 7a), with
means of 0.867, 0.548, 0.359 and 0.226 mg/l.
Anion concentration patterns exhibit consider-
ably less coherence (Fig. 7b), with the sequence
SO4 > HCO3 > Cl in lakes of the Bujuku and
Butawu drainages (means of 1.608, 0.672 and
0.414 mg/l, respectively) and SO4 > Cl > HCO3
in lakes on Mt. Speke, Mt. Stanley (including the
Fig. 4 Bathymetry and surrounding land cover of lakes Nsuranja (Nyamwamba drainage), Upper, Middle and LowerKachope (Butawu drainage), and Batoda (Batoda drainage)
162 Hydrobiologia (2007) 592:151–173
123
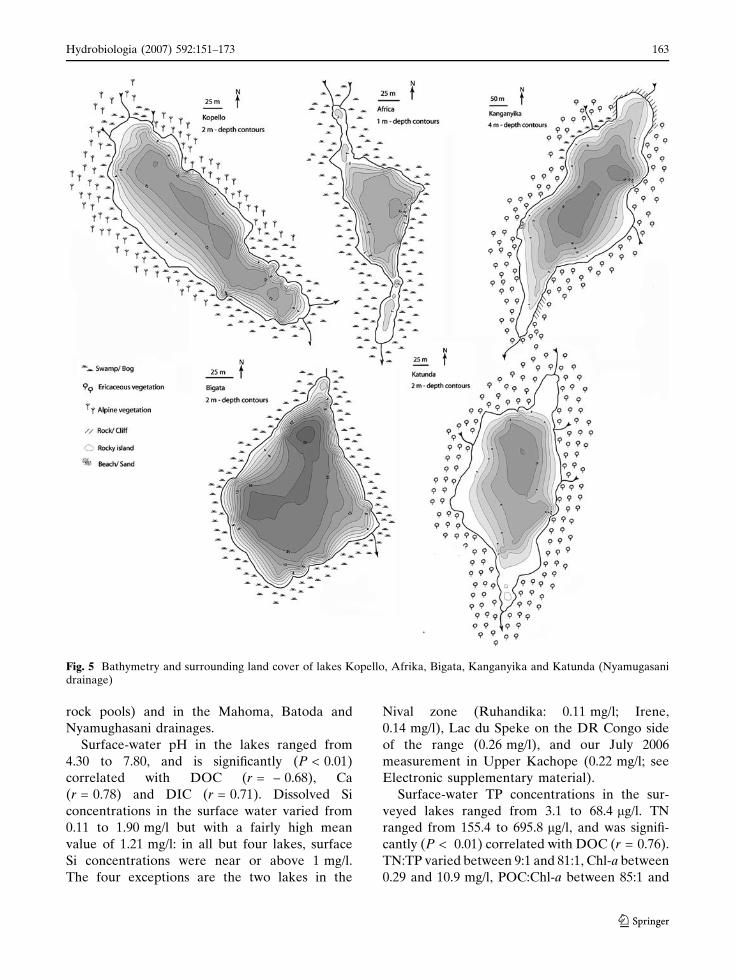
rock pools) and in the Mahoma, Batoda and
Nyamughasani drainages.
Surface-water pH in the lakes ranged from
4.30 to 7.80, and is significantly (P < 0.01)
correlated with DOC (r = – 0.68), Ca
(r = 0.78) and DIC (r = 0.71). Dissolved Si
concentrations in the surface water varied from
0.11 to 1.90 mg/l but with a fairly high mean
value of 1.21 mg/l: in all but four lakes, surface
Si concentrations were near or above 1 mg/l.
The four exceptions are the two lakes in the
Nival zone (Ruhandika: 0.11 mg/l; Irene,
0.14 mg/l), Lac du Speke on the DR Congo side
of the range (0.26 mg/l), and our July 2006
measurement in Upper Kachope (0.22 mg/l; see
Electronic supplementary material).
Surface-water TP concentrations in the sur-
veyed lakes ranged from 3.1 to 68.4 lg/l. TN
ranged from 155.4 to 695.8 lg/l, and was signifi-
cantly (P < 0.01) correlated with DOC (r = 0.76).
TN:TP varied between 9:1 and 81:1, Chl-a between
0.29 and 10.9 mg/l, POC:Chl-a between 85:1 and
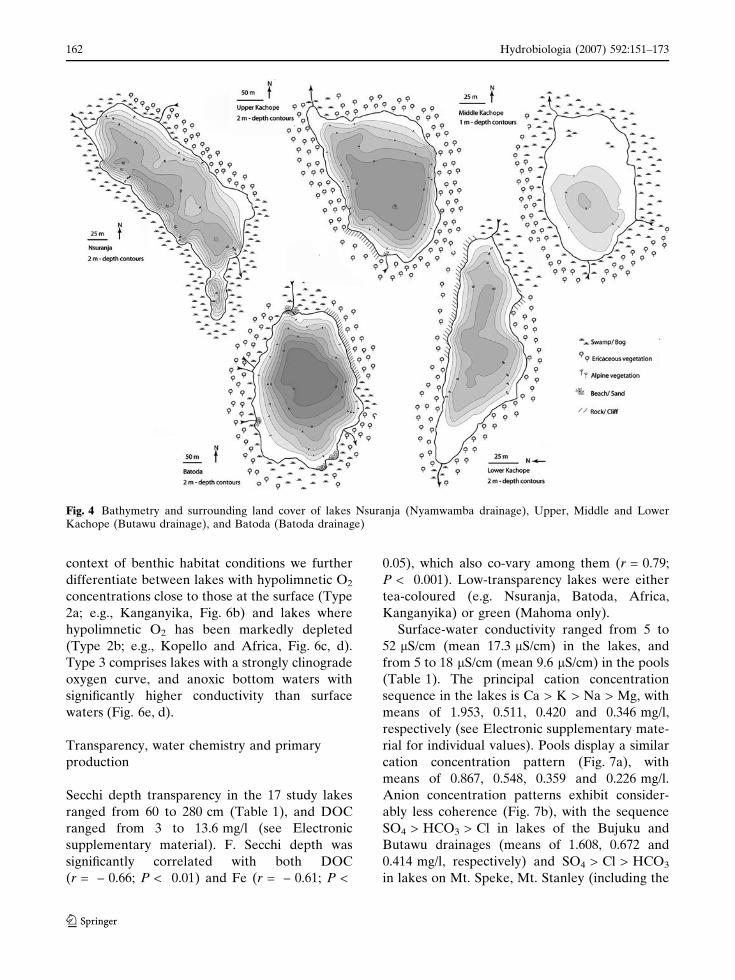
Fig. 5 Bathymetry and surrounding land cover of lakes Kopello, Afrika, Bigata, Kanganyika and Katunda (Nyamugasanidrainage)
Hydrobiologia (2007) 592:151–173 163
123
2,471:1, and POC:PON between 11:1 and 14:1 (see
Electronic supplementary material).
In agreement with the ordination of lakes and
environmental variables in PCA (Fig. 2), distinct
patterns among Rwenzori lakes with regard to the
inter-related variables of Secchi depth, DOC, pH,
TP, TN:TP and Chl-a permit the distinction of two
groups of lakes. The first group includes six lakes
(Lac du Speke, Bujuku, Ruhandika, Irene, Upper
and Lower Kitandara) that are located near or
above 4,000 m (3,890–4,487 m) in the Alpine and
Nival zones, and receive at least some direct input
of glacial meltwater. These lakes are mildly acidic
to pH-neutral (surface pH: 5.80–7.82) and have
above-average transparency (Secchi depth: 120–
280 cm); their DOC content is noticeable but
modest (3.0–5.5 mg/l), and epilimnetic NO3 con-
centration is always well above the detection limit
(0.2–2.9 lg/l). These lakes have very low to mid-
range TP (3.1–12.4 lg/l), TN (155–393 lg/l) and
Chl-a (0.3–10.9 lg/l), and their range of TN/TP
values (22.9–81.4 by mass) suggests that primary
production is phosphorus-limited.
The second group of 11 lakes are mostly
located below 4,000 m (2,990–4,054 m), more
remote from the glaciers and surrounded by
Ericaceous vegetation or, when in the Alpine
zone, fringed by a Carex-Sphagnum bog. These
lakes are mildly to strongly acidic (surface pH:
4.30–6.69), and less transparent (Secchi depth: 60–
132 cm) usually because they are stained by high
concentrations of dissolved organic carbon
(DOC: 6.8–13.6 mg/l). The exception is Lake
Mahoma at the Forest/Bamboo transition, which
Fig. 6 Profiles of temperature, oxygen, conductivity andpH in lakes Katunda (a), Kanganyika (b), Kopello (c),Africa (d), Bigata (e) and Mahoma (f). In case of repeated
measurements, full and dotted lines indicate profiles of2005 and 2006, respectively
164 Hydrobiologia (2007) 592:151–173
123
is acidic (pH: 5.20) and modestly transparent
(Secchi depth: 82 cm) but less burdened with
humic acids (DOC: 5.5 mg/l) and has a greenish
colour. In almost all lakes of this second group
including Mahoma, both PO4-P and NO3 concen-
trations are below the detection limit of 0.1 lg/l.
Compared to the first group, these lakes have
higher epilimnetic concentrations of TP (10.2–
68.4 lg/l) and TN (213–696 lg/l), but their range
of Chl-a (1.0–10.6 lg/l) is similar.
All sampled Rwenzori lakes have high to very
high concentrations of suspended organic matter
(POC range: 0.72–4.13 mg/l; PON range: 0.08–
0.34 mg/l; see Electronic supplementary mate-
rial), with no marked difference between the two
groups of lakes defined above. The carbon-to-
nitrogen ratio (C:N) of particulate organic matter
(POC/PON), with ranges from 8.3 to 12.1 with a
mean value of 10.5.
Discussion
Thermal and stratification regimes
The temperature of mountain lakes depends on
elevation (through its effect on air temperature),
on the proximity of a glacier (specifically, whether
or not the lake is directly fed by glacial meltwa-
ter), on the number of hours of direct insolation,
and on their exposure to wind. In stratifying lakes,
bottom temperatures integrate at least the daily
variation in surface-water temperature, and are
therefore more representative of mean local
conditions. The observed strong relationship
between bottom temperature and elevation in
our lake data set (r = – 0.84, P < 0.001) mirrors
the highly significant correlation between mean
annual air temperature and elevation in the
Rwenzori (r = – 0.98, P < 0.001; Eggermont
et al., unpublished temperature logger data),
indicating that surface air temperature is a key
factor in determining the temperature regime of
Rwenzori lakes. The scatter that does occur in the
relationship between lake temperature and ele-
vation is nevertheless significant, and points to
substantial influences of lake hydrology and
exposure on local thermal regimes. For example,
Upper Kitandara Lake is colder than other lakes
at similar elevation, likely because it is fed
directly by glacial meltwater from Mts. Baker
and Stanley, and furthermore located in a narrow
valley tunnelling cold wind from the glaciated
Fig. 7 Ternary diagram showing major cation (a) and anion(b) proportions of individual Rwenzori lakes (full circles)and pools (open circles), with codes as in Table 1. Alsoindicated (as square symbols) are the mean values for theUgandan Rwenzori lakes (R1, n = 17; this study), Rwenzoripools (R3, n = 7; this study), Congolese Rwenzori lakes (R2,
n = 5, derived from de Heinzelin & Mollaret, 1956), andselected freshwater (<1,000 lS/cm) lakes in the Ugandanlowlands (L1, n = 13, derived from Kilham 1971; L2, withn = 9, derived from Kizito et al., 1993; L3, with n = 21,Verschuren et al., unpublished data). Kizito et al. (1993) andde Heinzelin & Mollaret (1956) do not report anion data
Hydrobiologia (2007) 592:151–173 165
123
peaks. In other lakes, deep wind-driven mixing
during periods of incipient surface heating can
raise their bottom temperature above the value
predicted from its relationship with elevation.
Such lakes (e.g., Lower Kachope; Table 1) also
tend to feature modest surface warming and a
weakly pronounced thermocline. Latent heat
losses from the Rwenzori mountain lakes through
evaporation must be generally minimal, due to
the prevailing cool and humid conditions.
Hutchinson and Loffler (1956) and Loffler
(1957, 1960, 1964) described lakes of tropical
high-mountain regions in Africa and South
America as frequently (even daily) stratifying
and mixing at temperatures below 10�C, and
therefore designated all of them as ‘cold poly-
mictic’. Ruttner (1963) adopted their reasoning
when assigning this term to all lakes that are not
ice-covered and circulate daily at temperatures at
or slightly above 4�C. Lewis (1983) noted the
arbitrary nature of the 10�C boundary, and
presented an amended classification of mixing
regimes which resolved this and other problems
with the Hutchinson-Loffler scheme (Wetzel,
2001). In the Lewis (1983) classification, cold-
monomictic lakes stratify because surface tem-
perature drops well below 4�C (often resulting in
seasonal ice cover) and no longer mix with the
heavier, but warmer, bottom water. Depending
on wind stress during the ice-free season, such
lakes have bottom temperatures at or below 4�C
for much of the year. When such lakes also
stratify for short or longer periods during the ice-
free season by surface heating above 4�C, they are
designated as cold polymictic. The Lewis (1983)
classification is still somewhat unsatisfactory for
tropical high-mountain lakes, which can briefly
freeze over at night but during daytime are
usually ice-free year-round (Loffler 1964). In
terms of the ambient temperature regime for
aquatic flora and fauna, the most important
differentiation here is between mono- or poly-
mictic lakes that stratify due to surface heating
(and thus have hypolimnia of 4�C or higher) and
mono- or polymictic lakes that stratify due to
surface cooling (and thus have hypolimnia of 4�C
or cooler). In this respect, all 17 Rwenzori lakes
we surveyed so far are warm stratifying. Most
lakes in the Alpine Zone (Lac du Speke, Upper
Kitandara, Kopello, Bigata, Africa) have bottom
temperatures slightly above 4�C (range 4.8–
5.5�C). Lake Mahoma at 2,990 m has a bottom
temperature of 12.5�C, a clear reflection of the
higher mean annual air temperature at this lower
elevation. The intermediate bottom temperatures
of lakes in the Ericaceous zone (range 6.1–7.5�C;
n = 7) must at least partly also be due to the
influence of ambient air temperature, but can also
result because deep wind-driven mixing continues
into periods of incipient surface heating. Cold-
stratifying mountain lakes, although not repre-
sented in our data set, do occur in tropical Africa:
Lewis Tarn and Curley Pond on Mt. Kenya, and
Lac Gris and Lac Blanc on the drier DR Congo
side of the Rwenzori all have bottom tempera-
tures well below 4�C (data from Loffler (1964)
and de Heinzelin & Mollaret (1956).
Based on our current data set, lakes on the
Uganda side of the Rwenzori broadly classify into
three types of mixing regime. In Type 1 (Lake
Katunda, Fig. 6a), uniform temperature, oxygen,
pH and conductivity throughout the water column
except the very surface suggests that it undergoes
a continuous cycle of weak day-time stratification
and night-time mixing. Given the absence of
seasonal ice cover, this lake classifies as continu-
ous warm polymictic. Type 2 groups lakes char-
acterized by a more or less well-developed
primary thermocline at the depth of wind-driven
mixing (here 3–5 m depth), and modest to strong
oxygen depletion in the hypolimnion, however
without it becoming completely anoxic. This
suggests that these lakes stratify for at least
several weeks or months at a time, alternating
with periods of mixing when fresh oxygen is
supplied to the hypolimnion. These lakes classify
as discontinuous warm polymictic. Evidently, a
more productive Type 2 lake that mixes fre-
quently may better prevent hypolimnetic oxygen
depletion than a less productive lake mixing
rarely, consequently the magnitude of oxygen
depletion observed at any given moment (Fig. 6b,
d) is a poor guide to the frequency of mixing.
Some Type 2 lakes with either modest or strong
oxygen gradients may even circulate only once
each year, and hence classify as warm monomictic.
Accurate determination of mixing frequency in
individual Rwenzori lakes will require year-round
166 Hydrobiologia (2007) 592:151–173
123
water-column monitoring. At this time we differ-
entiate between Type 2a and Type 2b lakes
because the relative magnitude of oxygen deple-
tion has a significant influence on benthic habitat
quality, and thus potentially on benthic inverte-
brate species distribution. Finally, Type 3 lakes
(Bigata, Mahoma; Fig. 6e, f) are characterized by
a strongly clinograde oxygen curve and com-
pletely anoxic bottom waters with significantly
higher conductivity than surface waters. This
suggests that stratification persists throughout
the year, due to a chemical density difference
between bottom and surface waters. These two
lakes are meromictic, i.e. they lack at least one
complete circulation of the water column per
year. The cause of their chemical density gradient
is probably biological, i.e. a gradual accumulation
over many years of chemical substances resulting
from the decomposition of organic matter (Wet-
zel, 1983). In the case of Mahoma, at least, the
onset of meromixis sometime in the past may
have been promoted by wind shelter in its steep-
sided catchment.
Factors influencing transparency
The Secchi-depth transparency of the Rwenzori
lakes (0.60–2.80 m; mean 1.35 m) is on average
distinctly lower than that of 14 alpine lakes on
Mt. Kenya surveyed by Loffler (1968a), which
had a mean Secchi depth of 3.80 m (range 1.0–
10.0 m). Tight coupling between DOC and Fe,
and a significant inverse relationship between
Secchi depth with both DOC and Fe, in the
Rwenzori lakes indicates that high dissolved Fe
concentrations are stabilized by organic com-
plexing substances (humic acids), and that their
presence is the principal regional control on
water-column transparency. As evident from the
PCA, these three variables were all strongly tied
to the type of catchment vegetation. The least
transparent lakes (SECCHI <1.00 m: Nsuranja,
Africa, Batoda and Kanganyika) are all sur-
rounded by lush Ericaceous vegetation and/or
sizable bogs. The most transparent lakes (SEC-
CHI >1.80 m: Upper and Lower Kitandara,
Bujuku) are located in the Alpine zone near
glaciers, lack Carex bogs, and have low DOC
(<4 mg/l) and Fe (<0.1 mg/l) contents.
This differentiation between lakes with differ-
ent types of catchment vegetation also showed
from the RDA. The Nival and Alpine location of
lakes without bogs each contributes significantly
and independently to explained variation in the
lake data set, as do the combined group of Alpine
and Ericaceous locations with bogs. RDA group-
ings of all Ericaceous zone locations with and
without bogs, or all Alpine zone locations with
and without bogs, do not independently contrib-
ute to explained variation in the data set, pointing
to the decisive influence of the Carex-Sphagnum
bogs on the aquatic environment.
DOC is a key controlling factor in the under-
water penetration of solar ultraviolet radiation
(UV) (reviewed by Vincent & Pienitz, 1996; see
also Pienitz and Vincent, 2000). DOC more
strongly absorbs the biologically damaging UV-
A radiation (Scully & Lean, 1994), and is thus a
natural sunscreen for aquatic biota. Very likely,
lack of this UV protection in the more transpar-
ent Rwenzori lakes explains the presence of
Chydoridae with strongly pigmented carapaces
in some of them (Eggermont et al., in press; see
also Hansson, 2004; Tollrian & Heibl, 2004).
In glaciated mountain ranges elsewhere, low
lake-water transparency is often caused by high
loads of suspended inorganic solids in the glacial
meltwater passing through them. In comparison,
Rwenzori glaciers carry very little sediment on
their surface, and the streams flowing out from
beneath the glaciers are clear, not turbid as
typical meltwater streams (Busulwa & Bailey,
2004). Glacially-derived sediment input certainly
does affect some of the Rwenzori lakes (e.g.,
Bujuku with its well-developed delta and silty
shorelines), but overall a lake’s proximity to the
glaciers does not seem to exert a major influence
on water-column transparency.
Factors influencing water chemistry and pH
Rwenzori lake-waters are primarily derived from
surface runoff, and only secondarily from direct
rainfall and glacier melting. Hence, bedrock
composition can be expected to exert dominant
control on lake chemistry. In the adjacent
lowlands of western Uganda, most lakes occur
on volcanic bedrock (Melack, 1978), and receive
Hydrobiologia (2007) 592:151–173 167
123
high inputs of Na, Mg and K relative to Ca
(Fig. 7a). High weathering rates in the sub-humid
tropical climate there produce large amounts of
HCO3 (Fig. 7b), and evaporative concentration of
dissolved solids often leads to biologically
induced precipitation of carbonate, causing fur-
ther loss of Ca. Bedrock in the Rwenzori is more
variable. The highest peaks are composed of
volcanic amphibolite (Osmaston & Pasteur,
1972). Below it occur softer schists, and at lower
elevations the range is primarily composed of
weathered Precambrian gneiss. The somewhat
higher conductivity of lakes in the Bujuku and
Butawu river systems (18–52 lS/cm; n = 7) likely
reflect the weathering of amphibolite and schists
exposed on high peaks nearby. The alpine lakes in
this group (Bujuku, Upper and Lower Kitandara)
also have elevated SO4 concentrations. The lower
conductivity of lakes in the other river systems
(5–21 lS/cm; n = 8) reflects slow weathering of
the underlying gneiss. As expected, the lowest
conductivity values (5–8 lS/cm) occur in lakes
(Irene, Ruhandika) and pools in the Nival zone
that are surrounded by bare rock. Thus, factors
contributing to the extremely dilute character of
Rwenzori lake waters, besides slow-weathering
bedrock and low temperatures, are the steep
mountain slopes which allow percolating water to
pass quickly, and the near-continuous rainy
weather, which dilutes the scarce ions released
by weathering. Given the extremely low conduc-
tivity of most Rwenzori lakes, salts carried by rain
(Na, Cl and SO4) might have a noticeable
influence on their hydrochemistry. But in fact,
the average concentrations of conservative ions in
the lakes (see Electronic supplementary material)
are even lower than values reported for lowland
rainfall (Visser, 1961). This is likely due to the
great distance to the Indian Ocean, and efficient
rain-out of sea-spray salts before reaching Rwenz-
ori’s slopes.
The cation concentration sequence in Rwenzori
lakes and pools surveyed in this study (Ca > -
K > Na > Mg) is strongly biased toward products
of feldspar weathering, as in Congolese Rwenzori
lakes (de Heinzelin & Mollaret, 1956) but deviat-
ing from that in the lowland lakes of western
Uganda where Mg, Na and/or K concentrations
often surpass Ca. Also the anion pattern (the
SO4 > HCO3 > Cl and SO4 > Cl > HCO3 se-
quences occur in about equal proportion) deviate
from the HCO3 > Cl > SO4 sequence found in
most lowland Uganda lakes (Melack, 1978; Kil-
ham, 1971; Kizito et al., 1993; Verschuren et al.,
unpubl. data).
The acidity of many Rwenzori surface waters is
primarily due to the presence of humic substances
leached from organic top soil and the bogs (viz.
the significant inverse relationship between DOC
and pH). The circum-neutral pH of lakes in the
Bujuku and Butawu drainages (6.55–7.81; n = 7),
including DOC-stained lakes surrounded by lush
Ericaceous vegetation and/or Carex-Sphagnum
bogs (Bujuku, Middle Kachope), must primarily
derive from the buffering capacity of their catch-
ment’s rock geochemistry rather than CO2 uptake
by phytoplankton.
Nutrients and primary production
Surface-water TP concentrations in Rwenzori
lakes (3.1–68.4 lg/l) are high on average compared
to mountain lakes in Europe (2–7 lg/l; Psenner,
1989; Marchetto et al., 1994; Camarero et al., 1995;
Mosello et al. 1995; Skjelkvale & Wright, 1998;
Kopacek et al., 2000), North America (2.5–15 lg/l;
Schindler, 2000) and Asia (average 7.3 lg/l, Lacoul
& Freedman, 2005). Lakes in the Nyamughasani
and Nyamwamba valleys, in particular, contained
very high TP levels (>20 lg/l). However, since
PO4-P in all surveyed lakes was below detection
limit, and TP is positively correlated with DOC, it
follows that most of the measured TP must be
biologically unavailable phosphorus bound to
allochthonous organic matter. Lakes with a
POC:Chl-a ratio greater than 100:1 likely derive
most of their POC input from terrestrial or detrital
sources (Eppley et al., 1977). POC:Chl-a ratios in
the Rwenzori lakes (85–2,471; mean 625:1) are
decidedly extreme, again indicative that most
organic matter suspended in the water column is
produced from dead terrestrial vegetation rather
than the result of autochthonous production. This
conclusion is further supported by the carbon-to-
nitrogen ratio (C:N) of particulate organic matter
(POC/PON), with ranges from 8.3 to 12.1. Organic
matter produced by algae tends to have a C:N ratio
of 6–9, while vascular land plants produce organic
168 Hydrobiologia (2007) 592:151–173
123
matter with C:N ratios of 20 and greater (Meyers &
Teranes, 2001). Wetland soils, and Sphagnum-
dominated wetlands in particular, tend to have C:N
values of 9–17, i.e. lower than typical terrestrial
organic matter and only slightly above those of
lacustrine organic matter (Meyers & Teranes,
2001). The C:N values recorded here can be
interpreted to represent organic matter derived
primarily from the lakes’ catchments, particularly
wetlands soils. This is confirmed by both PCA
(Fig. 2) and RDA ordinations, which showed total
nutrient concentrations to be strongly linked to the
type of surrounding land cover, with the lowest
values recorded in lakes surrounded by bare rock
or alpine vegetation without bogs, and the highest
values recorded in lakes surrounded by Ericaceous
vegetation and/or bogs.
Lake productivity classifications on the basis of
epilimnetic TP, TN and Chl-a concentration (Fors-
berg & Ryding, 1980; Downing & McCauley, 1992)
identify the group of six high-alpine, transparent
Rwenzori lakes as ultra-oligotrophic (Irene) to
mesotrophic (Ruhandika) and phosphorus-limited
(TN/TP by mass: 23:1–81:1; PO4-P below detection
limit; NO3: 0.2–1.4 lg/l). In the humic, DOC-
stained lakes at lower elevation, autochthonous
primary production must be limited both by
phosphorus and light penetration. As both PO4-P
and NO3 in these lakes are below detection limit,
nitrogen limitation may also affect algal commu-
nity structure. However the very low TN:TP ratios
in some lakes (9:1 to 12:1 in Kopello, Africa and
Kanganyika) more likely results from the pre-
dominant contribution of dead, allochthonous
organic matter to total nutrient concentrations
(McNeely et al., 1979).
Summary and perspectives
In the context of ecological and biodiversity
research, aquatic habitat in mountain lakes on
the Ugandan side of the Rwenzori range is
structured along two major environmental
gradients. With regard to the limnetic habitat,
lakes differentiate between (1) slightly acidic to
pH-neutral, phosphorus-limited clear-water lakes
near or above 4,000 m elevation, with at least
some direct input of glacial meltwater and
surrounded by alpine vegetation or rocky catch-
ments; and (2) more strongly acidic, light- and
phosphorus-limited humic lakes mostly below
4,000 m elevation, remote from the glaciers and
surrounded by Ericaceous vegetation and/or bogs.
With regard to benthic habitat, the Rwenzori
lakes surveyed to date have mixing regimes
ranging from polymictic to meromictic, resulting
in hypolimnetic (profundal) oxygen regimes rang-
ing from near-saturated over mildly depleted to
completely anoxic, despite generally low primary
productivity. Excluding the mid-elevation Lake
Mahoma, the measured range in surface-water
temperature among Rwenzori lakes (5.5–9.1�C) is
relatively modest, overlapping substantially with
the range of bottom-water temperatures (4.8–
7.5�C). Hence, we do not expect the benthic fauna
of well-oxygenated profundal habitat to be mark-
edly different from that on similar substrate in
shallow-water habitat. We do expect species
turnover in profundal benthic communities of
Rwenzori lakes along the oxygen gradient con-
trolled by mixing frequency.
Alpine lakes in remote and undisturbed regions
are known early-warning systems for more wide-
spread environmental change (e.g. Schmidt &
Psenner, 1992; Sommaruga-Wograth et al., 1997;
Skjelkvale & Wright, 1998; Battarbee et al., 2002;
Rogora et al., 2003). As shown from this study, the
physical limnology, hydrochemistry and nutrient
budget of Rwenzori lakes varies closely with
climate-controlled characteristics of their local
abiotic environment, in particular air temperature,
proximity to glaciers and type of vegetation cover.
It follows that Rwenzori lake ecosystems may
indeed prove to be very sensitive to anthropogenic
climate change and glacier retreat.
In temperate regions, air temperature is rec-
ognized to influence the timing of ice break-up
and growing season in lakes (Livingstone, 1997;
Palecki & Barry, 1986). Climatic warming in the
Rwenzori may enhance the thermal stratification
of lakes and thus reduce their frequency of
complete water-column mixing and aeration.
Combined with high inputs of terrestrial organic
matter, this may result in more widespread
occurrence of low-oxygen conditions in the hypo-
limnion, profoundly changing the biogeochemis-
try and aquatic community structure of these lake
Hydrobiologia (2007) 592:151–173 169
123
systems. Rising regional air temperature will also
likely result in a gradual upward shift of vegeta-
tion belts (Beniston, 2005; Walther et al., 2005),
which will in turn affect the lakes’ nutrient budget
and DOC content, water-column transparency
and UV penetration. The low buffering capacity
of most Rwenzori lakes also makes them vulner-
able to the acidification associated with incom-
plete organic decomposition (see Psenner &
Schmidt, 1992; Schmidt & Psenner, 1992; Wright
& Schindler, 1995; Koinig et al., 1996). Glacier
retreat will cause a larger proportion of the
catchment to be exposed to physical and chemical
weathering (Wright & Schindler, 1995; Skjelkvale
& Wright, 1998) changing nutrient and ion
budgets accordingly. In comparison, the thermal
effects of changes in glacial meltwater input may
be modest, except in lakes now in close proximity
of the remnant glaciers.
The limnological data resulting from this study
may serve as an important quantitative baseline
for long-term environmental monitoring of the
Rwenzori lakes. The exact amplitude and direc-
tion of ecosystem change due to climatic warm-
ing, however, depend on site-specific processes
and are not readily predictable (Psenner &
Schmidt, 1992; Koinig et al., 1998). Use of these
limnological data to create paleoenvironmental
calibration data sets will, when applied to sedi-
mentary records, help to improve insight in the
long-term natural variability of these ecosystems
and in their actual sensitivity to climate-driven
environmental change.
Acknowledgements The fieldwork was conducted underUganda NCST research clearance NS21 and UgandaWildlife Authority permit UWA/TBDP/RES/50, withlogistic support from Rwenzori Mountaineering Services.We greatly thank Halewijn Missiaen and Bob Rumes forfield assistance, Angelica Alcantara for lab assistance,Renaat Dasseville for pigment analyses (at GhentUniversity, Belgium) and Lei Chou for TP and TNanalyses (at the Univerisite Libre de Bruxelles,Belgium). Elie Verleyen is acknowledged forconstructive comments on the statistical analyses, andSteven Declerk and two anomymous referees forsupportive critique which helped to improve themanuscript. This research was sponsored by the Fund forScientific Research of Flanders, the Leopold III-fundBelgium (Belgium), the Stichting Ter Bevordering vanhet Wetenschappelijk Onderzoek in Afrika (Belgium),and the U.S. National Geographic Society (grant 7999-06).
H.E. is a postdoctoral fellow with the Fund for ScientificResearch of Flanders (FWO-Vlaanderen).
References
Battarbee, R. W., R. Thompson, J. Catalan, J. A. Grytnes& H. J. B. Birks, 2002. Climate variability and eco-system dynamics of remote alpine and arctic lakes: theMOLAR project. Journal of Paleolimnology 28: 1–6.
Beniston, M., 2005. Climatic change and its possible im-pacts on the alpine region. Revue de Geographie –Journal of Alpine Research 93(2): 25–32.
Bradley, R. S., M. Vuille, H. F. Diaz & W. Vergara, 2006.Threats to water supplies in the tropical Andes. Sci-ence 312: 1755–1756.
Burgeon, L., 1937. Liste des Coleopteres recoltes au coursde la Mission Belge au Ruwenzori. Bruxelles-InstitutRoyal Colonial Belge, 140 pp.
Busulwa, H. S. & R. G. Bailey, 2004. Aspects of thephysico-chemical environment of the Rwenzori rivers,Uganda. African Journal of Ecology 42: 87–92.
Camarero, L., J. Catalan, A. Boggero, A. Marchetto,R. Mosello & R. Psenner, 1995. Acidification in highmountain lakes in central, southwest and southeastEurope (Alps, Pyrennes, Pirin). Limnologica 25: 141–156.
Cholnoky, B. J., 1964. Die Diatomeenflora einiger Gew-asser des Ruwenzorigebirges in Zentralafrika. NovaHedwiga 8: 55–101.
de Heinzelin, J., 1962. Carte des extensions glaciaires duRwenzori (versant Congolais). Biuletyn Peryglacjalny11: 133–139.
de Heinzelin, J. & H. Mollaret, 1956. Biotopes de hautealtitude. Ruwenzori I. Institut des Parcs Nationaux duCongo belge, Exploration du Parc National Albert,Deuxieme serie, Bruxelles.
Downing, J. A. & E. McCauley, 1992. The nitro-gen:phosphorus relationship in lakes. Limnology andOceanography 37: 936–945.
Ebinger, C. J., 1989. Tectonic development of the westernbranch of the East African Rift system. GeologicalSociety of America Bulletin 101: 885–903.
Eggermont, H., K. Van Damme & J. M. Russell, in press.Rwenzori Mountains (Mountains of the Moon):headwaters of the White Nile. In Dumont, H. J. (ed.),The Nile Basin. Monographiae Biologicae, Springer.
Forsberg, C. & S. Ryding, 1980. Eutrophication parame-ters and trophic state indices in 30 Swedish waste-receiving lakes. Archiv fur Hydrobiologie 89: 189–207.
Fries, R. E. & T. C. E. Fries, 1948. Phytogeographical re-searches on Mt. Kenya and Mt. Aberdara, BritishEast Africa. Kundliga Svenska Vetenskapsakadem-iens Handlingar 25: 1–54.
Gaffen, D. J., M. A. Sargent, R. E. Habermann & J. R.Lanzante, 2000. Sensitivity of tropospheric andstratospheric temperature trends to radiosonde dataquality. Journal of Climatology 13: 1776–1796.
170 Hydrobiologia (2007) 592:151–173
123
Grasshoff, K., M. Ehrhardt & K. Kremling, 1983. Methodsof Seawater Analysis. Verlag Chemie, Weinheim,419 pp.
Hansson, L. A., 2004. Plasticity in pigmentation induced byconflicting threats from predation and UV radiation.Ecology 85: 1005–1016.
Hastenrath, S., 2001. Variations of East African climatedruing the past two centuries. Climatic Change 50:209–217.
Hastenrath, S. & P. Kruss, 1992. Glacial fluctuation andvegetation succession on Tyndall Glacier, Mt Kenya.Mountain Research and Development 25: 68–75.
Hauer, F. R., J. S. Baron, D. H. Campbell, K. D. Fausch,S. W. Hostetler, G. H. Leavesley, P. R. Leavitt, D. M.McKnight & J. A. Stanford, 1997. Assessment of cli-mate change and freshwater ecosystems of the RockyMountains, USA and Canada. Hydrological Processes11: 903–924.
Hedberg, O., 1951. Vegetation belts of the East Africanmountains. Svensk Botanisk Tidskrift 45: 140–202.
Heron, F. A., 1909. Ruwenzori expedition reports. 12.Lepidoptera Rhopalocera. Transactions of the Zoo-logical Society of London. Volume XIX. Part II.Zoological Society of London, London.
Hutchinson, G. E. & H. Loffler, 1956. The thermal clas-sification of lakes. Proceedings of the Natural Aca-demic Sciences USA 42: 84–86.
Kamenik, C., R. Schmidt, G. Kum & R. Psenner, 2001.The influence of catchment characteristics on thewater chemistry of mountain lakes. Arctic, Antarcticand Alpine Research 33: 404–409.
Kaser, G., D. R. Hardy, T. Molg, R. S. Bradley & T. M.Hyera, 2004. Modern glacier retreat on Kilimanjaroas evidence of climate change: observations andfacts. International Journal of Climatology 24(3):229–329.
Kaser, G. & H. Osmaston, 2002. Tropical Glaciers. Cam-bridge University Press, Cambridge, 207 pp.
Kilham, P., 1971. Biochemistry of African lakes and rivers.Unpublished PhD, Duke University, Durham, N.C.,199 pp.
Kimmins, D. E., 1959. Ruwenzori Expedition 1952. Vol-ume II. Number 8–10. 8. Odonata. 9. Trichoptera. 10.Ephemeroptera, Plecoptera and Neuroptera. Trusteesof the British Museum (Nat. Hist), London.
Kingdom, J., 1989. Island Africa. Princeton UniversityPress, Princeton, NJ, 287 pp.
Kizito, Y. S., A. Nauwereck, L. J. Chapman & W. Koste,1993. A limnological survey of some Western UgandaCrater Lakes. Limnologica 23(4): 335–347.
Koinig, K. A., C. Kamenik, R. Schmidt, A. Agusti-Pana-reda, P. Appleby, A. Lami, M. Prazakova, N. Rose,Ø. A. Schnell, R. Tessadri, R. Thompson & R. Psenner,2002. Environmental changes in an alpine lakes(Gossenkollesee, Austria) over the last two centuries– the influence of air temperature on biologicalparameters. Journal of Paleolimnology 28: 147–160.
Koinig, K. A., R. Schmidt & R. Psenner, 1996. Effects ofair temperature changes and acid deposition on the
pH history of three high alpine lakes. In Mayama,S. & I. Koizumi (eds), 14th Diatom Symposium.Koeltz Scientific Books, Koenigstein, 467–478.
Koinig, K. A., R. Schmidt, S. Wograth, R. Tessadri &R. Psenner, 1998. Climate change as the primarycause for pH shifts in a high alpine lake. Water, Airand Soil Pollution 104: 167–180.
Kopacek, J., E. Stuchlık, V. Straskrabova & P. Pseriakova,2000. Factors governing nutrient status of mountainlakes in the Tatra Mountains. Freshwater Biology 43:369–383.
Lacoul, P. & B. Freedman, 2005. Physical and chemicallimnology of 34 lentic waterbodies along a tropical-to-alpine altitudinal gradient in Nepal. InternationalReview of Hydrobiology 90(3): 254–276.
Lewis, W. M., Jr., 1983. A revised classification of lakesbased on mixing. Canadian Journal of Fisheries andAquatic Sciences 40: 1779–1787.
Livingstone, D. A., 1962. Age of deglaciation in theRuwenzori Range, Uganda. Nature 194: 859–860.
Livingstone, D. A., 1967. Postglacial vegetation of theRuwenzori Mountains in Equatorial Africa. Ecologi-cal Monographs 37: 26–51.
Livingstone, D. M., 1997. Break-up dates of alpine lakes asproxy data for local and regional mean surface airtemperatures. Climate Change 37: 407–439.
Loffler, H., 1957. Die klimatischen Typen des holomiktis-chen Sees. Mitteilungen der Geographischen Gesell-schaft 99: 35–44.
Loffler, H., 1960. Limnologische Untersuchungen an chi-lenischen und peruanischen Binnengewassern. ArchivGeophysik 3: 155–254.
Loffler, H., 1964. The limnology of tropical high mountainlakes. Verhandlungen Internationale Vereinigung derLimnologie 15:176–193.
Loffler, H., 1968a. Die Hochgebirgsseen Ostafrikas.Hochgebirgsforschung 1: 1–61.
Mahaney, W. C., 1989. Quaternary and Environmental Re-search on East African Mountains. Balkema, Rotterdam.
Marchetto, A., R. Mosello, R. Psenner, A. Barbieri,G. Bendetta, D. Tait & G. A. Tartari, 1994. Evalua-tion of the level of acidification and critical loads forAlpine lakes. Ambio 23: 150–159.
McNeeley, R. N., V. P. Neimanis & L. Dwyer, 1979. WaterQuality Source Book: A Guide to Water QualityBranch. Ministry of Supply and Services, Ottawa,Ontario, Canada, 88 pp.
Melack, J. M., 1978. Morphometrical, physical and chem-ical features of the volcanic crater lakes of westernUganda. Archiv fur Hydrobiologie 84: 430–453.
Meyers, P. A. & Teranes, J. L., 2001. Sediment organicmatter. In Last, W. M. & J. P. Smol (eds), TrackingEnvironmental Change Using Lake SedimentsVolume 2 : Physical and Geochemical Methods.Kluwer Academic Publishers, Dordrecht, 239–269.
Mollaret, H., 1961. Biotopes de haute altitude RuwenzoriII et Virunga. Institut des Parcs Nationaux du Congoet du Ruanda-Urundi, Exploration du Parc NationalAlbert, Deuxieme serie, Bruxelles.
Hydrobiologia (2007) 592:151–173 171
123
Mosello, R., A. Lami, A. Marchetto, M. Rogora, B. Wat-hne, L. Lien, J. Catalan, L. Camarero, M. Ventura,R. Psenner, K. Koinig, H. Thies, S. Sommaruga-Wograth, U. Nickus, D. Tait, B. Thaler, A. Barbeiri &R. Harriman, 2001. Trends in the water chemistry ofhigh-altitude lakes in Europe. Water, Air and SoilPollution, Focus 2: 75–89.
Mosello, R., B. M. Wathne, L. Lien & H. J. B. Birks, 1995.AL:PE projects: water chemistry and critical loads.Water, Air and Soil Pollution 85: 493–498.
Ogilvie-Grant, W. R., 1908. Ruwenzori expedition 1905–1906. 16: Aves. Transactions of the Zoological Societyof London. Volume XIX. Part IV. Zoological Societyof London, London.
Oldfield, T., 1910. Ruwenzori expedition 1905–1906. 17:Mammalia. Transactions of the Zoological Society ofLondon. Volume XIX. Part V. Zoological Society ofLondon, London.
Osmaston, H. A., 1965. The past and present climate andvegetation of Ruwenzori and its neighbourhood. PhDthesis, Oxford, 238 pp.
Osmaston, H. A., 1989. Glaciers, glaciations and equilib-rium line altitudes on the Ruwenzori. In Mahaney, W.C. (eds), Quaternary & Environmental Research onthe East African Mountains. Balkema, Rotterdam,7–30.
Osmaston, H. A., 2006. Guide to the Rwenzori. Mountainsof the Moon. Rwenzori Trust, UK, 288 pp
Osmaston, H. & G. Kaser, 2001. Glaciers and glaciations,Rwenzori Mountains National Parc. 1:100,000 Map.Henry Osmaston, Ulverston.
Osmaston, H. A. & D. Pasteur, 1972. Guide to the Ru-wenzori. The Mountains of the Moon. West ColProductions, Reading, UK.
Palecki, M. A. & R. G. Barry, 1986. Freeze-up and break-upof lakes as an index of temperature changes during thetransition seasons: a case study for Finland. Journal ofClimate and Applied Meteorology 25: 893–902.
Pienitz, R. & W. F. Vincent, 2000. Effect of climate changerelative to ozone depletion on UV exposure in sub-arctic lakes. Nature 404: 484–487.
Psenner, R., 1989. Chemistry of high-mountain lakes insiliceous catchments of the central eastern Alps.Aquatic Sciences 51: 108–125.
Psenner, R., 1999. Living in a dusty world: airborne dust asa key factor for Alpine lakes. Water, Air and Soilpollution 112: 217–227.
Psenner, R. & R. Schmidt, 1992. Climate-driven pH con-trol of remote alpine lakes and effects of acid depo-sition. Nature 356: 781–783.
Rogora, M., A. Marchetto & R. Mosello, 2001. Trends inthe chemistry of atmospheric deposition and surfacewaters in the Lago Maggoriore watershed. Hydrologyand Earth System Science 5: 379–390.
Rogora, M., R. Mosello & S. Arisci, 2003. The effect ofclimate warming on the Hydrochemistry of Alpinelakes. Water, Air and Soil Pollution 148: 347–361.
Rundel, P. W., 1994. Tropical alpine climates. In Rundel,P. W., A. P. Smith & F. C. Meinzer (eds), TropicalAlpine Environments. Plant Form and Function.Cambridge University Press, 21–44.
Ruttner, F., 1963. Fundamental of Limnology. Universityof Toronto Press, Toronto, 295 pp.
Salt, G., 1987. Insects and other invertebrate animals col-lected at high altitudes in the Rwenzori and on MountKenya. African Journal of Ecology 25: 95–106.
Schindler, D. W., 2000. Aquatic problems caused by hu-man activities in Banff National Park, Alberta, Can-ada. Ambio 29: 401–407.
Schmidt, R. & R. Psenner, 1992. Climate changes andanthropogenic impacts as causes for pH fluctuations inremote high alpine lakes. Documenta Istituto ItalianoIdrobiologia 32: 31–57.
Scully, N. M. & D. R. S. Lean, 1994. The attenuation ofultraviolet radiation in temperate lakes. Archiv furHydrobiologie, Beihefte, Ergebnisse der Limnologie43: 135–144.
Shapiro, S. S., M. B. Wilk & H. J. Chen, 1968. A com-parative study of various tests of normality. Journal ofthe American Statistical Association 63: 1343–1372.
Skjelkvale, B. L. & R. F. Wright, 1998. Sensitivity to aciddeposition and global climate change. Ambio 27(4):280–286.
Statsoft Inc., 2000. Statistica for Windows. ComputerProgram Manual, Tulsa.
Sommaruga-Wograth, S., K. A. Koinig, R. Schmidt,R. Sommaruga, R. Tessadri & R. Psenner, 1997.Temperature effects on the acidity of remote alpinelakes. Nature 386: 64–67.
Taylor, R. G., L. Mileham, C. Tindimugaya, A. Majugu,A. Muwanga & B. Nakileza, 2006. Recent glacialrecession in the Rwenzori Mountains of East Africadue to rising air temperature. Geophysical ResearchLetters 33: L10402, doi:10.1029/2006GL025962.
Temple, P. H., 1961. A final report of the Makerere Col-lege I.G.Y. expeditions to Ruwenzori. Department ofGeography, Makerere.
ter Braak, C. J. F. & P. Smilauer, 2002. CANOCO Ref-erence Manual and Canodraw for Windows User’sGuide: Software for Canonical Community Ordina-tion (version 4.5). Microcomputer Power, Ithaca, NY,USA, 500 pp.
Tollrian, R. & C. Heibl, 2004. Phenotypic plasticity in pig-mentation in Daphnia induced by UV radiation and fishkairomones. Functional Ecology 18(4): 497–502.
Vincent, W. F. & R. Pienitz, 1996. Sensitivity of high-altitude freshwater ecosystems to global change:temperature and solar ultraviolet radiation. Geosci-ence Canada 23: 231–236.
Visser, S., 1961. Chemical composition of rain water inKampala, Uganda, and its relation to meterologicaland topographical conditions. Journal of GeophysicalResearch 66: 3759–3765.
Walther, G. R., S. Beissner & C. A. Burga, 2005. Trends inthe upward shift of alpine plants. Journal of Vegeta-tion Science 16(5): 541–548.
Wetzel, R. G., 1983. Limnology (2nd edn.). SaundersPublishing, Philadelphia, PA, 767 pp.
Wetzel, R. G., 2001. Limnology: Lake and River Ecosys-tems. Academic Press, San Diego, 1006 pp
Wetzel, R. G. & E. Likens, 1990. Limnological Analysis.Springer-Verlag, London, 391 pp
172 Hydrobiologia (2007) 592:151–173
123
Wilson, S., 1995. Bird and Mammal Checklists for Ugan-da’s National Parks. Institute of Environment andNatural Resources, Makerere University, Kampala,Uganda.
Wright, S. W. & J. W. Jeffrey, 1997. High resolution sys-tem for chlorophylls and carotenoids of marine phy-toplankton. In Jeffrey, S. W., R. F. C. Mantoura &S. W. Wright (eds), Phytoplankton Pigments inOceanography: A Guide to Advanced Methods.SCOR-UNESCO, Paris, 327–341.
Wright, S. W., S. W. Jeffrey, R. F. C. Mantoura, C. A.Llewellyn, T. Bjørnland, D. Repeta & N. Welsch-
meyer, 1991. Improved HPLC method for the analysisof chlorophylls and carotenoids from marine phyto-plankton. Marine Ecology Progress Series 77:183–196.
Wright, R. F. & D. W. Schindler, 1995. Interactions of acidrain and global changes: effects on terrestrial andaquatic ecosystems. Water, Air and Soil Pollution 85:359–364.
Yeoman, G., 1989. Africa’s Mountains of the Moon.Savitri Books, London, UK.