AMERICAN INSTITUTE ,OF MINING AND METALLURGICAL ENGINEERS Technical Publication No. 1060 (CLARR G, PETI~OI~EUM DIVIRION. NO. 83) Physical Properties of Hydrocarbons and Their Mixtures BY 12. It. GILLILAND,~ R. V. LUKES* AND H. W. SCHEELINE* (San Antonio Meeting, Octoher, 1938) KNOWLEDGE of a largc number of the physical propertics of the hydro- carbons is needcd in the calculations and studies of the production engi- neer. Since experimental data on these properties of thc individual hydrocarbons and thcir mixturcs arc available in only a rclatively fcw cases, the use of generalized correlations has dcveloped rapidly in the last dccadc. Thc generalized correlations of pressure, volume and tcm- pcrature,' enthalpy,%nd vapor-liquid ~quilibria,~ on the basis of rcduccd temperatures and pressures, are outstanding examples of this develop- ment. Thesc correlations are of particular value to the production cnginccr intercstcd in the flow of oil and gas, since thcy can bc used to estimate the conditions undcr which segregation of phase occurs as well as the composition, density, and relative amounts of the phases. The tcchnique of using thc corrclations for such estimations has been pub- lishcd by several authors4 and will not be considered in this paper. A considerable number of data have been obtained to check the generalized pressure-volume-temperature correlations, and these data indicate that such rclations hold for the hydrocarbons from methane to heptane. The accuracy is in general sufficient for most engineering pressure- volume-temperature calculations. However, the generalized correlations of cnthalpy and vapor-liquid equilibria have in general been developed from the pressure-volume-temperature correlations by thermodynamic calculations and only a relatively few experimental data are available to check these calculated values. The calculations from pressure, volume and temperature are likely to lead to large errors in the calculated enthalpy and vapor-liquid equilibria. Thus, in the calculations of enthalpies, slopes of the pressure-volume-temperature data are employed, and determining these slopes can greatly amplify small errors in the original data. In the vapor-liquid equilibria calculations it is necessary to have the pressure- volume-temperature relations of the mixture, and the latter properties are much more questionable than those of pure components, particularly in the critical region. A considerable number of experimental data are Manuscript rccc,ived at thc office of the Institute Sept. 20, 1938. * 1)epartrnerit of Clreriiicttl Engineering, Massachr~settsI~istitute of Tcclinology, Cambridge, Mass. References are at the end of the paper. Copyright, 1939, hy the American Institute of Mining and Metallurgical Engineers. Inc. PETROLH~UM TECHNOLOOY, May. 1939. Printed in U. S. A.
Transcript
AMERICAN INSTITUTE , O F MINING AND METALLURGICAL ENGINEERS
Physical Properties of Hydrocarbons and Their Mixtures
BY 12. It. GILLILAND,~ R. V. LUKES* AND H. W. SCHEELINE*
(San Antonio Meeting, Octoher, 1938)
KNOWLEDGE of a largc number of the physical propertics of the hydro- carbons is needcd in the calculations and studies of the production engi- neer. Since experimental data on these properties of thc individual hydrocarbons and thcir mixturcs arc available in only a rclatively fcw cases, the use of generalized correlations has dcveloped rapidly in the last dccadc. Thc generalized correlations of pressure, volume and tcm- pcrature,' enthalpy,%nd vapor-liquid ~qu i l ib r i a ,~ on the basis of rcduccd temperatures and pressures, are outstanding examples of this develop- ment. Thesc correlations are of particular value to the production cnginccr intercstcd in the flow of oil and gas, since thcy can bc used to estimate the conditions undcr which segregation of phase occurs as well as the composition, density, and relative amounts of the phases. The tcchnique of using thc corrclations for such estimations has been pub- lishcd by several authors4 and will not be considered in this paper. A considerable number of data have been obtained to check the generalized pressure-volume-temperature correlations, and these data indicate that such rclations hold for the hydrocarbons from methane to heptane. The accuracy is in general sufficient for most engineering pressure- volume-temperature calculations. However, the generalized correlations of cnthalpy and vapor-liquid equilibria have in general been developed from the pressure-volume-temperature correlations by thermodynamic calculations and only a relatively few experimental data are available to check these calculated values. The calculations from pressure, volume and temperature are likely to lead to large errors in the calculated enthalpy and vapor-liquid equilibria. Thus, in the calculations of enthalpies, slopes of the pressure-volume-temperature data are employed, and determining these slopes can greatly amplify small errors in the original data. In the vapor-liquid equilibria calculations it is necessary to have the pressure- volume-temperature relations of the mixture, and the latter properties are much more questionable than those of pure components, particularly in the critical region. A considerable number of experimental data are
Manuscript rccc,ived at thc office of the Institute Sept. 20, 1938. * 1)epartrnerit of Clreriiicttl Engineering, Massachr~setts I~istitute of Tcclinology,
Cambridge, Mass. References are at the end of the paper.
Copyright, 1939, hy the American Institute of Mining and Metallurgical Engineers. Inc. PETROLH~UM TECHNOLOOY, May. 1939. Printed in U. S. A.
2 PHYSICAL PROPERTIES OF HYDROCARBONS AND THEIR MIXTURES
needed to check the accuracy and increase the utility of these correlations. This paper presents a preliminary report of the apparatus being used and some of the results obtained at the Massachusetts Institute of Technology. In all cases this work is being particularly directed to the study of the mixtures rather than of pure components. However, in the study of mixtures, certain problems arise such as the difficulty of obtaining a number of pure hydrocarbon components of known physical properties and the difficulty involved in the accurate analysis of such mixtures. For these reasons mixtures containing not over three or four pure compo- nents appear to be themost promising a t the present stage of development.
In numerous operations of the petroleum industry, vapor and liquid phases are encountered in contact with each other. For the calculations related to such operations it is frequently necessary to be able to esti- mate or predict the relative composition of the two phases. The most widely used method of predicting such vapor-liquid equilibria for hydro- carbon mixtures at elevated pressures involves the use of the so-called equilibrium constants. These equilibrium constants have been based to a large extent on fugacities, calculated from pressure-volume-tempera- ture data on the pure hydrocarbons, and have been expertly modified to fit the small amount of available experimental equilibria data. The success of such correlations has been outstanding. However, a little consideration indicates that such generalized equilibrium constants for a given substance independent of the other components present cannot be valid a t pressures high enough to approach the critical of the mixture, since at the critical conditions the equilibrium constants must approach unity whereas the critical temperature and pressure of a mixture depend not only on the component in question but also on the physical nature of the other components and their relative amounts. I t is necessary, there- fore, for the equilibrium constant for a given component to be unity a t different temperatures and pressures, depending on the other components present and their amounts. In other words, a t pressures approaching the critical range, the relation between the mole fraction of a component in the vapor and liquid at a given temperature and pressure must be a function of the other components present, and the values calculated from the pressure-volume-temperature data for the pure components must become in error. If accurate pressure-volume-temperature data were available on the mixtures as well as on the pure components, these computations could be accurately extended into the high-pressure region. However, few data are available on the pressure-volume-temperature relations of mixtures at high pressures, and empirical rules for the esti- mation of these data in their present state are not sufficiently accurate to serve as a basis for the calculations of vapor-liquid equilibria.
E. R. GILLILAND, R. V. LUKES AND H. W. SCHEELINE 3
Experimentally, two general methods have been used for determining such vapor-liquid equilibria a t high pressure. The dew-point, bubble- point method has been used by a number of investigators.6 In this method the dew point and bubble point of a number of binary mixtures are determined a t various pressures. For each composition, the dew- point and bubble-point curves are plotted as a function of pressure, and where a dew-point curve for one composition crosses a bubble-point curve for another composition, the composition of the dew-point curve is the vapor in equilibrium with liquid of the composition of the bubble- point curve a t the pressure and temperature of the intersection. Such a method has the advantage that the samples to be tested can be made of known compositions, but it has the disadvantage that the accurate deter- mination of dew points and bubble points is generally difficult and such determinations are seriously affected by small traces of impurities having volatilities different from the two main components. I t has the further drawback that i t is limited to binary mixtures, since for mixtures of more components the same dew point and bubble point can be obtained at a given pressure for an infinite number of mixtures. Thus the intersection a t a given temperature and pressure, instead of corresponding to one vapor composition and one liquid composition, as for binary mixtures, now corresponds to an infinite number of vapor and liquid compositions and i t is impossible to determine which vapor composition is related to any liquid composition.
Another method of determining such equilibria has been to place the two phases in a bomb maintained a t constant temperature and pressure, and obtain equilibrium by agitation. Samples of the vapor and liquid phase are then withdrawn and analyzed. In this method, it is necessary to prevent a reduction in pressure while sampling, and this is generally accomplished by adding to the bomb mercury equivalent to the volume of the sample removed. Precautions must also be taken to prevent liquid from entering the vapor sample line and thereby contaminating the vapor sample.
One of the most satisfactory methods of obtaining vapor-liquid data at atmospheric pressure and lower is by the so-called equilibrium ~ t i l l . ~ , ~ In the present work this still has been adapted to high pressures. In the low-pressure equilibrium stills, the pressure is maintained by sealing the condenser with an inert gas, usually air, which automatically maintains constant pressure by sealing off the portion of the condenser that is not necessary for heat removal. At high pressures such a method of pressure control is not satisfactory because the solubility of the pressure-control gas becomes so high in the condensate that the equilibrium conditions are modified. The high-pressure equilibrium still therefore was constructed to operate without an inert gas, but in order to maintain constant pressure under such conditions i t was necessary to make the heat input exactly
4 PHYSICAL PROPERTIES O F HYDROCARBONS AND THEIR MMTURES
equal to the heat output. This balance of input to output was maintained electrically by a mercury manometer control. It was also found to be highly desirable to have the still portion of the apparatus constructed of glass, so that the liquid level could be observed. This was particularly desirable near the critical region since the density of the vapor and liquid phases become so nearly equal that wide' variations in the liquid level are encountered. A suitable glass for this construction was found in " Sonderglass."
The constructional details of the high-pressure still are shown in Fig. 1. The still was of the form of a large test tube closed at the upper end by a metal packing gland which conducted the vapors to the condenser. . The condensate flowed to the distillate trap, which was a glass tube similar to the still but of smaller size. A return line carried the cdndensate from the trap to the still for reboiling. The lower portion of the condensate trap was filled with mercury and this mercury was connected to the mercury manometer, which was balanced against a tank of inert gas a t the desired pressure. If the pressure in the equilibrium still tended to
E. R. GILLILAND, R. V. LUKES AND H. W. SCHEELINE 5 \
rise, mercury was forced from the trap into the manometer and by a system of relays the heat to the stil.was reduced, thereby.lowering the pressure, and conversely, when the pressure tended to decrease the heat to the still was again increased. Such a control allowed maximum pres- sure variations of about 1 lb. per sq. in. Entrainment in the apparatus was checked in test runs by adding a dye to the liquid in the still and visually observing the condensate in the trap. Such tests indicated that entrainment was not encountered under the operating conditions employed in the equilibrium determinations. Each equilibrium deter- mination was allowed to run for approximately 2 hr., after which samples were removed from the still and the condensate trap and analyzed.
TABLE 1.-Vapor-liquid Equilibria Data for Propane-isobutylene Mixtures
The results on the system propane-isobutylene are presented in Figs. 2 and 3 and Table 1. Fig. 2 summarizes the vapor-liquid equilibria a t 200,300,400,500 and 600 lb. per sq. in. abs. The y-x curves approach
the 45" diagonal as the pressure is increased and become discontinuous above 583 lb. per sq. in., which is the critical pressure of isobutylene. Figs. 4, 5 and 6 show the vapor-liquid equilibrium curves for 200, 400 and 600 lb. per sq. in. together with the curves calculated from the gen- eralized fugacity plots and by Raoult's law. Raoult's law gives values that are too high in all cases; the fugacities give values a little too low a t 200 lb. per sq. in., but are in good agreement a t 400 lb. per sq. in. At 600 lb. per sq. in. the fugacity curve is considerably too high and fails to show the discontinuity a t the lower concentrations. Fig. 3 gives the temperature composition curves for the same three pressures together with the curves calculated by the use of fugacities. The values of the
1.0 equilibrium constants K = y/x for isobutylene are compared with
Q the fugacity values in Fig. 7. ,O 0.8 I The agreement between the ex- z perimental values and those y 0.6 predicted from fugacities is good 2 2 up to about 300 lb. per sq. in., a , 0.4 but a t higher pressures the devia- 0 5 tions become increasingly greater.
0.2 In this figure, the experimental
A 0 s
curves a t 140°, 160°, 180' and
0 200' F. terminate a t pressures
o 0.2 0.4 0.6 0.8 1.0 corresponding to the vapor pres- MOL FRACTION PROPANE IN LIQUID sure of propane a t the respective
FIG. 2.-RESULTS ON THE SYSTEM PROPANE- temperature, since this IBOBUTYLENE.
the maximum pressure a t which any mixture of isobutylene and propane can exist as two phases at these temperatures. At higher pressures only the liquid phase exists in this temperature range. However, a t temperatures above 210' F. (the critical temperature of propane) the curves would be con- tinuous up to the critical pressure of the mixture. No data were obtained in this region above 600 lb. per sq. in., but the curves for the temperatures above 210" F. would bend around and come back to K = 1 a t the critical pressure corresponding to the temperature in question. The values pre- dicted from fugacity calculations are seen to be greatly in error in the higher pressure region, since the values in this region depend on the other components present. Thus different K values for isobutylene would be expected a t the same temperature and pressure, depending on what other components were present. However, the data indicate that a t pressures below 200 to 300 lb. per sq. in. the K values for isobutylene given by the generalized fugacities will probably be satisfactory for hydrocarbon mixtures that do not contain components differing too greatly in molecular weight or type of structure from isobutylene. In
E. R. GILLILAND, R. V. LUKE8 AND H. W. SCHEELINE 7
order to improve the generalized K charts, i t would be necessary to estimate the behavior in the high-pressure region as a function of the composition. It would appear that in addition to the K values, as given by the fugacity charts, two main pieces of data are needed in order to approximately predict K values in this region; viz., (1) estimation of the critical pressure of the mixtures as a function of temperature, and (2) estimation of the pressure at which. the K values go through a minimum
MOL FRACTION PROPANE FIG. 3 .-RESULTS ON THE SYSTEM PROPANE-IBOBUTYLENE.
a t a given temperature. Such information should make it possible to sketch in the curves with sufficient accuracy for most uses.
I
The corresponding vapor-liquid equilibrium values for propane are given in Fig. 8. In this case a considerably different type of deviation from the predicted K values is encountered. In the temperature range of 160" to 220" F., the experimental and predicted values agree satisfactorily in the high-pressure region, but the predicted values are con- sistently low a t the low pressures. At the higher temperatures the agree- ment becomes poor, with the experimental and predicted curves crossing a t an appreciable angle. The wide deviation in the curves a t 280' F.
is due to the fact that the critical pressure for a propane-isobutylene mix- ture at this temperature is about 600 lb. per sq. in. and K must equal 1 a t this critical. The deviation ,at the lower pressures may be due to the fact that a mixture of an olefin and a paraffin tend to deviate more from
a perfect solution than would two 1 .o paraffins. The deviations are in
the direction that would be ex- 0.8 pected for a mixture of two com-
ponents of the type of polarities 0.6 of propane and isobutylene.
yc, ENTH ALPIES 0.4
The effect of pressure on the enthalpy of hydrocarbon vapors
0.2 can be fairly large, particularly at high pressures. Thus a t the criti-
o o wo 0.2 0.4 0.6 0.8 cal temperature an increase in the
pressure from atmospheric to the Xc,
FIG. 4.-VAPOR-LIQUID EQUILIBRIUM CURVES. critical pressure can cause a de- crease in enthalpy of the vapor
equal to about one-third the heat of vaporization of the liquid a t atmospheric pressure.
A number of methods of determining these enthalpy changes have been used. As stated earlier in the paper, they can be calculated if accurate pressure-volume-temper- ature data are available on the I .o
system in question. Experimen- tal methods have included the use 0.8
of the Joule-Thomson expansion and a differential isothermal ex- 0.6
pansion. The method involved yc, in the present work is the measure-
0, ment of the isothermal enthalpy change for the expansion from a - 400 EXPERIMENTAL LR / SQ. IN. high pressure to substantially 0.2
' -- RAOULT S LAW ---- FUGAClTlES atmospheric pressure. Such a method has a number of advan- 0 Y
I I
0 0.2 0.4 0.6 0.8 1.0 tages, among which are: (1) it
XC, gives the difference in FIG. 5.-VAPOR-LIQUID EQUILIBRIUM CURVES.
enthalpy between atmospheric and high pressure a t any chosen temperature, (2) the enthalpy change can be measured by the electrical input necessary to maintain isothermal conditions, thereby allowing high precision to be obtained and (3) the heat losses to or from the system can be reduced to a low value since the system is at a constant temperature.
E. R. GILLILAND, R. V. LUKE5 AND H. W. SCHEELINE 9
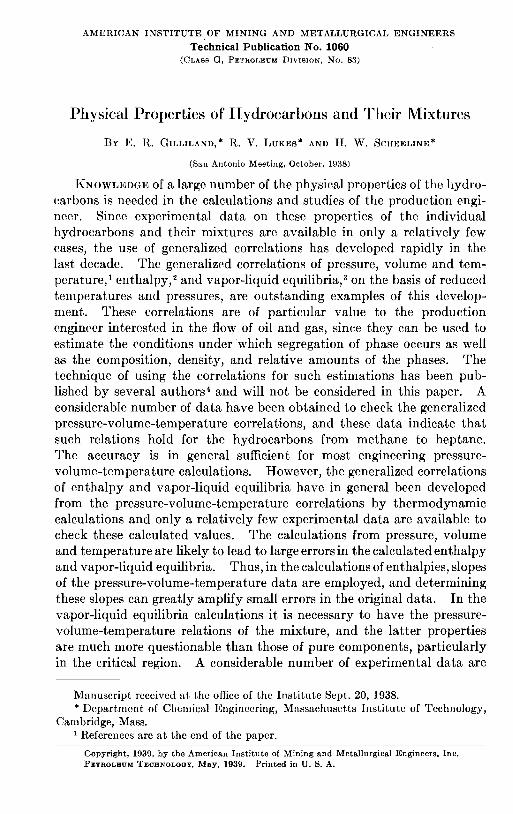
This isothermal expansion unit is shown in Fig. 9. The general principle involved is the forcing of the material being investigated through a fine capillary tube; the rate of flow and the size of the capillary tube being such that the entire pressure drop from the desired high pressure to substantially atmospheric pressure occurs across 0.6
the tube. The capillary tube is Yc, heated electrically using its own o,4 - resistance and the electrical input is so regulated that the material 600 LB. /SQ. IN.
0.2 E X P E R I M E N T A L enters and leaves the unit a t the --.RAOULT'S LAW ---- FUGAClTlES same temperature. With ade- quate provision to prevent heat O o * 0.2 0.4 0.6 0.8 1.0
from flowing into or out of the Xc, the meas- FIG. 6.-VAPOR-LIQUID EQUIBLIRUM CURVE&
ures the enthalpy change directly for the rate of material flow in question.
The actual details of this expansion unit are shown in Fig. 9. The hydrocarbon enters under pressure into the left-hand side of the cross a t
the top, and flows downward in the annular space around the thermo- couple well, and the entering temperature is determined a t this point. The other arm of the cross connects through a mercury seal to a dead-
10 PHYSICAL PROPERTIES OF HYDROCARBONS AND THEIR MIXTURES
weight piston gauge, which serves to measure the pressure. After passing the thermocouple well the hydrocarbon enters the expansion capillary and in passing through drops to essentially atmospheric pressure a t the lower end of the capillary. The expanded hydrocarbon vapor then passes up around the capillary and inside the first radiation shield. A little above the upper level of the capillary the vapor reverses flow and passes downward between the first and second radiation shields. At the bottom the flow is again reversed and the vapor passes up the annular space between the second radiation shield and the shell of the unit. The vapor then passes through the exit pipe around the exit thermocouple well,
600 at which point its temperature is again measured. The electrical energy for heating is supplied by
5 0 0 the current flowing through the electrical resistance of the 18-8 stainless-steel capillary. Since
g soo heat is being transferred to the 0 V)
gas, the capillary must be a t a \
vi m higher temperature than the tem- 300'
u perature at which the enthalpy
P. 3 VI change is being investigated. '0 u a Because of its higher temperature a rw the capillary would tend to dissi-
pate heat by radiation to the surroundings, and it is the func-
100 tion of the radiation shields to intercept this radiant energy and
0 transfer it to the flowing vapors, 1.0 1.2 1.4 1.6 1.8 2.0 and thereby prevent heat loss to
K = y / r the surroundings. FIG. 8.-EQUILIBRIUM CONSTANTS FOB
PROPANE. In order to obtain the desired rates of flow with varying inlet
pressures and operating temperatures, it was necessary to use capillaries of different sizes. The capillaries were 18-8 chrome-nickel steel hypodermic- needle tubing, 0.013 in. inside diameter by 0.025 in. outside diameter, and five different tubes of lengths 1,-3,5,8 and 12 ft. were used. These tubes were coiled on arbors varying from % to in. and then were sprung to the proper length to fit the expansion unit.
The thermal isolation of the system from the surroundings was effected as shown in Fig. 10. The isothermal expansion unit is shown in the center of the diagram inserted in the copper liner, which was insulated by magnesia lagging from the hollow aluminum cylinder. The aluminum cylinder was wound with an electrical heater and then further insulated. By maintaining the aluminum cylinder at approximately the same tem-
E. R. GILLILAND, R. V. LUKES AND H. W. SCHEELINE 11
perature as the expansion unit, such a low-temperature difference existed across the lagging between the cylinder and the expansion unit
n-' INLET THERMO-COUPLE WELL
SECTION A - A S C A L E Z 2 - I
SECTION 8- 8 SCALE: 2 - 1 -
SCALE: 0 1 2 3 INCHES
1 8 - 8 CHROM NI STEEL
OUTLET THERMO-COUPLE
INSULATED FROM CAP
r t A
ASBESTOS STRIP EITHER LEAD FOR INSULATION (51
CAPILLARY TUBE
FUSED SILICA TUBE
TRANSITE WASHERS
FIG. 9.-ISOTHERMAL EXPANSION UNIT.
WELL
that the heat flow was negligible. The exit lead to the condenser, the dead-weight connection lead, and the thermocouple leads were taken out through a heated section to prevent heat loss by conduction.
12 PHYSICAL PROPERTIES OF HYDROCARBONS AND THEIR MIXTURES
The flowsheet including the auxiliary apparatus is shown in Fig. 11. The hydrocarbon being tested was stored in A and was pumped by pump D to one side of the reservoir F, from which it flowed through prehieater P and R to the isothermal expansion unit of Fig. 9. After leaving the expansion unit the vapor passed to the condensing system and then returned to the storage A. In order to maintain constant flow it was necessary that the inlet pressure to the capillary be maintained constant.
This constancy of pressure was obtained by having the feed pump con- trolled by the mercury level in the reservoir F. This reservoir was a manometer of large capacity, one leg of which was connected to a large tank of gas and the other leg served as the hydrocarbon reservoir. When the pump was in operation it forced the mercury down on the right-hand side until contact H touched the mercury, which by means of a relay stopped the pump. As the hydrocarbon flowed out, the gas storage forced the mercury up to contact K, which restarted the pump and the cycle. The ballast tank L was maintained approximately a t the desired operating pressure, but owing to the variation of the mercury level in F,
E. R. GILLILAND, R. V. LUKES AND H. W. SCHEELINE 13
slight pressure fluctuations would have developed if this pressure were maintained constant. In ordm to avoid this variation in pressure, gas was either bled in from the higher-pressure cylinder M or released through the waste-gas line. This fine adjustment of the pressure was manual and was controlled so that the piston of the dead-weight gauge floated freely a t all times.
The electrical input was measured by calibrated voltmeter and am- meter, and the rate of flow was determined by weighing the condensate from U over a given period of time. The dead-weight gauge was cali- brated against the vapor pressure of carbon dioxide as described by Bridgeman.8 Temperatures were measured with calibrated chromel-P- alumel thermocouples to an accuracy of f 0.1" C.
The effect of pressure on the enthalpy of benzene was determined with this apparatus. The benzene used was Baker's chemically pure and the results of this work are summarized in Table 2 and plotted in Fig. 12. The values of the change in enthalpy between various pressures and zero pressure divided by the absolute temperature are given in Table 2 as a
K function of the reduced temperature (absolute temperature divided by the critical temperature) and the reduced pressure (pressure divided by the critical pressure). These values have been corrected from atmospheric pressure to zero pressure by the use of Young's pressure-volume-tempera- ture data on benzene. This correction was less than 1 per cent of the measured (Ho - H,)/T values in all but a few cases. Fig. 12 gives a plot of the uncorrected experimental results, with the envelope curve for
14 PHYSICAL PROPERTIES O F HYDROCARBONS AND THEIR MIXTURES
saturated vapor and liquid being fitted in by the usc of Young's vapor- pressure data for benzene.
These data on benzene callnot be compared directly with values cal- culated from pressure-volume-temperature data, because of the lack of su5cient measurements of the latter type. However, when the calcula- tions based on pressure-volume-temperature data available for other hydrocarbons are plotted in this same manner, the difference between the plots for the various substances is not very great. These values of
TABLE %.-Results on Benzene
Values of vt I3.t.u. per Lb. Moles per Deg. R.
PE T E = 0.10 1 TE = 0.80 ( T E = 080 I TB = 1.0 I TI = 1.10 I TB = 1.10
PR = P / P , and T R = T / T , ; for benzene PC = 47.89 atmospheres, T , = 561.7" K . a Saturated liquid.
Saturated vapor.
(Ho - H,)/T for propane calculated from the data of Beattie, Kay, and Kaminskyg are only about 10 per cent less at the same reduced tempera- ture and pressure than the corresponding values for n-heptane calculated from the data of Beattie and Kay, and the values for n-butane and isopentane fall between the propane and heptane values. Since this variation was small, the experimental results on benzene have been plotted in Fig. 13 together with the calculated n-heptane lines. The agreement is good except a t the low of T R , and the pressure-volume-temperature
E. R. GILLILAND, R. V. LUKES AND H. W. SCHEELINE 15
P, - P/P, FIG. 18.-ENTHALPY OF BENZENE.
calculations are questionable in this region since extrapolations had to be used. The fact that the data for benzene and n-heptane agree so satisfactorily indicates that the enthalpy changes when correlated on the basis used in this figure are not greatly affected by organic series to which the hydrocarbon belongs.
1. Lewis and Luke: Ind. and Eng. Chem. (1933) 26,725. Lewis: Trans. A.I.M.E. (1934) 107, 11. Souders, Selheimer and Brown: Ind. a n d I ~ n g . Chem. (1932) 24, 517.
2. Lewis and Luke: Trans. Amer. Soc. Mech. Engrs. (1932) 64, 55. 3. Brown, Souders et al.: Ind. and Eng. Chem. (1932) 24, 513.
Lewis and Kay: Oil and Gas Jnl. (1934) 32, No. 45,40, 114 4. Lewis: Trans. A.I.M.E. (1934) 107,ll.
Sage, Hicks and Lacey: Tentative Equilibrium Constants for Light Hydro- carbons. Preprint Amer. Petr. Inst. (May 1938).
5. Cummings: Sc.D. Thesis, Massachusetts Institute of Technology, 1933. Kay: Ind. and Eng. Chem. (1938) 30,459.
6. Carey and Lewis: Ind. and Eng. Chem. (1932) 24, 882. 7. Othmer: Ind. and Eng. Chem. (1928) 20, 743. 8. Bridgeman: Jnl. Amer. Chem. Soc. (1927) 49, 1174. 9. Beattie, Kay and Kaminsky: J d . Amer. Chem. Soc. .(1937) 69, 1589.


![Synthesis and physical properties of several aliphatic and ... · standard reactions or modifications thereof, and purified by fractional distiJJation. Physical ... hydrocarbons [8]](https://static.documents.pub/doc/80x56/5abfb4f17f8b9aa15e8e526b/synthesis-and-physical-properties-of-several-aliphatic-and-reactions-or-modifications.jpg)


