Technical Data Report Properties and Fate of Hydrocarbons Associated with Hypothetical Spills at the Marine Terminal and in the Confined Channel Assessment Area ENBRIDGE NORTHERN GATEWAY PROJECT SL Ross Environmental Research Ltd. Ottawa, Ontario Randy Belore, P.Eng. 2010
Transcript
Technical Data Report
Properties and Fate of Hydrocarbons Associated with Hypothetical Spills at the Marine Terminal and in the
Confined Channel Assessment Area
ENBRIDGE NORTHERN GATEWAY PROJECT
SL Ross Environmental Research Ltd. Ottawa, Ontario
Randy Belore, P.Eng.
2010
Properties and Fate of Hydrocarbons Associated with Hypothetical Spills at the Marine Terminal and in the Confined Channel Assessment Area Technical Data Report Table of Contents
2.1 Evaporation ...................................................................................................... 2-1 2.2 Density ............................................................................................................. 2-3 2.3 Viscosity ........................................................................................................... 2-3 2.4 Interfacial Tension ............................................................................................ 2-3 2.5 Pour Point ........................................................................................................ 2-4 2.6 Flash Point ....................................................................................................... 2-4 2.7 Emulsion Formation-Tendency and Stability .................................................... 2-4 2.8 Oil Adhesion ..................................................................................................... 2-5
3 Physical Property Tests: Results ..................................................................... 3-1 3.1 Properties of Syncrude Synthetic Oil ................................................................ 3-1 3.2 Properties of CRW Condensate ....................................................................... 3-4 3.3 Properties of Cold Lake Bitumen Diluted with Condensate ............................... 3-8 3.4 Properties of MacKay River Heavy Bitumen Diluted with Synthetic Light
Oil .................................................................................................................. 3-11 3.5 Comparison of Adhesion Results with Other Oils ........................................... 3-15
4 Fate Modelling for Marine Spills ...................................................................... 4-1 4.1 Background ...................................................................................................... 4-1 4.2 General Fate of the Three Oils ......................................................................... 4-4 4.3 Hypothetical Marine Terminal Spill, Oil Fate Results ........................................ 4-5
Properties and Fate of Hydrocarbons Associated with Hypothetical Spills at the Marine Terminal and in the Confined Channel Assessment Area Technical Data Report Table of Contents
Page ii 2010
5 References .....................................................................................................5-1 Appendix A Oil Property Analysis Data Sheets ......................................... A-1
List of Tables
Table 2-1 Test Procedures Used for Spill-Related Oil Analysis ............................... 2-1Table 2-2 Emulsion Formation Tendency Criteria ................................................... 2-5Table 2-3 Emulsion Stability Criteria ....................................................................... 2-5Table 3-1 Spill-Related Properties of Syncrude Synthetic Light Oil ......................... 3-2Table 3-2 Spill-Related Properties of CRW Condensate ......................................... 3-5Table 3-3 Spill-Related Properties of Cold Lake Bitumen Diluted with
Condensate (CLB) .................................................................................. 3-9Table 3-4 Spill-Related Properties of MacKay Heavy Bitumen Diluted with
Synthetic Light Oil ................................................................................. 3-12Table 3-5 Oil Adhesion Results ............................................................................. 3-16Table 4-1 Meteorological Inputs for Fate Modelling ................................................. 4-3Table 4-2 Example Oil Property Changes with Time (Principe Channel 10,000
Figure 3-1 Evaporation of Syncrude Synthetic Light Oil versus Time ....................... 3-1Figure 3-2 Effect of Evaporation on Viscosity: Syncrude Synthetic Light Oil ............ 3-3Figure 3-3 Effect of Evaporation on Density: Syncrude Synthetic Light Oil .............. 3-3Figure 3-4 Effect of Evaporation on Pour Point: Syncrude Synthetic Light Oil .......... 3-4Figure 3-5 Evaporation of CRW Condensate ........................................................... 3-6Figure 3-6 Effect of Evaporation on Viscosity: CRW Condensate ............................ 3-6Figure 3-7 Effect of Evaporation on Density: CRW Condensate .............................. 3-7Figure 3-8 Effect of Evaporation on Pour Point: CRW Condensate .......................... 3-7Figure 3-9 Evaporation of Cold Lake Bitumen Diluted with Condensate .................. 3-8Figure 3-10 Effect of Evaporation on Viscosity: Cold Lake Bitumen Diluted with
Condensate ........................................................................................... 3-10Figure 3-11 Effect of Evaporation on Density: Cold Lake Bitumen Diluted with
Condensate ........................................................................................... 3-10Figure 3-12 Effect of Evaporation on Pour Point: Cold Lake Bitumen Diluted with
Condensate ........................................................................................... 3-11Figure 3-13 Evaporation of MacKay River Heavy Bitumen Diluted with Synthetic
Light Oil ................................................................................................. 3-13Figure 3-14 Effect of Evaporation on Viscosity: MacKay River Heavy Bitumen
Diluted with Synthetic Light Oil .............................................................. 3-13
Properties and Fate of Hydrocarbons Associated with Hypothetical Spills at the Marine Terminal and in the Confined Channel Assessment Area Technical Data Report Table of Contents
2010 Page iii
Figure 3-15 Effect of Evaporation on Density: MacKay River Heavy Bitumen Diluted with Synthetic Light Oil ............................................................. 3-14
Figure 3-16 Effect of Evaporation on Pour Point: MacKay River Heavy Bitumen Diluted with Synthetic Light Oil ............................................................. 3-14
Viscosity ............................................................................................... 4-19Figure 4-29 Emilia Island Tanker Spill Scenario (Summer) – Oil or Emulsion
Density ................................................................................................. 4-19Figure 4-30 Emilia Island Tanker Spill Scenario (Summer) – Emulsion Water
Properties and Fate of Hydrocarbons Associated with Hypothetical Spills at the Marine Terminal and in the Confined Channel Assessment Area Technical Data Report Table of Contents
Page iv 2010
Figure 4-33 Emilia Island Tanker Spill Scenario (Fall) – Percent Evaporated ........... 4-21Figure 4-34 Emilia Island Tanker Spill Scenario (Fall) – Oil or Emulsion Viscosity ... 4-22Figure 4-35 Emilia Island Tanker Spill Scenario (Fall) – Oil or Emulsion Density ...... 4-22Figure 4-36 Emilia Island Tanker Spill Scenario (Fall) – Emulsion Water Content .... 4-23Figure 4-37 Emilia Island Tanker Spill Scenario (Fall) – Thick Slick Width ................ 4-23Figure 4-38 Emilia Island Tanker Spill Scenario (Winter) – Percent Dispersed ......... 4-24Figure 4-39 Emilia Island Tanker Spill Scenario (Winter) – Percent Evaporated ....... 4-24Figure 4-40 Emilia Island Tanker Spill Scenario (Winter) – Oil or Emulsion
Viscosity ................................................................................................ 4-25Figure 4-41 Emilia Island Tanker Spill Scenario (Winter) – Oil or Emulsion
Density .................................................................................................. 4-25Figure 4-42 Emilia Island Tanker Spill Scenario (Winter) – Emulsion Water
Viscosity ................................................................................................ 4-28Figure 4-47 Emilia Island Tanker Spill Scenario (Spring) – Oil or Emulsion
Density .................................................................................................. 4-28Figure 4-48 Emilia Island Tanker Spill Scenario (Spring) – Emulsion Water
Properties and Fate of Hydrocarbons Associated with Hypothetical Spills at the Marine Terminal and in the Confined Channel Assessment Area Technical Data Report Table of Contents
2010 Page v
Figure 4-59 Principe Channel Tanker Spill Scenario (Fall) – Oil or Emulsion Density ................................................................................................. 4-35
Properties and Fate of Hydrocarbons Associated with Hypothetical Spills at the Marine Terminal and in the Confined Channel Assessment Area Technical Data Report Table of Contents
Properties and Fate of Hydrocarbons Associated with Hypothetical Spills at the Marine Terminal and in the Confined Channel Assessment Area Technical Data Report Abbreviations
2010 Page i
Abbreviations
ASTM .............................................................. American Society for Testing and Materials CCAA .............................................................................. confined channel assessment area CLB ................................................................. Cold Lake bitumen diluted with condensate CRW .......................................................................................................... CRW condensate Hayco .................................................................................. Hay and Company Consultants MKH ........................ MacKay River heavy bitumen diluted with Suncor synthetic light oil Project .......................................................................... Enbridge Northern Gateway Project rpm .................................................................................................... revolutions per minute SLROSM ......................................................................................... SL Ross oil spill model SYN .......................................................................................... Syncrude synthetic light oil
Properties and Fate of Hydrocarbons Associated with Hypothetical Spills at the Marine Terminal and in the Confined Channel Assessment Area Technical Data Report Section 1: Introduction
2010 Page 1-1
1 Introduction Northern Gateway Pipelines Limited Partnership (Northern Gateway) proposes to construct and operate the Enbridge Northern Gateway Project (the Project), which is an export oil pipeline and an import condensate pipeline between an initiating station near Bruderheim, Alberta and marine and tank terminals (the Kitimat Terminal) near Kitimat, British Columbia.
The purpose of this document is to investigate the possible behaviour of oil and condensate spills in the marine environment within the confined channel assessment area (CCAA) for the purpose of oil spill response planning. An assessment of the effects of spills on the terrestrial environment is also available (see the Environmental and Socio-economic Assessment, Volume 7B). For brevity, when oil or oils are referred to generically in this report, it should be understood that this includes condensates, unless specific hydrocarbons are named.
When oil is spilled in the marine environment, its physical and chemical properties change over time through evaporation and emulsification. These changes affect both the fate and behaviour of the spill and the effectiveness of countermeasures. For example, oil may be relatively fluid and non-viscous when initially spilled, but may become viscous within a short time. It is important to know whether this will happen and how long it will take.
The objectives of this study are to:
• conduct simulated oil spill weathering laboratory experiments for a range of hydrocarbons considered representative of those that will be part of the Project
• complete oil fate modelling for these oils in spill examples developed for the CCAA. The results of the fate modelling will be used for spill response planning.
The following oils were selected for this analysis:
• Syncrude synthetic light oil (SYN) • CRW condensate (CRW) • Cold Lake bitumen diluted with condensate (CLB) • MacKay River heavy bitumen diluted with Suncor synthetic light oil (MKH)
Properties and Fate of Hydrocarbons Associated with Hypothetical Spills at the Marine Terminal and in the Confined Channel Assessment Area Technical Data Report Section 2: Physical Property Tests: Methods
2010 Page 2-1
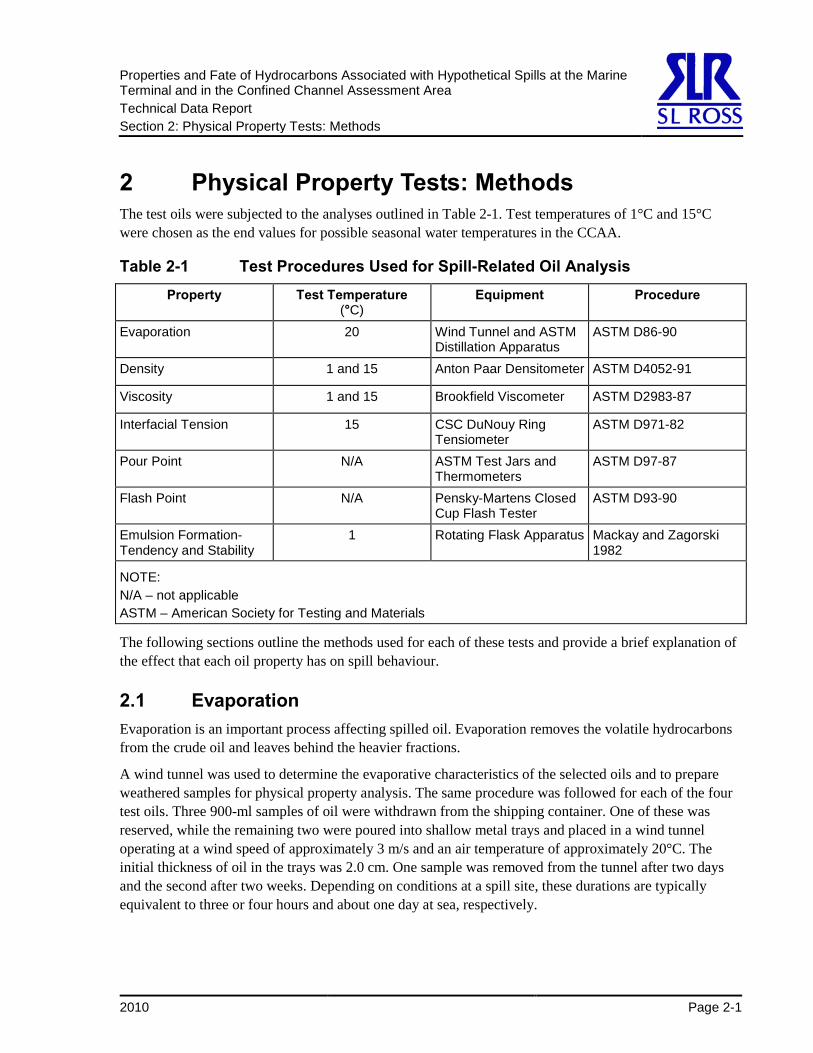
2 Physical Property Tests: Methods The test oils were subjected to the analyses outlined in Table 2-1. Test temperatures of 1°C and 15°C were chosen as the end values for possible seasonal water temperatures in the CCAA.
Table 2-1 Test Procedures Used for Spill-Related Oil Analysis Property
Test Temperature
(°C) Equipment
Procedure
Evaporation 20 Wind Tunnel and ASTM
Distillation Apparatus ASTM D86-90
Density 1 and 15 Anton Paar Densitometer ASTM D4052-91
Viscosity 1 and 15 Brookfield Viscometer ASTM D2983-87
Interfacial Tension 15 CSC DuNouy Ring Tensiometer
ASTM D971-82
Pour Point N/A ASTM Test Jars and Thermometers
ASTM D97-87
Flash Point N/A Pensky-Martens Closed Cup Flash Tester
ASTM D93-90
Emulsion Formation-Tendency and Stability
1 Rotating Flask Apparatus Mackay and Zagorski 1982
NOTE: N/A – not applicable ASTM – American Society for Testing and Materials
The following sections outline the methods used for each of these tests and provide a brief explanation of the effect that each oil property has on spill behaviour.
2.1 Evaporation Evaporation is an important process affecting spilled oil. Evaporation removes the volatile hydrocarbons from the crude oil and leaves behind the heavier fractions.
A wind tunnel was used to determine the evaporative characteristics of the selected oils and to prepare weathered samples for physical property analysis. The same procedure was followed for each of the four test oils. Three 900-ml samples of oil were withdrawn from the shipping container. One of these was reserved, while the remaining two were poured into shallow metal trays and placed in a wind tunnel operating at a wind speed of approximately 3 m/s and an air temperature of approximately 20°C. The initial thickness of oil in the trays was 2.0 cm. One sample was removed from the tunnel after two days and the second after two weeks. Depending on conditions at a spill site, these durations are typically equivalent to three or four hours and about one day at sea, respectively.
Properties and Fate of Hydrocarbons Associated with Hypothetical Spills at the Marine Terminal and in the Confined Channel Assessment Area Technical Data Report Section 2: Physical Property Tests: Methods
Page 2-2 2010
The fresh oil and the weathered samples were then analyzed for the selected physical properties according to the procedures listed in Table 2-1. In addition, the fresh oil was subjected to a modified ASTM distillation (ASTM D86-90, modified in that both liquid and vapour temperature were measured) to obtain two oil-specific constants for evaporation prediction purposes. The distillation information was used in conjunction with the wind tunnel data to predict evaporation rates for oil spills at sea.
While in the wind tunnel, the mass of oil remaining in the trays was measured and recorded hourly during the initial, rapid evaporation phase and daily after the two-day sample was removed. The elapsed time at each measurement, the initial thickness of oil in the tray and the wind tunnel conditions were used to determine the evaporative exposure (Mackay et al. 1983), according to:
oxKt
=θ (Equation 1)
where: θ (theta) is evaporative exposure
K is the mass transfer coefficient (m/s)
t is elapsed time (s)
xo is initial slick thickness (m)
Evaporative exposure provides a means of correlating the rate of evaporation of oil under the conditions in the wind tunnel (i.e., slick thickness and wind speed) to other environmental conditions at a spill site. The wind tunnel mass transfer coefficient, K, from Equation 1 was determined by calibrating the wind tunnel with a tray of pure toluene during use. For a spill, the mass transfer coefficient can be estimated from:
78.00015.0 UK = (Equation 2)
where: U is wind speed [m/s]
For spills at sea, it is difficult to obtain a slick thickness. As such, an average initial thickness, defined as the volume spilled divided by the area of the slick, is substituted for xo in Equation 1.
A plot of volume fraction evaporated versus evaporative exposure was prepared for both crude oils using the data from the wind tunnel. The evaporation predicted by the Mackay equation under the conditions in the wind tunnel was included in the plots. The equation is of the form:
TkC
TkC
CTkC
Fv1
32
1 exp1ln
−+
=θ
(Equation 3)
where: Fv is volume fraction evaporated
C1, C2 and C3 are oil-specific constants
Tk is environmental temperature (K)
Properties and Fate of Hydrocarbons Associated with Hypothetical Spills at the Marine Terminal and in the Confined Channel Assessment Area Technical Data Report Section 2: Physical Property Tests: Methods
2010 Page 2-3
The constants C1, C2 and C3 were calculated from the wind tunnel evaporation data and from the ASTM distillation curve of the fresh crude oil. The slope and intercept of the distillation curve are used as a measure of the oil’s volatility, which allows prediction of evaporation rates at temperatures other than that in the wind tunnel.
Equations 1, 2 and 3 can be used to estimate oil evaporation under various spill conditions of temperature, elapsed time and wind speed.
2.2 Density Density, the mass per unit volume of the oil (or emulsion), determines how buoyant oil is in water. The common unit of density is grams per cubic centimetre (g/cm3). The density of oil increases with weathering and decreases with increasing temperature. Density affects the following processes:
• sinking – if oil density exceeds that of surrounding water, it will sink • spreading – in early stages of a spill, denser oils spread faster • natural dispersion – denser oils disperse more easily • emulsification stability – denser oils form more stable emulsions
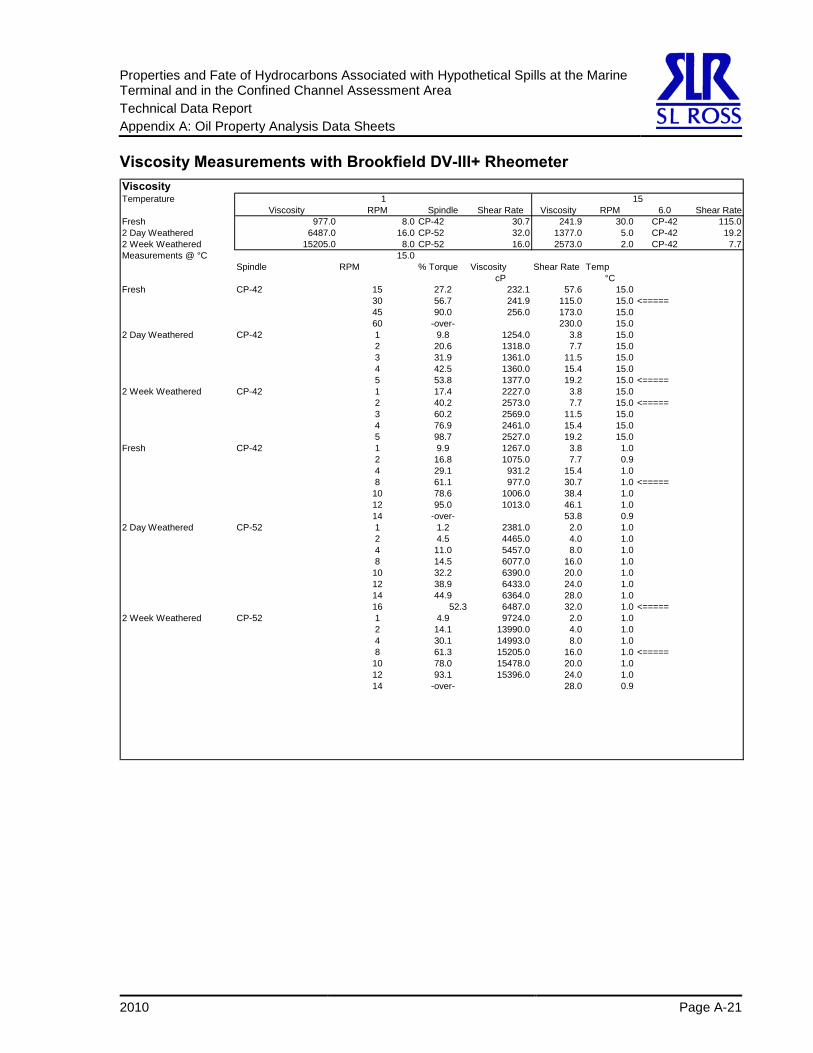
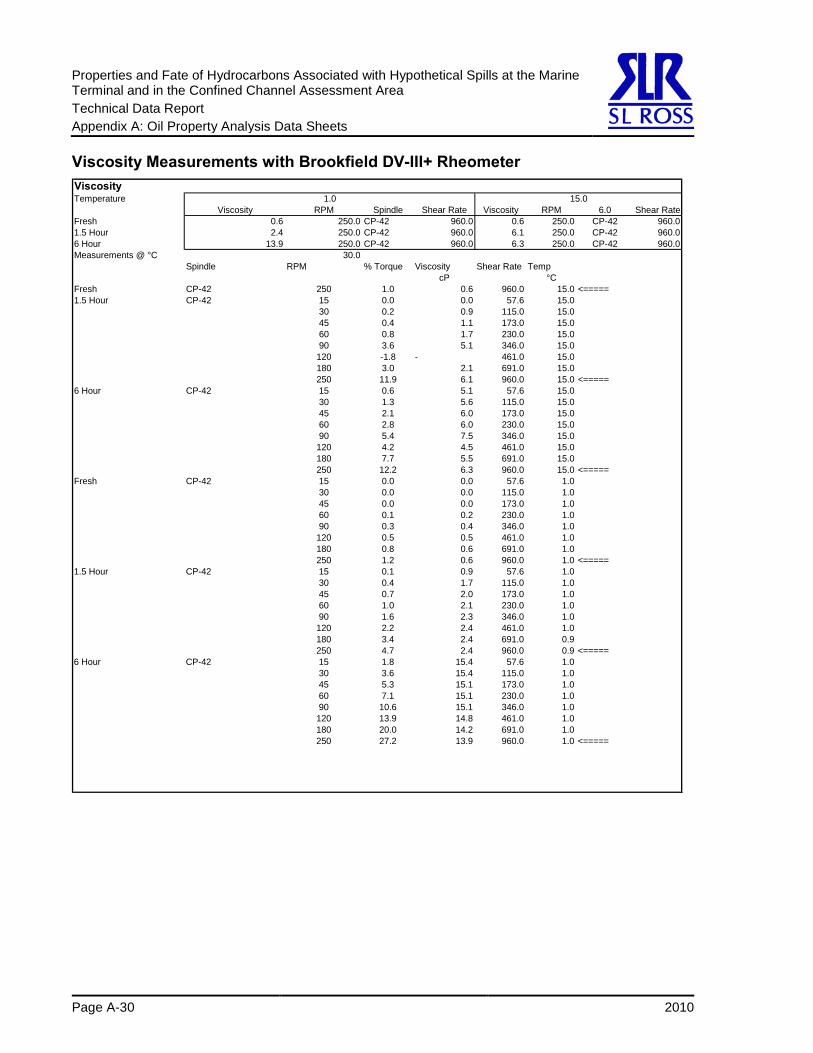
2.3 Viscosity Viscosity is a measure of the resistance of oil to flowing, once it is in motion. The common unit of viscosity is the centiPoise (cP); the metric unit is the milliPascal second (mPa·s), which is numerically equivalent to the centiPoise. The viscosity of oil increases as weathering progresses and decreases with increasing temperature. Viscosity is one of the most important properties for spill behaviour and affects the following processes:
• spreading – viscous oils spread more slowly
• natural and chemical dispersion – highly viscous oils are difficult to disperse
• emulsification tendency and stability – viscous oils form more stable emulsions
• recovery and transfer operations – more viscous oils are generally harder to skim and more difficult to pump
2.4 Interfacial Tension Interfacial tension is a measure of the surface forces that exist between the interfaces of the oil and water and the oil and air. Chemical dispersants work by reducing the oil and water interfacial tension to allow a given mixing energy (i.e., sea state) to produce smaller oil droplets. Interfacial tensions (oil and air and oil and water) are insensitive to temperature, but are affected by evaporation. Interfacial tension affects the following processes:
• spreading – interfacial tensions determine how fast oils spread and whether they form a sheen
• natural and chemical dispersion – oils with high interfacial tensions are more difficult to disperse
• emulsification rates and stability
Properties and Fate of Hydrocarbons Associated with Hypothetical Spills at the Marine Terminal and in the Confined Channel Assessment Area Technical Data Report Section 2: Physical Property Tests: Methods
Page 2-4 2010
• mechanical recovery – oleophilic skimmers (e.g., rope-mop and belt skimmers) work best on oils with moderate to high interfacial tensions
2.5 Pour Point The pour point is the lowest temperature (to the nearest multiple of 3°C) at which oil will still flow. Below this temperature, the oil develops an internal yield stress and, in essence, solidifies. The pour point of an oil increases with weathering. Pour point affects the following processes:
• spreading – oils at temperatures below their pour points will not spread
• viscosity – oil viscosity increases dramatically at temperatures below the pour point
• dispersion – oils below their pour points are more difficult to disperse
• recovery, transfer and storage – oils below their pour points resist flowing toward skimmers or down inclined surfaces in skimmers and present storage and transfer problems
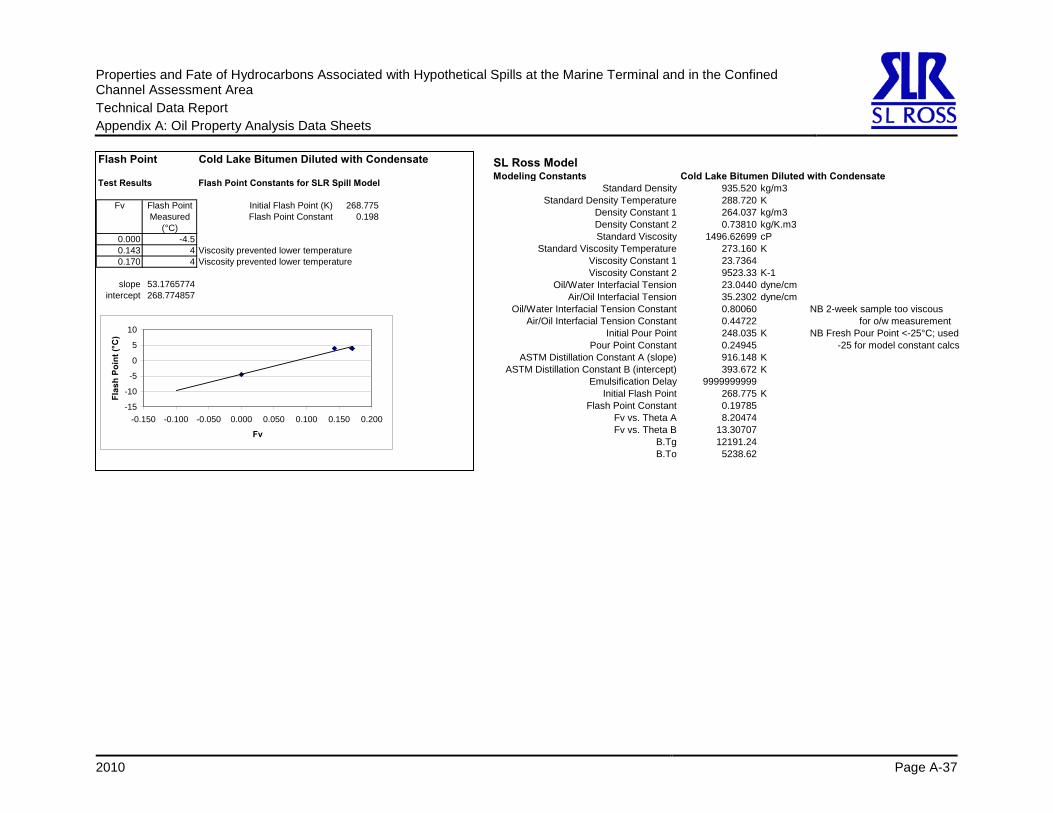
2.6 Flash Point The flash point of oil is the temperature (in degrees centigrade [°C]) at which the oil produces sufficient vapours to ignite when exposed to an open flame or other ignition source. Flash point increases with increasing evaporation. It is an important safety issue.
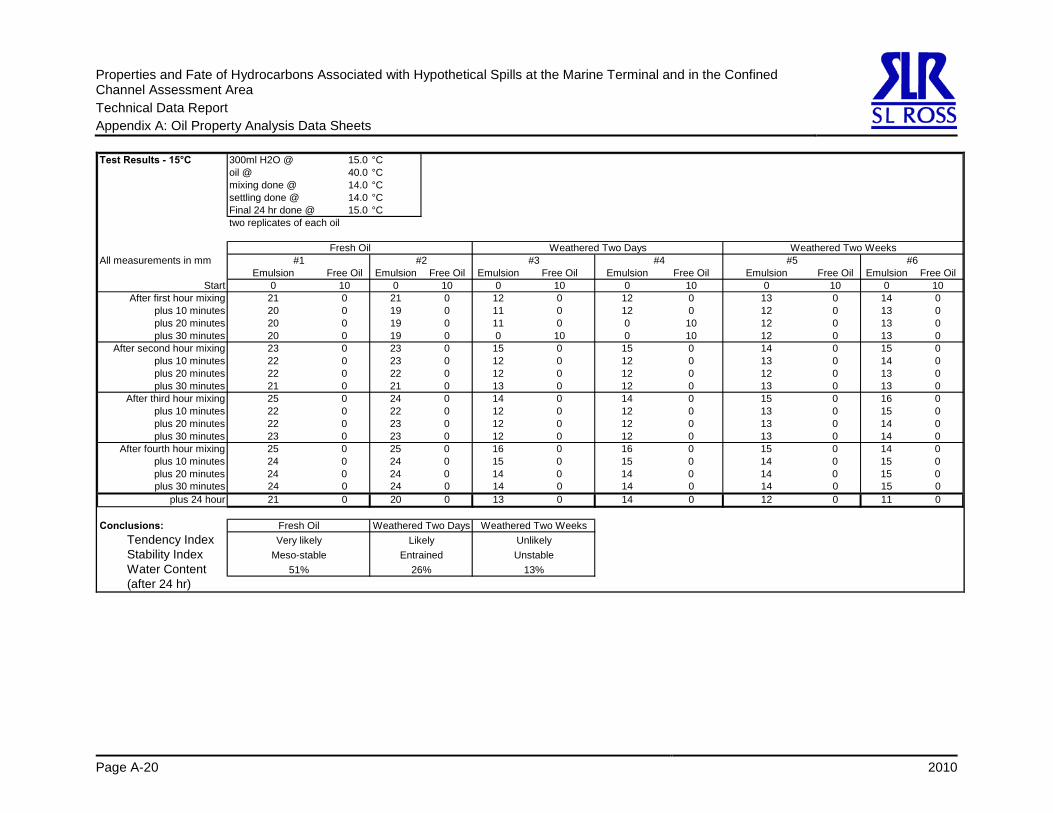
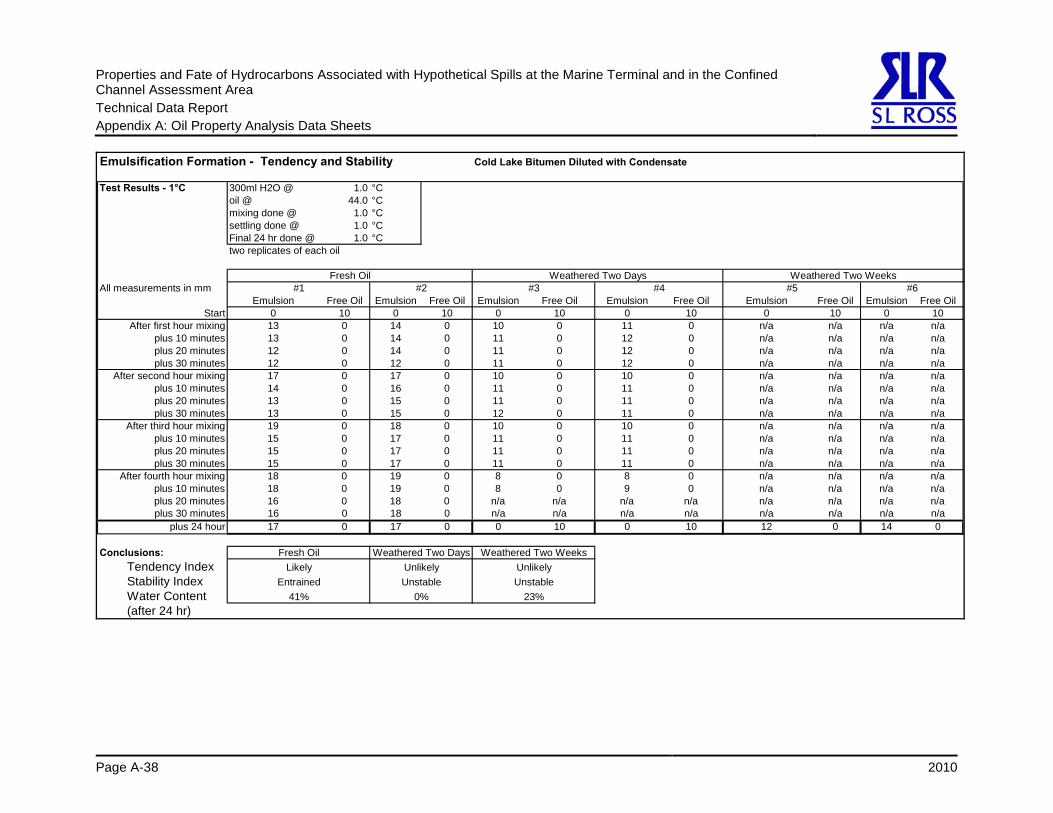
2.7 Emulsion Formation-Tendency and Stability A water-in-oil emulsion (colloquially called “chocolate mousse”) is a stable emulsion of small droplets of water incorporated in oil. Oil spills on water may form stable water-in-oil emulsions that can have very different characteristics than the parent crude oil.
The tendency of oil to form water-in-oil emulsions and the stability of the emulsion formed are measured by two indices: the Emulsification Tendency Index and the Emulsion Stability Index. The Emulsion Formation-Tendency Index can have a low value, indicating that the oil will not form an emulsion, or a high value, indicating that the oil will form an emulsion. The Emulsion Stability Index can be:
• low, which indicates the emulsion is unstable and will break quickly once removed from the mixing environment
• moderate, which means the emulsion will break within a few hours
• high, which means the oil forms a very stable emulsion that is unlikely to break even after standing for 24 hours
Both the Tendency Index and Stability Index generally increase with increased degree of evaporation. Colder temperatures generally increase both the Tendency Index and Stability Index (i.e., promote emulsification). Emulsion formation results in increases in the spill's volume, viscosity increases (that can reduce dispersant effectiveness) and increased water content.
Properties and Fate of Hydrocarbons Associated with Hypothetical Spills at the Marine Terminal and in the Confined Channel Assessment Area Technical Data Report Section 2: Physical Property Tests: Methods
2010 Page 2-5
The test procedure for emulsion tendency and stability follows the method now called the Mackay and Zagorski Test (Mackay and Zagorski 1982). Precisely 300 ml of artificial seawater and 30 ml of oil are placed in a 500 ml fleaker (oil to water ratio of 1:10), and the fleaker is sealed. The fleaker is rotated for one hour at a rotation speed of 65 revolutions per minute (rpm) and then allowed to settle for 30 minutes. The fraction of oil that forms an emulsion, f, is determined by measuring the height of the emulsion and the height of the unemulsified oil. Three additional mixing and settling cycles are performed with measurements of f taken at each rotation interval. The tendency of oil to form an emulsion is given by finitial, obtained by plotting f versus time and by extrapolating f to time zero.
The criteria in Table 2-2 are used to classify the tendency of a crude oil to form a stable emulsion.
Table 2-2 Emulsion Formation Tendency Criteria Range of finitial Emulsion Formation Tendency
0.0 to 0.25 Not likely 0.25 to 0.75 Fairly likely 0.75 to 1.0 Very likely
The stability of a water-in-oil emulsion is obtained by allowing the emulsion to settle for an additional 24 hours and then measuring the fraction of oil in the emulsion (ffinal) visually. The stabilities of the water-in-oil emulsions are classified as shown in Table 2-3.
Table 2-3 Emulsion Stability Criteria Range of ffinal Emulsion Stability
0.0 to 0.25 Unstable 0.25 to 0.75 Fairly stable 0.75 to 1.0 Very stable
The calculated water contents of stable water-in-oil emulsions are also determined.
From the viewpoint of spill countermeasures and slick persistence, emulsification is a very negative process because strongly emulsified oils are highly viscous; they can have 10 to 100 times the viscosity of the parent oil. It is generally believed that oils with relatively high concentrations of asphaltenes are most likely to form stable water-in-oil emulsions. Some heavy oils do not easily form emulsions because the high viscosity of the oil prevents the uptake of water. Some light or medium oils do not form an emulsion immediately, but once evaporation occurs and the asphaltene concentration increases, the emulsification process begins and usually proceeds quickly thereafter.
2.8 Oil Adhesion The adhesion characteristic of an oil is determined by measuring the quantity of oil or petroleum product that remains on a surface after being wet with oil then allowed to drain. Adhesion is measured as the mass of oil per unit area that remains on a steel needle after a thirty-minute drain time. The method developed by the Emergencies Science and Technology Division of Environment Canada is as follows. The oil is homogenized for 30 minutes. A penetrometer needle (specified in ASTM D5, Standard Test Method for
Properties and Fate of Hydrocarbons Associated with Hypothetical Spills at the Marine Terminal and in the Confined Channel Assessment Area Technical Data Report Section 2: Physical Property Tests: Methods
Page 2-6 2010
Penetration of Bituminous Materials) is hung from the balance into the draft shield, allowed to come to rest and then weighed. It is convenient if the balance can be tarred with the needle hanging from the balance. An aliquot of sample is poured into a vessel with a depth greater than 4 cm. The vessel is elevated using a lab-jack until the sample reaches the top of the needle. Care must be taken to immerse only the stainless steel needle and not the brass support. The needle is allowed to rest in the oil for 30 seconds and then the vessel lowered. The needle is hung undisturbed for 30 minutes. After the needle has been allowed to hang fee of the oil for 30 minutes, the needle and remaining sample is weighed. Four replicate measurements are made for each sample.
Properties and Fate of Hydrocarbons Associated with Hypothetical Spills at the Marine Terminal and in the Confined Channel Assessment Area Technical Data Report Section 3: Physical Property Tests: Results
2010 Page 3-1
3 Physical Property Tests: Results The key results of the laboratory analyses completed on the four study oils are provided in this section. Oil property summary tables and several graphs showing oil property variations versus temperature and percentage evaporated are provided for each of the oils tested. Detailed data tables and notes from the laboratory study are provided in Appendix A.
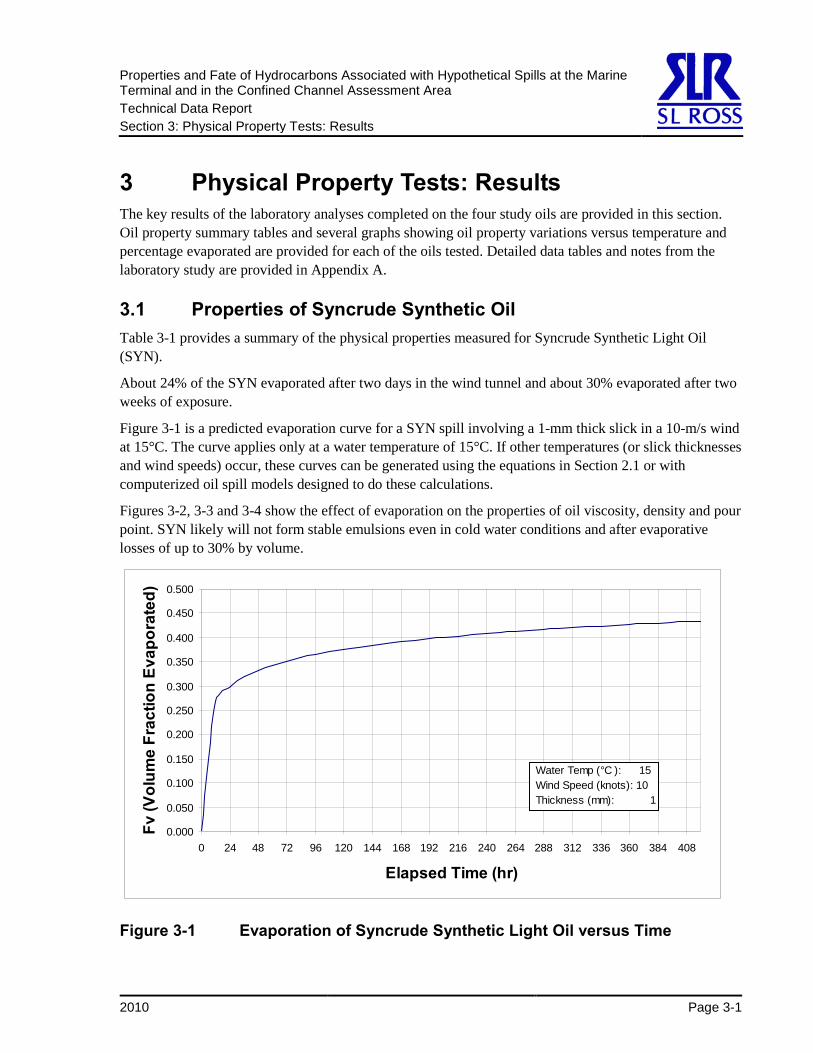
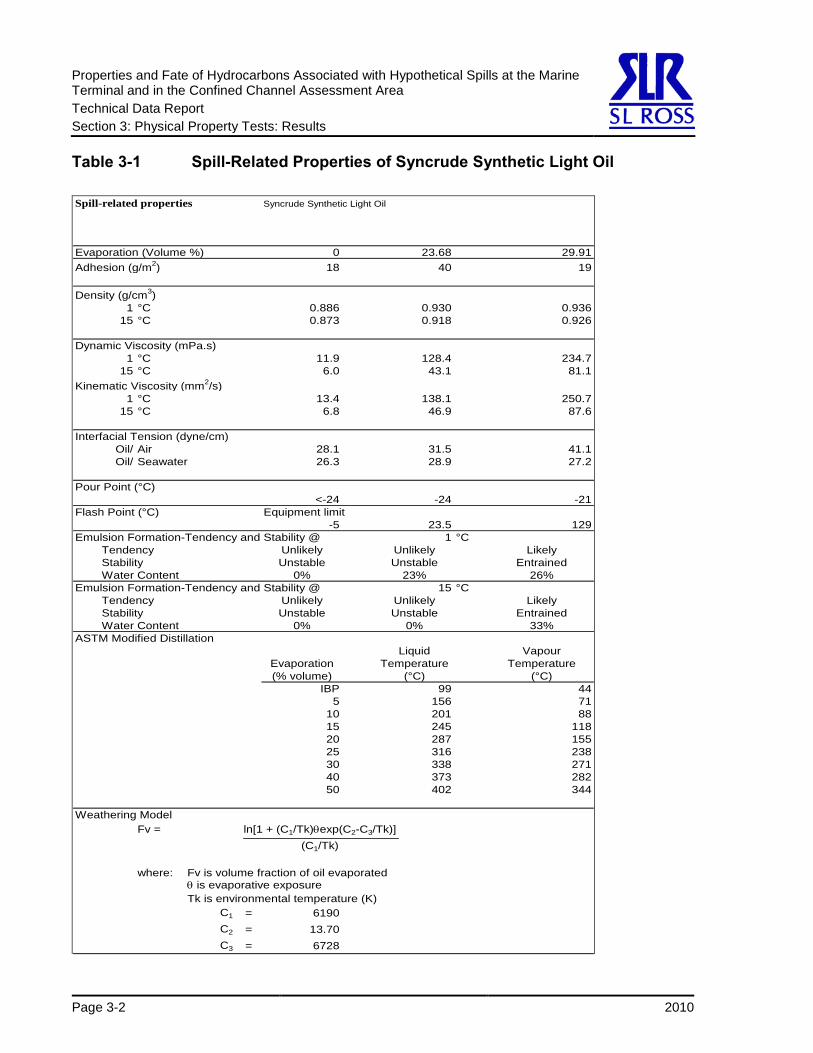
3.1 Properties of Syncrude Synthetic Oil Table 3-1 provides a summary of the physical properties measured for Syncrude Synthetic Light Oil (SYN).
About 24% of the SYN evaporated after two days in the wind tunnel and about 30% evaporated after two weeks of exposure.
Figure 3-1 is a predicted evaporation curve for a SYN spill involving a 1-mm thick slick in a 10-m/s wind at 15°C. The curve applies only at a water temperature of 15°C. If other temperatures (or slick thicknesses and wind speeds) occur, these curves can be generated using the equations in Section 2.1 or with computerized oil spill models designed to do these calculations.
Figures 3-2, 3-3 and 3-4 show the effect of evaporation on the properties of oil viscosity, density and pour point. SYN likely will not form stable emulsions even in cold water conditions and after evaporative losses of up to 30% by volume.
Figure 3-1 Evaporation of Syncrude Synthetic Light Oil versus Time
Properties and Fate of Hydrocarbons Associated with Hypothetical Spills at the Marine Terminal and in the Confined Channel Assessment Area Technical Data Report Section 3: Physical Property Tests: Results
where: Fv is volume fraction of oil evaporatedθ is evaporative exposureTk is environmental temperature (K)
C1 = 6190C2 = 13.70C3 = 6728
ln[1 + (C1/Tk)θexp(C2-C3/Tk)](C1/Tk)
Properties and Fate of Hydrocarbons Associated with Hypothetical Spills at the Marine Terminal and in the Confined Channel Assessment Area Technical Data Report Section 3: Physical Property Tests: Results
2010 Page 3-3
1.0
10.0
100.0
1000.0
0 10 20 30 40
Percent Loss to Evaporation (volume)
Dyn
amic
Vis
cosi
ty
(at a
ppro
xim
atel
y 60
s-1
)
Viscosity @ 1°CViscosity @ 15°C
Figure 3-2 Effect of Evaporation on Viscosity: Syncrude Synthetic Light Oil
0.860
0.870
0.880
0.890
0.900
0.910
0.920
0.930
0.940
0.950
0 10 20 30 40
Percent Loss to Evaporation (volume)
Den
sity
(g/c
m3)
Density @ 1°CDensity @ 15°C
Figure 3-3 Effect of Evaporation on Density: Syncrude Synthetic Light Oil
Properties and Fate of Hydrocarbons Associated with Hypothetical Spills at the Marine Terminal and in the Confined Channel Assessment Area Technical Data Report Section 3: Physical Property Tests: Results
Page 3-4 2010
-40
-30
-20
0 20 40
Percent Loss to Evaporation (volume)
Pour
Poi
nt (°
C)
Figure 3-4 Effect of Evaporation on Pour Point: Syncrude Synthetic Light Oil
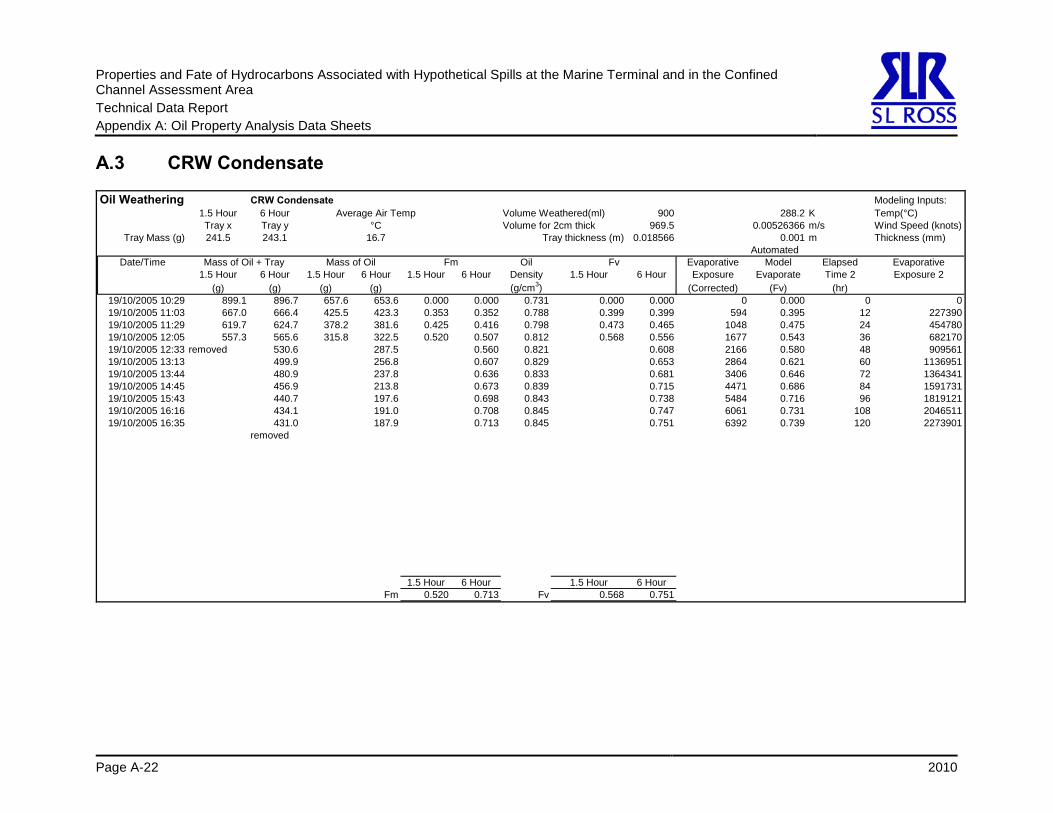
3.2 Properties of CRW Condensate Table 3-2 provides a summary of the physical properties measured for CRW condensate (CRW).
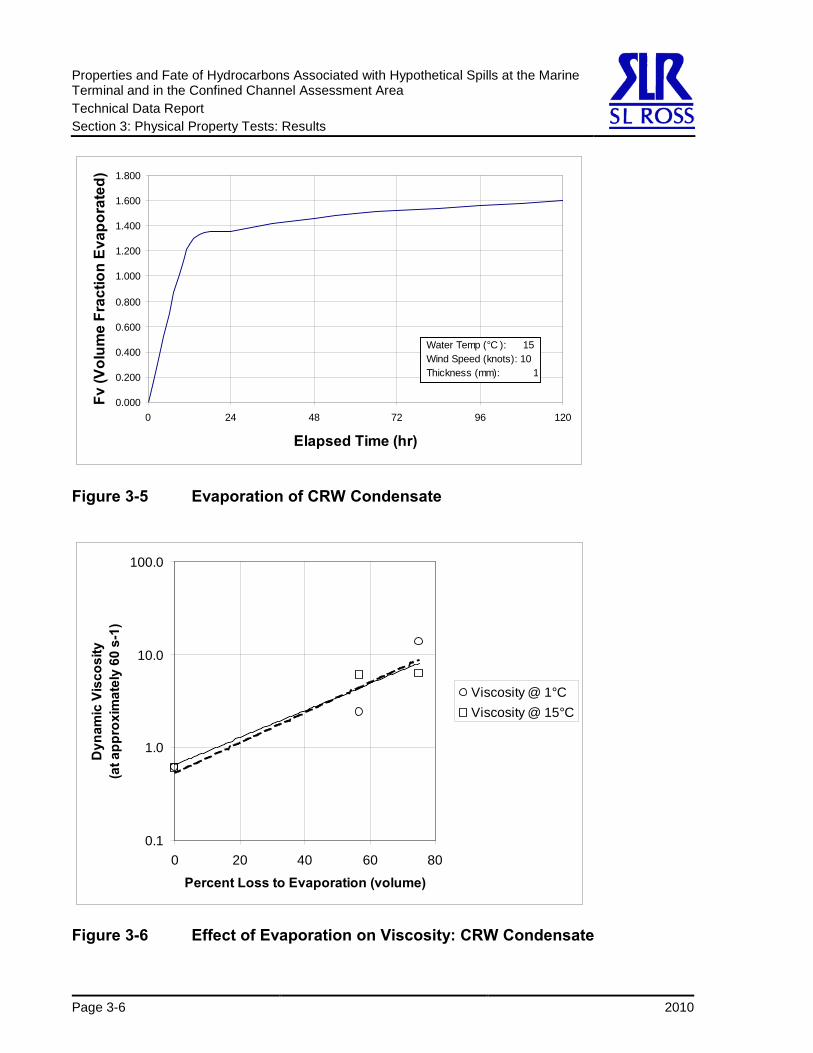
About 57% of the CRW evaporated after two days in the wind tunnel and about 75% evaporated after two weeks of exposure.
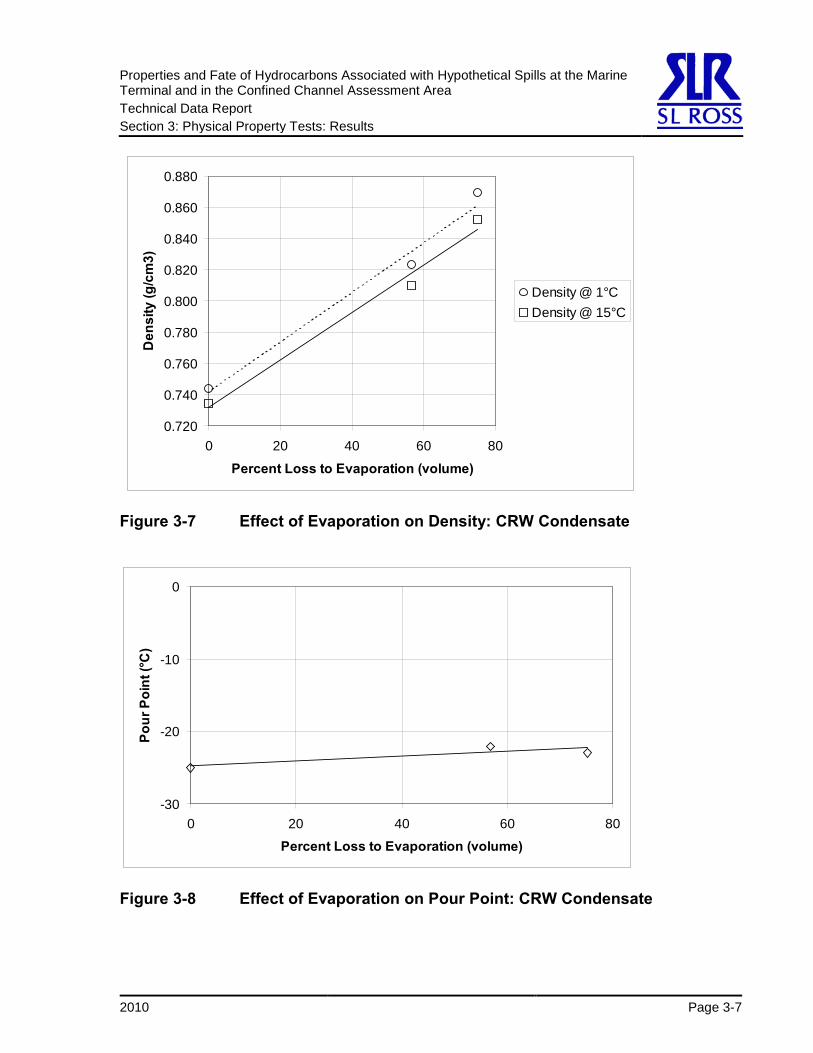
Figure 3-5 is a predicted evaporation curve for a spill of CRW involving a 1-mm thick slick in a 10-m/s wind at 15°C. The curve applies only at a water temperature of 15°C. If other temperatures (or slick thicknesses and wind speeds) occur, these curves can be generated using the equations in Section 2.1 or with computerized oil spill models designed to do these calculations.
Figures 3-6, 3-7 and 3-8 show the effect of evaporation on the properties of oil viscosity, density and pour point. CRW will not form stable emulsions even in cold water conditions and after evaporative losses of up to 75%, by volume.
Properties and Fate of Hydrocarbons Associated with Hypothetical Spills at the Marine Terminal and in the Confined Channel Assessment Area Technical Data Report Section 3: Physical Property Tests: Results
where: Fv is volume fraction of oil evaporatedθ is evaporative exposureTk is environmental temperature (K)
C1 = 1946C2 = 2.47C3 = 2372
ln[1 + (C1/Tk)θexp(C2-C3/Tk)](C1/Tk)
Properties and Fate of Hydrocarbons Associated with Hypothetical Spills at the Marine Terminal and in the Confined Channel Assessment Area Technical Data Report Section 3: Physical Property Tests: Results
Figure 3-6 Effect of Evaporation on Viscosity: CRW Condensate
Properties and Fate of Hydrocarbons Associated with Hypothetical Spills at the Marine Terminal and in the Confined Channel Assessment Area Technical Data Report Section 3: Physical Property Tests: Results
2010 Page 3-7
0.720
0.740
0.760
0.780
0.800
0.820
0.840
0.860
0.880
0 20 40 60 80
Percent Loss to Evaporation (volume)
Den
sity
(g/c
m3)
Density @ 1°CDensity @ 15°C
Figure 3-7 Effect of Evaporation on Density: CRW Condensate
-30
-20
-10
0
0 20 40 60 80
Percent Loss to Evaporation (volume)
Pour
Poi
nt (°
C)
Figure 3-8 Effect of Evaporation on Pour Point: CRW Condensate
Properties and Fate of Hydrocarbons Associated with Hypothetical Spills at the Marine Terminal and in the Confined Channel Assessment Area Technical Data Report Section 3: Physical Property Tests: Results
Page 3-8 2010
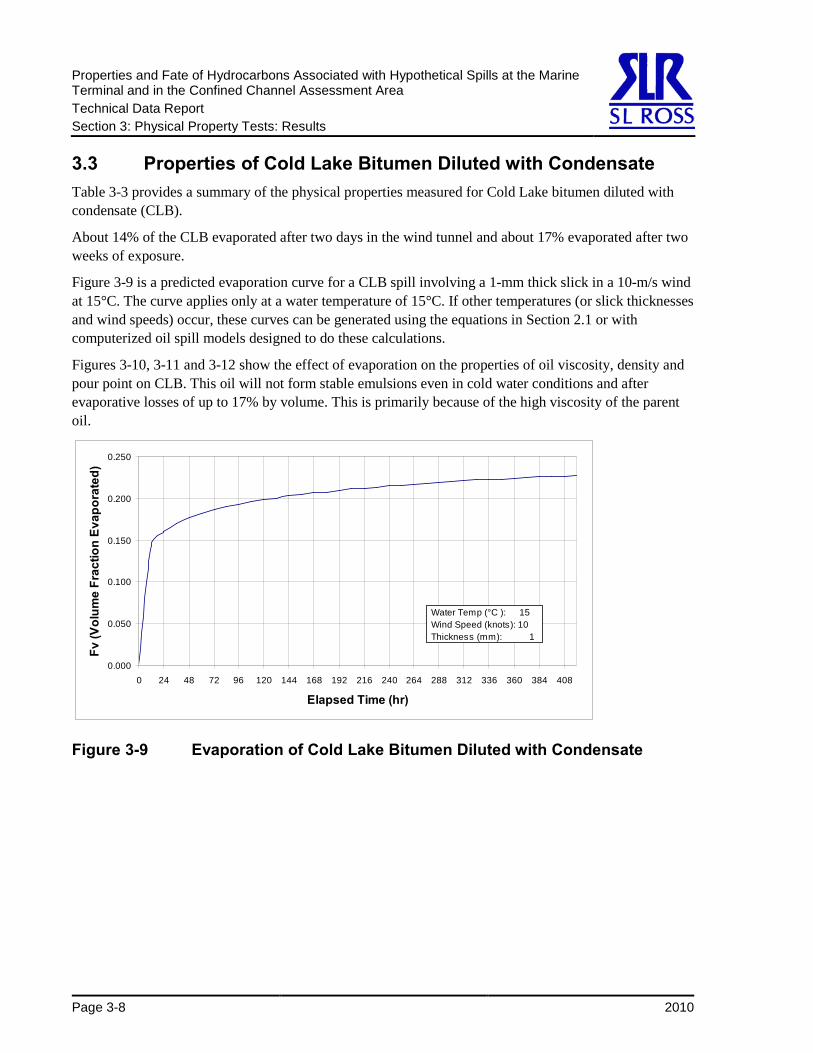
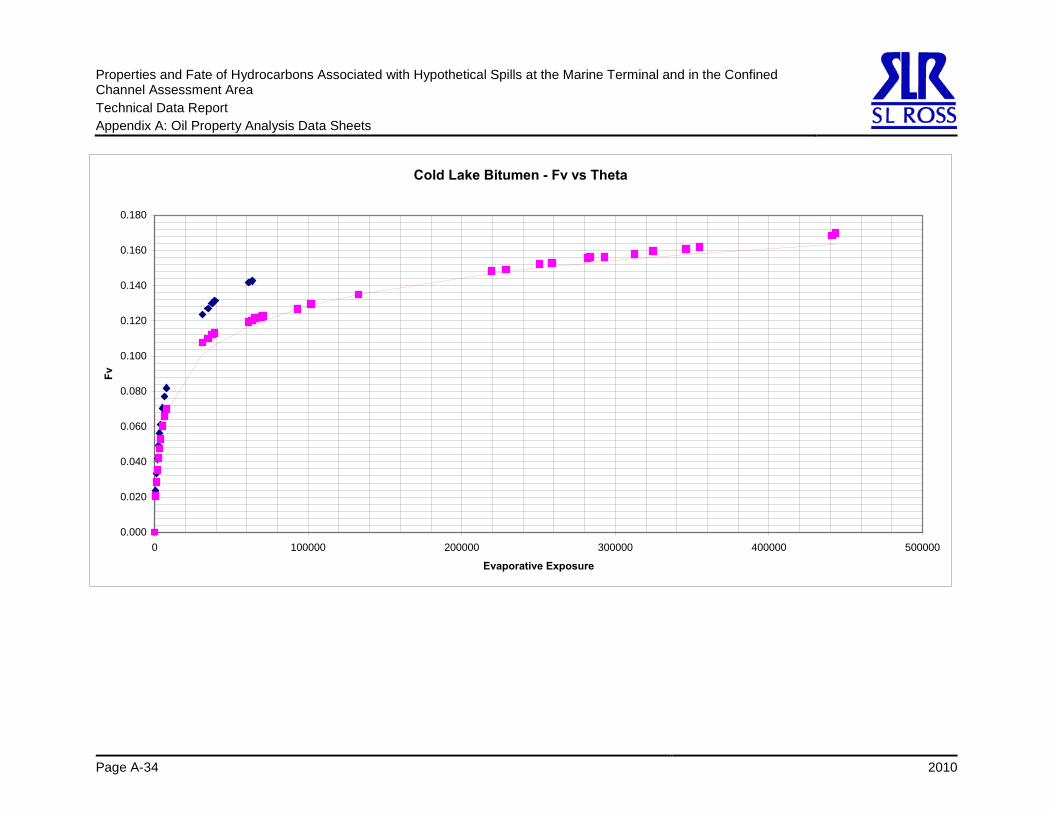
3.3 Properties of Cold Lake Bitumen Diluted with Condensate Table 3-3 provides a summary of the physical properties measured for Cold Lake bitumen diluted with condensate (CLB).
About 14% of the CLB evaporated after two days in the wind tunnel and about 17% evaporated after two weeks of exposure.
Figure 3-9 is a predicted evaporation curve for a CLB spill involving a 1-mm thick slick in a 10-m/s wind at 15°C. The curve applies only at a water temperature of 15°C. If other temperatures (or slick thicknesses and wind speeds) occur, these curves can be generated using the equations in Section 2.1 or with computerized oil spill models designed to do these calculations.
Figures 3-10, 3-11 and 3-12 show the effect of evaporation on the properties of oil viscosity, density and pour point on CLB. This oil will not form stable emulsions even in cold water conditions and after evaporative losses of up to 17% by volume. This is primarily because of the high viscosity of the parent oil.
Figure 3-9 Evaporation of Cold Lake Bitumen Diluted with Condensate
Properties and Fate of Hydrocarbons Associated with Hypothetical Spills at the Marine Terminal and in the Confined Channel Assessment Area Technical Data Report Section 3: Physical Property Tests: Results
2010 Page 3-9
Table 3-3 Spill-Related Properties of Cold Lake Bitumen Diluted with Condensate (CL
Spill-related properties Cold Lake Bitumen Diluted with Condensate
Flash Point (°C) Equipment Limit Equipment Limit-4.5 4 4
Emulsion Formation-Tendency and Stability @ 1 °C Tendency Index Likely Unlikely Unlikely Stability Index Entrained Unstable Unstable Water Content 41% 0% 23%Emulsion Formation-Tendency and Stability @ 14 °C Tendency Index Very likely Unlikely Unlikely Stability Index Meso-stable Unstable Unstable Water Content 53% 0% 0%ASTM Modified Distillation Liquid Vapour
Evaporation Temperature Temperature(% volume) (°C) (°C)
where: Fv is volume fraction of oil evaporatedθ is evaporative exposureTk is environmental temperature (K)
C1 = 12191C2 = 8.20C3 = 5239
ln[1 + (C1/Tk)θexp(C2-C3/Tk)](C1/Tk)
Properties and Fate of Hydrocarbons Associated with Hypothetical Spills at the Marine Terminal and in the Confined Channel Assessment Area Technical Data Report Section 3: Physical Property Tests: Results
Page 3-10 2010
1.0
10.0
100.0
1000.0
10000.0
100000.0
1000000.0
0 5 10 15 20
Percent Loss to Evaporation (volume)
Dyn
amic
Vis
cosi
ty
(at a
ppro
xim
atel
y 60
s-1
)
Viscosity @ 1°CViscosity @ 15°C
Figure 3-10 Effect of Evaporation on Viscosity: Cold Lake Bitumen Diluted with Condensate
0.930
0.940
0.950
0.960
0.970
0.980
0.990
1.000
0 5 10 15 20
Percent Loss to Evaporation (volume)
Den
sity
(g/c
m3)
Density @ 1°CDensity @ 15°C
Figure 3-11 Effect of Evaporation on Density: Cold Lake Bitumen Diluted with Condensate
Properties and Fate of Hydrocarbons Associated with Hypothetical Spills at the Marine Terminal and in the Confined Channel Assessment Area Technical Data Report Section 3: Physical Property Tests: Results
2010 Page 3-11
-30
-20
-10
0
0 5 10 15 20
Percent Loss to Evaporation (volume)
Pour
Poi
nt (°
C)
Figure 3-12 Effect of Evaporation on Pour Point: Cold Lake Bitumen Diluted with Condensate
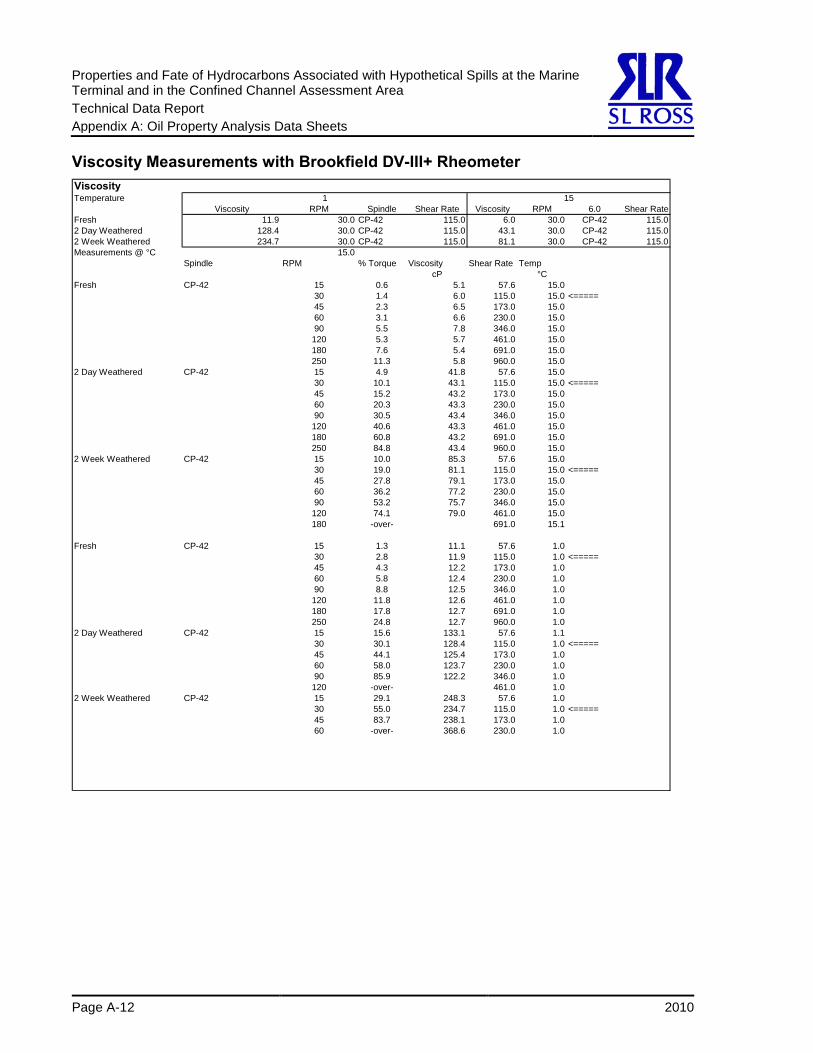
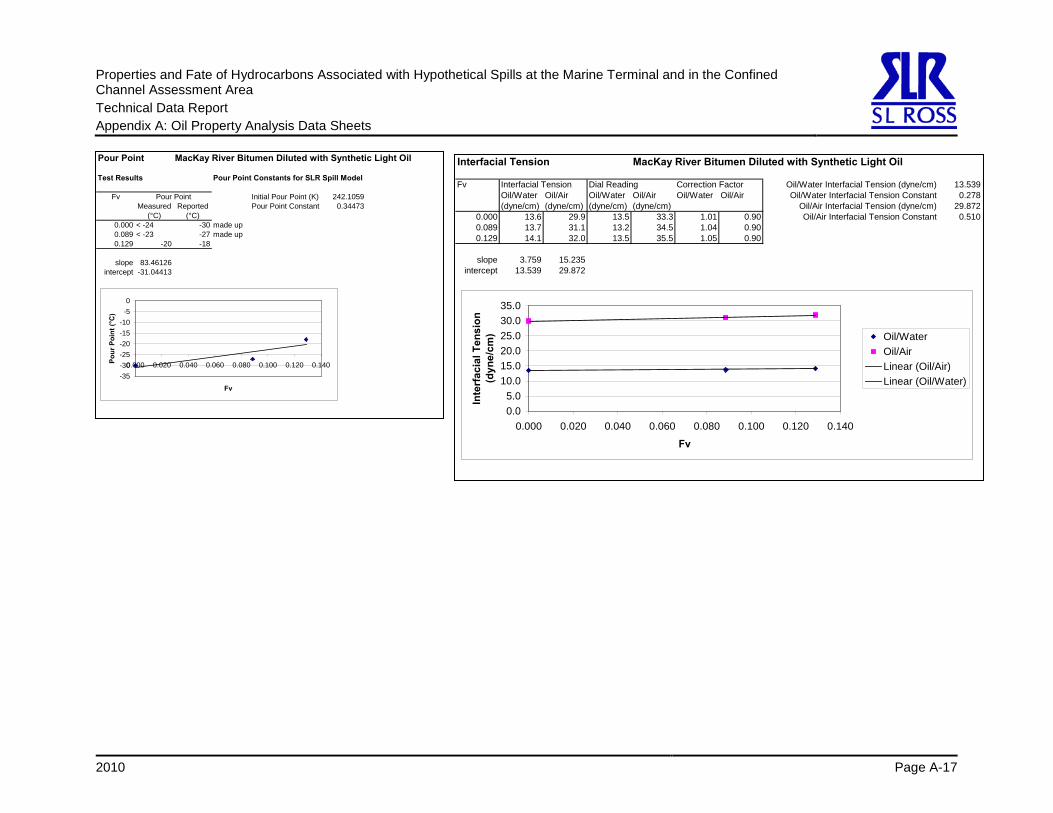
3.4 Properties of MacKay River Heavy Bitumen Diluted with Synthetic Light Oil
Table 3-4 provides a summary of the physical properties measured for the MacKay River Heavy bitumen diluted with synthetic light oil (MKH).
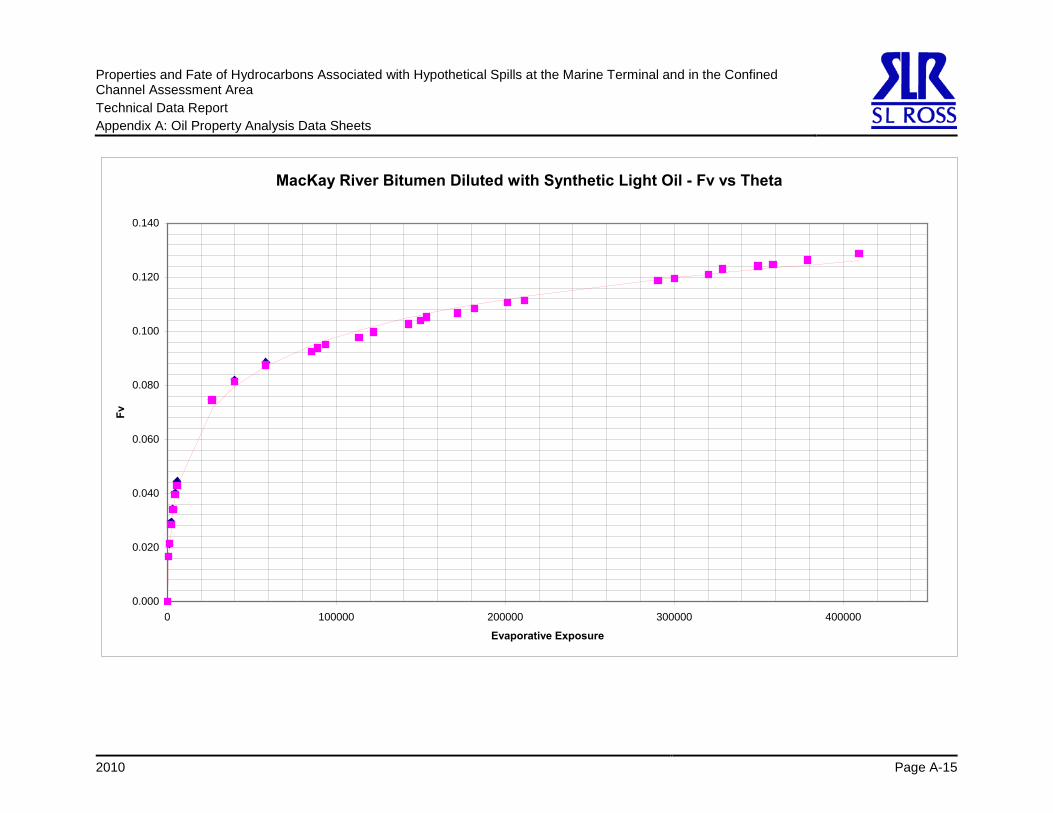
About 9% of the MKH evaporated after two days in the wind tunnel and about 13% evaporated after two weeks of exposure.
Figure 3-13 is a predicted evaporation curve for a MKH spill involving a 1-mm thick slick in a 10-m/s wind at 15°C. The curve applies only at a water temperature of 15°C. If other temperatures (or slick thicknesses and wind speeds) occur, these curves can be generated using the equations in Section 2.1 or with computerized oil spill models designed to do these calculations.
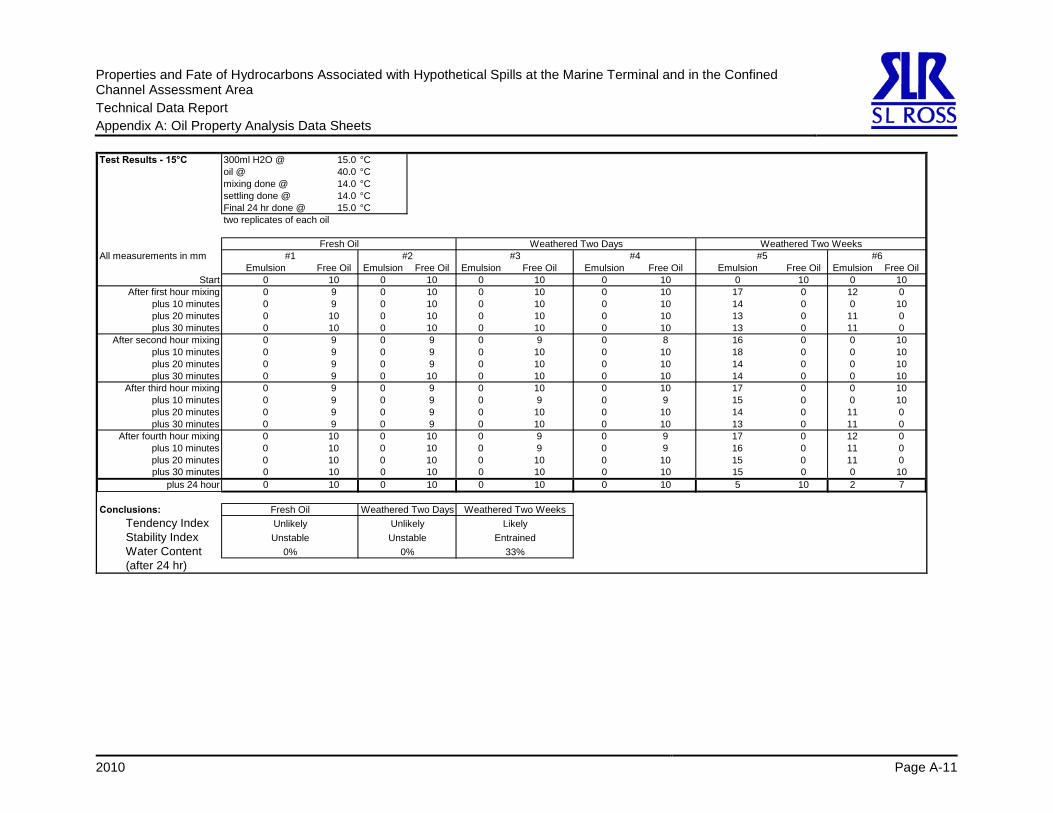
Figures 3-14, 3-15 and 3-16 show the effect of evaporation on the properties of oil viscosity, density and pour point on MKH. MKH will likely form stable emulsions when fresh and slightly weathered. If emulsions do not form during the early stages of the oil spill, they may not form after the oil has the opportunity to evaporate and become more viscous. In modelling spill scenarios, it has been assumed that emulsions will form at the time of the spill, to be conservative.
Properties and Fate of Hydrocarbons Associated with Hypothetical Spills at the Marine Terminal and in the Confined Channel Assessment Area Technical Data Report Section 3: Physical Property Tests: Results
Page 3-12 2010
Table 3-4 Spill-Related Properties of MacKay Heavy Bitumen Diluted with Synthetic Light Oil
Spill-related properties MacKay River Heavy Bitumen Diluted with Synthetic Light Oil
where: Fv is volume fraction of oil evaporatedθ is evaporative exposureTk is environmental temperature (K)
C1 = 14416C2 = 71.14C3 = 23665
ln[1 + (C1/Tk)θexp(C2-C3/Tk)](C1/Tk)
Properties and Fate of Hydrocarbons Associated with Hypothetical Spills at the Marine Terminal and in the Confined Channel Assessment Area Technical Data Report Section 3: Physical Property Tests: Results
Figure 3-13 Evaporation of MacKay River Heavy Bitumen Diluted with Synthetic Light Oil
1.0
10.0
100.0
1000.0
10000.0
100000.0
0 5 10 15
Percent Loss to Evaporation (volume)
Dyn
amic
Vis
cosi
ty
(at a
ppro
xim
atel
y 60
s-1
)
Viscosity @ 1°CViscosity @ 15°C
Figure 3-14 Effect of Evaporation on Viscosity: MacKay River Heavy Bitumen Diluted with Synthetic Light Oil
Properties and Fate of Hydrocarbons Associated with Hypothetical Spills at the Marine Terminal and in the Confined Channel Assessment Area Technical Data Report Section 3: Physical Property Tests: Results
Page 3-14 2010
0.940
0.945
0.950
0.955
0.960
0.965
0.970
0.975
0.980
0 5 10 15
Percent Loss to Evaporation (volume)
Den
sity
(g/c
m3)
Density @ 1°CDensity @ 15°C
Figure 3-15 Effect of Evaporation on Density: MacKay River Heavy Bitumen Diluted with Synthetic Light Oil
-30
-20
-10
0
10
20
0 5 10 15
Percent Loss to Evaporation (volume)
Pour
Poi
nt (°
C)
Figure 3-16 Effect of Evaporation on Pour Point: MacKay River Heavy Bitumen Diluted with Synthetic Light Oil
Properties and Fate of Hydrocarbons Associated with Hypothetical Spills at the Marine Terminal and in the Confined Channel Assessment Area Technical Data Report Section 3: Physical Property Tests: Results
2010 Page 3-15
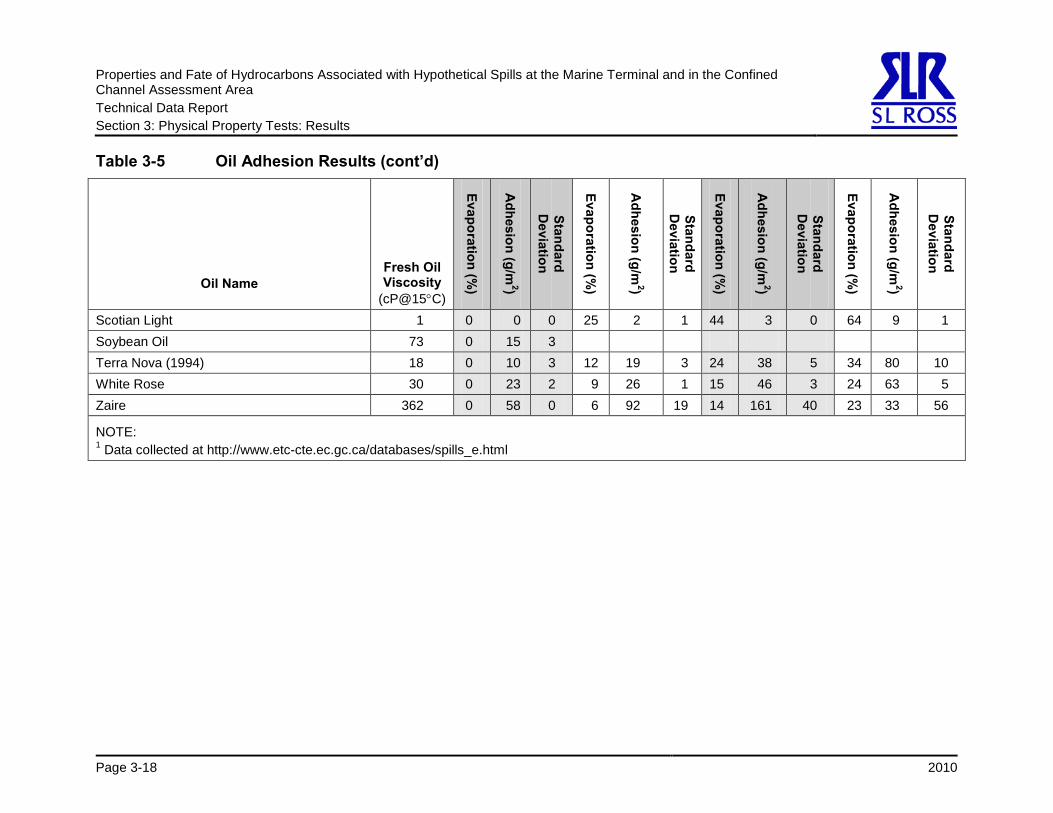
3.5 Comparison of Adhesion Results with Other Oils Adhesion tests were conducted on the fresh and weathered test oils to provide a guide to the “stickiness” of these oils if they were to come into contact with shorelines or infrastructure. The detailed oil adhesion measurements collected for the four oils are provided in Table 3-5. Adhesion values for a number of other relatively well-known oils (both when fresh and after artificial weathering) are also provided in this table for comparison. Adhesion values and standard deviations are provided for various weathered states of the oils (percent evaporated). The shading in Table 3-5 is used to separate the data by weathered oil state.
Properties and Fate of Hydrocarbons Associated with Hypothetical Spills at the Marine Terminal and in the Confined Channel Assessment Area Technical Data Report Section 3: Physical Property Tests: Results
Page 3-16 2010
Table 3-5 Oil Adhesion Results
Oil Name
Fresh Oil Viscosity
(cP@15°C)
Evaporation (%)
Adhesion (g/m
2)
Standard D
eviation
Evaporation (%)
Adhesion (g/m
2)
Standard D
eviation
Evaporation (%)
Adhesion (g/m
2)
Standard D
eviation
Evaporation (%)
Adhesion (g/m
2)
Standard D
eviation
Data Gathered for the Project Condensate (CRW) 0.6 0 2 1 57 3 1 75 16 1 Synthetic light oil (SYN) 6 0 18 2 24 40 4 30 19 5 Cold Lake bitumen-condensate (CLB) 368 0 98 3 14 146 6 17 131 7 MacKay River Heavy bitumen-synthetic (MKH) 242 0 52 7 9 57 18 13 60 12
Properties and Fate of Hydrocarbons Associated with Hypothetical Spills at the Marine Terminal and in the Confined Channel Assessment Area Technical Data Report Section 3: Physical Property Tests: Results
2010 Error! No text of specified style in document. Page 3-17
Properties and Fate of Hydrocarbons Associated with Hypothetical Spills at the Marine Terminal and in the Confined Channel Assessment Area Technical Data Report Section 3: Physical Property Tests: Results
NOTE: 1 Data collected at http://www.etc-cte.ec.gc.ca/databases/spills_e.html
Properties and Fate of Hydrocarbons Associated with Hypothetical Spills at the Marine Terminal and in the Confined Channel Assessment Area Technical Data Report Section 4: Fate Modelling for Marine Spills
2010 Page 4-1
4 Fate Modelling for Marine Spills
4.1 Background Two elements must be modelled in an oil spill scenario for use in spill response planning:
• the path that the oil travels • the properties or fate of the hydrocarbon as it travels
This section describes the properties or fate of the oil with time after a spill under the prevailing environmental conditions for the spill scenario. The fate and trajectory elements are inter-related, so the trajectory and oil property prediction results were determined to be consistent, compatible and ultimately integrated into a final product.
The following reasonable scenarios have been defined and modelled.
Instantaneous spills of 188 m3 of MKH, 188 m3 of SYN, 167 m3 of CRW and a 12 m3 spill of MKH have been considered for the loading terminal in Kitimat based on preliminary spill volumes provided by GEM in early 2008. Revised spill volumes have been calculated and are similar. For fate modelling, it has been assumed that the oil will be on the surface in the form of 1.0 m3 parcels of oil.
Three representative sites along the vessel traffic routes from the loading terminal to unrestricted waters have been selected to assess environmental effects and spill response. A spill size of 10,000 m3 has been selected for tanker spills due to grounding and 36,000 m3 for a collision. Results presented below are based on preliminary spill volumes of 10,000 m3 for all spill scenarios and as a minimum requirement for the purpose of spill response planning.
For oil fate modelling purposes, it has been assumed that the oil from these tanker spills will be on the surface in the form of individual parcels each with a volume of 50 m3. This is a reasonable volume given the initial rapid spill of oil, spreading characteristics and typical water currents in the CCAA (0.25 to 1.0 m/s). The locations of the spill sites for the scenarios are provided in Figure 4-1.
Oil fate modelling has been completed for each of the four spill sites for four seasons. The seasonal breakdown used in the analysis of the environmental data was as follows: winter (December, January and February), spring (March, April and May), summer (June, July and August) and fall (September, October and November). Oil fate models have been developed primarily for open ocean prediction of spill behaviour. The oil dispersion algorithms use wind speed as an indicator of sea roughness to determine the rate of oil loss from the surface. The relationship between wind speed and sea state used in these dispersion models is based on open ocean conditions. Spills in the CCAA will occur in waters with limited fetch when compared to the open ocean. To account for this, a wind reduction factor was developed by Hay and Company Consultants (Hayco) for each spill scenario. The factor reduces the wind speed used in the oil dispersion algorithm such that the sea state used in the oil fate modelling matches that in the limited fetch environment. The wind-reduction factors developed by Hayco for each of the sites and seasons are shown in Table 4-1.
BanksIsland
Princess RoyalIsland
AristazabalIsland
PittIsland
PorcherIsland
Estevan Sound
Squally Channel
WrightSound
BrowningEntrance
LaredoSound
Doug
las
Channel
Kitim
at Ar
m
Principe Channel
TripleIslands
SwindleIsland
PriceIsland
DowagerIsland
RoderickIslandFin
layso
nCha
nnel
Beachemin Channel
Laredo Channel
CampaniaSound
NepeanSound Otter
Channel Lewis P
assage
McCauleyIsland
StephensIsland
ChathamSound
AngerIsland
Hecate Strait
GoschenIsland
GurdIsland
DolphinIsland Spicer
Island
GilIsland
TrutchIsland
DewdneyIsland
RennisonIsland
GribbellIslandFarrant
Island
PromiseIsland
HawkesburyIsland
LorettaIsland
CosteIsland
KitkiataInlet
CaamañoSound
Campania Is.
Kitkatla Channel
KitamaatVillage
Kitimat
SkeenaPrince Rupert
Kitkatla
Hartley Bay
Klemtu
LakelseLake
Maitland Is.
PrincipeChannel
FinIsland
WrightSound
EmiliaIsland
Proposed Kitimat
Terminal
Ecstew
Terrace
NP
20100118Jacques Whitford AXYS Ltd.FIGURE NUMBER:
PROJECTION:
CONTRACTOR: DATE:
AUTHOR: APPROVED BY:PREPARED FOR:PREPARED BY: SCALE:Spill Example Locations in the Confined Channel Assessment Area
ENB R ID GE NO RT H ER N GA TE WA Y PR OJEC T
R:\20
09Fis
cal\1
0483
34_N
orthe
rnGate
way_
TDR_
2009
4-1
DATUM:
1:900,000 CM
NAD 83UTM 9
0 5 10 15 20
Kilometres
Reference: Pipeline Route R
JWA-1048334-2618
REFERENCES: NTDB Topographic Mapsheets provided by the Majesty the Queen in Right of Canada, Department of Natural Resources. All rights reserved.
Properties and Fate of Hydrocarbons Associated with Hypothetical Spills at the Marine Terminal and in the Confined Channel Assessment Area Technical Data Report Section 4: Fate Modelling for Marine Spills
2010 Page 4-3
Table 4-1 Meteorological Inputs for Fate Modelling
Site
Season
Average Wind Speed (m/s)
Average Tempair
(ºC)
Average Tempwater
(ºC)
Wind Factor
Reduced Wind Speed (m/s)
Emilia Island Winter 3.98 4.30 6.39 0.65 2.58 Spring 2.99 7.08 6.86 0.67 2.01 Summer 3.12 14.24 13.27 0.66 2.07 Fall 3.29 8.92 8.70 0.65 2.14
Hayco provided a representative average wind speed, and air and water temperatures for each spill location and season modelled. These data are shown in Table 4-1. These data were used in the SL Ross oil spill model (SLROSM), along with the specific oil property data collected from the oil analysis described in Section 3, to predict the general fate of the oil for each spill scenario.
Preliminary modelling has shown that the two diluted bitumen oils exhibit a similar long-term fate so only one, MKH, was included in the final detailed assessment. MKH is more likely to form a water-in-oil emulsion and, thus, is the more conservative choice of the two oils with respect to spill behaviour and response.
The general fate information (oil property changes with time, percentage evaporated and percentage dispersed) was then delivered to Hayco, who appended the oil fate results to a stochastic model. The stochastic model was used to select the most probable specific spill scenario for each location that matched the typical behaviour of spills in that season. A “real-time” time series of varying winds, water temperatures and air temperatures were selected by Hayco for specific spill scenario modelling in each of the four seasons. These time series of environmental conditions were used in oil fate modelling for specific scenarios, presented as mass balance figures in TERMPOL Section 3.15.
The general behaviour of the three oils considered are discussed based on the modelling results for one of the specific scenarios. This is followed by a series of graphs that summarize the fate predictions for each of the specific spill scenarios for the three oils selected for detailed fate assessment. Time histories of
Properties and Fate of Hydrocarbons Associated with Hypothetical Spills at the Marine Terminal and in the Confined Channel Assessment Area Technical Data Report Section 4: Fate Modelling for Marine Spills
Page 4-4 2010
slick width, emulsion water content, emulsion (or oil) viscosity, emulsion (or oil) density, percentage of oil evaporated and percentage of oil dispersed are provided for each spill location and season.
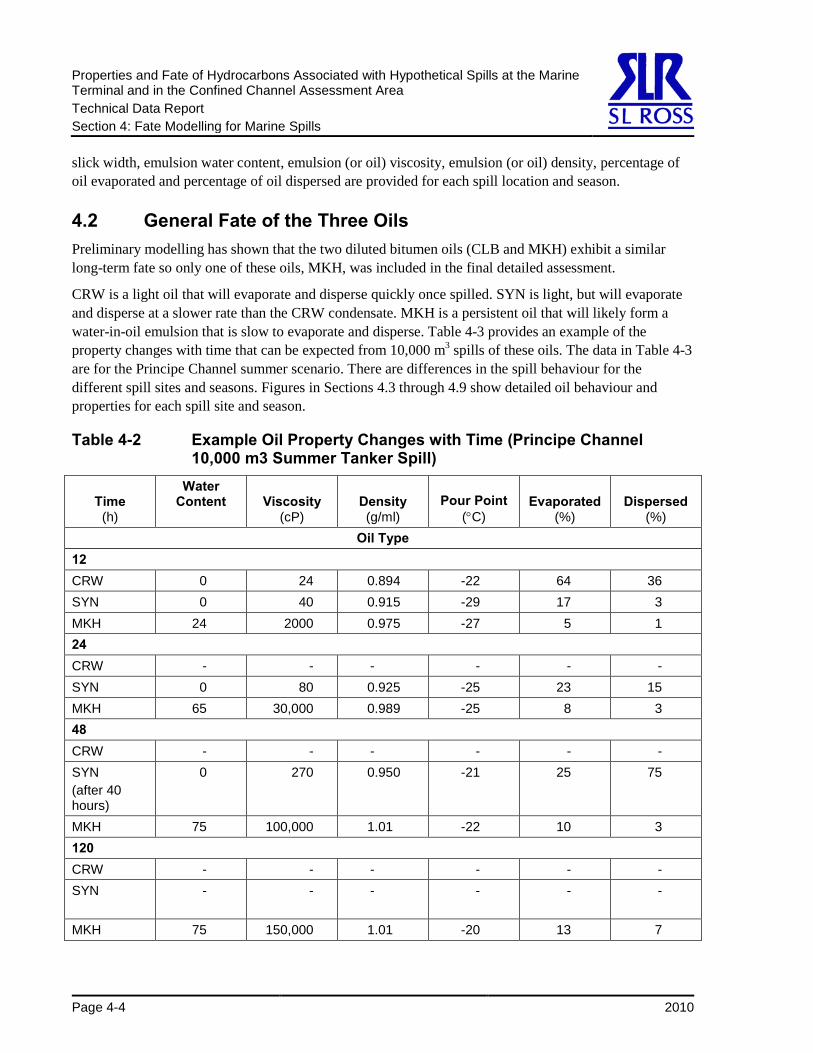
4.2 General Fate of the Three Oils Preliminary modelling has shown that the two diluted bitumen oils (CLB and MKH) exhibit a similar long-term fate so only one of these oils, MKH, was included in the final detailed assessment.
CRW is a light oil that will evaporate and disperse quickly once spilled. SYN is light, but will evaporate and disperse at a slower rate than the CRW condensate. MKH is a persistent oil that will likely form a water-in-oil emulsion that is slow to evaporate and disperse. Table 4-3 provides an example of the property changes with time that can be expected from 10,000 m3 spills of these oils. The data in Table 4-3 are for the Principe Channel summer scenario. There are differences in the spill behaviour for the different spill sites and seasons. Figures in Sections 4.3 through 4.9 show detailed oil behaviour and properties for each spill site and season.
Table 4-2 Example Oil Property Changes with Time (Principe Channel 10,000 m3 Summer Tanker Spill)
Properties and Fate of Hydrocarbons Associated with Hypothetical Spills at the Marine Terminal and in the Confined Channel Assessment Area Technical Data Report Section 4: Fate Modelling for Marine Spills
2010 Page 4-5
The following general observations can be made regarding the oil properties shown in Table 4-3:
• The only oil that is likely to emulsify is MKH. If this oil emulsifies, it will attain very high viscosities and densities. It is unlikely to sink in a marine environment, but will be easily overwashed by water. About 80% of the oil from spills will be on the surface after 120 hours under summer conditions at the Principe Channel site.
• The CRW will completely evaporate and disperse after about a 12-hour exposure.
• The SYN will survive on the surface for about 95 hours with 27% of the oil evaporating and 73% dispersing over this time.
None of the oils will reach pour points where the oil will be a semi-solid at ambient temperatures.
4.3 Hypothetical Marine Terminal Spill, Oil Fate Results The figures in Section 4.3 show detailed oil behaviour and properties for the hypothetical marine terminal spill scenario for each season, as follows:
• summer – Figures 4-2 to 4-7 • fall – Figures 4-8 to 4-13 • winter – Figures 4-14 to 4-19 • spring – Figures 4-20 to 4-25
4.3.1 Hypothetical Summer Spill Seasonal average environmental input data used for the summer scenarios have been derived from the months of June, July and August. The MRB short form used in these figures is equivalent to MKH - MacKay River Heavy bitumen used elsewhere in the modelling.
Properties and Fate of Hydrocarbons Associated with Hypothetical Spills at the Marine Terminal and in the Confined Channel Assessment Area Technical Data Report Section 4: Fate Modelling for Marine Spills
Properties and Fate of Hydrocarbons Associated with Hypothetical Spills at the Marine Terminal and in the Confined Channel Assessment Area Technical Data Report Section 4: Fate Modelling for Marine Spills
2010 Page 4-7
Oil or Emulsion Density (Summer Terminal Scenario)
0.7
0.8
0.9
1
1.1
0 6 12 18 24 30 36Time from Spill (hours)
Den
sity
(g/m
l) SYNMRBCRW
Figure 4-5 Marine Terminal Scenario (Summer) – Oil or Emulsion Density
Emulsion Water Content (Summer Terminal Scenario)
0
25
50
75
0 6 12 18 24 30 36Time from Spill (hours)
Emul
sion
Wat
er C
onte
nt
(%)
SYNMRBCRW
Figure 4-6 Marine Terminal Scenario (Summer) – Emulsion Water Content
Properties and Fate of Hydrocarbons Associated with Hypothetical Spills at the Marine Terminal and in the Confined Channel Assessment Area Technical Data Report Section 4: Fate Modelling for Marine Spills
4.3.2 Hypothetical Fall Spill Seasonal average environmental input data used for the fall scenarios have been derived from the months of September, October and November. The MRB short form used in these figures is equivalent to MKH- MacKay River Heavy bitumen used elsewhere in the modelling.
Properties and Fate of Hydrocarbons Associated with Hypothetical Spills at the Marine Terminal and in the Confined Channel Assessment Area Technical Data Report Section 4: Fate Modelling for Marine Spills
Properties and Fate of Hydrocarbons Associated with Hypothetical Spills at the Marine Terminal and in the Confined Channel Assessment Area Technical Data Report Section 4: Fate Modelling for Marine Spills
Page 4-10 2010
Oil or Emulsion Density (Fall Terminal Scenario)
0.7
0.8
0.9
1
1.1
0 6 12 18 24 30 36Time from Spill (hours)
Den
sity
(g/m
l) SYNMRBCRW
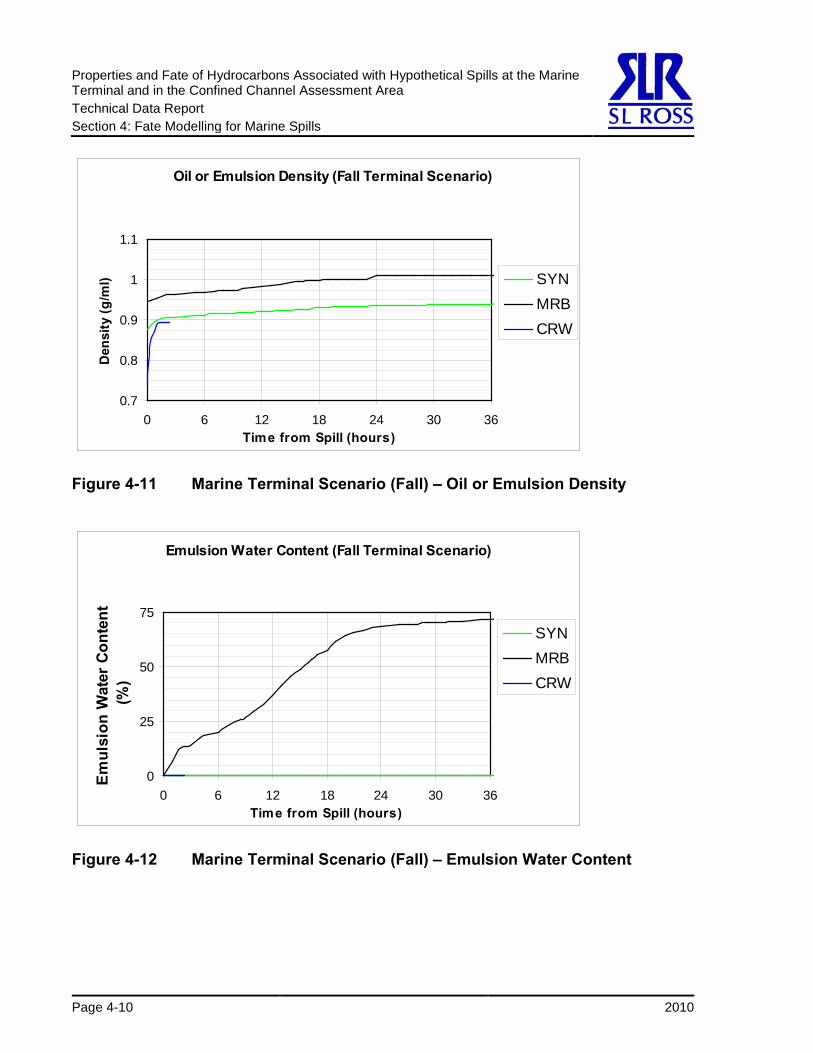
Figure 4-11 Marine Terminal Scenario (Fall) – Oil or Emulsion Density
Emulsion Water Content (Fall Terminal Scenario)
0
25
50
75
0 6 12 18 24 30 36Time from Spill (hours)
Emul
sion
Wat
er C
onte
nt
(%)
SYNMRBCRW
Figure 4-12 Marine Terminal Scenario (Fall) – Emulsion Water Content
Properties and Fate of Hydrocarbons Associated with Hypothetical Spills at the Marine Terminal and in the Confined Channel Assessment Area Technical Data Report Section 4: Fate Modelling for Marine Spills
4.3.3 Hypothetical Winter Spill Seasonal average environmental input data used for the winter scenarios have been derived from the months of December, January and February. The MRB short form used in these figures is equivalent to MKH- MacKay River Heavy bitumen used elsewhere in the modelling.
Properties and Fate of Hydrocarbons Associated with Hypothetical Spills at the Marine Terminal and in the Confined Channel Assessment Area Technical Data Report Section 4: Fate Modelling for Marine Spills
Properties and Fate of Hydrocarbons Associated with Hypothetical Spills at the Marine Terminal and in the Confined Channel Assessment Area Technical Data Report Section 4: Fate Modelling for Marine Spills
2010 Page 4-13
Oil or Emulsion Density (Winter Terminal Scenario)
0.7
0.8
0.9
1
1.1
0 6 12 18 24 30 36Time from Spill (hours)
Den
sity
(g/m
l) SYNMRBCRW
Figure 4-17 Marine Terminal Scenario (Winter) – Oil or Emulsion Density
Emulsion Water Content (Winter Terminal Scenario)
0
25
50
75
0 6 12 18 24 30 36Time from Spill (hours)
Emul
sion
Wat
er C
onte
nt
(%)
SYNMRBCRW
Figure 4-18 Marine Terminal Scenario (Winter) – Emulsion Water Content
Properties and Fate of Hydrocarbons Associated with Hypothetical Spills at the Marine Terminal and in the Confined Channel Assessment Area Technical Data Report Section 4: Fate Modelling for Marine Spills
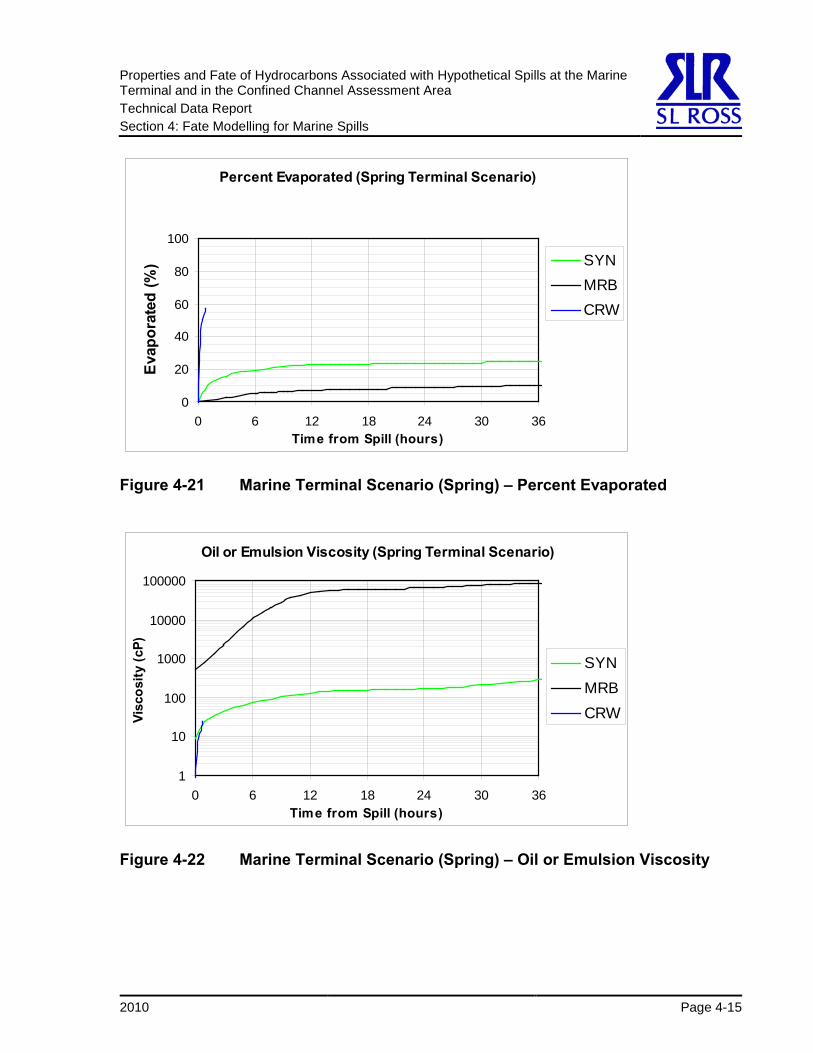
4.3.4 Hypothetical Spring Spill Seasonal average environmental input data used for the spring scenarios have been derived from the months of March, April and May. The MRB short form used in these figures is equivalent to MKH- MacKay River Heavy bitumen used elsewhere in the modelling.
Properties and Fate of Hydrocarbons Associated with Hypothetical Spills at the Marine Terminal and in the Confined Channel Assessment Area Technical Data Report Section 4: Fate Modelling for Marine Spills
Properties and Fate of Hydrocarbons Associated with Hypothetical Spills at the Marine Terminal and in the Confined Channel Assessment Area Technical Data Report Section 4: Fate Modelling for Marine Spills
Page 4-16 2010
Oil or Emulsion Density (Spring Terminal Scenario)
0.7
0.8
0.9
1
1.1
0 6 12 18 24 30 36Time from Spill (hours)
Den
sity
(g/m
l) SYNMRBCRW
Figure 4-23 Marine Terminal Scenario (Spring) – Oil or Emulsion Density
Emulsion Water Content (Spring Terminal Scenario)
0
25
50
75
0 6 12 18 24 30 36Time from Spill (hours)
Emul
sion
Wat
er C
onte
nt
(%)
SYNMRBCRW
Figure 4-24 Marine Terminal Scenario (Spring) – Emulsion Water Content
Properties and Fate of Hydrocarbons Associated with Hypothetical Spills at the Marine Terminal and in the Confined Channel Assessment Area Technical Data Report Section 4: Fate Modelling for Marine Spills
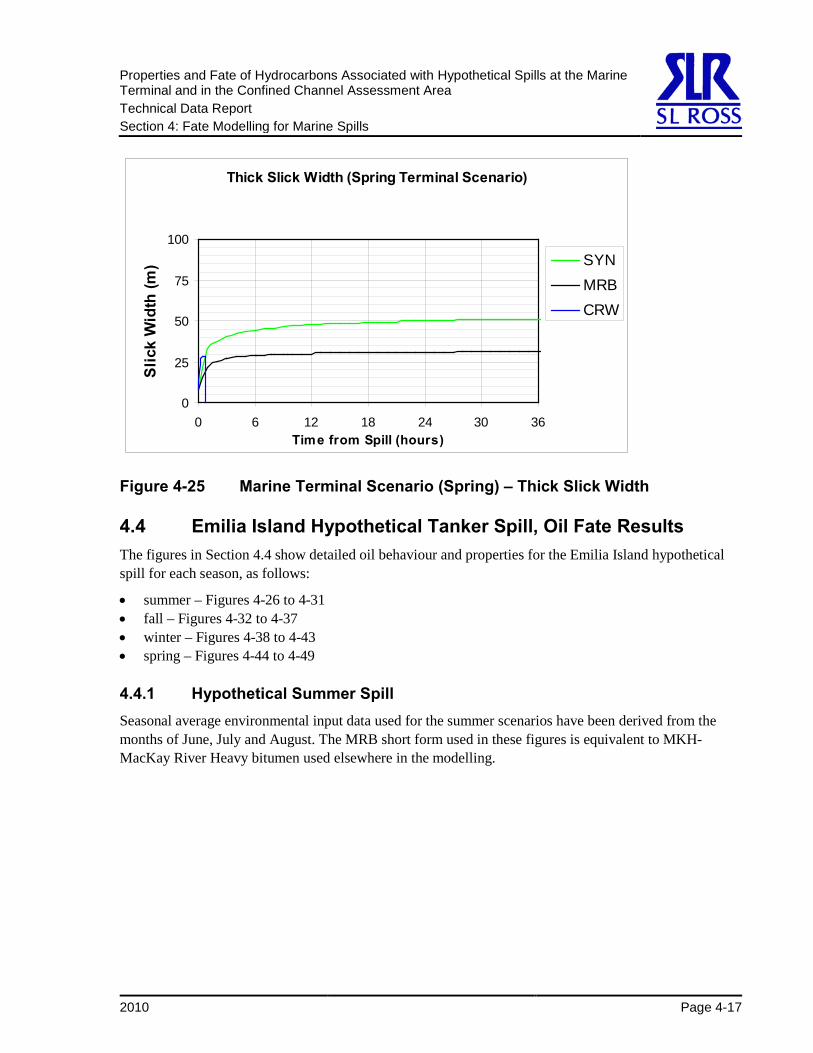
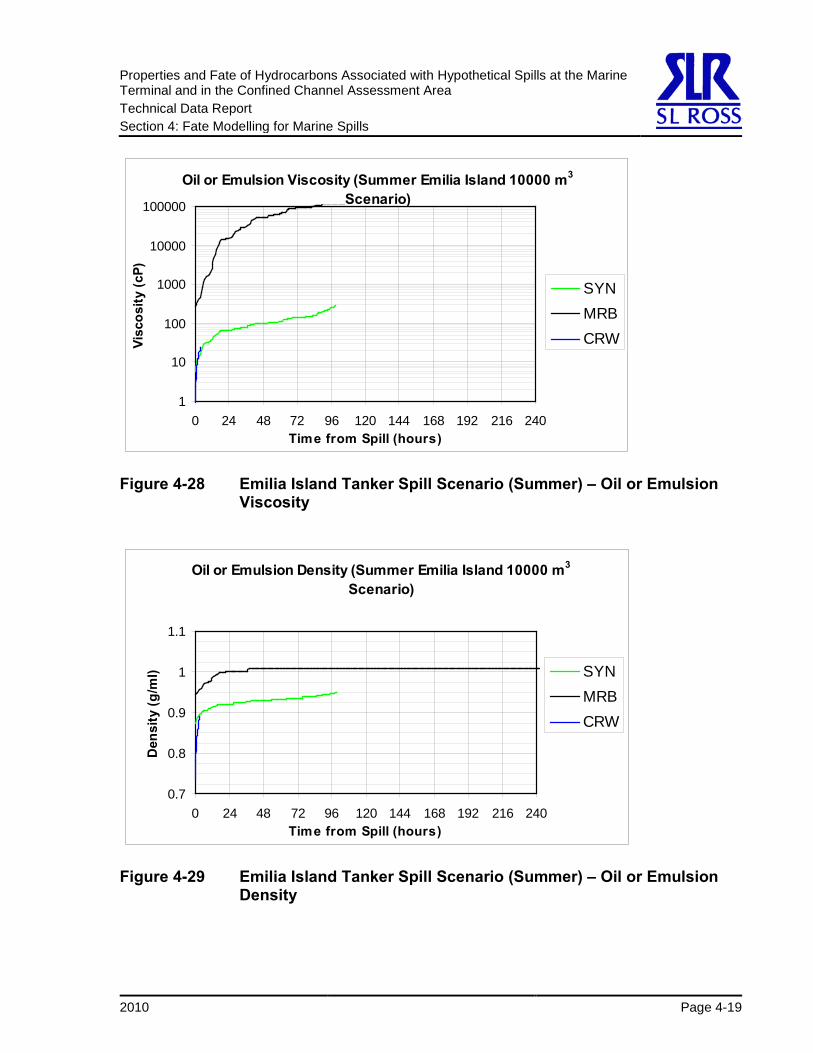
4.4 Emilia Island Hypothetical Tanker Spill, Oil Fate Results The figures in Section 4.4 show detailed oil behaviour and properties for the Emilia Island hypothetical spill for each season, as follows:
• summer – Figures 4-26 to 4-31 • fall – Figures 4-32 to 4-37 • winter – Figures 4-38 to 4-43 • spring – Figures 4-44 to 4-49
4.4.1 Hypothetical Summer Spill Seasonal average environmental input data used for the summer scenarios have been derived from the months of June, July and August. The MRB short form used in these figures is equivalent to MKH- MacKay River Heavy bitumen used elsewhere in the modelling.
Properties and Fate of Hydrocarbons Associated with Hypothetical Spills at the Marine Terminal and in the Confined Channel Assessment Area Technical Data Report Section 4: Fate Modelling for Marine Spills
Properties and Fate of Hydrocarbons Associated with Hypothetical Spills at the Marine Terminal and in the Confined Channel Assessment Area Technical Data Report Section 4: Fate Modelling for Marine Spills
2010 Page 4-19
Oil or Emulsion Viscosity (Summer Emilia Island 10000 m3
Figure 4-29 Emilia Island Tanker Spill Scenario (Summer) – Oil or Emulsion Density
Properties and Fate of Hydrocarbons Associated with Hypothetical Spills at the Marine Terminal and in the Confined Channel Assessment Area Technical Data Report Section 4: Fate Modelling for Marine Spills
Page 4-20 2010
Emulsion Water Content (Summer Emilia Island 10000 m3
Properties and Fate of Hydrocarbons Associated with Hypothetical Spills at the Marine Terminal and in the Confined Channel Assessment Area Technical Data Report Section 4: Fate Modelling for Marine Spills
2010 Page 4-21
4.4.2 Hypothetical Fall Spill Seasonal average environmental input data used for the fall scenarios have been derived from the months of September, October and November. The MRB short form used in these figures is equivalent to MKH- MacKay River Heavy bitumen used elsewhere in the modelling.
Percent Dispersed (Fall Emilia Island 10000 m3 Scenario)
Properties and Fate of Hydrocarbons Associated with Hypothetical Spills at the Marine Terminal and in the Confined Channel Assessment Area Technical Data Report Section 4: Fate Modelling for Marine Spills
Page 4-22 2010
Oil or Emulsion Viscosity (Fall Emilia Island 10000 m3
Figure 4-35 Emilia Island Tanker Spill Scenario (Fall) – Oil or Emulsion Density
Properties and Fate of Hydrocarbons Associated with Hypothetical Spills at the Marine Terminal and in the Confined Channel Assessment Area Technical Data Report Section 4: Fate Modelling for Marine Spills
2010 Page 4-23
Emulsion Water Content (Fall Emilia Island 10000 m3
Properties and Fate of Hydrocarbons Associated with Hypothetical Spills at the Marine Terminal and in the Confined Channel Assessment Area Technical Data Report Section 4: Fate Modelling for Marine Spills
Page 4-24 2010
4.4.3 Hypothetical Winter Spill Seasonal average environmental input data used for the winter scenarios have been derived from the months of December, January and February. The MRB short form used in these figures is equivalent to MKH- MacKay River Heavy bitumen used elsewhere in the modelling.
Properties and Fate of Hydrocarbons Associated with Hypothetical Spills at the Marine Terminal and in the Confined Channel Assessment Area Technical Data Report Section 4: Fate Modelling for Marine Spills
2010 Page 4-25
Oil or Emulsion Viscosity (Winter Emilia Island 10000 m3
Figure 4-41 Emilia Island Tanker Spill Scenario (Winter) – Oil or Emulsion Density
Properties and Fate of Hydrocarbons Associated with Hypothetical Spills at the Marine Terminal and in the Confined Channel Assessment Area Technical Data Report Section 4: Fate Modelling for Marine Spills
Page 4-26 2010
Emulsion Water Content (Winter Emilia Island 10000 m3
Properties and Fate of Hydrocarbons Associated with Hypothetical Spills at the Marine Terminal and in the Confined Channel Assessment Area Technical Data Report Section 4: Fate Modelling for Marine Spills
2010 Page 4-27
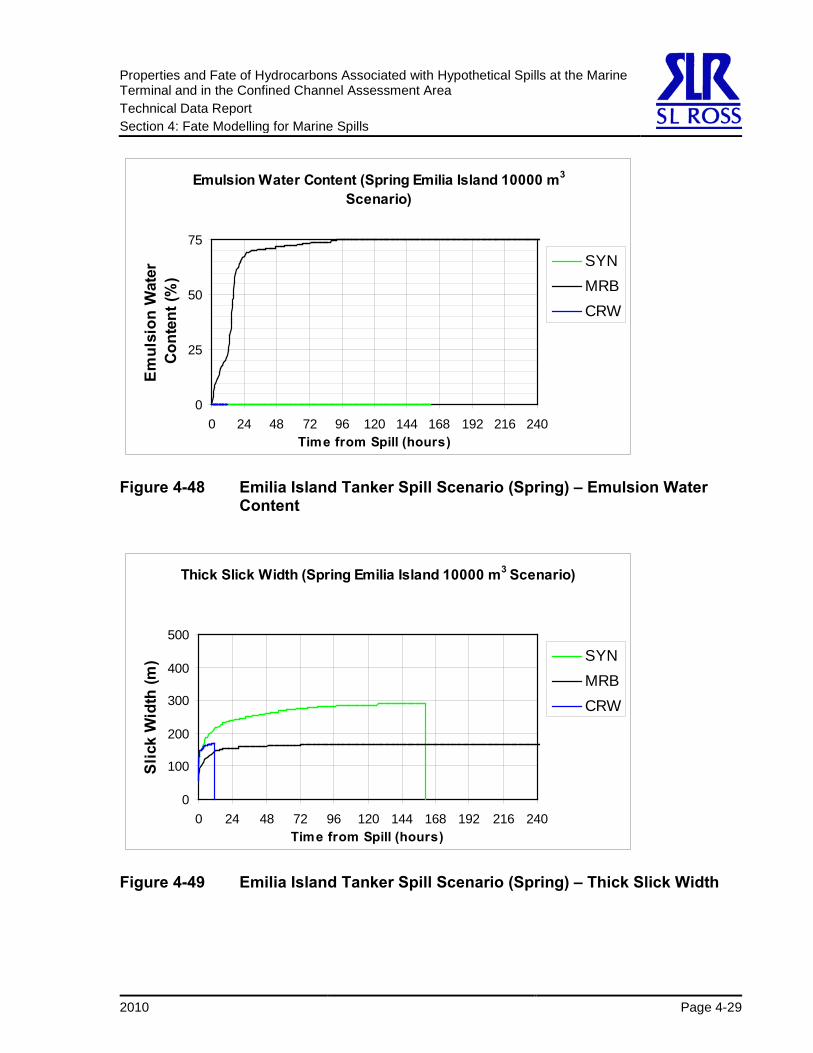
4.4.4 Hypothetical Spring Spill Seasonal average environmental input data used for the spring scenarios have been derived from the months of March, April and May. The MRB short form used in these figures is equivalent to MKH- MacKay River Heavy bitumen used elsewhere in the modelling.
Properties and Fate of Hydrocarbons Associated with Hypothetical Spills at the Marine Terminal and in the Confined Channel Assessment Area Technical Data Report Section 4: Fate Modelling for Marine Spills
Page 4-28 2010
Oil or Emulsion Viscosity (Spring Emilia Island 10000 m3
Figure 4-47 Emilia Island Tanker Spill Scenario (Spring) – Oil or Emulsion Density
Properties and Fate of Hydrocarbons Associated with Hypothetical Spills at the Marine Terminal and in the Confined Channel Assessment Area Technical Data Report Section 4: Fate Modelling for Marine Spills
2010 Page 4-29
Emulsion Water Content (Spring Emilia Island 10000 m3
Properties and Fate of Hydrocarbons Associated with Hypothetical Spills at the Marine Terminal and in the Confined Channel Assessment Area Technical Data Report Section 4: Fate Modelling for Marine Spills
Page 4-30 2010
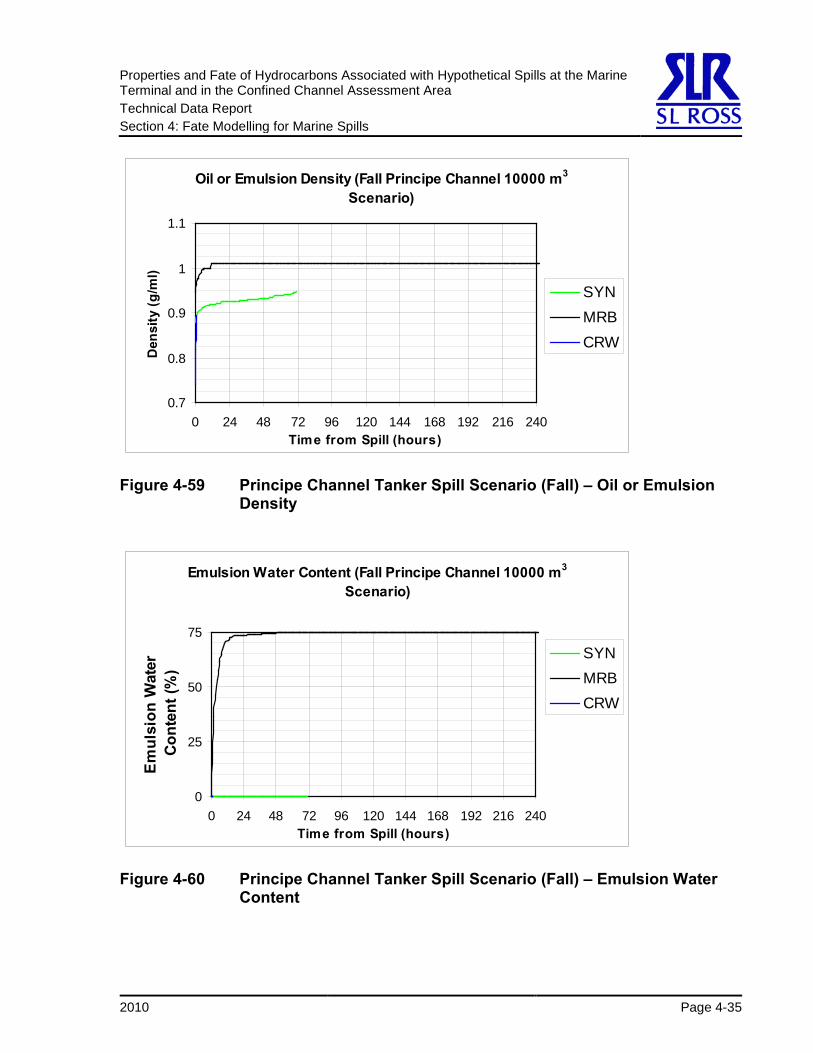
4.5 Principe Channel Hypothetical Tanker Spill, Oil Fate Results The figures in Section 4.5 show detailed oil behaviour and properties for the Principe Channel hypothetical tanker spill for each season, as follows:
• summer – Figures 4-50 to 4-55 • fall – Figures 4-56 to 4-61 • winter – Figures 4-62 to 4-67 • spring – Figures 4-68 to 4-73
4.5.1 Hypothetical Summer Spill Seasonal average environmental input data used for the summer scenarios have been derived from the months of June, July and August. The MRB short form used in these figures is equivalent to MKH- MacKay River Heavy bitumen used elsewhere in the modelling.
Properties and Fate of Hydrocarbons Associated with Hypothetical Spills at the Marine Terminal and in the Confined Channel Assessment Area Technical Data Report Section 4: Fate Modelling for Marine Spills
Properties and Fate of Hydrocarbons Associated with Hypothetical Spills at the Marine Terminal and in the Confined Channel Assessment Area Technical Data Report Section 4: Fate Modelling for Marine Spills
Page 4-32 2010
Oil or Emulsion Density (Summer Principe Channel 10000 m3 Scenario)
Properties and Fate of Hydrocarbons Associated with Hypothetical Spills at the Marine Terminal and in the Confined Channel Assessment Area Technical Data Report Section 4: Fate Modelling for Marine Spills
4.5.2 Hypothetical Fall Spill Seasonal average environmental input data used for the fall scenarios have been derived from the months of September, October and November. The MRB short form used in these figures is equivalent to MKH- MacKay River Heavy bitumen used elsewhere in the modelling.
Properties and Fate of Hydrocarbons Associated with Hypothetical Spills at the Marine Terminal and in the Confined Channel Assessment Area Technical Data Report Section 4: Fate Modelling for Marine Spills
Properties and Fate of Hydrocarbons Associated with Hypothetical Spills at the Marine Terminal and in the Confined Channel Assessment Area Technical Data Report Section 4: Fate Modelling for Marine Spills
2010 Page 4-35
Oil or Emulsion Density (Fall Principe Channel 10000 m3
Properties and Fate of Hydrocarbons Associated with Hypothetical Spills at the Marine Terminal and in the Confined Channel Assessment Area Technical Data Report Section 4: Fate Modelling for Marine Spills
4.5.3 Hypothetical Winter Spill Seasonal average environmental input data used for the winter scenarios have been derived from the months of December, January and February. The MRB short form used in these figures is equivalent to MKH- MacKay River Heavy bitumen used elsewhere in the modelling.
Properties and Fate of Hydrocarbons Associated with Hypothetical Spills at the Marine Terminal and in the Confined Channel Assessment Area Technical Data Report Section 4: Fate Modelling for Marine Spills
Properties and Fate of Hydrocarbons Associated with Hypothetical Spills at the Marine Terminal and in the Confined Channel Assessment Area Technical Data Report Section 4: Fate Modelling for Marine Spills
Page 4-38 2010
Oil or Emulsion Density (Winter Principe Channel 10000 m3
Properties and Fate of Hydrocarbons Associated with Hypothetical Spills at the Marine Terminal and in the Confined Channel Assessment Area Technical Data Report Section 4: Fate Modelling for Marine Spills
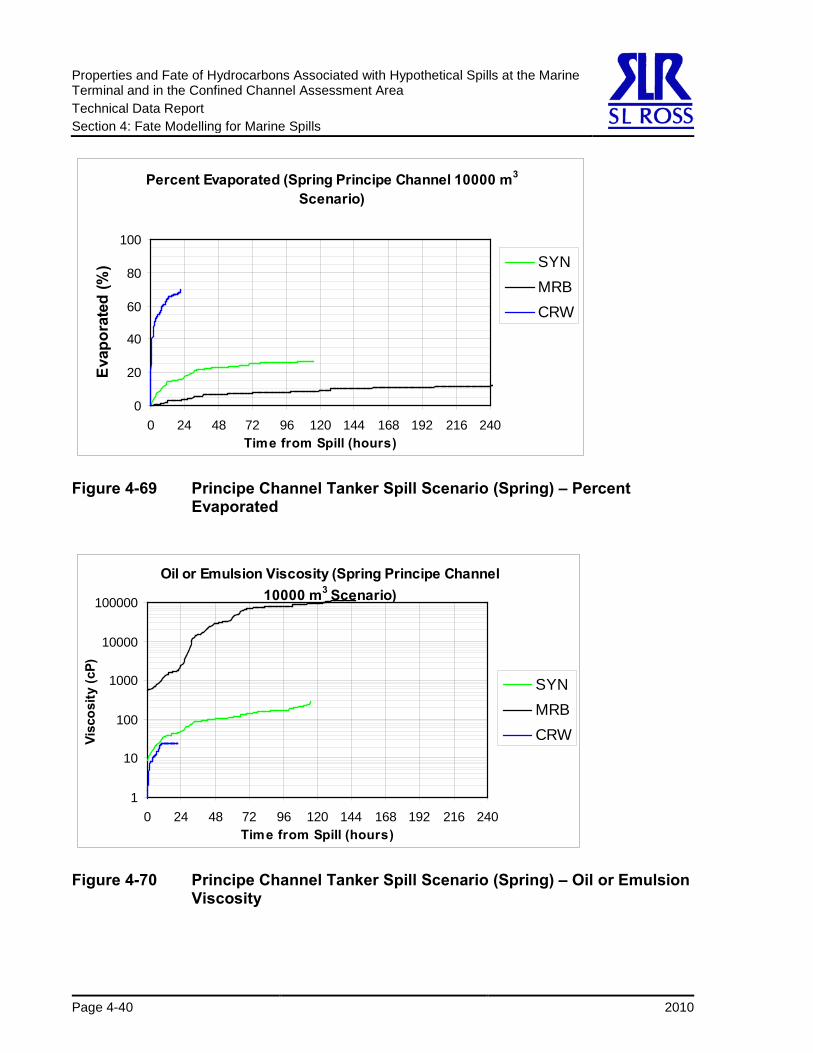
4.5.4 Hypothetical Spring Spill Seasonal average environmental input data used for the spring scenarios have been derived from the months of March, April and May. The MRB short form used in these figures is equivalent to MKH- MacKay River Heavy bitumen used elsewhere in the modelling.
Properties and Fate of Hydrocarbons Associated with Hypothetical Spills at the Marine Terminal and in the Confined Channel Assessment Area Technical Data Report Section 4: Fate Modelling for Marine Spills
Properties and Fate of Hydrocarbons Associated with Hypothetical Spills at the Marine Terminal and in the Confined Channel Assessment Area Technical Data Report Section 4: Fate Modelling for Marine Spills
2010 Page 4-41
Oil or Emulsion Density (Spring Principe Channel 10000 m3
Properties and Fate of Hydrocarbons Associated with Hypothetical Spills at the Marine Terminal and in the Confined Channel Assessment Area Technical Data Report Section 4: Fate Modelling for Marine Spills
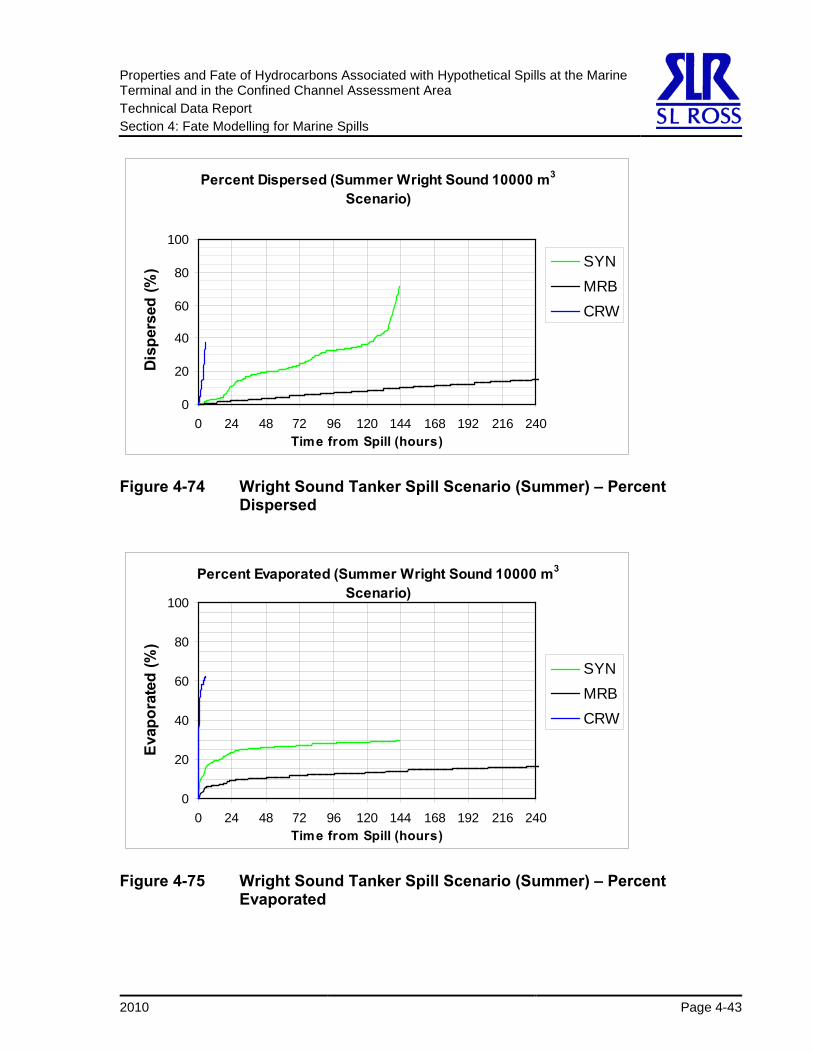
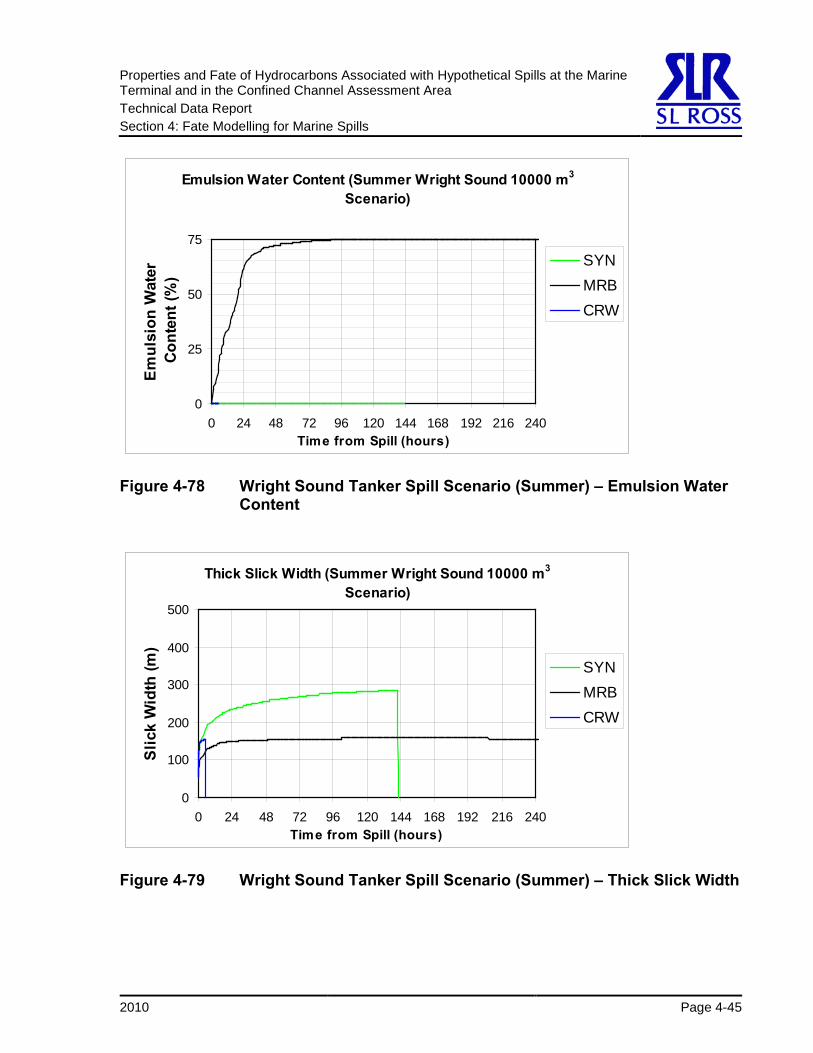
4.6 Wright Sound Hypothetical Tanker Spill, Oil Fate Results The figures in Section 4.6 show detailed oil behaviour and properties for the Wright Sound hypothetical tanker spill for each season, as follows:
• summer – Figures 4-74 to 4-79 • fall – Figures 4-80 to 4-85 • winter – Figures 4-86 to 4-91 • spring – Figures 4-92 to 4-97
A spill size of 10,000 m3 was initially selected for tanker spills. Although mass balance results presented in TERMPOL Section 3.15 are based on a 36,000 m3 spill scenario, the results shown there incorporate information from the results below for the purpose of spill response planning.
4.6.1 Hypothetical Summer Spill Seasonal average environmental input data used for the summer scenarios have been derived from the months of June, July and August. The MRB short form used in these figures is equivalent to MKH- MacKay River Heavy bitumen used elsewhere in the modelling.
Properties and Fate of Hydrocarbons Associated with Hypothetical Spills at the Marine Terminal and in the Confined Channel Assessment Area Technical Data Report Section 4: Fate Modelling for Marine Spills
Properties and Fate of Hydrocarbons Associated with Hypothetical Spills at the Marine Terminal and in the Confined Channel Assessment Area Technical Data Report Section 4: Fate Modelling for Marine Spills
Page 4-44 2010
Oil or Emulsion Viscosity (Summer Wright Sound 10000 m3
Figure 4-77 Wright Sound Tanker Spill Scenario (Summer) – Oil or Emulsion Density
Properties and Fate of Hydrocarbons Associated with Hypothetical Spills at the Marine Terminal and in the Confined Channel Assessment Area Technical Data Report Section 4: Fate Modelling for Marine Spills
2010 Page 4-45
Emulsion Water Content (Summer Wright Sound 10000 m3
Properties and Fate of Hydrocarbons Associated with Hypothetical Spills at the Marine Terminal and in the Confined Channel Assessment Area Technical Data Report Section 4: Fate Modelling for Marine Spills
Page 4-46 2010
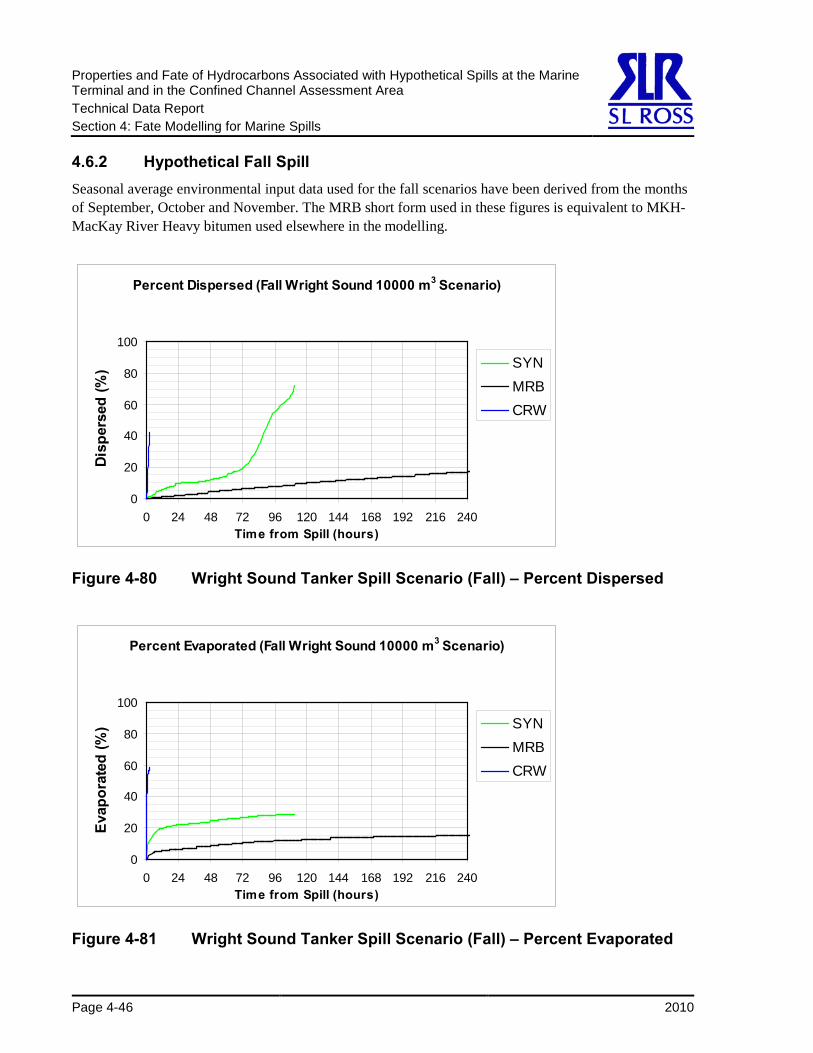
4.6.2 Hypothetical Fall Spill Seasonal average environmental input data used for the fall scenarios have been derived from the months of September, October and November. The MRB short form used in these figures is equivalent to MKH- MacKay River Heavy bitumen used elsewhere in the modelling.
Properties and Fate of Hydrocarbons Associated with Hypothetical Spills at the Marine Terminal and in the Confined Channel Assessment Area Technical Data Report Section 4: Fate Modelling for Marine Spills
2010 Page 4-47
Oil or Emulsion Viscosity (Fall Wright Sound 10000 m3
Properties and Fate of Hydrocarbons Associated with Hypothetical Spills at the Marine Terminal and in the Confined Channel Assessment Area Technical Data Report Section 4: Fate Modelling for Marine Spills
Page 4-48 2010
Emulsion Water Content (Fall Wright Sound 10000 m3
Properties and Fate of Hydrocarbons Associated with Hypothetical Spills at the Marine Terminal and in the Confined Channel Assessment Area Technical Data Report Section 4: Fate Modelling for Marine Spills
2010 Page 4-49
4.6.3 Hypothetical Winter Spill Seasonal average environmental input data used for the winter scenarios have been derived from the months of December, January and February. The MRB short form used in these figures is equivalent to MKH- MacKay River Heavy bitumen used elsewhere in the modelling.
Properties and Fate of Hydrocarbons Associated with Hypothetical Spills at the Marine Terminal and in the Confined Channel Assessment Area Technical Data Report Section 4: Fate Modelling for Marine Spills
Page 4-50 2010
Oil or Emulsion Viscosity (Winter Wright Sound 10000 m3
Figure 4-89 Wright Sound Tanker Spill Scenario (Winter) – Oil or Emulsion Density
Properties and Fate of Hydrocarbons Associated with Hypothetical Spills at the Marine Terminal and in the Confined Channel Assessment Area Technical Data Report Section 4: Fate Modelling for Marine Spills
2010 Page 4-51
Emulsion Water Content (Winter Wright Sound 10000 m3
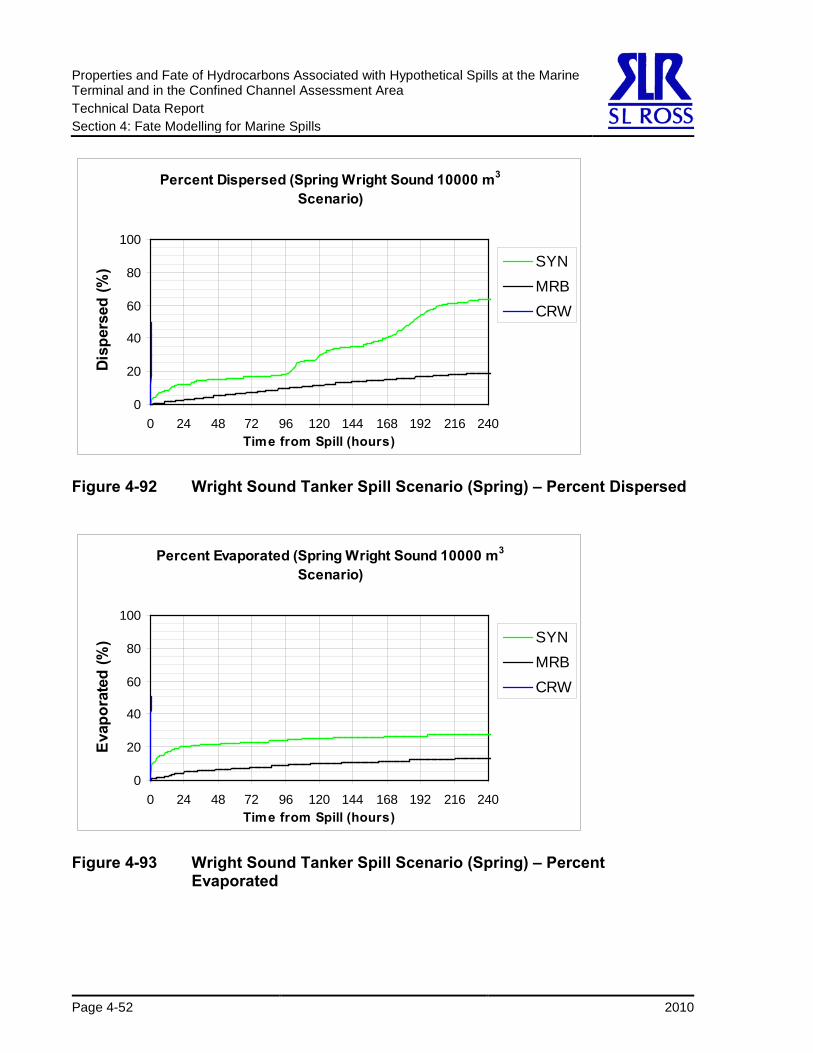
4.6.4 Hypothetical Spring Spill Seasonal average environmental input data used for the spring scenarios have been derived from the months of March, April and May. The MRB short form used in these figures is equivalent to MKH- MacKay River Heavy bitumen used elsewhere in the modelling.
Properties and Fate of Hydrocarbons Associated with Hypothetical Spills at the Marine Terminal and in the Confined Channel Assessment Area Technical Data Report Section 4: Fate Modelling for Marine Spills
Properties and Fate of Hydrocarbons Associated with Hypothetical Spills at the Marine Terminal and in the Confined Channel Assessment Area Technical Data Report Section 4: Fate Modelling for Marine Spills
2010 Page 4-53
Oil or Emulsion Viscosity (Spring Wright Sound 10000 m3
Figure 4-95 Wright Sound Tanker Spill Scenario (Spring) – Oil or Emulsion Density
Properties and Fate of Hydrocarbons Associated with Hypothetical Spills at the Marine Terminal and in the Confined Channel Assessment Area Technical Data Report Section 4: Fate Modelling for Marine Spills
Page 4-54 2010
Emulsion Water Content (Spring Wright Sound 10000 m3
Properties and Fate of Hydrocarbons Associated with Hypothetical Spills at the Marine Terminal and in the Confined Channel Assessment Area Technical Data Report Section 5: References
2010 Page 5-1
5 References Mackay, D., W. Stiver and P.A. Tebeau. 1983. Testing of crude oils and petroleum products for
environmental purposes. In Proceedings of the 1983 Oil Spill Conference. American Petroleum Institute. Washington, DC. 331-337.
Mackay, D. and W. Zagorski. 1982. Water in oil emulsions: a stability hypothesis. In Proceedings of the 5th Arctic and Marine Oil Spill Program Technical Seminar. Environment Canada. Ottawa, ON. 61-74.
Properties and Fate of Hydrocarbons Associated with Hypothetical Spills at the Marine Terminal and in the Confined Channel Assessment Area Technical Data Report Appendix A: Oil Property Analysis Data Sheets
2010 Page A-1
Appendix A Oil Property Analysis Data Sheets
Properties and Fate of Hydrocarbons Associated with Hypothetical Spills at the Marine Terminal and in the Confined Channel Assessment Area Technical Data Report Appendix A: Oil Property Analysis Data Sheets
2 Day 2 Week Average Air Temp Volume Weathered(ml) 900 288.2 K Temp(°C)Tray x Tray y °C Volume for 2cm thick 969.5 0.00526366 m/s Wind Speed (knots)
Tray Mass (g) 241.5 243.1 16.8 Tray thickness (m) 0.018566 0.001 m Thickness (mm)Automated
Date/Time Fm Oil Fv Evaporative Model Elapsed Evaporative2 Day 2 Week 2 Day 2 Week 2 Day 2 Week Density 2 Day 2 Week Exposure Evaporate Time 2 Exposure 2
Properties and Fate of Hydrocarbons Associated with Hypothetical Spills at the Marine Terminal and in the Confined Channel Assessment Area Technical Data Report Appendix A: Oil Property Analysis Data Sheets
Page A-4 2010
Density Syncrude Synthetic Light Oil
Mass VolumeEvaporated Density Temperature Temperature Density Density Evaporated T-To
0 0.871 16.78 15.5 0.926 926 0.2810.20 0.916 16.78 Density Constant 1 (slope, kg/m3) 176.5480.26 0.925 16.78 Standard Density Temperature, To (K) 288.72
Density Constant 2 (kg/K.m3) 0.833slope 0.214 Standard Density (kg/m3) 872.480
intercept 0.872 API Gravity @ 15.5°C 30.68r2 0.996
860870880890900910920930940
0.00 0.05 0.10 0.15 0.20 0.25 0.30 0.35
Fv
Den
sity
(kg/
m^3
)
860870880890900910920930940
-20 -15 -10 -5 0
T-To
Den
sity
(kg/
m^3
)
Properties and Fate of Hydrocarbons Associated with Hypothetical Spills at the Marine Terminal and in the Confined Channel Assessment Area Technical Data Report Appendix A: Oil Property Analysis Data Sheets
calculated adjustedFv vs. Theta B (-slope) 13.95749 14.7
Fv vs. Theta A (intercept) 12.52347 13.7
Wind Tunnel Calibration
200.0
400.0
600.0
800.0
0 2000 4000 6000 8000 10000 12000 14000 16000
Elapsed Time (s)
Tolu
ene
Rem
aini
ng
(g)
ASTM Distillation
0
100
200
300
400
500
0.00 0.10 0.20 0.30 0.40 0.50 0.60 0.70
Volume Fraction Evaporated (Fv)Li
quid
Tem
pera
ture
(°C
)
Properties and Fate of Hydrocarbons Associated with Hypothetical Spills at the Marine Terminal and in the Confined Channel Assessment Area Technical Data Report Appendix A: Oil Property Analysis Data Sheets
Page A-6 2010
Synthetic Light Oil - Fv vs Theta
0.000
0.050
0.100
0.150
0.200
0.250
0.300
0.350
0 100000 200000 300000 400000 500000
Evaporative Exposure
Fv
Properties and Fate of Hydrocarbons Associated with Hypothetical Spills at the Marine Terminal and in the Confined Channel Assessment Area Technical Data Report Appendix A: Oil Property Analysis Data Sheets
2010 Page A-7
Viscosity Syncrude Synthetic Light Oil
Mass ShearEvaporated Viscosity Temperature rpm Spindle # Rate ln(Viscosity)
Properties and Fate of Hydrocarbons Associated with Hypothetical Spills at the Marine Terminal and in the Confined Channel Assessment Area Technical Data Report Appendix A: Oil Property Analysis Data Sheets
Page A-8 2010
Pour Point Syncrude Synthetic Light Oil
Test Results Pour Point Constants for SLR Spill Model
Fv Initial Pour Point (K) 236.8705Measured Reported Pour Point Constant 0.183228
Properties and Fate of Hydrocarbons Associated with Hypothetical Spills at the Marine Terminal and in the Confined Channel Assessment Area Technical Data Report Appendix A: Oil Property Analysis Data Sheets
2010 Page A-9
Flash Point Syncrude Synthetic Light Oil
Test Results Flash Point Constants for SLR Spill Model
Fv Flash Point Initial Flash Point (K) 258.484Measured Flash Point Constant 1.382
(°C)0.000 -5 Equipment limit0.237 23.50.299 129
slope 357.336727intercept 258.483699
-200-150-100
-500
50100150
0.000 0.050 0.100 0.150 0.200 0.250 0.300 0.350
Fv
Flas
h Po
int (
°C)
SL Ross ModelModeling Constants Syncrude Synthetic Light Oil
Standard Density 872.480 kg/m3Standard Density Temperature 288.720 K
Initial Pour Point 236.870 K NB Initial Pour Point <-24°CPour Point Constant 0.18323
ASTM Distillation Constant A (slope) 421.099 KASTM Distillation Constant B (intercept) 457.676 K
Emulsification Delay 9999999999Initial Flash Point 258.484 K
Flash Point Constant 1.38243Fv vs. Theta A 13.70000Fv vs. Theta B 14.70000
B.Tg 6190.15B.To 6727.84
Properties and Fate of Hydrocarbons Associated with Hypothetical Spills at the Marine Terminal and in the Confined Channel Assessment Area Technical Data Report Appendix A: Oil Property Analysis Data Sheets
Page A-10 2010
Emulsification Formation - Tendency and Stability Syncrude Synthetic Light Oil
Test Results - 1°C 300ml H2O @ 1.0 °Coil @ 44.0 °Cmixing done @ 1.0 °Csettling done @ 1.0 °CFinal 24 hr done @ 1.0 °Ctwo replicates of each oil
Fresh Oil Weathered Two Days Weathered Two WeeksAll measurements in mm #1 #2 #3 #4 #5 #6
Conclusions: Fresh Oil Weathered Two Days Weathered Two Weeks Tendency Index Unlikely Unlikely Likely Stability Index Unstable Unstable Entrained Water Content 0% 23% 26% (after 24 hr)
Properties and Fate of Hydrocarbons Associated with Hypothetical Spills at the Marine Terminal and in the Confined Channel Assessment Area Technical Data Report Appendix A: Oil Property Analysis Data Sheets
2010 Page A-11
Test Results - 15°C 300ml H2O @ 15.0 °Coil @ 40.0 °Cmixing done @ 14.0 °Csettling done @ 14.0 °CFinal 24 hr done @ 15.0 °Ctwo replicates of each oil
Fresh Oil Weathered Two Days Weathered Two WeeksAll measurements in mm #1 #2 #3 #4 #5 #6
Conclusions: Fresh Oil Weathered Two Days Weathered Two Weeks Tendency Index Unlikely Unlikely Likely Stability Index Unstable Unstable Entrained Water Content 0% 0% 33% (after 24 hr)
Properties and Fate of Hydrocarbons Associated with Hypothetical Spills at the Marine Terminal and in the Confined Channel Assessment Area Technical Data Report Appendix A: Oil Property Analysis Data Sheets
Page A-12 2010
Viscosity Measurements with Brookfield DV-III+ Rheometer ViscosityTemperature 1 15
Properties and Fate of Hydrocarbons Associated with Hypothetical Spills at the Marine Terminal and in the Confined Channel Assessment Area Technical Data Report Appendix A: Oil Property Analysis Data Sheets
2010 Page A-13
A.2 MacKay River Heavy Bitumen Diluted with Synthetic Light Oil Oil Weathering MacKay River Bitumen Diluted with Synthetic Light Oil Modeling Inputs:
2 Day 2 Week Average Air Temp Volume Weathered(ml) 900 288.2 K Temp(°C)Tray x Tray y °C Volume for 2cm thick 969.5 0.00526366 m/s Wind Speed (knots)
Tray Mass (g) 242.3 241.7 16.5 Tray thickness (m) 0.018566 0.001 m Thickness (mm)Automated
Date/Time Fm Oil Fv Evaporative Model Elapsed Evaporative2 Day 2 Week 2 Day 2 Week 2 Day 2 Week Density 2 Day 2 Week Exposure Evaporate Time 2 Exposure 2
Properties and Fate of Hydrocarbons Associated with Hypothetical Spills at the Marine Terminal and in the Confined Channel Assessment Area Technical Data Report Appendix A: Oil Property Analysis Data Sheets
Page A-14 2010
Oil Weathering MacKay River Bitumen Diluted with Synthetic Light Oil Modeling Inputs:2 Day 2 Week Average Air Temp Volume Weathered(ml) 900 288.2 K Temp(°C)Tray x Tray y °C Volume for 2cm thick 969.5 0.00526366 m/s Wind Speed (knots)
Tray Mass (g) 242.3 241.7 16.5 Tray thickness (m) 0.018566 0.001 m Thickness (mm)Automated
Date/Time Fm Oil Fv Evaporative Model Elapsed Evaporative2 Day 2 Week 2 Day 2 Week 2 Day 2 Week Density 2 Day 2 Week Exposure Evaporate Time 2 Exposure 2
Properties and Fate of Hydrocarbons Associated with Hypothetical Spills at the Marine Terminal and in the Confined Channel Assessment Area Technical Data Report Appendix A: Oil Property Analysis Data Sheets
2010 Page A-15
MacKay River Bitumen Diluted with Synthetic Light Oil - Fv vs Theta
0.000
0.020
0.040
0.060
0.080
0.100
0.120
0.140
0 100000 200000 300000 400000
Evaporative Exposure
Fv
Properties and Fate of Hydrocarbons Associated with Hypothetical Spills at the Marine Terminal and in the Confined Channel Assessment Area Technical Data Report Appendix A: Oil Property Analysis Data Sheets
Page A-16 2010
Viscosity MacKay River Bitumen Diluted with Synthetic Light Oil
Mass ShearEvaporated Viscosity Temperature rpm Spindle # Rate ln(Viscosity)
Properties and Fate of Hydrocarbons Associated with Hypothetical Spills at the Marine Terminal and in the Confined Channel Assessment Area Technical Data Report Appendix A: Oil Property Analysis Data Sheets
2010 Page A-17
Pour Point MacKay River Bitumen Diluted with Synthetic Light Oil
Test Results Pour Point Constants for SLR Spill Model
Fv Initial Pour Point (K) 242.1059Measured Reported Pour Point Constant 0.34473
(°C) (°C)0.000 < -24 -30 made up0.089 < -23 -27 made up0.129 -20 -18
slope 83.46126intercept -31.04413
Pour Point
-35-30-25-20-15-10
-50
0.000 0.020 0.040 0.060 0.080 0.100 0.120 0.140
Fv
Pour
Poi
nt (°
C)
Interfacial Tension MacKay River Bitumen Diluted with Synthetic Light Oil
Properties and Fate of Hydrocarbons Associated with Hypothetical Spills at the Marine Terminal and in the Confined Channel Assessment Area Technical Data Report Appendix A: Oil Property Analysis Data Sheets
Page A-18 2010
Flash Point MacKay River Bitumen Diluted with Synthetic Light Oil
Test Results Flash Point Constants for SLR Spill Model
Fv Flash Point Initial Flash Point (K) 284.806Measured Flash Point Constant 2.619
(°C)0.000 100.089 830.129 104
slope 745.817474intercept 284.805734
0
50
100
150
0.000 0.050 0.100 0.150
Fv
Flas
h Po
int (
°C)
SL Ross ModelModeling Constants MacKay River Bitumen Diluted with Synthetic Light Oil
Standard Density 942.640 kg/m3Standard Density Temperature 288.720 K
Initial Pour Point 242.106 K NB: Fresh and 2-day Pour Point below -23°C Pour Point Constant 0.34473 thus Initial value and slope are "made up"
ASTM Distillation Constant A (slope) 336.244 KASTM Distillation Constant B (intercept) 551.943 K
Emulsification Delay 0Initial Flash Point 284.806 K
Flash Point Constant 2.61869Fv vs. Theta A 71.13872Fv vs. Theta B 42.87505
B.Tg 14416.46B.To 23664.59
Properties and Fate of Hydrocarbons Associated with Hypothetical Spills at the Marine Terminal and in the Confined Channel Assessment Area Technical Data Report Appendix A: Oil Property Analysis Data Sheets
2010 Page A-19
Emulsification Formation - Tendency and Stability MacKay River Bitumen Diluted with Synthetic Light Oil
Test Results - 1°C 300ml H2O @ 1.5 °Coil @ 40.0 °Cmixing done @ 1.0 °Csettling done @ 1.0 °CFinal 24 hr done @ 1.0 °Ctwo replicates of each oil
Fresh Oil Weathered Two Days Weathered Two WeeksAll measurements in mm #1 #2 #3 #4 #5 #6
Conclusions: Fresh Oil Weathered Two Days Weathered Two Weeks Tendency Index Very likely Unlikely Unlikely Stability Index Meso-stable Unstable Unstable Water Content 57% 9% 13% (after 24 hr)
Properties and Fate of Hydrocarbons Associated with Hypothetical Spills at the Marine Terminal and in the Confined Channel Assessment Area Technical Data Report Appendix A: Oil Property Analysis Data Sheets
Page A-20 2010
Test Results - 15°C 300ml H2O @ 15.0 °Coil @ 40.0 °Cmixing done @ 14.0 °Csettling done @ 14.0 °CFinal 24 hr done @ 15.0 °Ctwo replicates of each oil
Fresh Oil Weathered Two Days Weathered Two WeeksAll measurements in mm #1 #2 #3 #4 #5 #6
Conclusions: Fresh Oil Weathered Two Days Weathered Two Weeks Tendency Index Very likely Likely Unlikely Stability Index Meso-stable Entrained Unstable Water Content 51% 26% 13% (after 24 hr)
Properties and Fate of Hydrocarbons Associated with Hypothetical Spills at the Marine Terminal and in the Confined Channel Assessment Area Technical Data Report Appendix A: Oil Property Analysis Data Sheets
2010 Page A-21
Viscosity Measurements with Brookfield DV-III+ Rheometer ViscosityTemperature 1 15
Properties and Fate of Hydrocarbons Associated with Hypothetical Spills at the Marine Terminal and in the Confined Channel Assessment Area Technical Data Report Appendix A: Oil Property Analysis Data Sheets
1.5 Hour 6 Hour Average Air Temp Volume Weathered(ml) 900 288.2 K Temp(°C)Tray x Tray y °C Volume for 2cm thick 969.5 0.00526366 m/s Wind Speed (knots)
Tray Mass (g) 241.5 243.1 16.7 Tray thickness (m) 0.018566 0.001 m Thickness (mm)Automated
Date/Time Fm Oil Fv Evaporative Model Elapsed Evaporative1.5 Hour 6 Hour 1.5 Hour 6 Hour 1.5 Hour 6 Hour Density 1.5 Hour 6 Hour Exposure Evaporate Time 2 Exposure 2
Properties and Fate of Hydrocarbons Associated with Hypothetical Spills at the Marine Terminal and in the Confined Channel Assessment Area Technical Data Report Appendix A: Oil Property Analysis Data Sheets
2010 Page A-23
Density CRW Condensate
Mass VolumeEvaporated Density Temperature Temperature Density Density Evaporated T-To
0 0.733 16.71 15.5 0.851 851 0.0000.52 0.808 16.71 Density Constant 1 (slope, kg/m3) 155.7210.71 0.850 16.71 Standard Density Temperature, To (K) 288.72
Density Constant 2 (kg/K.m3) 0.952slope 0.160 Standard Density (kg/m3) 733.600
intercept 0.731 API Gravity @ 15.5°C 61.38r2 0.991
700
750
800
850
900
0.00 0.10 0.20 0.30 0.40 0.50 0.60 0.70 0.80
Fv
Den
sity
(kg/
m^3
)
700
750
800
850
900
-20 -15 -10 -5 0
T-ToD
ensi
ty (k
g/m
^3)
Properties and Fate of Hydrocarbons Associated with Hypothetical Spills at the Marine Terminal and in the Confined Channel Assessment Area Technical Data Report Appendix A: Oil Property Analysis Data Sheets
Page A-24 2010
CRW Condensate - Fv vs Theta
0.000
0.100
0.200
0.300
0.400
0.500
0.600
0.700
0.800
0 1000 2000 3000 4000 5000 6000 7000
Evaporative Exposure
Fv
Properties and Fate of Hydrocarbons Associated with Hypothetical Spills at the Marine Terminal and in the Confined Channel Assessment Area Technical Data Report Appendix A: Oil Property Analysis Data Sheets
2010 Page A-25
Viscosity CRW Condensate
Mass ShearEvaporated Viscosity Temperature rpm Spindle # Rate ln(Viscosity)
Properties and Fate of Hydrocarbons Associated with Hypothetical Spills at the Marine Terminal and in the Confined Channel Assessment Area Technical Data Report Appendix A: Oil Property Analysis Data Sheets
Properties and Fate of Hydrocarbons Associated with Hypothetical Spills at the Marine Terminal and in the Confined Channel Assessment Area Technical Data Report Appendix A: Oil Property Analysis Data Sheets
2010 Page A-27
Flash Point CRW Condensate
Test Results Flash Point Constants for SLR Spill Model
Fv Flash Point Initial Flash Point (K) 181.658Measured Flash Point Constant 0.974
(°C)0.000 Below -5°C0.568 90.751 41.5
slope 176.985043intercept 181.657629
-150
-100
-50
0
50
0.000 0.200 0.400 0.600 0.800
Fv
Flas
h Po
int (
°C)
SL Ross ModelModeling Constants CRW Condensate
Standard Density 733.600 kg/m3Standard Density Temperature 288.720 K
Initial Pour Point 248.373 KPour Point Constant 0.01322
ASTM Distillation Constant A (slope) 263.573 KASTM Distillation Constant B (intercept) 321.247 K
Emulsification Delay 9999999999Initial Flash Point 181.658 K
Flash Point Constant 0.97428Fv vs. Theta A 2.46875Fv vs. Theta B 7.38279
B.Tg 1945.91B.To 2371.70
Properties and Fate of Hydrocarbons Associated with Hypothetical Spills at the Marine Terminal and in the Confined Channel Assessment Area Technical Data Report Appendix A: Oil Property Analysis Data Sheets
Page A-28 2010
Emulsification Formation - Tendency and Stability CRW Condensate
Test Results - 0°C 300ml H2O @ 1.0 °Cmixing done @ 1.0 °Csettling done @ 1.0 °CFinal 24 hr done @ 1.0 °Ctwo replicates of each oil
Fresh Oil Weathered Two Days Weathered Two WeeksAll measurements in mm #1 #2 #3 #4 #5 #6
Conclusions: Fresh Oil Weathered Two Days Weathered Two Weeks Tendency Index Unlikely Unlikely Unlikely Stability Index Unstable Unstable Unstable Water Content 0% 0% 5% (after 24 hr)
Properties and Fate of Hydrocarbons Associated with Hypothetical Spills at the Marine Terminal and in the Confined Channel Assessment Area Technical Data Report Appendix A: Oil Property Analysis Data Sheets
2010 Page A-29
Test Results - 15°C 300ml H2O @ 15.0 °Cmixing done @ 14.0 °Csettling done @ 14.0 °CFinal 24 hr done @ 15.0 °Ctwo replicates of each oil
Fresh Oil Weathered Two Days Weathered Two WeeksAll measurements in mm #1 #2 #3 #4 #5 #6
Conclusions: Fresh Oil Weathered Two Days Weathered Two Weeks Tendency Index Unlikely Unlikely Unlikely Stability Index Unstable Unstable Unstable Water Content 0% 0% 0% (after 24 hr)
Properties and Fate of Hydrocarbons Associated with Hypothetical Spills at the Marine Terminal and in the Confined Channel Assessment Area Technical Data Report Appendix A: Oil Property Analysis Data Sheets
Page A-30 2010
Viscosity Measurements with Brookfield DV-III+ Rheometer ViscosityTemperature 1.0 15.0
Properties and Fate of Hydrocarbons Associated with Hypothetical Spills at the Marine Terminal and in the Confined Channel Assessment Area Technical Data Report Appendix A: Oil Property Analysis Data Sheets
2010 Page A-31
A.4 Cold Lake Bitumen Diluted with Condensate Oil Weathering Cold Lake Bitumen Diluted with Condensate Modeling Inputs:
2 Day 2 Week Average Air Temp Volume Weathered(ml) 900 288.2 K Temp(°C)Tray x Tray y °C Volume for 2cm thick 969.5 0.00526366 m/s Wind Speed (knots)
Tray Mass (g) 241.5 243.1 16.8 Tray thickness (m) 0.018566 0.001 m Thickness (mm)Automated
Date/Time Fm Oil Fv Evaporative Model Elapsed Evaporative2 Day 2 Week 2 Day 2 Week 2 Day 2 Week Density 2 Day 2 Week Exposure Evaporate Time 2 Exposure 2
Properties and Fate of Hydrocarbons Associated with Hypothetical Spills at the Marine Terminal and in the Confined Channel Assessment Area Technical Data Report Appendix A: Oil Property Analysis Data Sheets
Page A-32 2010
Density Cold Lake Bitumen Diluted with Condensate
Mass VolumeEvaporated Density Temperature Temperature Density Density Evaporated T-To
0 0.934 16.78 15.5 0.981 981 0.1520.113 0.976 16.78 Density Constant 1 (slope, kg/m3) 264.0370.129 0.980 16.78 Standard Density Temperature, To (K) 288.72
Density Constant 2 (kg/K.m3) 0.738slope 0.356 Standard Density (kg/m3) 935.520
intercept 0.935 API Gravity @ 15.5°C 19.75r2 0.999
930940950960970980990
1000
0.00 0.05 0.10 0.15 0.20
Fv
Den
sity
(kg/
m^3
)
930940950960970980990
1000
-20 -15 -10 -5 0
T-To
Den
sity
(kg/
m^3
)
Properties and Fate of Hydrocarbons Associated with Hypothetical Spills at the Marine Terminal and in the Confined Channel Assessment Area Technical Data Report Appendix A: Oil Property Analysis Data Sheets
2010 Page A-33
Wind Tunnel Calibration Toluene ASTM DistillationCold Lake Bitumen Diluted with Condensate
calculated adjustedFv vs. Theta B (-slope) 13.307068 13.30707
Fv vs. Theta A (intercept) 8.2047405 8.204741
Wind Tunnel Calibration
200.0
400.0
600.0
800.0
0 2000 4000 6000 8000 10000
Elapsed Time (s)
Tolu
ene
Rem
aini
ng (g
)
ASTM Distillation
0
100
200
300
400
500
0.00 0.10 0.20 0.30 0.40 0.50
Volume Fraction Evaporated (Fv)
Liqu
id T
empe
ratu
re (°
C)
Properties and Fate of Hydrocarbons Associated with Hypothetical Spills at the Marine Terminal and in the Confined Channel Assessment Area Technical Data Report Appendix A: Oil Property Analysis Data Sheets
Page A-34 2010
Cold Lake Bitumen - Fv vs Theta
0.000
0.020
0.040
0.060
0.080
0.100
0.120
0.140
0.160
0.180
0 100000 200000 300000 400000 500000
Evaporative Exposure
Fv
Properties and Fate of Hydrocarbons Associated with Hypothetical Spills at the Marine Terminal and in the Confined Channel Assessment Area Technical Data Report Appendix A: Oil Property Analysis Data Sheets
2010 Page A-35
Viscosity Cold Lake Bitumen Diluted with Condensate
Mass ShearEvaporated Viscosity Temperature rpm Spindle # Rate ln(Viscosity)
Properties and Fate of Hydrocarbons Associated with Hypothetical Spills at the Marine Terminal and in the Confined Channel Assessment Area Technical Data Report Appendix A: Oil Property Analysis Data Sheets
Page A-36 2010
Interfacial Tension Cold Lake Bitumen Diluted with Condensate
Pour Point Cold Lake Bitumen Diluted with Condensate
Test Results Pour Point Constants for SLR Spill Model
Fv Initial Pour Point (K) 248.0353Measured Reported Pour Point Constant 0.24945
(°C) (°C)0.000 -25 -24 NB Fresh Pour Point <-25°C0.143 -17 -150.170 -14 -12
slope 61.87233intercept -25.11471
Pour Point
-30
-25
-20
-15
-10
-5
0
0.000 0.050 0.100 0.150 0.200
Fv
Pour
Poi
nt (°
C)
Properties and Fate of Hydrocarbons Associated with Hypothetical Spills at the Marine Terminal and in the Confined Channel Assessment Area Technical Data Report Appendix A: Oil Property Analysis Data Sheets
2010 Page A-37
Flash Point Cold Lake Bitumen Diluted with Condensate
Test Results Flash Point Constants for SLR Spill Model
Fv Flash Point Initial Flash Point (K) 268.775Measured Flash Point Constant 0.198
Oil/Water Interfacial Tension Constant 0.80060 NB 2-week sample too viscousAir/Oil Interfacial Tension Constant 0.44722 for o/w measurement
Initial Pour Point 248.035 K NB Fresh Pour Point <-25°C; used Pour Point Constant 0.24945 -25 for model constant calcs
ASTM Distillation Constant A (slope) 916.148 KASTM Distillation Constant B (intercept) 393.672 K
Emulsification Delay 9999999999Initial Flash Point 268.775 K
Flash Point Constant 0.19785Fv vs. Theta A 8.20474Fv vs. Theta B 13.30707
B.Tg 12191.24B.To 5238.62
Properties and Fate of Hydrocarbons Associated with Hypothetical Spills at the Marine Terminal and in the Confined Channel Assessment Area Technical Data Report Appendix A: Oil Property Analysis Data Sheets
Page A-38 2010
Emulsification Formation - Tendency and Stability Cold Lake Bitumen Diluted with Condensate
Test Results - 1°C 300ml H2O @ 1.0 °Coil @ 44.0 °Cmixing done @ 1.0 °Csettling done @ 1.0 °CFinal 24 hr done @ 1.0 °Ctwo replicates of each oil
Fresh Oil Weathered Two Days Weathered Two WeeksAll measurements in mm #1 #2 #3 #4 #5 #6
Conclusions: Fresh Oil Weathered Two Days Weathered Two Weeks Tendency Index Likely Unlikely Unlikely Stability Index Entrained Unstable Unstable Water Content 41% 0% 23% (after 24 hr)
Properties and Fate of Hydrocarbons Associated with Hypothetical Spills at the Marine Terminal and in the Confined Channel Assessment Area Technical Data Report Appendix A: Oil Property Analysis Data Sheets
2010 Page A-39
Test Results - 15°C 300ml H2O @ 15.0 °Coil @ 39.0 °Cmixing done @ 14.0 °Csettling done @ 14.0 °CFinal 24 hr done @ 14.0 °Ctwo replicates of each oil
Fresh Oil Weathered Two Days Weathered Two WeeksAll measurements in mm #1 #2 #3 #4 #5 #6
Conclusions: Fresh Oil Weathered Two Days Weathered Two Weeks Tendency Index Very likely Unlikely Unlikely Stability Index Meso-stable Unstable Unstable Water Content 53% 0% 0% (after 24 hr)
Properties and Fate of Hydrocarbons Associated with Hypothetical Spills at the Marine Terminal and in the Confined Channel Assessment Area Technical Data Report Appendix A: Oil Property Analysis Data Sheets
Page A-40 2010
Viscosity Measurements with Brookfield DV-III+ Rheometer ViscosityTemperature 1 15