Page 1
May 2008
NASA/TM-2008-215306
Plan for the Characterization of HIRF Effects on a Fault-Tolerant Computer Communication System Wilfredo Torres-Pomales, Mahyar R. Malekpour, Paul S. Miner, and Sandra V. Koppen Langley Research Center, Hampton, Virginia
https://ntrs.nasa.gov/search.jsp?R=20080021358 2018-06-14T09:50:16+00:00Z
Page 2
The NASA STI Program Office . . . in Profile
Since its founding, NASA has been dedicated to the advancement of aeronautics and space science. The NASA Scientific and Technical Information (STI) Program Office plays a key part in helping NASA maintain this important role.
The NASA STI Program Office is operated by Langley Research Center, the lead center for NASA’s scientific and technical information. The NASA STI Program Office provides access to the NASA STI Database, the largest collection of aeronautical and space science STI in the world. The Program Office is also NASA’s institutional mechanism for disseminating the results of its research and development activities. These results are published by NASA in the NASA STI Report Series, which includes the following report types:
• TECHNICAL PUBLICATION. Reports of
completed research or a major significant phase of research that present the results of NASA programs and include extensive data or theoretical analysis. Includes compilations of significant scientific and technical data and information deemed to be of continuing reference value. NASA counterpart of peer-reviewed formal professional papers, but having less stringent limitations on manuscript length and extent of graphic presentations.
• TECHNICAL MEMORANDUM. Scientific
and technical findings that are preliminary or of specialized interest, e.g., quick release reports, working papers, and bibliographies that contain minimal annotation. Does not contain extensive analysis.
• CONTRACTOR REPORT. Scientific and
technical findings by NASA-sponsored contractors and grantees.
• CONFERENCE PUBLICATION. Collected
papers from scientific and technical conferences, symposia, seminars, or other meetings sponsored or co-sponsored by NASA.
• SPECIAL PUBLICATION. Scientific,
technical, or historical information from NASA programs, projects, and missions, often concerned with subjects having substantial public interest.
• TECHNICAL TRANSLATION. English-
language translations of foreign scientific and technical material pertinent to NASA’s mission.
Specialized services that complement the STI Program Office’s diverse offerings include creating custom thesauri, building customized databases, organizing and publishing research results ... even providing videos. For more information about the NASA STI Program Office, see the following: • Access the NASA STI Program Home Page at
http://www.sti.nasa.gov • E-mail your question via the Internet to
[email protected] • Fax your question to the NASA STI Help Desk
at (301) 621-0134 • Phone the NASA STI Help Desk at
(301) 621-0390 • Write to:
NASA STI Help Desk NASA Center for AeroSpace Information 7115 Standard Drive Hanover, MD 21076-1320
Page 3
National Aeronautics and Space Administration Langley Research Center Hampton, Virginia 23681-2199
May 2008
NASA/TM-2008-215306
Plan for the Characterization of HIRF Effects on a Fault-Tolerant Computer Communication System Wilfredo Torres-Pomales, Mahyar R. Malekpour, Paul S. Miner, and Sandra V. Koppen Langley Research Center, Hampton, Virginia
Page 4
Available from: NASA Center for AeroSpace Information (CASI) National Technical Information Service (NTIS) 7115 Standard Drive 5285 Port Royal Road Hanover, MD 21076-1320 Springfield, VA 22161-2171 (301) 621-0390 (703) 605-6000
Acknowledgments
The authors are grateful for the contributions of the following individuals to the definition and implementation of this test: Celeste M. Belcastro, Eric G. Cooper, Jay Ely, Dr. Oscar R. Gonzalez, Dr. W. Steven Gray, John J. Mielnik, Jr., Truong X. Nguyen, Maria Theresa Salud, and Laura J. Smith.
Page 5
iii
Abstract
This report presents the plan for the characterization of the
effects of high intensity radiated fields on a prototype
implementation of a fault-tolerant computer communication
system. Various configurations of the communication system
will be tested. The prototype system is implemented using off-
the-shelf devices. The system will be tested in a closed-loop
configuration with extensive real-time monitoring. This test is
intended to generate data suitable for the design of avionics
health management systems, as well as redundancy management
mechanisms and policies for robust distributed processing
architectures.
Page 6
iv
Table of Contents
1. Overview .................................................................................................................................................... 1
2. Test Articles ............................................................................................................................................... 2 2.1. Functional Systems.............................................................................................................................. 2 2.2. Physical Device ................................................................................................................................... 4
3. System Monitoring ..................................................................................................................................... 4
4. HIRF Environment ..................................................................................................................................... 7 4.1. Reverberation Chamber Description ................................................................................................... 7 4.2. Test Facility ......................................................................................................................................... 7 4.3. Measurement Method .......................................................................................................................... 8
5. Test Specification ..................................................................................................................................... 10 5.1. Hardware Configurations .................................................................................................................. 10 5.2. Device Positions Inside The Test Chamber ....................................................................................... 11 5.3. Radiation Modulations ...................................................................................................................... 11 5.4. HIRF Susceptibility Threshold Characterization............................................................................... 12 5.5. Ranking of Nodes and Positions........................................................................................................ 13 5.6. HIRF Effects Characterization .......................................................................................................... 15
6. Test Automation ....................................................................................................................................... 16
7. Health Checks........................................................................................................................................... 29
8. Shielding and Grounding.......................................................................................................................... 29
9. Equipment Layout .................................................................................................................................... 30
References .................................................................................................................................................... 35
Acronyms ..................................................................................................................................................... 36
Page 7
1
1. Overview
One of the objectives of the Integrated Vehicle Health Management (IVHM) project of NASA’s
Aviation Safety Program is to develop failure databases and test capabilities suitable for use in the
creation of advanced health-management systems. Safety, cost and performance are addressed as part of
this IVHM objective. The IVHM project is also investigating mitigation techniques for failures of
avionics systems caused by environmental threats, including electromagnetic interference (EMI) from
sources such as lightning and high-intensity radiated electromagnetic fields (HIRF). These environments
are of interest because of the potential to cause unexpected and seemingly arbitrary fault manifestations in
individual avionics system components, as well as generating simultaneous common-mode faults that can
overwhelm current system redundancy management approaches [1, 2]. Among the key challenges of the
IVHM project is the development of enabling technologies for the design of large-scale robust and
reliable distributed processing architectures for vehicle-wide health assessment and management
functions. The work presented here is part of an effort to meet this challenge by focusing on scalable
architectural solutions and complementary customizable redundancy management strategies, including
fault detection, diagnosis and reconfiguration elements, to meet a wide-range of performance and
dependability requirements.
The chosen first step in that direction is to assess the robustness of an existing distributed system by
exposing it to severe faults caused by environmental disturbances. This report presents a plan for the
generation of data suitable for a first-order characterization of the response of an electronic system
experiencing faults. In this fault-injection test, the function of specific targeted devices is disrupted by
immersing the devices in a controlled HIRF environment. The tests are performed while the devices
operate in a closed-loop configuration and are monitored from a protected location. The system selected
for this test is an open-source-based prototype of the communication system of the Scalable Processor-
Independent Design for Extended Reliability (SPIDER) architecture concept developed at Langley
Research Center (LaRC) under a previous project [3]. This type of platform is essential for this test over
proprietary systems because proprietary systems typically provide little or no visibility into their internal
operations and tend to be difficult and costly to instrument. Additionally, when proprietary systems are
used, the experimental data and analysis results normally cannot be openly shared with the wider research
community, thus limiting the potential benefit of the test.
SPIDER is a concept for a family of general-purpose fault-tolerant processing architectures that
provides a flexible set of architectural solutions capable of satisfying a wide range of performance and
reliability requirements, while preserving a consistent interface to applications. The SPIDER architecture
consists of processing elements (PEs) executing the applications and high-level system functions, and the
Reliable Optical Bus (ROBUS) data communication system, which provides guaranteed basic services
that support PE-level services. The goals of the ROBUS design are to reduce the computational burden
on the processing elements, to implement the basic distributed protocols in the way they are most
effective (i.e., in hardware), and to provide a simple system abstraction to the PEs for what is an
inherently complex distributed processing problem. ROBUS-2, an instance of ROBUS, is a time-division
multiple access (TDMA) broadcast data communication system (i.e., a data bus) with medium access
control by means of a time-indexed communication schedule. ROBUS-2 provides guaranteed fault-
tolerant services to the attached PEs in the presence of a bounded number of internal faults. These
services include message broadcast (Byzantine Agreement), dynamic communication schedule update,
time reference (clock synchronization), and distributed diagnosis (group membership). ROBUS-2 also
features fault-tolerant startup and restart capabilities. ROBUS-2 tolerates internal as well as PE faults,
and incorporates a dynamic self-reconfiguration capability driven by the internal diagnostic system.
ROBUS-2 consists of custom-designed hardware-based ROBUS Protocol Processors (RPPs)
Page 8
2
implementing the ROBUS-2 functionality, and a lower-level physical communication network
interconnecting the RPPs. A COTS-based laboratory prototype implementation of ROBUS-2 will be
used for this test. Additional information about ROBUS-2 can be found in [4] and [5]. The source code
for the ROBUS-2 RPP is publicly available under an open-source license agreement on the Internet at [8].
The objective of the test described here is to characterize the effect of a HIRF environment on the
behavior of the ROBUS-2 system and its components. Different system configurations will be tested
with variations on the communication data rate, the degree of redundancy, and the number of targeted
system components. The characterization will consider the effects at the interfaces to the PEs, at the
interfaces of internal system components, and on the state of the communication system. Of special
interest is determining the severity of component faults and assessing the robustness of the system to
multiple simultaneous faults. We would like to identify weaknesses in the design of ROBUS-2 and
desirable features for more robust communication systems. The test results will also contribute to the
development of redundancy management mechanisms and policies for robust processing architectures.
2. Test Articles
Figure 1 shows the ROBUS topology. The bus has a redundant active-star architecture with the Bus
Interface Units (BIUs) serving as the bus access ports, and the Redundancy Management Units (RMUs)
providing connectivity as network hubs. The network between BIUs and RMUs forms a complete
bipartite graph in which each node is directly connected to every node of the opposite kind. All the
communication links are bidirectional.
Figure 1: Generic ROBUS Topology
At the interface to the PEs, ROBUS behaves as a shared-medium communication bus with a time-
division multiple access (TDMA) channel access pattern. Thus, one way of viewing ROBUS is as a
distributed fault-tolerant communication hub.
2.1. Functional Systems
Three different ROBUS configurations will be used in this test: a 4x2 system (i.e., with 4 BIUs and 2
RMUs), a 4x3 system, and a 4x4 system. Figure 2 illustrates these configurations. The ROBUS 4x2
system has two independent communication paths between every pair of BIUs and can tolerate at most
one faulty RMU at any given time. The ROBUS 4x3 system has three independent paths between every
1 2 M
PEs
BIUs
RMUs
1 2 N
1 2 N
ROBUS
ROBUS
Interface
Page 9
3
pair of BIUs and can tolerate one arbitrarily faulty active RMU, and no more than two simultaneously
faulty RMUs. The ROBUS 4x4 system has four independent paths between every pair of BIUs. A 4x4
configuration can tolerate one active arbitrarily faulty RMU, two arbitrarily faulty RMUs if one of them
has been diagnosed (and thus isolated from the rest of the system), and no more than three simultaneously
faulty RMUs. The ROBUS 4x2, ROBUS 4x3 and ROBUS 4x4 systems can tolerate the same number of
faulty BIUs. To enable the performance of some useful work at the PEs, at least two PEs must be able to
communicate with each other. A ROBUS system with at least two properly working BIUs can tolerate
one active arbitrarily faulty BIU, and no more that two arbitrarily faulty BIUs if one of them has been
diagnosed. Each communication system will be tested while interacting with four independent PEs. The
three ROBUS configurations are tolerant to faults at the PEs and at the links between the PEs and the
communication system.
Figure 2: ROBUS Configurations
A simplex (i.e., non-redundant) hub will also be used in this test. The hub is functionally equivalent
to ROBUS at the interface to the PEs. This system will serve as a reference to assess the effectiveness in
a HIRF environment of ROBUS with its current redundancy management design. Figure 3 shows the
topology of the communication system with the simplex hub.
Figure 3: Simple Hub Configuration
PEs
Hub
ROBUS
Interface
1 2 4 3
H
2 3
PEs
BIUs
RMUs
1 2 4
1 2 4
ROBUS
ROBUS
Interface
3
3
4 1
RMU 3 present only for 4x3
and 4x4 configurations
RMU 4 present only for
4x4 configuration
Internal
ROBUS
Interconnect
Page 10
4
2.2. Physical Device
The reconfigurable SPIDER prototyping platform (RSPP) developed for NASA by Derivation
Systems, Inc. (DSI) under a phase III SBIR contract will be used to implement the communication
systems to be tested. The RSPP is a Field Programmable Gate Array (FPGA) based development system
for the design and testing of SPIDER prototypes. The architecture is a scalable modular system
composed of individual RSPP nodes interconnected with point-to-point fiber optic links. An RSPP node
is a PC/104-plus computer system consisting of the following hardware components.
• PF3100-2V3000 PC/104+ FPGA Module: PF3100 with the Xilinx Virtex-II XC2V3000 (3 million
gate) FPGA.
• PFBR104 PC/104 Fiber Optic Transceiver Module: Interfaces with the PF3100 over the PF3100
IO connector and provides four Agilent HFBR-5905 fiber optic transceivers. Each RSPP node has
two PFBR104 modules providing a total of 8 fiber optic IO channels.
• PC/104+ CPU Module: The PC/104+ CPU module is a Lippert CRR2 with a 300MHz Pentium class
processor, 64MB SDRAM, 256MB Compact Flash, 10/100 Ethernet, VGA, Keyboard, RS232 serial
port, parallel port, USB port, and cables. The White Dwarf Linux operating system is installed on the
CPU module.
• PC/104 Power Supply: A 75 Watt, DC-DC 10A PC/104 power supply is used to provide conditioned
power to the internal electrical components of the RSPP node.
• PC/104 Fan Module: A fan module provides airflow inside the enclosure to provide cooling of the
internal components by providing even heat distribution to avoid hot-spots.
• PC/104 Enclosure: A PC/104 enclosure is used to provide packaging as well as EMI shielding for
the RSPP node electrical components. The enclosure is made from high-grade extruded aluminum
and incorporates a railed card cage subassembly for the electronic components. Endcaps on either
end of the enclosure provide access to the internal components, and are machined with cutouts for the
various connectors on the RSPP node. Standard PC ports including video, keyboard, mouse, serial,
parallel, USB, Ethernet, and power are provided. In addition, eight fiber optic bulkhead adapters are
fitted on the endcaps to provide the maximum number of fiber optic channels that can be configured
on a single RSPP node.
Figure 4 shows two views of an RSPP node. Each node requires 24 V DC input power and has a 15-
ft. power cable with the shield attached to the connectors at both ends. The enclosure is grounded through
the power cable shield. The RSPP nodes do not require external cooling. Fiber optic cables of 60 meters
(196 feet) in length (to approximate the length of wiring in actual aircraft installations) are used for point-
to-point data communication between nodes. For this test, the BIUs, RMUs, and the simplex hub will be
implemented on separate RSPP nodes. The four PEs will be implemented on one RSPP node as
independent hardware functions.
3. System Monitoring
The communication systems to be tested operate at a 300 Hz cycle rate. In normal operation, with no
Page 11
5
faults, each system will process exactly the same data, execute exactly the same operations, and produce
exactly the same results in each cycle. This fact will be leveraged in the system monitoring functions.
Each system will be monitored in real-time by the PEs and by embedded observers that collect state data
from the nodes and relay it to remote monitors. In addition, the messages transmitted by a selected BIU
or RMU will be monitored during some of the tests of the ROBUS 4x4 system.
Figure 4: RSPP Node
The Processing Elements (PEs) designed for this test serve four functions. First, a PE emulates the
behavior of a real processor in its interaction with the communication system. A PE synchronizes and
tracks the state of the BIU (or the simplex hub) to ensure proper communication between the two. In
normal operation, the communication between the PEs and the bus is time-triggered and highly
deterministic. Second, a PE performs error detection on the communication observed at its respective bus
interface port. Each PE sends the same messages over the bus during each cycle and checks each
received message for timing and content. Third, the PEs forward their observations to a common bus
analyzer (see HFA below). Fourth, during each cycle each PE builds a record of its status and
observations that is then used for overall system health monitoring (see SHM below) and post-test
analysis.
The Hub Fault Analyzer (HFA) combines the observations from the four PEs to assess the behavior
of the communication system in real-time. The HFA classifies each observation per the categories of a
hybrid fault model based on error detection, symmetry, and correctness of received messages. At the end
of each communication system cycle, the HFA outputs a record with the results for the cycle. This record
is used for overall system health monitoring (see SHM below) and post-test analysis.
The Node Monitors record the state of communication system nodes (BIUs, RMUs, or simplex hub).
Each time a node makes a Minor Mode transition (see [4]), a record is generated containing the
8 Bi-Directional Fiber
Optic Channels
PC Ports
and Power CPU Module
FPGA Module
Optical Transceiver Modules (2)
Fan Module
DC/DC Power Supply
PC/104 Stack
Page 12
6
operational mode, current diagnostic results, and the status of each communication port. This record is
used for overall system health monitoring (see SHM below) and post-test analysis.
The Node Fault Analyzer (NFA), used in some tests of the ROBUS 4x4 system, combines the
observations from four nodes about a particular node of the opposite kind (i.e., four BIUs observing one
RMU, or four RMUs observing one BIU) to assess the behavior of the observed node. The NFA uses the
same classification functions as the HFA. At the end of each communication system cycle, the NFA
outputs a record with the results for the cycle, which is then used for overall system health monitoring
(see SHM below) and post-test analysis.
The System Health Monitor (SHM) is a generic monitoring function used for real-time assessment of
the health of the communication system. Instances of this function are used with each PE, the HFA, each
state monitor, and the NFA. Each SHM compares the data records generated by its corresponding
function against the records expected during normal system operation and a system health assessment is
made based on the timing and content of the records. Figure 5 shows the state transition graph for the
SHM. After a reset, a good record (i.e., with expected content) must be received within the Startup
Timeout delay, otherwise a system failure will be declared. When the first good record is received, the
SHM transitions to the Recovery state, where it will remain until stable good operation is confirmed or a
failure to return to normal operation is declared. The SHM will remain in the Trusted state as long as
good records are generated by the monitored function.
Figure 5: SHM State Transition Graph
For this test, the SHM Startup Timeout is set to 30.0 seconds, the Recovery Timeout is set to 6.0
seconds, and the Stable Recovery timeout is set to 0.5 seconds.
The system monitoring functions will be implemented using two RSPP nodes referred to as the PE
Emulator and the Bus Monitor. The PE Emulator includes the PEs, HFA, and NFA with their individual
SHM modules. The Bus Monitor includes a state monitor with an SHM module for each communication
system node. The PE Emulator and the Bus Monitor are also used for data collection.
Reset
Good
Record
Recovery
Timeout
No Record or
Bad Record
Startup
Timeout
Stable
Recovery Good
Record
Bad
Record
Bad Record or
Recovery in Progress Any
Condition
Inactive
Trusted
Recovering Failed
Page 13
7
4. HIRF Environment
The test articles will be subjected to a radiated susceptibility testing process. The process, based on
RTCA/DO-160D guidelines [6], incorporates the use of a reverberation chamber (RC), RF measurement
instrumentation, specialized control and data acquisition software, and the generation and use of
calibration data. The test articles will be exposed to radiated electromagnetic (EM) fields from all sides.
4.1. Reverberation Chamber Description
A RC is an electrically conductive shielded enclosure used for generating an electromagnetic (EM)
environment for radiated susceptibility and emissions testing. The operational concept is similar to a very
large microwave oven. Theoretically, a reverberation chamber is modeled as a large cavity resonator
characterized by three-dimensional stationary wave patterns (i.e., resonance modes) at resonant
frequencies determined by the dimensions of the chamber. When a radiated field at a resonant frequency
enters the cavity, it is reflected back and forth between the walls with low energy loss, and additional
energy entering the cavity reinforces the standing wave and increases its intensity. This resonance
phenomenon allows the generation of high intensity electromagnetic fields with relatively low input
power. However, it has the disadvantage that the spatial distribution of the field is not homogeneous. In
practice, a transmit antenna is used to emit RF energy inside the chamber setting up a complex field
structure within the chamber. Rotating mechanical stirrers then “mix” the energy, effectively changing
the boundary conditions and creating new complex field structures. When sampled over time, this stirring
results in a statistically uniform and isotropic test environment.
Reverberation chambers can be operated as either mode-stirred or mode-tuned. During mode-stirring
the stirrers continuously rotate at a set rate. Mode-tuning requires the stirrers to be incrementally stepped
through a complete rotation with a set dwell time applied at each step. In either case, one complete stirrer
rotation will result in environment test samples that are statistically isotropic, uniform, and randomly
polarized. Therefore, the test articles are exposed to radiation from all aspect angles and
polarizations, thus eliminating the need to move or rotate it. Mode-stirring was chosen for this
application because it is easier to implement and significantly reduces test time.
A reverberation chamber is associated with a lowest usable frequency (LUF). The chamber size and
geometry contribute to the generation of a sufficient number of modes to ensure adequate field mixing
and uniformity. Generally, larger chambers have a lower LUF.
RCs offer several advantages, such as field uniformity and repeatability, the ability to generate high
field levels efficiently with less power, reduced test time, and a screened environment with no ambient
signals. Disadvantages include loss of polarization and directivity data, and some difficulty correlating
time-critical susceptibilities with RF environment.
4.2. Test Facility
Testing will be conducted in the NASA LaRC High Intensity Radiated Fields (HIRF) Laboratory.
Figure 6 is a diagram of the layout of the facility which consists of five separate steel chambers.
Chambers A, B, and C are reverberation chambers used for radiated emissions and susceptibility testing.
Chambers D and E are used as an Amplifier Room and Control Room, respectively. Figure 6 also shows
the LUF for each of the chambers. The HIRF Lab chambers were characterized by the National Institute
of Standards and Technology (NIST), and demonstrated to have a high level of field uniformity [7]. The
facility has the capability to perform distributed testing using two or three of the co-located RCs, which
Page 14
8
allows for the simultaneous testing of multiple system components by generating a different radiated
environment in each chamber.
Chamber A will be used for this application because the frequency range and power requirements
specified in the test plan easily fit within the facility’s capabilities. The HIRF Lab has the resources to
operate Chamber A at frequencies up to 18 GHz and at field intensities up to 1500 V/m.
Figure 6: NASA LaRC High Intensity Radiated Fields Laboratory
4.3. Measurement Method
The HIRF Lab reverberation chamber will be operated and calibrated based on RTCA/DO-160D
Change 1 guidelines, but with modifications to accommodate mode-stirring. A typical test configuration
is illustrated in Figure 7 showing Chamber A, the Amplifier Room (D), the Control Room (E), and test
equipment. RC calibration requires transmitting a known input power into the chamber with stirrers
rotating. Some of the input power will be lost due to absorption by the chamber, test devices, and
antennas. Receive power is measured with a spectrum analyzer in maximum-hold mode. The calibration
factor is then determined from the ratio of the known input power to the peak measured receive power.
To determine the chamber calibration factor (CF) the following calculation is used [6].
CF(dB) = 10•log10(8π/λ2) + PMaxRec(dBm) – PInput(dBm) (1)
where PInput(dBm) denotes the known input power in units of dBm, PMaxRec(dBm) is the measured maximum
receive power in units of dBm over a complete stirrer rotation, and λ denotes the frequency wave length.
(A dB is a logarithmic measurement unit that expresses the magnitude of a physical quantity relative to a
Dimensions: 47’ x 23’ x 9.5’
LUF: 80 MHz
CONTROL ROOM
AMPLIFIER ROOM
Stirrer Stirrer
Chamber
Chamber
Dimensions: 23’ x 13’ x 9.5’
LUF: 150 MHz
9’ x 7’ x 9.5’
LUF:
250 MHz
Stirrer
Page 15
9
reference level. The magnitude P of a quantity expressed in dB’s relative to magnitude r is defined as PdB
= 10•log10(P/r), where log10() is the logarithm with base 10. A dBm is a unit of power in dB relative to 1
mW.)
Figure 7: Reverberation Chamber Test Setup illustrating Chamber A, Control Room (E), Amplifier Room (D), and
Equipment.
Once the chamber calibration factor is known, a test input power can be calculated that will produce a
required electric field level (V/m) inside the chamber using the following.
PInput(dBm) = 10•log10(E2
/377) + CF(dB) + 30 dB, (2)
where PInput(dBm) denotes the input power in dBm at transmit antenna, E is the required electric field in
V/m, and CF(dB) is the chamber calibration factor in dB.
As illustrated in Figure 7, forward power from the amplifier is measured using a power meter and peak
power RF sensor connected to the forward port of the directional coupler. The input power at the antenna
is then related to the measured forward power at the meter when corrected for cable losses (6c) and
coupling factor.
output input Directional
Coupler
50 Ohms
Load
RF
Sig Gen
Power Meter
Spectrum
Analyzer
Motor
Controller
Power
Amp
forward Test Articles
Directional
Coupler
Power
Sensor
Control Room(E) Stirrer
Stirrer
Receive
Ant.
Xmit
Ant.
1a
1b
1c
1d
1e
2a
2b
6a 6b 6c
4a
8a
8b
7c 7b 7a
3a
3b
5a
5b
GPIB
GPIB
GPIB
GPIB
Chamber A
Amplifier Room(D) Control Room(E)
Test Controller
Page 16
10
The receive path is measured between the receive antenna and the spectrum analyzer and includes
cables (7a, 7b & 7c) and a directional coupler (4a). Receive path losses and gains are applied to the
maximum power measured at the spectrum analyzer to determine the maximum receive power at the
receive antenna.
Measurements can be affected by uncertainties in the RC and the measurement instruments. NIST’s
characterization of Chamber A [7] indicates uniformity uncertainties of +/- 4 dB at 100 MHz and +/-2 dB
at frequencies of 200 MHz and above. Test instrumentation was calibrated to accuracies of +/- 2 dB for
the spectrum analyzer, and 0.5 dB or less for the power meter and RF signal generator.
5. Test Specification
The design of ROBUS-2 is supported by formal fault-tolerance theoretical results and design analysis
and is based on a set of assumptions about the number, timing and severity of manifestations of active
faults [4]. The design of the system re-initialization strategy of ROBUS-2, which is triggered when the
system experiences multiple coincident faults beyond the guaranteed-performance capacity of its fault
handling mechanisms, is based on the assumption that such events can only be caused by rare external
disturbances of known bounded duration. As the purpose of this test is to assess the robustness of the
ROBUS-2 system, and given the highly deterministic (and thus uninteresting) behavior of ROBUS-2
when its timing design assumptions are satisfied, this test is deliberately specified such that the duration
of the HIRF exposures are longer than assumed in the design of the system. Furthermore, the test
specification takes advantage of the known fault-tolerance degree of ROBUS-2 to characterize the
behavior of individual ROBUS nodes while operating in their normal system configuration with absolute
certainty that the tested node will have no significant impact on the behavior of the rest of the system.
The test consists of two parts. The purpose of the first part, called the HIRF Susceptibility
Threshold Characterization (HSTC), is to determine the change in the susceptibility threshold (i.e., the
minimum field strength to cause an upset) of the RSPP nodes as a function of test frequency, the actual
radiated physical node, the location of a node inside the test chamber, and the radiation pattern that a node
is exposed to. The data from the HSTC will be used in the second part, called the HIRF Effects
Characterization (HEC), to determine the range of field strengths and the set of frequencies for testing
various hardware configurations to characterize the effects of the radiation on the targeted devices.
5.1. Hardware Configurations
Table 1 lists the hardware configurations available for this test. There will be two versions of each
communication system: a low-speed version with a 3.2 Mbps (mega-bits per second) data rate, and a
high-speed version at 12.8 Mbps. Testing versions with different data rates will serve to examine the
dependence between the data rate and the response of the system to radiated fields. The ROBUS 4x2 and
4x3 systems use the same BIU and RMU implementations as the ROBUS 4x4 system. The only physical
difference between these systems is the actual number of RMUs used. ROBUS-2 has the capability to
automatically detect missing nodes and reconfigure its state accordingly.
Four ROBUS 4x4 system configurations will be available in which only one node is targeted. The
purpose of these configurations is to characterize the node fault manifestations within ROBUS. Such data
is important for the design of effective redundancy management strategies. These configurations will be
the only ones using the NFA monitoring function.
Page 17
11
Table 1: Available Hardware Configurations
Hardware
Configuration
Communication
System
Data
Transfer
Rate
Radiated
Components
(Targets)
HC1 Simplex Hub Low Hub
HC2 Simplex Hub High Hub
HC3 ROBUS 4x4 Low RMU 1
HC4 ROBUS 4x4 Low BIU 1
HC5 ROBUS 4x2 Low RMU 1
HC6 ROBUS 4x4 High RMU 1
HC7 ROBUS 4x4 High BIU 1
HC8 ROBUS 4x2 High RMU 1
HC9 ROBUS 4x2 Low ROBUS 4x2
HC10 ROBUS 4x3 Low ROBUS 4x3
HC11 ROBUS 4x4 Low ROBUS 4x4
HC12 ROBUS 4x2 High ROBUS 4x2
HC13 ROBUS 4x3 High ROBUS 4x3
HC14 ROBUS 4x4 High ROBUS 4x4
The ROBUS 4x2 configurations with one targeted RMU are intended to characterize the response of
the system when the number of non-faulty redundant components of a particular kind is reduced to the
minimum.
The remaining configurations targeting the whole communication system in each case are meant to
assess the relative effectiveness of the communication systems in handling HIRF-induced faults. For
these configurations, their fault handling effectiveness will be assessed at the PE interfaces.
Configurations of ROBUS 4x2, 4x3 and 4x4 systems can also be analyzed from the perspective of their
internal state transitions in response to HIRF-induced faults.
5.2. Device Positions Inside The Test Chamber
Figure 8 shows the options for positioning devices inside the test chamber. The locations are
identified by the numbers 1 through 8 as indicated. At each location there is a non-conductive foam block
or table intended to support at most one RSPP node elevated above the chamber floor. The devices can
be placed at these locations such that the distance between any two devices and between the devices and
the stirrers, chamber walls, and antennas is at least one-half wavelength at the lowest test frequency (i.e.,
1.5 meters at 100 MHz). This separation is intended to reduce the disturbance to the local radiation
characteristics caused by other items inside the chamber.
5.3. Radiation Modulations
Various modulations to the chamber RF (radio frequency) input signal will be used in this test. The
basic waveform is a continuous (i.e., unmodulated) wave (CW). Pulse modulation will consist of 20 µs
pulses of the test frequency at a 1 kHz pulse rate. A square wave modulated input signal will have a
modulation frequency of 1 kHz and a 50% duty cycle. The pulse and square modulations are defined
taking into consideration the reverberation chamber time constant and wave modulation recommendations
in [6].
Page 18
12
Figure 8: Device Positions inside the Test Chamber
Additionally, it is known that due to the reverberation and stirring of the field inside the test chamber,
the targeted devices will experience position and time-dependent field amplitude modulations
superimposed on the input RF signal modulation. For completeness, we intend to measure at one or more
locations the magnitude of the peak field as a function of stirrer rotation angle.
5.4. HIRF Susceptibility Threshold Characterization
The HSTC is intended to characterize the dependence of the HIRF susceptibility threshold to
variations in frequency, physical device, radiation modulation, and position within the test chamber. The
HSTC consists of a series of tests as described in Table 2. Hardware configurations HC3 and HC4 will
be used for these tests. For HC3 configuration tests, physical RSPP nodes 5 through 8 alternate to
perform the targeted RMU1 function as indicated in Table 2. Likewise, for HC4 configuration tests,
physical RSPP nodes 1 through 4 will be reprogrammed to perform the BIU 1 function as indicated.
For each test, the desired output is a graph indicating the minimum field strength to cause an upset for
each test frequency. The 2-out-of-3 rule described in Section 5 will be used to identify the susceptibility
threshold of the targeted device at a particular frequency. The test frequency range is 100 MHz to 1000
MHz with specific frequency values determined by the formula fn+1 = (101/24
)fn [6] for a total of 25
frequencies. At each HSTC test frequency, the calibrated peak electric field strength is swept starting at
the lowest test field strength and increasing in steps of 20 V/m until the susceptibility threshold or the
maximum field strength is reached. For tests with unspecified lowest test field strength in Table 2, the
results from preceding tests will be used to determine an appropriate lowest level. Document [6] and
recommendations from HIRF Lab personnel were considered in the specification of the field strength
ranges. The stirrers will be set to rotate at 10 seconds per revolution. The dwell time at each tested
frequency-and-field-strength point will be 30 seconds (i.e., 3 stirrer rotations). Each individual radiation
exposure at a particular frequency and field strength is called a round.
8
7
6
5
4
3
2
1
RF Mode Stirrers
Page 19
13
Table 2: Tests for HIRF Susceptibility Threshold Characterization
HSTC
Test
Id
Hardware
Configuration
Variable of
Interest
ROBUS
Node
Physical
RSPP
node
Position Modulation Field Range
(V/m)
1 HC3 Physical
Node
RMU 1 5 5 CW 20 – 300
2 HC4 Physical
Node
BIU 1 1 5 CW Up to 300
3 HC4 Physical
Node
BIU 1 2 5 CW Up to 300
4 HC4 Physical
Node
BIU 1 3 5 CW Up to 300
5 HC4 Physical
Node
BIU 1 4 5 CW Up to 300
6 HC3 Physical
Node
RMU 1 6 5 CW Up to 300
7 HC3 Physical
Node
RMU 1 7 5 CW Up to 300
8 HC3 Physical
Node
RMU 1 8 5 CW Up to 300
9 HC3 Modulation RMU 1 5 5 Pulse Up to 500
10 HC4 Position BIU 1 1 1 CW Up to 300
11 HC4 Position BIU 1 2 2 CW Up to 300
12 HC4 Position BIU 1 3 3 CW Up to 300
13 HC4 Position BIU 1 4 4 CW Up to 300
14 HC3 Position RMU 1 6 6 CW Up to 300
15 HC3 Position RMU 1 7 7 CW Up to 300
16 HC3 Position RMU 1 8 8 CW Up to 300
17 HC3 Modulation RMU 1 5 5 Square
wave
Up to 400
5.5. Ranking of Nodes and Positions
The results of the HSTC will include the ranking of the physical nodes based on their average field
strength susceptibility across the tested frequency range, and also the ranking of the chamber positions
based on the average magnitude of the local field strength across the tested frequency range. Both of
these ranking will only consider CW modulation tests. Since it is expected that the measured
susceptibility threshold of multi-node ROBUS configurations will be dependent on the position
assignment of the constituent nodes, the rankings of the physical nodes and positions will be used to try to
predetermine the relative susceptibility threshold of the tested communication systems and thus make the
comparison of relative fault handling effectiveness as fair as possible. It is known that the peak field
intensity at a particular position inside the chamber is highly dependent on the relative alignment of the
field stirrers, and that because of this the rankings of the tested nodes and positions based on observed
susceptibility thresholds are not reliable. Nevertheless, this approach will be used as it provides a simple,
methodical way of deciding how to position multiple nodes inside the chamber.
To enable the ranking of the positions by the local field strength and of the nodes by their
Page 20
14
susceptibility to the field, a model has been developed that relates the nominal field strength in the
chamber to the magnitude of the disturbance experienced by the internal electronic components of a node.
The nominal field strength will be measured by a receive antenna at a fixed position separate from where
the nodes will be placed. Although mode stirring will be used in this test, which provides a certain degree
of spatial field uniformity, it is expected that the local peak field strength will be different for each of the
identified test node positions. It is also expected that each node will have a slightly different
susceptibility threshold with respect to the local peak field strength. Equation (3) incorporates these two
factors determining the observed susceptibility threshold with respect to the nominal field strength.
VI = W
P•W
S•E (3)
Here, VI is the disturbance voltage experienced by the internal electronic components of a node, W
P is
a scaling factor that maps the nominal field strength to the local field strength at a given position, WS is a
scaling factor mapping the local field strength to the magnitude of the disturbance experienced internally
by the electronic components of the node, and E is the nominal field strength. Factor WS is inversely
proportional to the shielding effectiveness of a node, such that a lower value of WS corresponds to a more
effective shielding of the node’s internal electronic components.
In using equation (3) to rank the nodes and positions, it is assumed that the internal electronic
components of all the nodes have the same susceptibility threshold, such that all the nodes experience an
upset at the same value of VI. Differences among the nodes in the value of factor W
S is assumed to be
caused by slight variations in manufacturing and layout of the nodes, including wiring. Differences in the
value of factor WP are assumed to be due to limitations of the field stirring mechanism and positioning of
the node.
Tests 1 through 8 in Table 2 will measure the nominal susceptibility threshold of the nodes at position
5. WP is assumed constant for all those tests, and therefore, the differences in the measured susceptibility
thresholds of the nodes are due to differences in the value of the WS factor. Thus, ranking the nodes by
their susceptibility threshold consists of sorting the values of their WS factors. Equation (4), derived
using equation (3) for two nodes, x and 5, will be used for this purpose.
WS
x /WS
5 = E5
5 /E5
x (4)
Here, WS
x is WS for node x and W
S
5 is WS for reference node 5. E
a
b is the nominal susceptibility
threshold of node b at position a. Using equation (4) we can rank the nodes by their susceptibility relative
to the susceptibility of node 5 using the measured nominal field strength susceptibility thresholds.
The results of tests 1 through 8 and 10 through 16 in Table 2, where each node is tested at reference
position 5 and at one other position, will be used to rank the positions by the local field strength.
Specifically, the positions will be ranked by the value of their WP factors using the susceptibility
thresholds measured at each position and at reference position 5 for a particular node. In this case, WS is
held constant and WP varies. Applying equation (3) for position 5 and for some position y with the same
node x, we can derive equation (5).
WP
y /WP
5 = E5
x /Ey
x (5)
Here, WP
y is WP for position y and W
P
5 is WP for reference position 5. From equation (5), a higher
susceptibility threshold at position y corresponds to a lower value of scaling factor WP
y , which indicates
Page 21
15
that the local field strength there is lower, as expected. Thus, with this expression we can sort the
positions by their local field strength relative to the field strength at position 5 using the measured
susceptibility thresholds.
To account for the various test frequencies in the HSTC, the final ranking of nodes and positions will
be based on the average ranking for the set of tested frequencies.
5.6. HIRF Effects Characterization
Table 3 lists the tests for the HEC. As shown, low and high susceptibility threshold position
assignments will be tested for each hardware configuration. For HC1 and HC2 configurations involving
the simplex hub, a physical node and position assignment with average susceptibility threshold (i.e.,
approximately at the midpoint between the extremes) will also be tested.
For each of these tests and at each tested frequency, the field strength will be incremented first in steps
of 20 V/m until the susceptibility threshold level is reached, and then a finer resolution of 10 V/m will be
used to more accurately determine the susceptibility threshold. CW will be used for these phases. Once
the threshold is determined for a particular test frequency, the HEC part of the test begins.
An HEC round consists of a series of discrete radiation exposures separated by intervals with no
radiation. Each radiation exposure is called a strike, and each quiet interval after a strike is called a lull.
Each strike will consist of 5 seconds of continuous unmodulated (CW) radiation. Each lull will also last
for 5 seconds. The purpose for the lulls is to allow the targeted system to recover before the arrival of the
next disturbance. Each HEC round will last for 200 seconds (i.e., 20 radiation strikes), and the field
strength will increment in steps of 10 V/m between rounds. The stirrers will move at 5 seconds per
revolution.
The actual test frequencies, field strength ranges, and the position assignments for targeted physical
RSPP nodes will be selected based on the results of the HSTC tests. Due to time constraints, it is likely
that not all the tests in Table 3 can be carried out. In that case, a subset will be selected taking into
consideration time availability and the results of the HSTC tests.
Table 3: Tests for HIRF Effects Characterization
Hardware
Configuration
Number of Hardware Position Assignments
(Expected relative susceptibility thresholds)
HC1 3 (Low, Average, High)
HC2 3 (Low, Average, High)
HC3 2 (Low, High)
HC4 2 (Low, High)
HC5 2 (Low, High)
HC6 2 (Low, High)
HC7 2 (Low, High)
HC8 2 (Low, High)
HC9 2 (Low, High)
HC10 2 (Low, High)
HC11 2 (Low, High)
HC12 2 (Low, High)
HC13 2 (Low, High)
HC14 2 (Low, High)
Page 22
16
6. Test Automation
The Test Control System (TCS) consists of three interconnected computers. The Test Controller
controls the RF environment inside the test chamber and the power supply for the targeted components.
The PE Emulator implements the PE, Hub Fault Analyzer, and Node Fault Analyzer functions, and
monitors the operation of the communication system under test (SUT) at its interface. The Bus Monitor
implements the SUT state monitoring function. Figure 9 shows the interconnection topology of the TCS.
The Test Controller is the central element of this system, with the PE Emulator and Bus Monitor working
as SUT monitoring controllers. The computers communicate via RS-232 serial links. Communication
with the tested communication system (i.e., ROBUS or the simplex hub) is via fiber-optic links. A
separate computer serves as a data repository and is connected to the PE Emulator and the Bus Monitor
via a dedicated Ethernet network.
Figure 9: Test Control System Topology
The PE Emulator and Bus Monitor computers are programmed with information about the hardware
configuration being tested and the duration of a round, but they do not have information about the test
sequences.
The TCS operates in rounds, with the field settings for each execution round corresponding to a point
in a field-strength-by-frequency matrix. The execution of a round is enabled by the TCS operators, who
are also responsible for monitoring the operation of the system during the round. Each computer is
enabled independently. Once enabled, the computers automatically coordinate their actions during a
round using the Controller Coordination Protocol (CCP). The CCP is a handshake protocol that enables
the test control computers to execute a test round and provides exception-handling capability to ensure
that the computers gracefully finish the execution of each round. The TCS operators serve as backup to
deal with unexpected situations (e.g., a TCS computer crash).
A TCS execution round consists of two phases: SUT Check and SUT Test. In the SUT Check phase,
the TCS powers up the SUT target components and confirms normal operation. The SUT Test phase is
where the SUT target components are exposed to the test radiation environment. After the SUT Test
phase is complete, the TCS saves the collected data and waits for operator authorization to begin the next
round. The TCS execution ends after the last round of a HIRF test is complete.
Figure 10 shows an example of the flow of events for a normal execution of the CCP protocol. A
Test
Controller
PE
Emulator
Bus
Monitor
RS-232 RS-232
SUT
Data
Repository
Optical Fibers Optical Fibers
Ethernet Ethernet
Test Control
System
Page 23
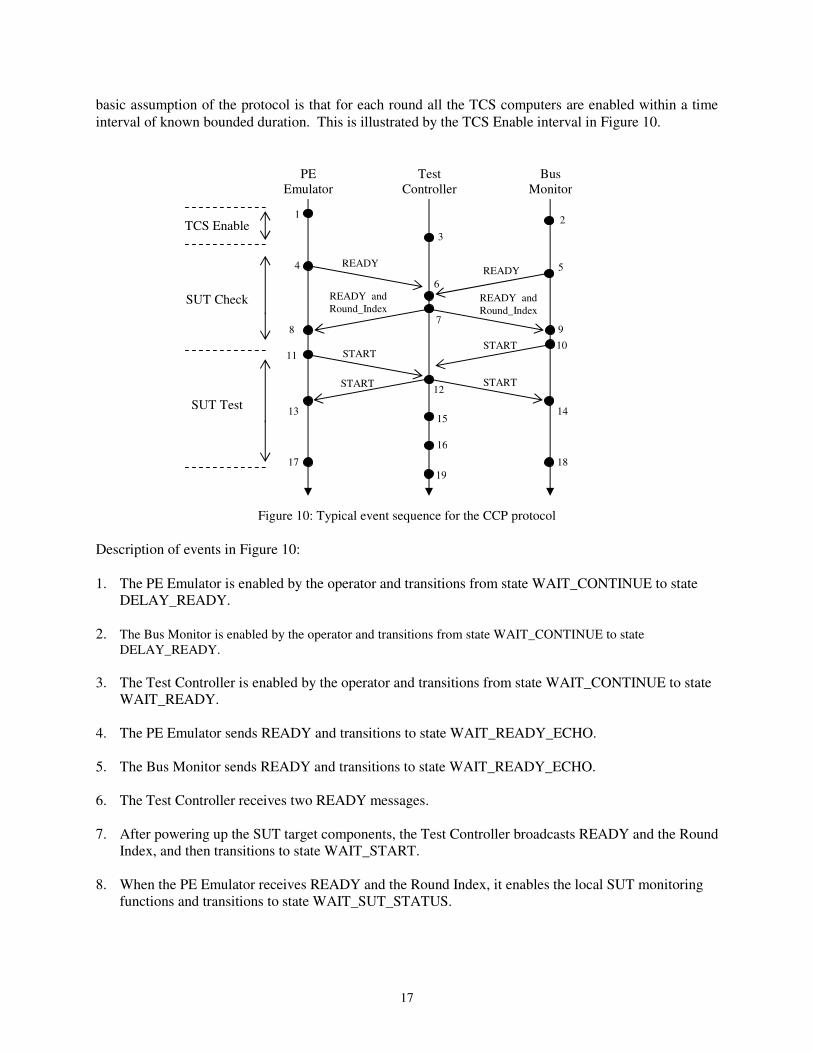
17
basic assumption of the protocol is that for each round all the TCS computers are enabled within a time
interval of known bounded duration. This is illustrated by the TCS Enable interval in Figure 10.
Figure 10: Typical event sequence for the CCP protocol
Description of events in Figure 10:
1. The PE Emulator is enabled by the operator and transitions from state WAIT_CONTINUE to state
DELAY_READY.
2. The Bus Monitor is enabled by the operator and transitions from state WAIT_CONTINUE to state
DELAY_READY.
3. The Test Controller is enabled by the operator and transitions from state WAIT_CONTINUE to state
WAIT_READY.
4. The PE Emulator sends READY and transitions to state WAIT_READY_ECHO.
5. The Bus Monitor sends READY and transitions to state WAIT_READY_ECHO.
6. The Test Controller receives two READY messages.
7. After powering up the SUT target components, the Test Controller broadcasts READY and the Round
Index, and then transitions to state WAIT_START.
8. When the PE Emulator receives READY and the Round Index, it enables the local SUT monitoring
functions and transitions to state WAIT_SUT_STATUS.
PE
Emulator
Test
Controller
Bus
Monitor
TCS Enable
SUT Check
SUT Test
READY READY
READY and
Round_Index
START START
START START
1
3
2
4 5
6
8 9
10 11
12
13 14 15
7
16
17 18
19
READY and
Round_Index
Page 24
18
9. When the Bus Monitor receives READY and the Round Index, it enables the local SUT monitoring
functions and transitions to state WAIT_SUT_STATUS.
10. When the Bus Monitor confirms that the SUT is operating normally, it sends START and transitions
to state WAIT_START_ECHO.
11. When the PE Emulator confirms that the SUT is operating normally, it sends START and transitions
to state WAIT_START_ECHO.
12. When the Test Controller receives both START messages, it broadcasts START, starts a delay timer
to begin the HIRF radiation, and transitions to state WAIT_HIRF_BEGIN.
13. When the PE Emulator receives START, it starts a round duration timer and begins collecting SUT
execution data in state WAIT_ROUND_COMPLETION.
14. When the Bus Monitor receives START, it starts a round duration timer and begins collecting SUT
execution data in state WAIT_ROUND_COMPLETION.
15. When the Test Controller’s HIRF delay timer expires, the radiation begins and the Test Controller
transitions to state WAIT_HIRF_END.
16. The Test Controller ends the radiation and transitions to state WAIT_ROUND_CONTINUE.
17. When the PE Emulator’s round duration timer expires, it saves the collected data to the repository and
transitions to state SAVE_DATA_RECORDS.
18. When the Bus Monitor’s round duration timer expires, it saves the collected data to the repository and
transitions to state SAVE_DATA_RECORDS.
19. Round ends for the Test Controller, and it transitions to state ROUND_DECISION.
The READY, START, and STOP messages used in the CCP are mapped to RS-232 messages as
indicated on Table 4.
Table 4: CPP message encoding for RS-232 communication
RS-232 Message CCP Message
Decimal Binary ASCII
READY 70 0100_0110 F
START 85 0101_0101 U
STOP 90 0101_1010 Z
The RS-232 links are configured as follows.
• Baud Rate 19200
• Message Format 8N1 (8-bit character, no parity, 1 stop bit)
• Flow Control Hardware
Page 25
19
The transmission of the Round_Index variable by the Test Controller is implemented as three separate
RS-232 messages, each carrying the ASCII code representation of a digit of the value of Round_Index
(i.e., each digit is transmitted as a character). The most significant digit is transmitted first.
Table 5 lists execution variables used in the CCP process executed by the Test Controller. There are
three test phases defined. During the HSTC test phase, the field strength will be incremented until the
susceptibility threshold is reached. The FHSTC (Fine HSTC) test phase determines the susceptibility
threshold with the finer field strength resolution. The HEC test phase executes the HEC long duration
rounds at or above the susceptibility threshold. The following parameters are used in the definition of the
CCP.
• HSTC_Max_Field_Strength = Maximum field strength for HSTC and FHSTC test phases
• HEC_Num_Field_Levels = Number of test field levels for HEC mode
• N = max (3, HEC_Num_Field_Levels)
As the central element of the TCS, the Test Controller is responsible for automatically creating a test
log file. A test log entry is made after each round.
Table 5: Execution variables for the Test Controller CCP process
Variable Data Type Data Range Comments
Test_Phase Enumerated {HSTC, FHSTC, HEC} For HSTC tests, HSTC is the
only phase. For HEC tests,
all the phases apply.
HSTC_Done Boolean {FALSE, TRUE} Flag asserted if no
susceptibility is found up to
HSTC_Max_Field_Strength
HEC_Done Boolean {FALSE, TRUE} Flag asserted when HEC test
phase is complete
Round_Index Integer 000 - 999 Unique round identifier
Frequency Real 100.0 - 1000.0 MHz --
Field_Strength Real 0.0 – 1000.0 V/m --
HSTC_Fail_Field_Strength Real 0.0 - 1000.0 V/m --
Trial Integer 1 - N For 2-out-of-3 rule, and HEC
test phase
Round_Result Enumerated {Abort, Pass, Fail} Result of round
Test_Point_Decision Enumerated {None, Retry, Pass, Fail} Decision for the test point.
Table 6 lists the timeout delays used in the Test Controller CCP process. Specific values for the CCP
timeout delays will be empirically determined during the integration of the TCS computers.
Page 26
20
Table 6: Timeout delays for the Test Controller CCP process
Timeout Comments
READY_Receive_Delay_Max Maximum allowed delay for receiving the READY messages from the monitors
after the Test Controller is enabled to execute a round.
START_Receive_Delay_Max Maximum allowed delay to receive the START messages from the monitors after
the READY echo is sent by the Test Controller
HIRF_Begin_Delay Delay by the Test Controller to start the radiation after sending the START echo
message
HSTC_Round_End_Delay Time delay from the beginning of the radiation until the round is complete for the
HSTC and FHSTC test phases
HEC_Round_End_Delay Time delay from the beginning of the radiation until the round is complete for the
HEC test phase
Figure 11 shows the rule for deciding what to do after the radiated target components experience
errors at a given field strength and frequency test point. This is a 2-out-of-3 rule for confirming
susceptibility at a given frequency and field strength. This rule applies to the HSTC and FHSTC test
phases.
Figure 11: Rule for determining susceptibility at a given frequency and field strength
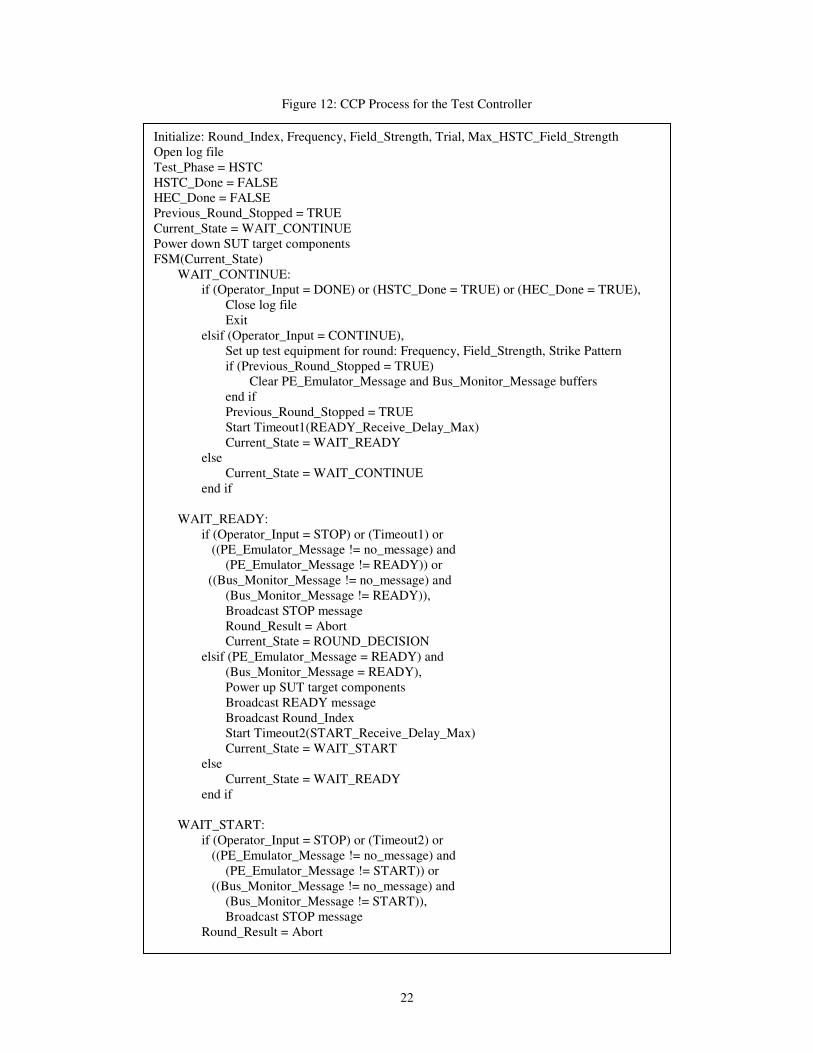
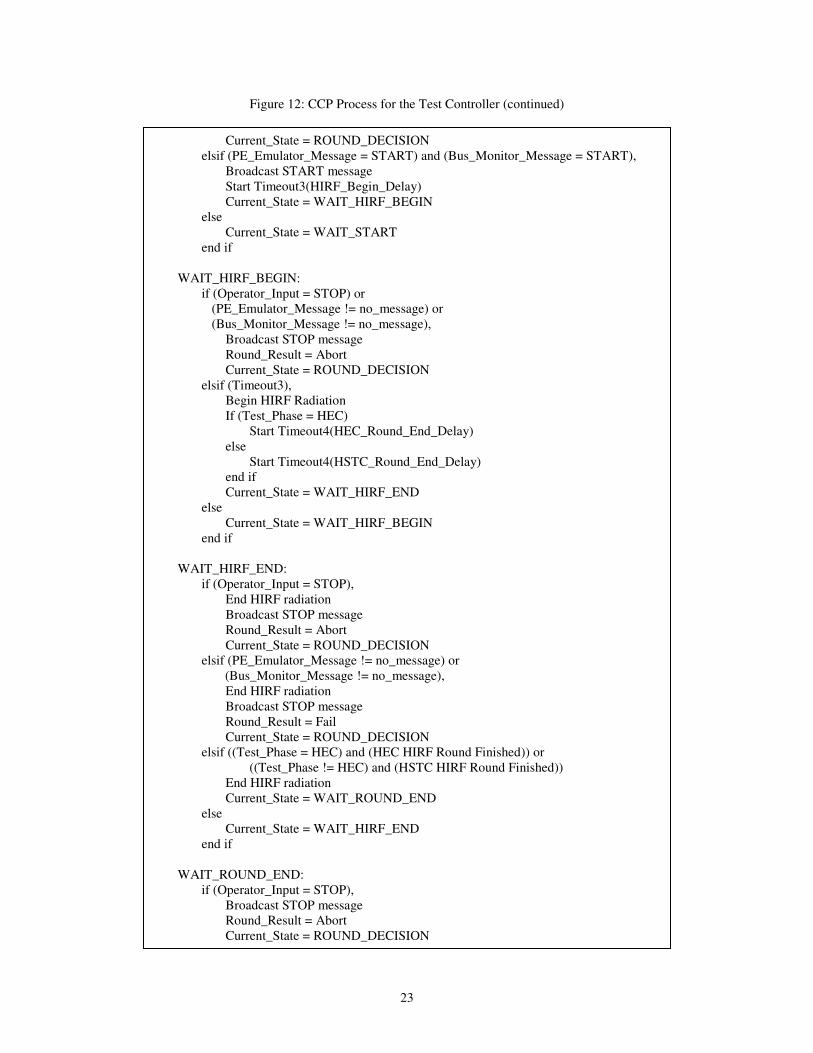
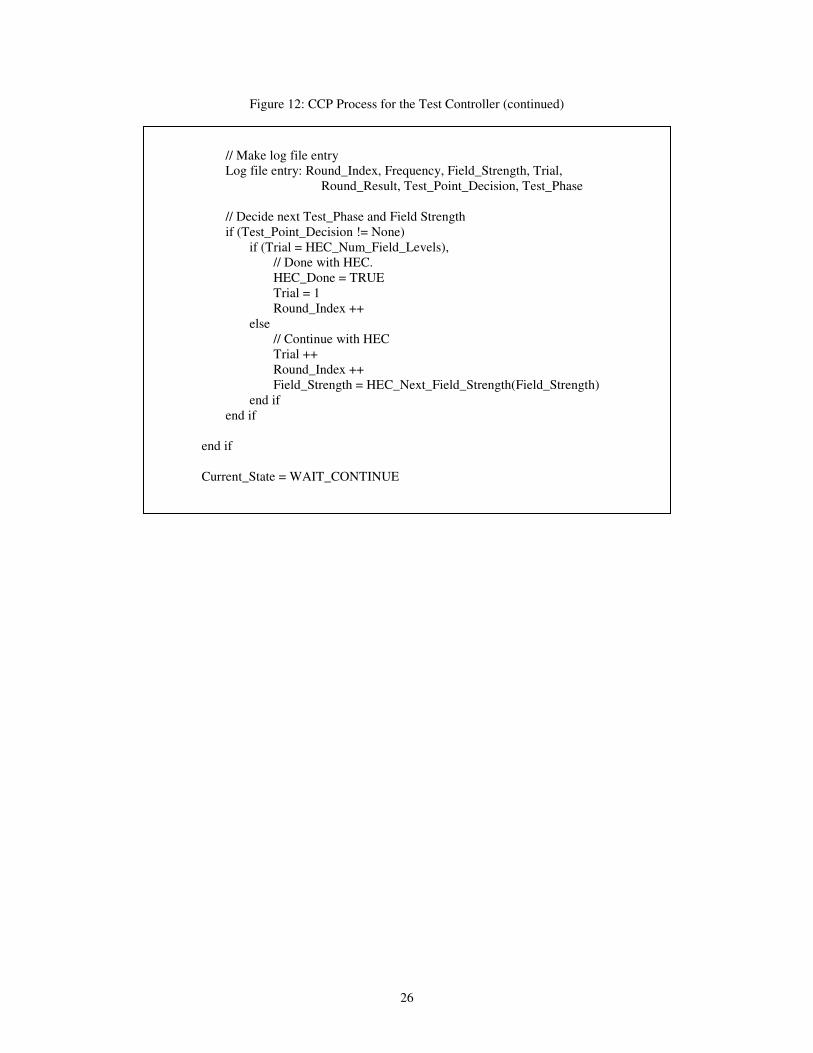
Figure 12 lists the CCP process for the Test Controller using pseudo-code and finite state
machine (FSM) notation. This process is designed to always return the Test Controller, the RF equipment
and the targeted devices inside the chamber to a safe state after every round. The test log files and the
field measurements collected by the Test Controller are stored locally during testing and transferred to the
repository afterward.
Figure 13 lists the CCP process for the PE Emulator and the Bus Monitor. After every round, the PE
Emulator and the Bus Monitor automatically transfer their data files to the test data repository. This
process is designed with an auto-continue feature by which the PE Emulator and the Bus Monitor
automatically begin the next round if no abnormal conditions are detected by the end of a round. The
Test Controller process does not have this feature and requires the operator to manually begin the next
round. This combination simplifies and expedites the execution of the test, while allowing the operator to
always maintain control and safety during the test.
Table 7 lists the timeout delays in the CCP process of the PE Emulator and the Bus Monitor. The
1. If a target-originated error is not detected during the first round, the target shall be tested at
the next field strength level. If a target-originated error is detected during the first round, the
round shall be repeated.
2. If a target-originated error is detected during the second round, susceptibility is confirmed.
If a target-originated error is not detected during the second round, the round shall be repeated
once more.
3. If a target-originated error is detected during the third round, susceptibility is confirmed. If
a target-originated error is not detected during the third round, the target shall be tested at the
next field strength level.
Page 27
21
operator can select one of two available round duration delays, one for the HSTC and FHSTC test rounds
and another for the HEC rounds.
Table 7: Timeout delays in the CCP process for the PE Emulator and the Bus Monitor
Timeout Comments
READY_Send_Delay Delay to send the READY message after the round exeution is enabled
READY_Echo_Delay_Max Maximum allowed delay to received the READY message echo from the Test
Controller after sending the READY message
START_Echo_Delay_Max Maximum allowed delay to received the START message echo from the Test
Controller after sending the START message
Round_Completion_Delay_1 Option 1 for the duration of the round
Round_Completion_Delay_2 Option 2 for the duration of the round
Page 28
22
Figure 12: CCP Process for the Test Controller
Initialize: Round_Index, Frequency, Field_Strength, Trial, Max_HSTC_Field_Strength
Open log file
Test_Phase = HSTC
HSTC_Done = FALSE
HEC_Done = FALSE
Previous_Round_Stopped = TRUE
Current_State = WAIT_CONTINUE
Power down SUT target components
FSM(Current_State)
WAIT_CONTINUE:
if (Operator_Input = DONE) or (HSTC_Done = TRUE) or (HEC_Done = TRUE),
Close log file
Exit
elsif (Operator_Input = CONTINUE),
Set up test equipment for round: Frequency, Field_Strength, Strike Pattern
if (Previous_Round_Stopped = TRUE)
Clear PE_Emulator_Message and Bus_Monitor_Message buffers
end if
Previous_Round_Stopped = TRUE
Start Timeout1(READY_Receive_Delay_Max)
Current_State = WAIT_READY
else
Current_State = WAIT_CONTINUE
end if
WAIT_READY:
if (Operator_Input = STOP) or (Timeout1) or
((PE_Emulator_Message != no_message) and
(PE_Emulator_Message != READY)) or
((Bus_Monitor_Message != no_message) and
(Bus_Monitor_Message != READY)),
Broadcast STOP message
Round_Result = Abort
Current_State = ROUND_DECISION
elsif (PE_Emulator_Message = READY) and
(Bus_Monitor_Message = READY),
Power up SUT target components
Broadcast READY message
Broadcast Round_Index
Start Timeout2(START_Receive_Delay_Max)
Current_State = WAIT_START
else
Current_State = WAIT_READY
end if
WAIT_START:
if (Operator_Input = STOP) or (Timeout2) or
((PE_Emulator_Message != no_message) and
(PE_Emulator_Message != START)) or
((Bus_Monitor_Message != no_message) and
(Bus_Monitor_Message != START)),
Broadcast STOP message
Round_Result = Abort
Page 29
23
Figure 12: CCP Process for the Test Controller (continued)
Current_State = ROUND_DECISION
elsif (PE_Emulator_Message = START) and (Bus_Monitor_Message = START),
Broadcast START message
Start Timeout3(HIRF_Begin_Delay)
Current_State = WAIT_HIRF_BEGIN
else
Current_State = WAIT_START
end if
WAIT_HIRF_BEGIN:
if (Operator_Input = STOP) or
(PE_Emulator_Message != no_message) or
(Bus_Monitor_Message != no_message),
Broadcast STOP message
Round_Result = Abort
Current_State = ROUND_DECISION
elsif (Timeout3),
Begin HIRF Radiation
If (Test_Phase = HEC)
Start Timeout4(HEC_Round_End_Delay)
else
Start Timeout4(HSTC_Round_End_Delay)
end if
Current_State = WAIT_HIRF_END
else
Current_State = WAIT_HIRF_BEGIN
end if
WAIT_HIRF_END:
if (Operator_Input = STOP),
End HIRF radiation
Broadcast STOP message
Round_Result = Abort
Current_State = ROUND_DECISION
elsif (PE_Emulator_Message != no_message) or
(Bus_Monitor_Message != no_message),
End HIRF radiation
Broadcast STOP message
Round_Result = Fail
Current_State = ROUND_DECISION
elsif ((Test_Phase = HEC) and (HEC HIRF Round Finished)) or
((Test_Phase != HEC) and (HSTC HIRF Round Finished))
End HIRF radiation
Current_State = WAIT_ROUND_END
else
Current_State = WAIT_HIRF_END
end if
WAIT_ROUND_END:
if (Operator_Input = STOP),
Broadcast STOP message
Round_Result = Abort
Current_State = ROUND_DECISION
Page 30
24
Figure 12: CCP Process for the Test Controller (continued)
elsif (PE_Emulator_Message != no_message) or
(Bus_Monitor_Message != no_message),
Broadcast STOP message
Round_Result = Fail
Current_State = ROUND_DECISION
elsif (Timeout4),
Previous_Round_Stopped = FALSE
Round_Result = Pass
Current_State = ROUND_DECISION
else
Current_State = WAIT_ROUND_END
end if
ROUND_DECISION:
if (Round_Result != Pass),
Power down SUT target components
end if
// Test Point, Field Strength, and Test Phase Decision
if (Test_Phase = HSTC) or (Test_Phase = FHSTC),
// Test Point Decision for HSTC and FHSTC (2-out-of-3 rule)
if (Round_Result = Abort),
Test_Point_Decision = None
else
if (Trial = 1),
if (Round_Result = Pass),
Test_Point_Decision = Pass
else
Test_Point_Decision = Retry
end if
elsif (Trial = 2),
if (Round_Result = Pass),
Test_Point_Decision = Retry
else
Test_Point_Decision = Fail
end if
else
if (Round_Result = Pass),
Test_Point_Decision = Pass
else
Test_Point_Decision = Fail
end if
end if
end if
// Make log file entry
Log file entry: Round_Index, Frequency, Field_Strength, Trial,
Round_Result, Test_Point_Decision, Test_Phase
// Set Trial number and Round Index
if (Test_Point_Decision = Pass) or (Test_Point_Decision = Fail),
Trial = 1
Page 31
25
Figure 12: CCP Process for the Test Controller (continued)
Round_Index ++
elsif (Test_Point_Decision = Retry)
Trial ++
Round_Index ++
end if
// Decide next Test_Phase and Field_Strength
if (Test_Phase = HSTC) and (Test_Point_Decision = Pass),
if (Field_Strength = HSTC_Max_Field_Strength),
HSTC_Done = TRUE
else
Field_Strength = HSTC_Next_Field_Strength(Field_Strength)
end if
elsif (Test_Phase = HSTC) and (Test_Point_Decision = Fail),
// Save current HSTC field strength
HSTC_Fail_Field_Strength=Field _Strength
// Get first FHSTC field strength
Field_Strength = FHSTC_First_Field_Strength(Field_Strength)
// Go to FHSTC Phase
Test_Phase = FHSTC
elsif (Test_Phase = FHSTC) and (Test_Point_Decision = Pass),
// Get next FHSTC field strength
Field_Strength = FHSTC_Next_Field_Strength(Field_Strength)
// If next FHSTC field strength is equal to the latest one of HSTC
// (with test point decision of Fail), do not retest there and go directly to HEC
If (Field_Strength = HSTC_Fail_Field_Strength),
Field_Strength = HEC_First_Field_Strength(
HSTC_Fail_Field_Strength)
Test_Phase = HEC
end if
elsif (Test_Phase = FHSTC) and (Test_Point_Decision = Fail),
// Get first HEC test point and go to HEC phase
Field_Strength = HEC_First_Field_Strength(Field_Strength)
Test_Phase = HEC
end if
else
// For HEC
// Test Point Decision
if (Round_Result = Abort),
Test_Point_Decision = None
elsif (Round_Result = Pass),
Test_Point_Decision = Pass
else
Test_Point_Decision = Fail
end if
Page 32
26
Figure 12: CCP Process for the Test Controller (continued)
// Make log file entry
Log file entry: Round_Index, Frequency, Field_Strength, Trial,
Round_Result, Test_Point_Decision, Test_Phase
// Decide next Test_Phase and Field Strength
if (Test_Point_Decision != None)
if (Trial = HEC_Num_Field_Levels),
// Done with HEC.
HEC_Done = TRUE
Trial = 1
Round_Index ++
else
// Continue with HEC
Trial ++
Round_Index ++
Field_Strength = HEC_Next_Field_Strength(Field_Strength)
end if
end if
end if
Current_State = WAIT_CONTINUE
Page 33
27
Figure 13: CCP Process for the PE Emulator and the Bus Monitor
Load local SUT-interface functions
Auto_Continue = FALSE
Current_State = WAIT_CONTINUE
FSM(Current_State)
WAIT_CONTINUE:
if (Auto_Continue = FALSE) and
if (Operator_Input = DONE),
Exit
elsif (Operator_Input = CONTINUE_1) or (Operator_Input = CONTINUE_2),
Disable and reset local SUT-interface functions
Clear Test_Controller_Message buffer
Auto_Continue = FALSE
if (Operator_Input = CONTINUE_1)
Round_Completion_Delay = Round_Completion_Delay_1
else
Round_Completion_Delay = Round_Completion_Delay_2
end if
Start Timeout1(READY_Send_Delay)
Current_State = WAIT_SEND_READY
else
Current_State = WAIT_CONTINUE
end if
else
Disable and reset local SUT-interface functions
Auto_Continue = FALSE
Start Timeout1(READY_Send_Delay)
Current_State = WAIT_SEND_READY
end if
WAIT_SEND_READY:
if (Operator_Input = STOP) or (Test_Controller_Message != no_message),
Send STOP message
Current_State = WAIT_CONTINUE
elsif (Timeout1),
Send READY message
Start Timeout2(READY_Echo_Delay_Max)
Current_State = WAIT_READY_ECHO
else
Current_State = DELAY_READY
end if
WAIT_READY_ECHO:
if (Operator_Input = STOP) or
((Test_Controller_Message != no_message) and
(Test_Controller_Message != READY)) or
(Timeout2),
Send STOP message
Current_State = WAIT_CONTINUE
Page 34
28
Figure 13: CCP Process for the PE Emulator and the Bus Monitor (continued)
elsif (Test_Controller_Message = READY),
Current_State = WAIT_ROUND_INDEX
else
Current_State = WAIT_READY_ECHO
end if
WAIT_ROUND_INDEX:
if (Operator_Input = STOP) or
((Test_Controller_Message != no_message) and
(Test_Controller_Message != valid_round_index)) or
(Timeout2),
Send STOP message
Current_State = WAIT_CONTINUE
elsif (Test_Controller_Message = valid_round_index),
Set Round_Index = Test_Controller_Message
Enable local SUT-interface functions
Begin collection of SUT data records
Current_State = WAIT_SUT_STATUS
else
Current_State = WAIT_ROUND_INDEX
end if
WAIT_SUT_STATUS:
if (Operator_Input = STOP) or (Test_Controller_Message != no_message) or
(SUT_Status = FAILED),
End collection of SUT data records
Send STOP message
Current_State = SAVE_DATA_RECORDS
elsif (SUT_Status = TRUSTED),
Send START message
Start Timeout3(START_Echo_Delay_Max)
Current_State = WAIT_START_ECHO
else
Current_State = WAIT_SUT_STATUS
end if
WAIT_START_ECHO:
if (Operator_Input = STOP) or
((Test_Controller_Message != no_message) and
(Test_Controller_Message != START)) or
(SUT_Status != TRUSTED) or (Timeout3),
End collection of SUT data records
Send STOP message
Current_State = SAVE_DATA_RECORDS
elsif (Test_Controller_Message = START),
Discard accumulated SUT data records
Start Timeout4(Round_Completion_Delay)
Current_State = WAIT_ROUND_COMPLETION
else
Current_State = WAIT_START_ECHO
Page 35
29
Figure 13: CCP Process for the PE Emulator and the Bus Monitor (continued)
7. Health Checks
Each hardware configuration HIRF test will be preceded and followed by a hardware configuration
Health Check consisting of a two-hour run without radiation. A Health Check will also be performed
after every change to the hardware components of the tested hardware configuration. The purpose of
these checks is to confirm that the system is operating properly before a HIRF test and to expose any
damage caused by the radiation. The health checks provide assurance that errors detected during a HIRF
test are due to the effect of the field on the targeted components and not due to the monitoring system or
SUT components outside the radiation chamber.
8. Shielding and Grounding
Figure 14 shows a RSPP node in its normal configuration when placed outside the test chamber. The
enclosure is made of aluminum, and the endcaps are attached to the extrusion via metal screws. Power is
delivered to the node by a shielded power cable grounded at the source end. The power cable shield is
electrically attached to the connector at the node, thus grounding the enclosure. The optical fibers and the
power cable are the only external connections.
end if
WAIT_ROUND_COMPLETION:
if (Operator_Input = STOP) or (Test_Controller_Message != no_message) or
(SUT_Status = FAILED)
End collection of SUT data records
Send STOP message
Current_State = SAVE_DATA_RECORDS
elsif (Timeout4),
Auto_Continue = TRUE
End collection of SUT data records
if (SUT data records show SUT-originated errors during round)
Send STOP messsage
Current_State = SAVE_DATA_RECORDS
else
Current_State = WAIT_ROUND_COMPLETION
end if
SAVE_DATA_RECORDS:
Save collected SUT data records to file (filename suffix: Round_Index)
Transfer file to repository
Current_State = WAIT_CONTINUE
Page 36
30
Figure 14: RSPP Node in Normal Configuration
Figure 15 shows a RSPP node in its configuration when it is inside the test chamber. All the targeted
components will have the extrusions of the shielding enclosures removed in order to allow the
electromagnetic field to directly reach the electronic components. In this configuration, only the endcap
connected to the power cable is grounded.
Figure 15: RSPP Node in Targeted Configuration Inside the Test Chamber
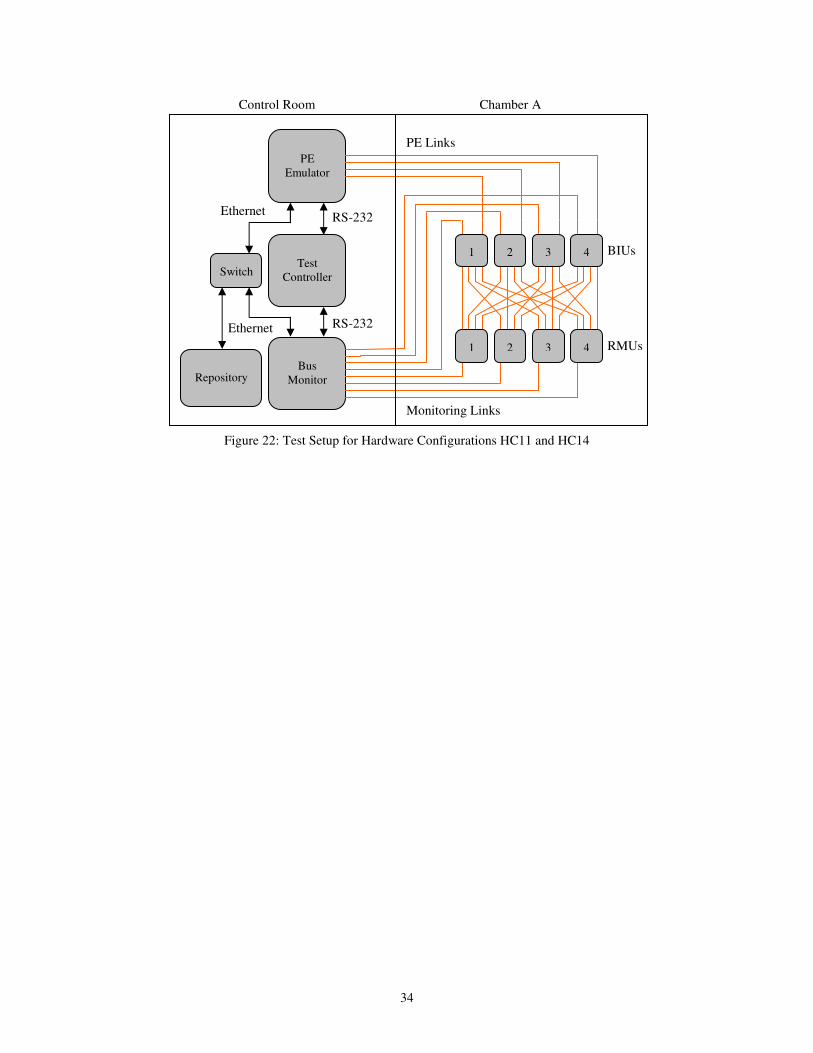
9. Equipment Layout
Figures 16 to 22 show the test setups for all the hardware configurations. The PE Emulator, Bus
Monitor, and all the nodes inside the Control Room will receive 24V DC power from individual power
supplies connected to standard AC wall outlets. The nodes inside Chamber A will receive 24V DC power
from a power source controlled by the Test Controller. In order to minimize the distortion to the field
characteristics experienced by the nodes inside Chamber A, the nodes will be separated from each other,
from the chamber walls, floor and ceiling, and from any other metallic objects by at least 1.5 m (i.e., one
Shielded and
Grounded
Power Cable
Endcap Extrusion Endcap
Page 37
31
half wavelength at the lowest test frequency). The targeted nodes inside Chamber A will be placed on top
of foam blocks or tables to provide support and ensure separation from the chamber floor.
Figure 16: Test Setup for Hardware Configurations HC1 and HC2
Figure 17: Test Setup for Hardware Configurations HC3 and HC6
BIUs
RMUs
Bus
Monitor
Repository
Test
Controller
PE
Emulator
Switch
RS-232
RS-232
Ethernet
Ethernet
1
Chamber A Control Room
4 2 1 3
4 3 2
PE and NFA Links
Monitoring Links
Bus
Monitor
Repository
Test
Controller
PE
Emulator
Switch
RS-232
RS-232
Ethernet
Ethernet
4
Chamber A Control Room
PE Links
Monitoring
Link
Hub
Page 38
32
Figure 18: Test Setup for Hardware Configurations HC4 and HC7
Figure 19: Test Setup for Hardware Configurations HC5 and HC8
BIUs
RMUs
Bus
Monitor
Repository
Test
Controller
PE
Emulator
Switch
RS-232
RS-232
Ethernet
Ethernet
4 2 1 3
4 3 2 1
Chamber A Control Room
NFA Links
PE Links
BIUs
RMUs
Bus
Monitor
Repository
Test
Controller
PE
Emulator
Switch
RS-232
RS-232
Ethernet
Ethernet
1
Chamber A Control Room
4 2 1 3
2
PE and NFA Links
Monitoring Links
Page 39
33
Figure 20: Test Setup for Hardware Configurations HC9 and HC12
Figure 21: Test Setup for Hardware Configurations HC10 and HC13
BIUs
RMUs
Bus
Monitor
Repository
Test
Controller
PE
Emulator
Switch
RS-232
RS-232
Ethernet
Ethernet
1 3 4 2
1 2
Chamber A Control Room
PE Links
Monitoring Links
BIUs
RMUs
Bus
Monitor
Repository
Test
Controller
PE
Emulator
Switch
RS-232
RS-232
Ethernet
Ethernet
1 3 4 2
1 2 3
Chamber A Control Room
PE Links
Monitoring Links
Page 40
34
Figure 22: Test Setup for Hardware Configurations HC11 and HC14
BIUs
RMUs
Bus
Monitor
Repository
Test
Controller
PE
Emulator
Switch
RS-232
RS-232
Ethernet
Ethernet
1 3 4 2
1 2 3 4
Chamber A Control Room
PE Links
Monitoring Links
Page 41
35
References
[1] Fuller, Gerald L.: Understanding HIRF – High Intensity Radiated Fields. Aviation Communications,
Inc., Leesburg, VA, 1995, p. 7-2.
[2] Hess, Richard: Computing Platform Architectures for Robust Operation in the Presence of Lightning
and Other Electromagnetic Threats. Presented at the 16th Digital Avionics Systems Conference
(DASC), Irvine, California, October 26-30, 1997
[3] Miner, Paul S.; Malekpour, Mahyar; and Torres, Wilfredo: A Conceptual Design for a Reliable Optical
Bus (ROBUS). Presented at the 21st Digital Avionics Systems Conference (DASC),Irvine, California,
October 27-31, 2002.
[4] Torres-Pomales, Wilfredo; Malekpour, Mahyar; and Miner, Paul S.: ROBUS-2: A Fault-Tolerant
Broadcast Communication System. NASA TM-2005-213540, 2005.
[5] Torres-Pomales, Wilfredo; Malekpour, Mahyar; and Miner, Paul S.: Design of the Protocol Processor
for the ROBUS-2 Communication System. NASA TM-2005-213934, 2005.
[6] RTCA DO-160D, Change No. 1, “Environmental Conditions and Test Procedures for Airborne
Equipment”, Section 20, “Radio Frequency Susceptibility (Radiated and Conducted)”, December 2000.
[7] Ladbury, J.; Koepke, G.; Camell, D.: “Evaluation of the NASA Langley Research Center Mode-Stirred
Chamber Facility”, NIST Technical Note 1508, January 1999.
[8] http://opensource.arc.nasa.gov/project/robus-2/
Page 42
36
Acronyms
ASCII American Standard Code for Information Interchange
BIU Bus Interface Unit
CCP Controller Coordination Protocol
COTS Commercial Off-The-Shelf
CPU Central Processing Unit
CW Continuous Wave
DC Direct Current
DSI Derivation Systems, Inc.
EM Electromagnetic
EMI Electromagnetic Interference
FHSTC Fine HIRF Susceptibility Threshold Characterization
FPGA Field Programmable Gate Array
FSM Finite State Machine
HC Hardware Configuration
HEC HIRF Effects Characterization
HFA Hub Fault Analyzer
HIRF High Intensity Radiated Field
HSTC HIRF Susceptibility Threshold Characterization
IVHM Integrated Vehicle Health Management
LUF Lowest Usable Frequency
Mbps Mega-bits per second
NFA Node Fault Analyzer
NIST National Institute of Standards and Technology
PE Processing Element
RC Reverberation Chamber
RF Radio Frequency
RMU Redundancy Management Unit
ROBUS Reliable Optical Bus
RPP ROBUS Protocol Processor
RSPP Reconfigurable SPIDER Prototyping Platform
RTCA Radio Technical Commission for Aeronautics
SBIR Small Business Innovation Research
SHM System Health Monitor
SPIDER Scalable Processor-Independent Design for Extended Reliability
SUT System Under Test
TCS Test Control System
TDMA Time Division Multiple Access
Page 43
REPORT DOCUMENTATION PAGE Form ApprovedOMB No. 0704-0188
2. REPORT TYPE Technical Memorandum
4. TITLE AND SUBTITLEPlan for the Characterization of HIRF Effects on a Fault-Tolerant Computer Communication System
5a. CONTRACT NUMBER
6. AUTHOR(S)
Torres-Pomales, Wilfredo; Malekpour, M. R.; Miner, Paul S.; and Koppen, Sandra V.
7. PERFORMING ORGANIZATION NAME(S) AND ADDRESS(ES)NASA Langley Research Center Hampton, VA 23681-2199
9. SPONSORING/MONITORING AGENCY NAME(S) AND ADDRESS(ES)National Aeronautics and Space AdministrationWashington, DC 20546-0001
8. PERFORMING ORGANIZATION REPORT NUMBER
L-19453
10. SPONSOR/MONITOR'S ACRONYM(S)
NASA
13. SUPPLEMENTARY NOTESAn electronic version can be found at http://ntrs.nasa.gov
12. DISTRIBUTION/AVAILABILITY STATEMENTUnclassified - UnlimitedSubject Category 62Availability: NASA CASI (301) 621-0390
19a. NAME OF RESPONSIBLE PERSON
STI Help Desk (email: [email protected] )
14. ABSTRACT
This report presents the plan for the characterization of the effects of high intensity radiated fields on a prototype implementation of a fault-tolerant data communication system. Various configurations of the communication system will be tested. The prototype system is implemented using off-the-shelf devices. The system will be tested in a closed-loop configuration with extensive real-time monitoring. This test is intended to generate data suitable for the design of avionics health management systems, as well as redundancy management mechanisms and policies for robust distributed processing architectures.
15. SUBJECT TERMSHIRF; Avionics data bus; Distributed processing; Fault tolerance; Redundancy management; Test automation
18. NUMBER OF PAGES
4319b. TELEPHONE NUMBER (Include area code)
(301) 621-0390
a. REPORT
U
c. THIS PAGE
U
b. ABSTRACT
U
17. LIMITATION OF ABSTRACT
UU
Prescribed by ANSI Std. Z39.18Standard Form 298 (Rev. 8-98)
3. DATES COVERED (From - To)
5b. GRANT NUMBER
5c. PROGRAM ELEMENT NUMBER
5d. PROJECT NUMBER
5e. TASK NUMBER
5f. WORK UNIT NUMBER
645846.02.07.07.07
11. SPONSOR/MONITOR'S REPORT NUMBER(S)
NASA/TM-2008-215306
16. SECURITY CLASSIFICATION OF:
The public reporting burden for this collection of information is estimated to average 1 hour per response, including the time for reviewing instructions, searching existing data sources, gathering and maintaining the data needed, and completing and reviewing the collection of information. Send comments regarding this burden estimate or any other aspect of this collection of information, including suggestions for reducing this burden, to Department of Defense, Washington Headquarters Services, Directorate for Information Operations and Reports (0704-0188), 1215 Jefferson Davis Highway, Suite 1204, Arlington, VA 22202-4302. Respondents should be aware that notwithstanding any other provision of law, no person shall be subject to any penalty for failing to comply with a collection of information if it does not display a currently valid OMB control number.PLEASE DO NOT RETURN YOUR FORM TO THE ABOVE ADDRESS.
1. REPORT DATE (DD-MM-YYYY)05 - 200801-