28
Planning Today For Our Children’s Future CCS Facilities Study Follow-Up Informational Presentation February 4, 2013 6:00 PM - CHS
| Date post: | 28-Dec-2015 |
| Category: |
Documents |
| Upload: | garry-andrews |
| View: | 214 times |
| Download: | 0 times |

Planning Today For Our Children’s Future
CCS Facilities StudyFollow-Up Informational
PresentationFebruary 4, 2013
6:00 PM - CHS
District Goals for Future Years
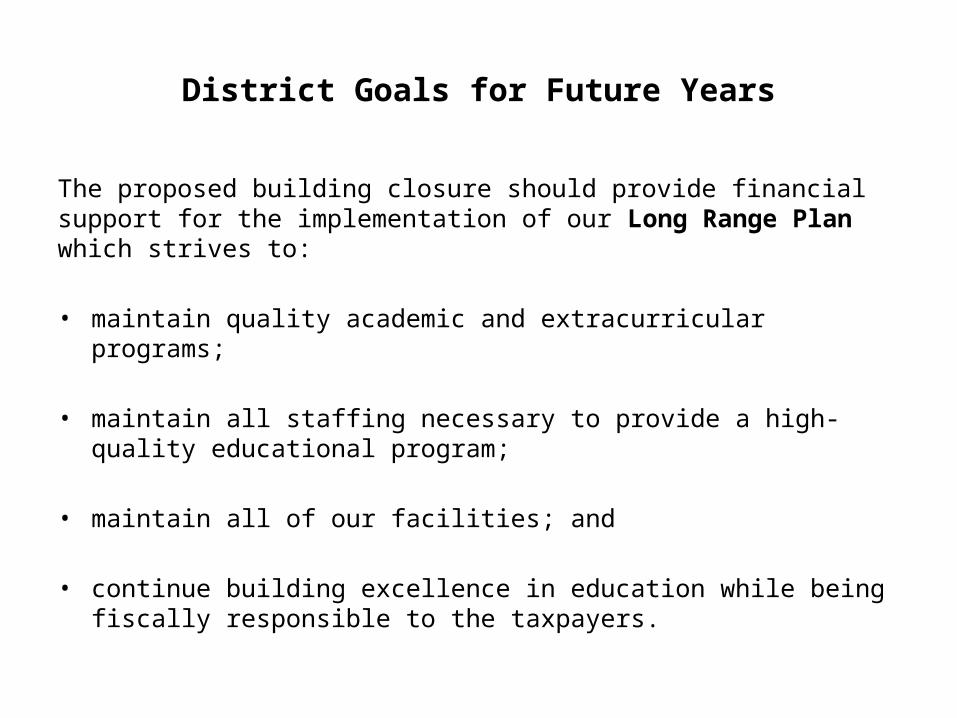
The proposed building closure should provide financial support for the implementation of our Long Range Plan which strives to:
• maintain quality academic and extracurricular programs;
• maintain all staffing necessary to provide a high-quality educational program;
• maintain all of our facilities; and
• continue building excellence in education while being fiscally responsible to the taxpayers.

Commitment to Excellence
As a school community:
• We believe our children and community deserve the best programs and facilities we can provide.
• We believe the success of our schools is among the most valuable asset of owning a home in this community.
• We believe safe and secure facilities for our children are essential.
• We believe in teaching our children to achieve mastery and excellence; to expect the best for themselves.
• We continue working hard to improve our schools and improve academic achievement.

Why Are We Here?
Extremely challenging economic climate:• Not just a Chittenango Central Schools problem.• Not just a New York State problem.• Not just a public school problem.• This is a national fiscal crisis.
Chittenango Central School District has lost $2.4 million in state aid over the past five years.
Our overall budget has remained flat at approximately $36 million for the past five years. Last year’s tax increase of 2% was the lowest it has been in the past five years.
We have taken many measures to reduce expenses over the past five years.
We are operating as efficiently and effectively as possible without significantly hurting students programmatically.
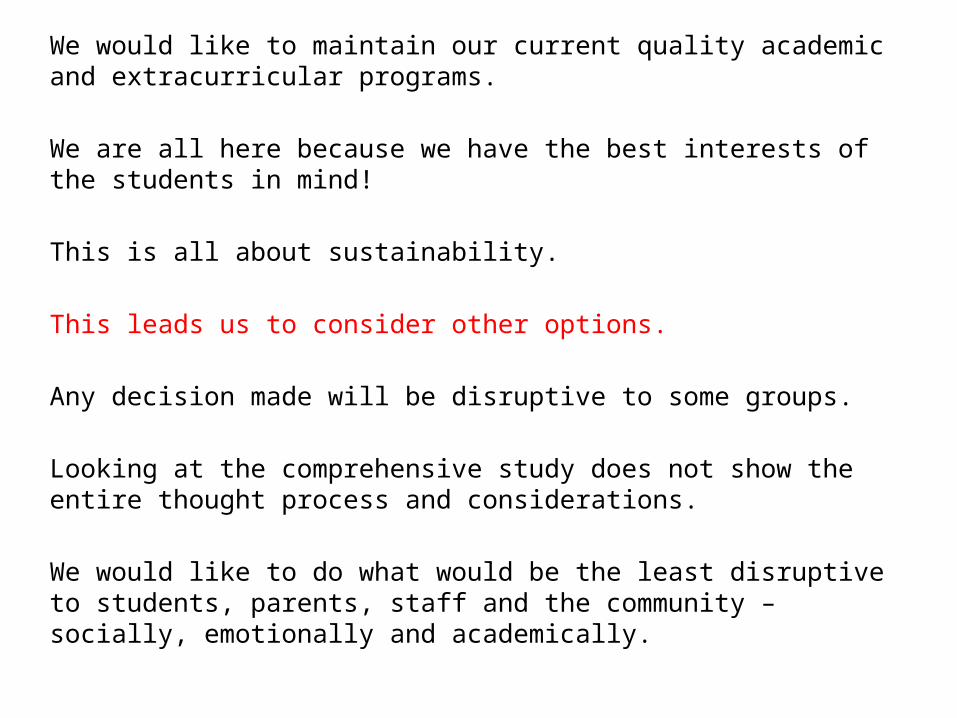
We would like to maintain our current quality academic and extracurricular programs.
We are all here because we have the best interests of the students in mind!
This is all about sustainability.
This leads us to consider other options.
Any decision made will be disruptive to some groups.
Looking at the comprehensive study does not show the entire thought process and considerations.
We would like to do what would be the least disruptive to students, parents, staff and the community – socially, emotionally and academically.
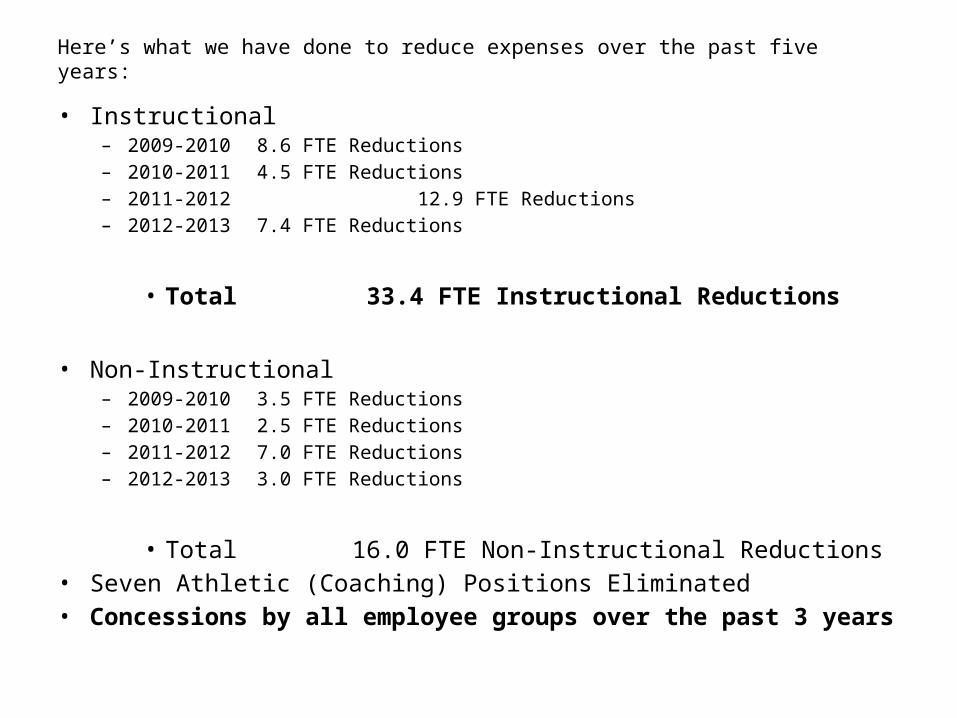
Here’s what we have done to reduce expenses over the past five years:
• Instructional– 2009-2010 8.6 FTE Reductions– 2010-2011 4.5 FTE Reductions– 2011-2012 12.9 FTE Reductions– 2012-2013 7.4 FTE Reductions
• Total 33.4 FTE Instructional Reductions
• Non-Instructional– 2009-2010 3.5 FTE Reductions– 2010-2011 2.5 FTE Reductions– 2011-2012 7.0 FTE Reductions– 2012-2013 3.0 FTE Reductions
• Total 16.0 FTE Non-Instructional Reductions• Seven Athletic (Coaching) Positions Eliminated• Concessions by all employee groups over the past 3 years
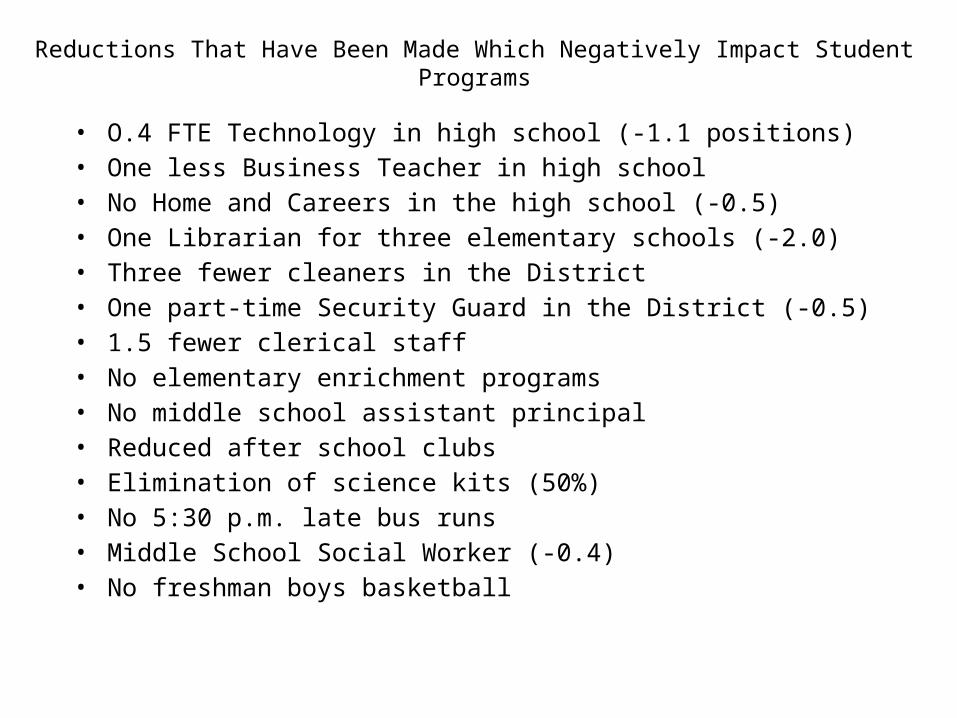
Reductions That Have Been Made Which Negatively Impact Student Programs
• O.4 FTE Technology in high school (-1.1 positions)• One less Business Teacher in high school• No Home and Careers in the high school (-0.5)• One Librarian for three elementary schools (-2.0)• Three fewer cleaners in the District• One part-time Security Guard in the District (-0.5)• 1.5 fewer clerical staff• No elementary enrichment programs• No middle school assistant principal• Reduced after school clubs• Elimination of science kits (50%)• No 5:30 p.m. late bus runs• Middle School Social Worker (-0.4)• No freshman boys basketball

Reductions That Negatively Impact Student Programs(Continued)
• Combined boys/girls bowling (1 coach)• One less indoor track coach• One less football coach• Two junior high boys basketball teams to one• Two junior high girls basketball teams to one• Two junior high girls volleyball teams to one• One less modified wrestling coach• Combined JV/Varsity football cheerleading team (1 coach)• Combined JV/Varsity basketball cheerleading team (1 coach)• AIS writing eliminated in elementary schools (-1.0)• Elimination of 0.4 school Psychologist• Increased class sizes K-12• Combined 6/7 Band and 7/8 Band (-0.6)• Guidance Counselor (-0.5)
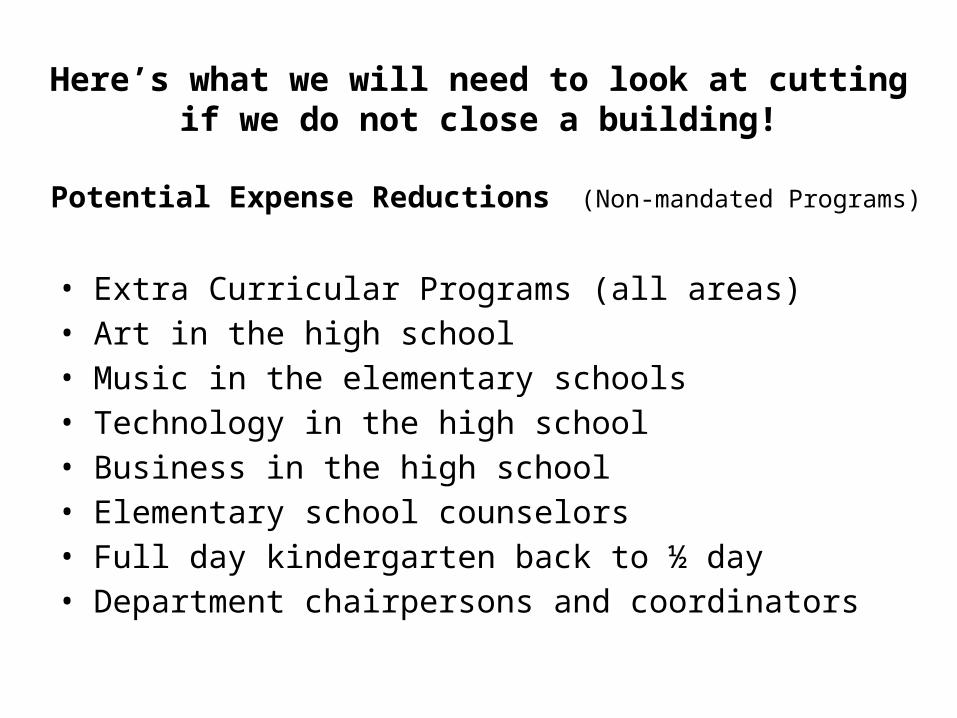
Here’s what we will need to look at cutting if we do not close a building!
Potential Expense Reductions (Non-mandated Programs)
• Extra Curricular Programs (all areas)• Art in the high school• Music in the elementary schools• Technology in the high school• Business in the high school• Elementary school counselors• Full day kindergarten back to ½ day• Department chairpersons and coordinators

Declining Enrollment
1973 To 1992
(3340 Students) (2750 Students) 17.7%
1992 To 2002
(2750 Students) (2530 Students) 8%
2002 To 2012
(2530 Students) (2070 Students) 18.2%
2012 To 2017
(2070 Students) (1890 Students) 8.7%
1973 To 2012
(3340 Students) (2070 Students) 38%

Kindergarten Enrollment History
School Year Total K
1989-90
1990-911991-921992-931993-941994-95 2141995-96 2201996-97 1951997-98 1801998-99 2091999-00 1852000-01 1512001-02 1652002-03 1732003-04 1832004-05 1392005-06 1752006-07 1422007-08 1432008-09 1662009-10 1232010-11 1532011-12 1452012-13 1442013-14 2014-15 2015-16 2016-17

School Year Total K Lake Street
1989-901990-911991-921992-931993-941994-95 214 1361995-96 220 1321996-97 195 1371997-98 180 1321998-99 209 1541999-00 185 1322000-01 151 1232001-02 165 1322002-03 173 1332003-04 183 1092004-05 139 1022005-06 175 1122006-07 142 1082007-08 143 1092008-09 166 1232009-10 123 902010-11 153 1172011-12 145 1032012-13 144 1092013-14 2014-15 2015-16 2016-17
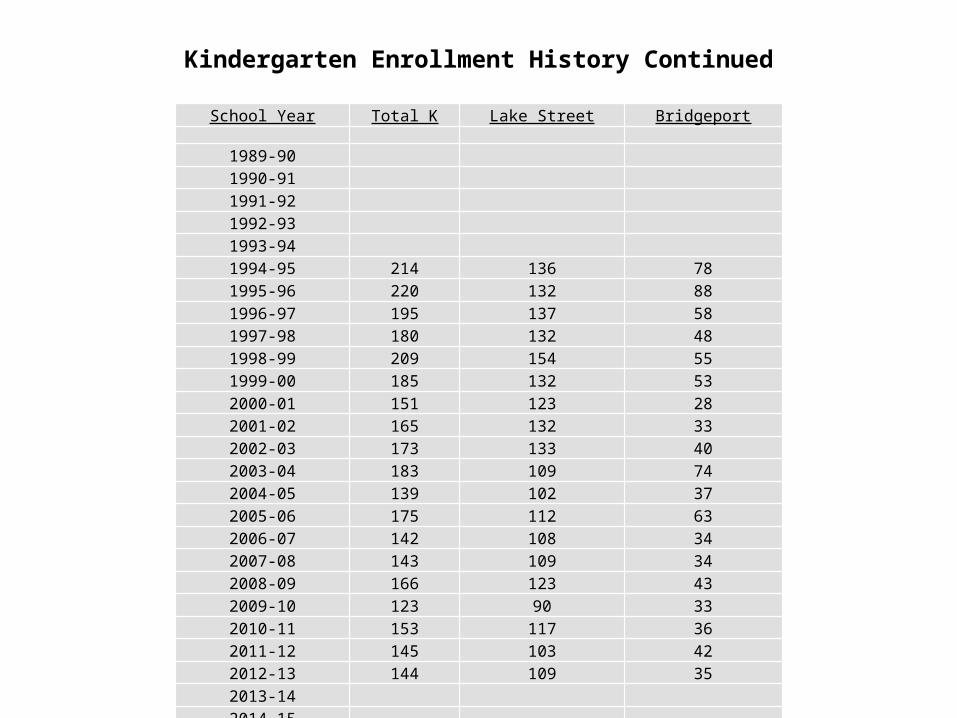
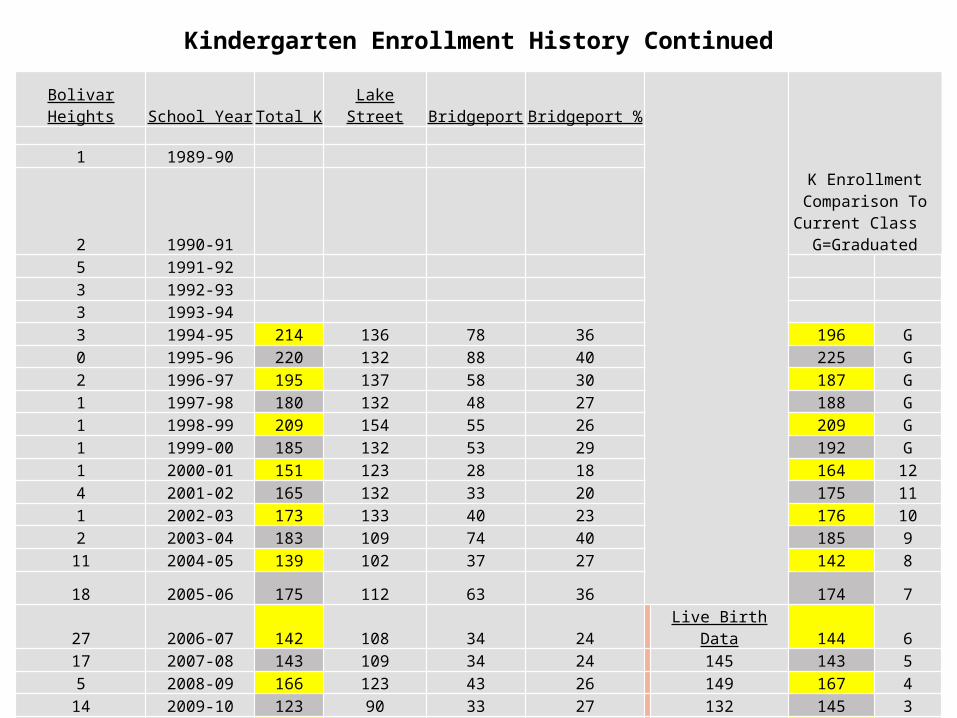
Kindergarten Enrollment History Continued
Kindergarten Enrollment History Continued
School Year Total K Lake Street Bridgeport
1989-901990-911991-921992-931993-941994-95 214 136 781995-96 220 132 881996-97 195 137 581997-98 180 132 481998-99 209 154 551999-00 185 132 532000-01 151 123 282001-02 165 132 332002-03 173 133 402003-04 183 109 742004-05 139 102 372005-06 175 112 632006-07 142 108 342007-08 143 109 342008-09 166 123 432009-10 123 90 332010-11 153 117 362011-12 145 103 422012-13 144 109 352013-14 2014-15 2015-16 2016-17

Kindergarten Enrollment History Continued
School Year Total K Lake Street Bridgeport Bridgeport %
1989-901990-911991-921992-931993-941994-95 214 136 78 361995-96 220 132 88 401996-97 195 137 58 301997-98 180 132 48 271998-99 209 154 55 261999-00 185 132 53 292000-01 151 123 28 182001-02 165 132 33 202002-03 173 133 40 232003-04 183 109 74 402004-05 139 102 37 272005-06 175 112 63 362006-07 142 108 34 242007-08 143 109 34 242008-09 166 123 43 262009-10 123 90 33 272010-11 153 117 36 242011-12 145 103 42 292012-13 144 109 35 242013-14 2014-15 2015-16 2016-17
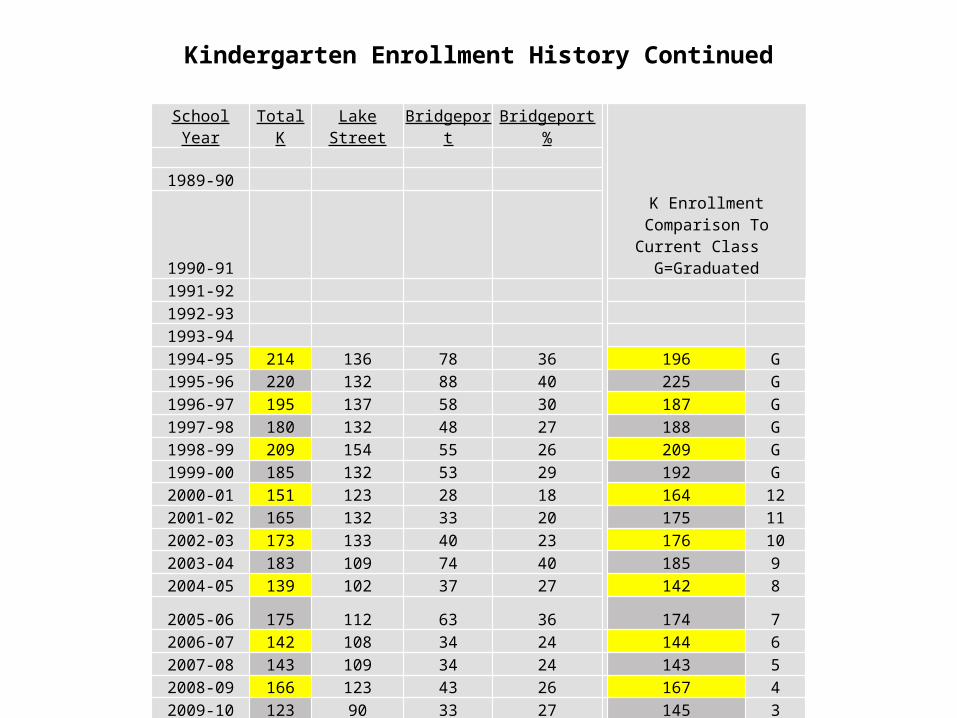
Kindergarten Enrollment History Continued
School Year Total K Lake Street Bridgeport Bridgeport %
K Enrollment Comparison To Current Class
G=Graduated
1989-90
1990-911991-921992-931993-941994-95 214 136 78 36 196 G1995-96 220 132 88 40 225 G1996-97 195 137 58 30 187 G1997-98 180 132 48 27 188 G1998-99 209 154 55 26 209 G1999-00 185 132 53 29 192 G2000-01 151 123 28 18 164 122001-02 165 132 33 20 175 112002-03 173 133 40 23 176 102003-04 183 109 74 40 185 92004-05 139 102 37 27 142 82005-06 175 112 63 36 174 72006-07 142 108 34 24 144 62007-08 143 109 34 24 143 52008-09 166 123 43 26 167 42009-10 123 90 33 27 145 32010-11 153 117 36 24 145 22011-12 145 103 42 29 149 12012-13 144 109 35 24 144 K2013-14 2014-15 2015-16 2016-17
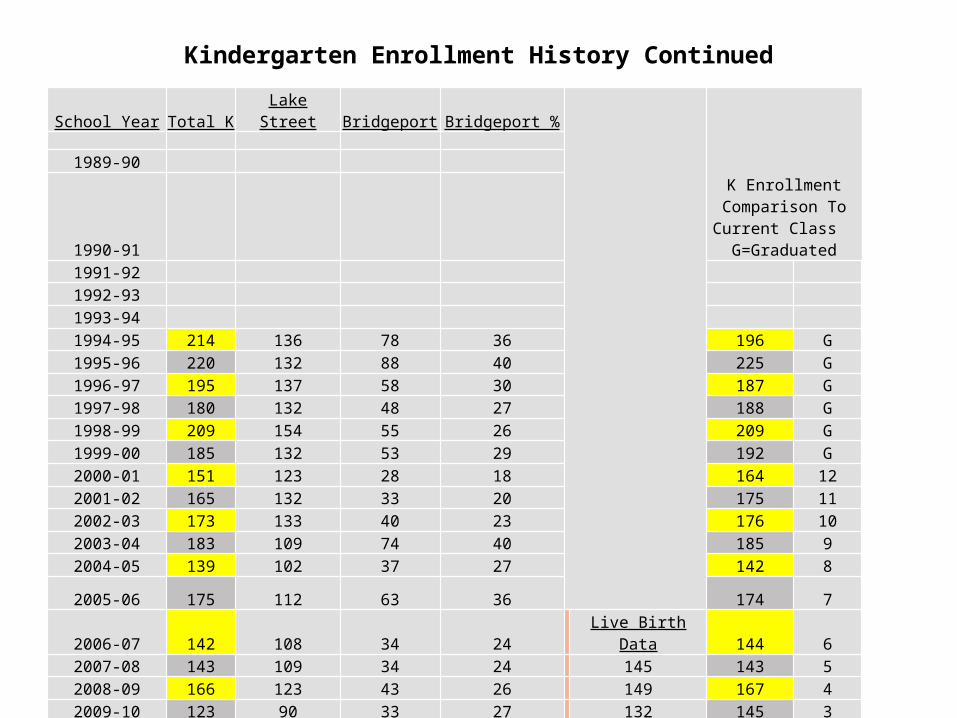
Kindergarten Enrollment History Continued
School Year Total K Lake Street Bridgeport Bridgeport %
K Enrollment Comparison To Current Class G=Graduated
1989-90
1990-911991-921992-931993-941994-95 214 136 78 36 196 G1995-96 220 132 88 40 225 G1996-97 195 137 58 30 187 G1997-98 180 132 48 27 188 G1998-99 209 154 55 26 209 G1999-00 185 132 53 29 192 G2000-01 151 123 28 18 164 122001-02 165 132 33 20 175 112002-03 173 133 40 23 176 102003-04 183 109 74 40 185 92004-05 139 102 37 27 142 82005-06 175 112 63 36 174 72006-07 142 108 34 24 Live Birth Data 144 62007-08 143 109 34 24 145 143 52008-09 166 123 43 26 149 167 42009-10 123 90 33 27 132 145 32010-11 153 117 36 24 123 145 22011-12 145 103 42 29 141 149 12012-13 144 109 35 24 150 144 K2013-14 1492014-15 1152015-16 872016-17 132
Kindergarten Enrollment History Continued
Bolivar Heights School Year Total K Lake Street Bridgeport Bridgeport %
K Enrollment Comparison To Current Class G=Graduated
1 1989-90
2 1990-915 1991-923 1992-933 1993-943 1994-95 214 136 78 36 196 G0 1995-96 220 132 88 40 225 G2 1996-97 195 137 58 30 187 G1 1997-98 180 132 48 27 188 G1 1998-99 209 154 55 26 209 G1 1999-00 185 132 53 29 192 G1 2000-01 151 123 28 18 164 124 2001-02 165 132 33 20 175 111 2002-03 173 133 40 23 176 102 2003-04 183 109 74 40 185 911 2004-05 139 102 37 27 142 818 2005-06 175 112 63 36 174 727 2006-07 142 108 34 24 Live Birth Data 144 617 2007-08 143 109 34 24 145 143 55 2008-09 166 123 43 26 149 167 4
14 2009-10 123 90 33 27 132 145 31 2010-11 153 117 36 24 123 145 2
123 Total 2011-12 145 103 42 29 141 149 1Homes 2012-13 144 109 35 24 150 144 K
Currently 128 2013-14 149students in 2014-15 115
Bolivar Heights 2015-16 872016-17 132

Bolivar Heights School Year Total K Lake Street Bridgeport Bridgeport %
K Enrollment Comparison To Current
Class G=Graduated
1 1989-90
2 1990-915 1991-923 1992-933 1993-943 1994-95 214 136 78 36 196 G0 1995-96 220 132 88 40 225 G2 1996-97 195 137 58 30 187 G1 1997-98 180 132 48 27 188 G1 1998-99 209 154 55 26 209 G1 1999-00 185 132 53 29 192 G1 2000-01 151 123 28 18 164 124 2001-02 165 132 33 20 175 111 2002-03 173 133 40 23 176 102 2003-04 183 109 74 40 185 9
11 2004-05 139 102 37 27 142 818 2005-06 175 112 63 36 174 727 2006-07 142 108 34 24 Live Birth Data 144 617 2007-08 143 109 34 24 145 143 55 2008-09 166 123 43 26 149 167 4
14 2009-10 123 90 33 27 132 145 31 2010-11 153 117 36 24 123 145 2
123 Total 2011-12 145 103 42 29 141 149 1Homes 2012-13 144 109 35 24 150 144 K
Currently 128 2013-14 110 39 149students in 2014-15 85 30 115
Bolivar Heights 2015-16 64 23 872016-17 98 34 132
Kindergarten Enrollment History
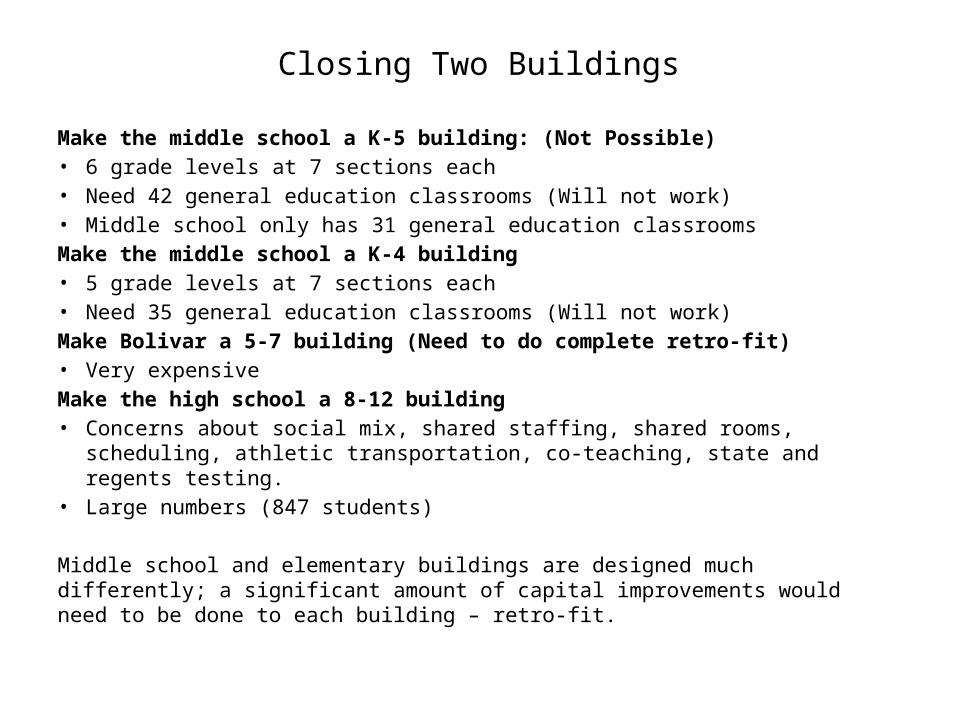
Closing Two Buildings
Make the middle school a K-5 building: (Not Possible)• 6 grade levels at 7 sections each• Need 42 general education classrooms (Will not work)• Middle school only has 31 general education classrooms
Make the middle school a K-4 building • 5 grade levels at 7 sections each• Need 35 general education classrooms (Will not work)
Make Bolivar a 5-7 building (Need to do complete retro-fit)• Very expensive
Make the high school a 8-12 building • Concerns about social mix, shared staffing, shared rooms, scheduling, athletic
transportation, co-teaching, state and regents testing.• Large numbers (847 students)
Middle school and elementary buildings are designed much differently; a significant amount of capital improvements would need to be done to each building – retro-fit.
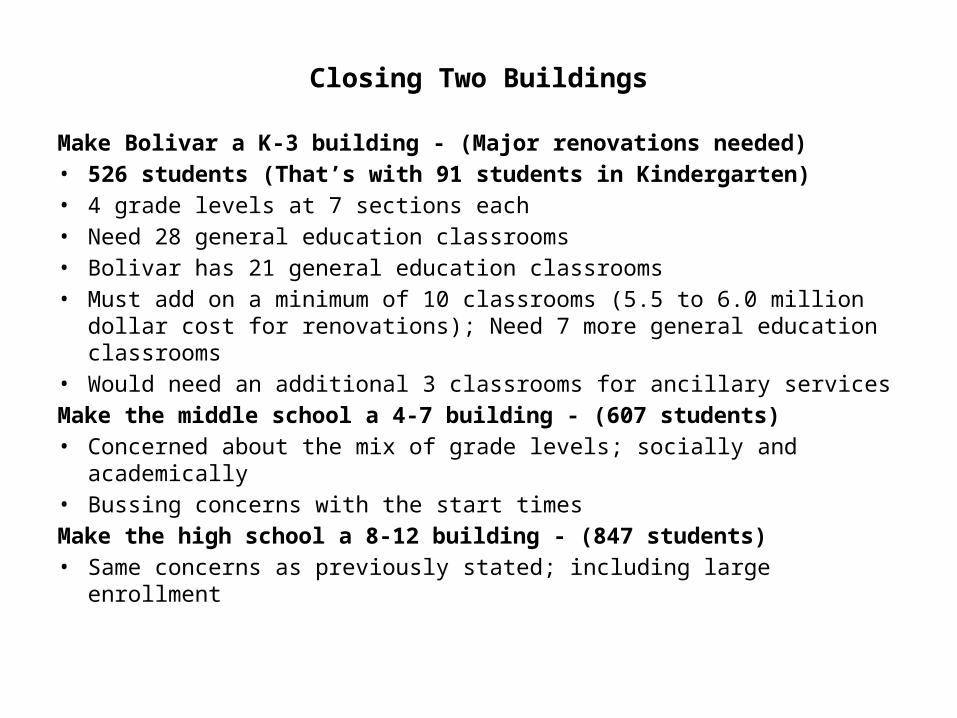
Closing Two Buildings
Make Bolivar a K-3 building - (Major renovations needed)• 526 students (That’s with 91 students in Kindergarten)• 4 grade levels at 7 sections each• Need 28 general education classrooms• Bolivar has 21 general education classrooms• Must add on a minimum of 10 classrooms (5.5 to 6.0 million dollar
cost for renovations); Need 7 more general education classrooms• Would need an additional 3 classrooms for ancillary services
Make the middle school a 4-7 building - (607 students)• Concerned about the mix of grade levels; socially and academically• Bussing concerns with the start times
Make the high school a 8-12 building - (847 students)• Same concerns as previously stated; including large enrollment
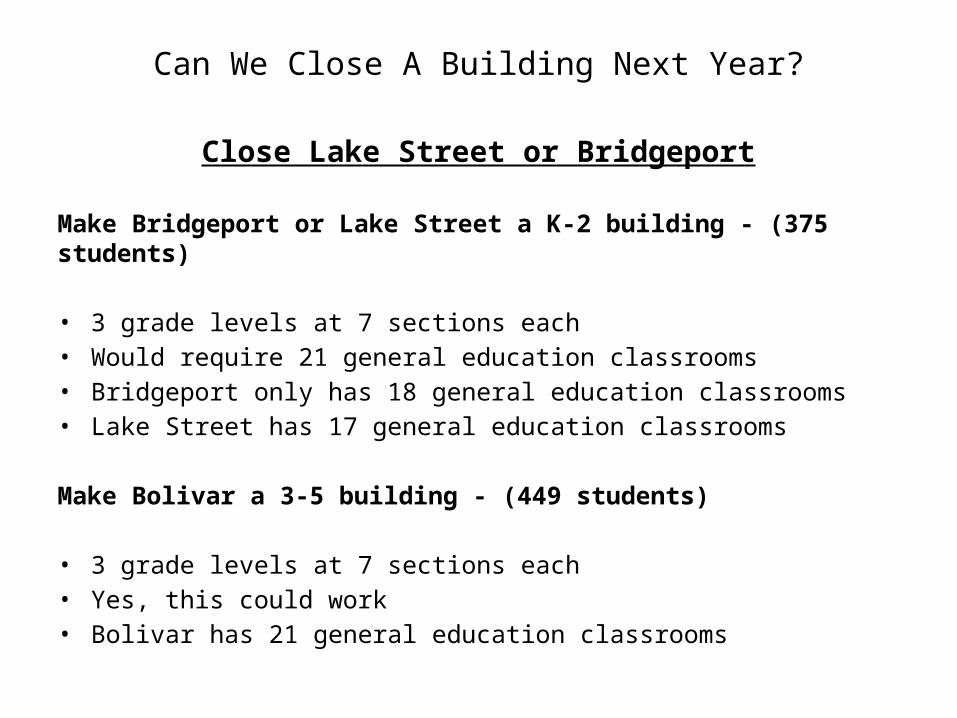
Can We Close A Building Next Year?
Close Lake Street or Bridgeport
Make Bridgeport or Lake Street a K-2 building - (375 students)
• 3 grade levels at 7 sections each• Would require 21 general education classrooms• Bridgeport only has 18 general education classrooms • Lake Street has 17 general education classrooms
Make Bolivar a 3-5 building - (449 students)
• 3 grade levels at 7 sections each• Yes, this could work• Bolivar has 21 general education classrooms
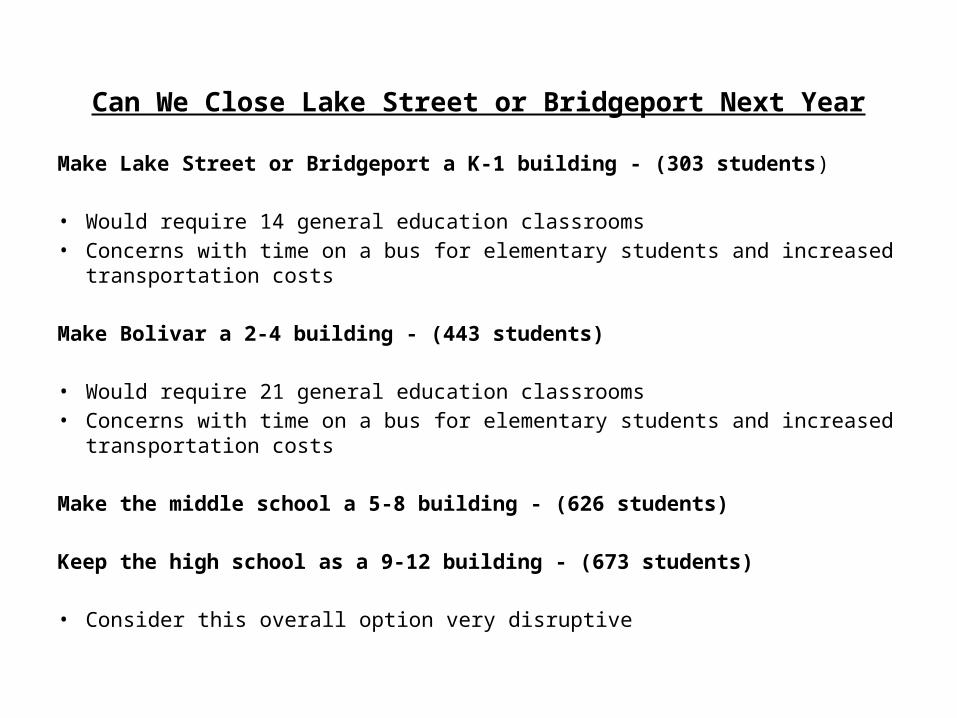
Can We Close Lake Street or Bridgeport Next Year
Make Lake Street or Bridgeport a K-1 building - (303 students)
• Would require 14 general education classrooms• Concerns with time on a bus for elementary students and increased transportation
costs
Make Bolivar a 2-4 building - (443 students)
• Would require 21 general education classrooms• Concerns with time on a bus for elementary students and increased transportation
costs
Make the middle school a 5-8 building - (626 students)
Keep the high school as a 9-12 building - (673 students)
• Consider this overall option very disruptive
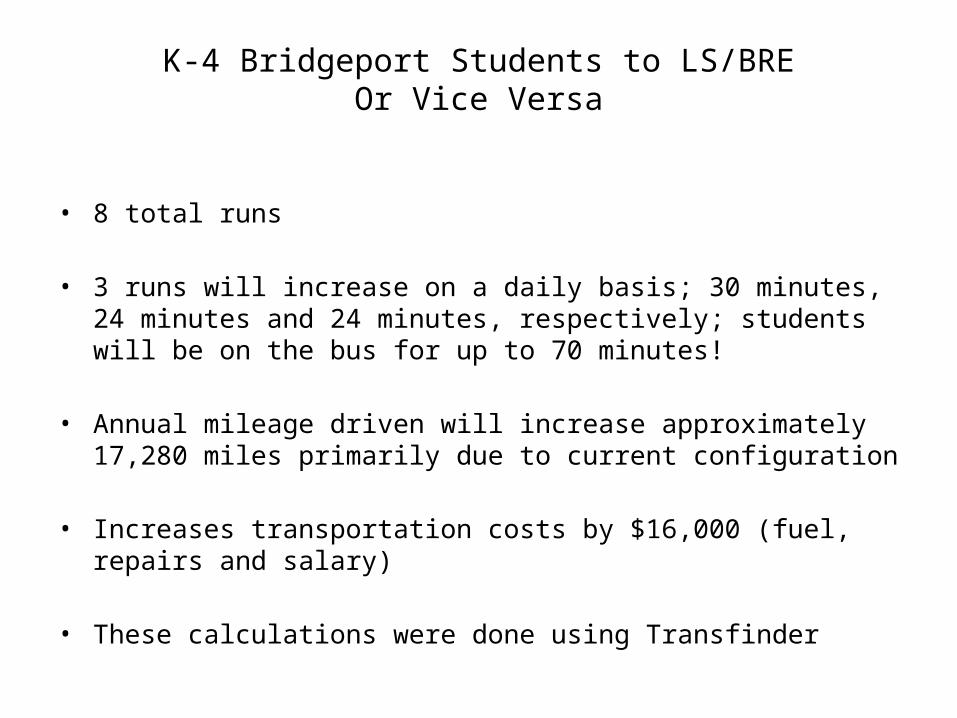
K-4 Bridgeport Students to LS/BREOr Vice Versa
• 8 total runs
• 3 runs will increase on a daily basis; 30 minutes, 24 minutes and 24 minutes, respectively; students will be on the bus for up to 70 minutes!
• Annual mileage driven will increase approximately 17,280 miles primarily due to current configuration
• Increases transportation costs by $16,000 (fuel, repairs and salary)
• These calculations were done using Transfinder

Closing a Building Next YearLake Street
• Make Bolivar Road a K-3 building - (430 students)
• Make Bridgeport a K-3 building - (140 students)• Very low numbers for this building
• Make the middle school a 4-7 building - (600 students)• Concerned about the mix of grade levels; socially and academically• Bussing concerns with the start times
• Make the high school an 8-12 building - (847 students)• Same concerns as previously stated• Re-district north of the railroad tracks, move 50 students to Bridgeport• Not the best educational setting or option; Very Disruptive

Close Lake Street in 2015-2016
Make Bolivar Road a K-4 Building - (500 Students)• 5 grade levels at 5 sections each• Bolivar Road has 21 general education classrooms• Would require a 4 classroom addition • This addition would fit into the Capital Building Project• Re-district students to Bridgeport, move 40-50 students –
Rezoning Option 1 (Decreases Bolivar enrollment to 450 – 460 students)
Make Bridgeport a K-4 building - (180 students)• Re-district students to Bridgeport, move 40-50 students –
Rezoning Option 1 (Increases Bridgeport enrollment to 220 – 230 students)
Make the Middle School a 5-8 building - (600 students)• Add an assistant principal to the middle school
The High School stays a 9-12 building - (633 students)

Estimated Annual Savings
Lake Street Elementary School
$505,942
*Reflects a reduction of a 0.5 FTE in administrative staffing based upon district needs.
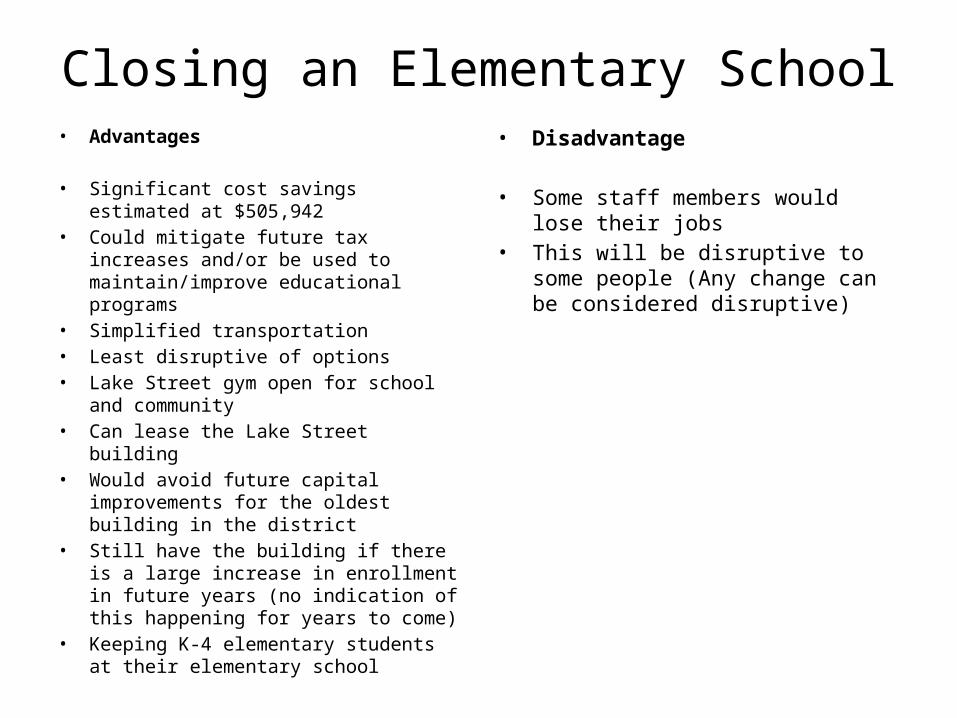
Closing an Elementary School• Advantages
• Significant cost savings estimated at $505,942
• Could mitigate future tax increases and/or be used to maintain/improve educational programs
• Simplified transportation• Least disruptive of options• Lake Street gym open for school and
community• Can lease the Lake Street building• Would avoid future capital improvements
for the oldest building in the district• Still have the building if there is a large
increase in enrollment in future years (no indication of this happening for years to come)
• Keeping K-4 elementary students at their elementary school
• Disadvantage
• Some staff members would lose their jobs• This will be disruptive to some people
(Any change can be considered disruptive)

Questions?


