Page 1
Material and Methods
Institute of Pharmaceutical Technology, SPMVV, Tirupati 62
Plant Material
The leaves of Argyreia nervosa, Jasminum sambac, Passiflora foetida and Sapindus
emarginatus were collected from the foot hills of Tirumala, Tirupathi, Andhra Pradesh. All
the plants were authenticated by Dr. Madhava Chetty, Professor, Dept of Botany, S.V.
University, Tirupati. Voucher specimens were preserved in the Institute of Pharmaceutical
Technology, Sri Padmavati Mahila Visvavidyalayam, Tirupati.
Table 2: Plants Selected for the study
S. No Plant Family Parts used
1 Argyreia nervosa Convolvulaceae Leaves
2 Jasminum sambac Oleaceae Leaves
3 Passiflora foetida Passifloracea Leaves
4 Sapindus emarginatus Sapindaceae. Leaves
Chemicals
All the chemicals used were of analytical grade and were procured from Merck or
Sigma or S.D. Fine Chemicals.
Preparation of hydroalcoholic extracts
The leaf powder was defatted by petroleum ether, the marc was dried and subjected to
extraction using 70% alcohol by Soxhlet exhaustive extraction process (Carter, 1987) and
percentage yield of extracts is given in Table 3.
Page 2
Material and Methods
Institute of Pharmaceutical Technology, SPMVV, Tirupati 63
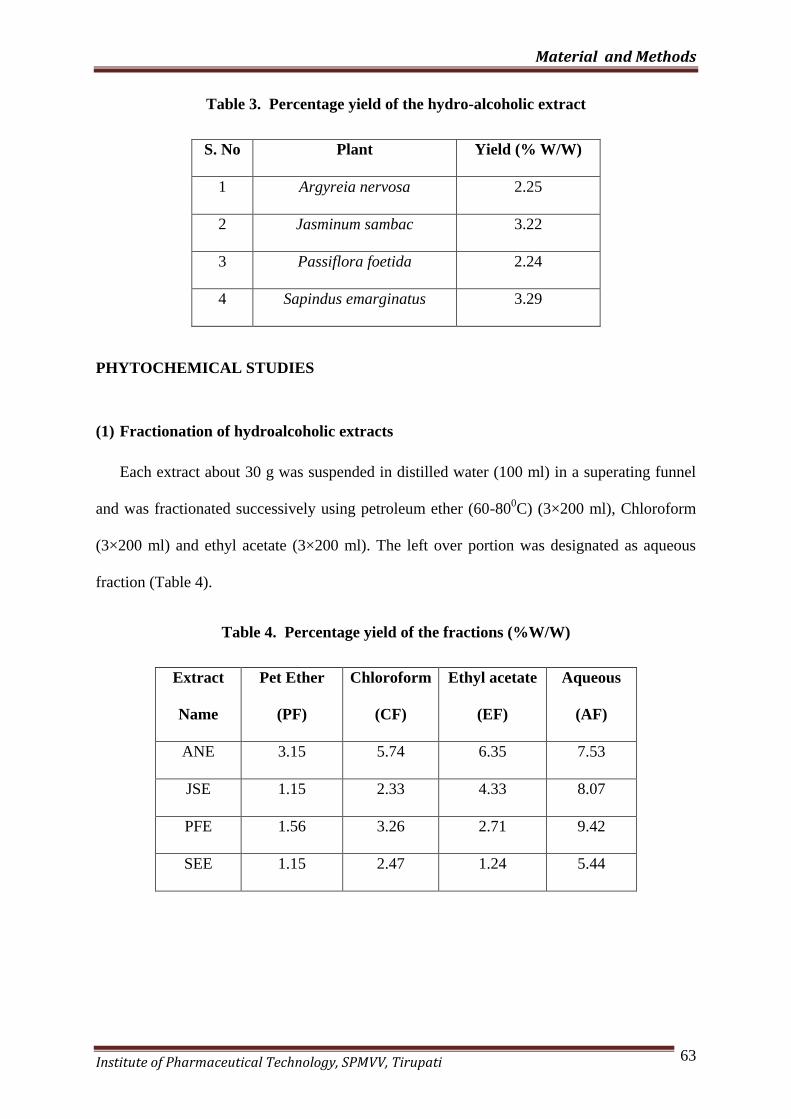
Table 3. Percentage yield of the hydro-alcoholic extract
S. No Plant Yield (% W/W)
1 Argyreia nervosa 2.25
2 Jasminum sambac 3.22
3 Passiflora foetida 2.24
4 Sapindus emarginatus 3.29
PHYTOCHEMICAL STUDIES
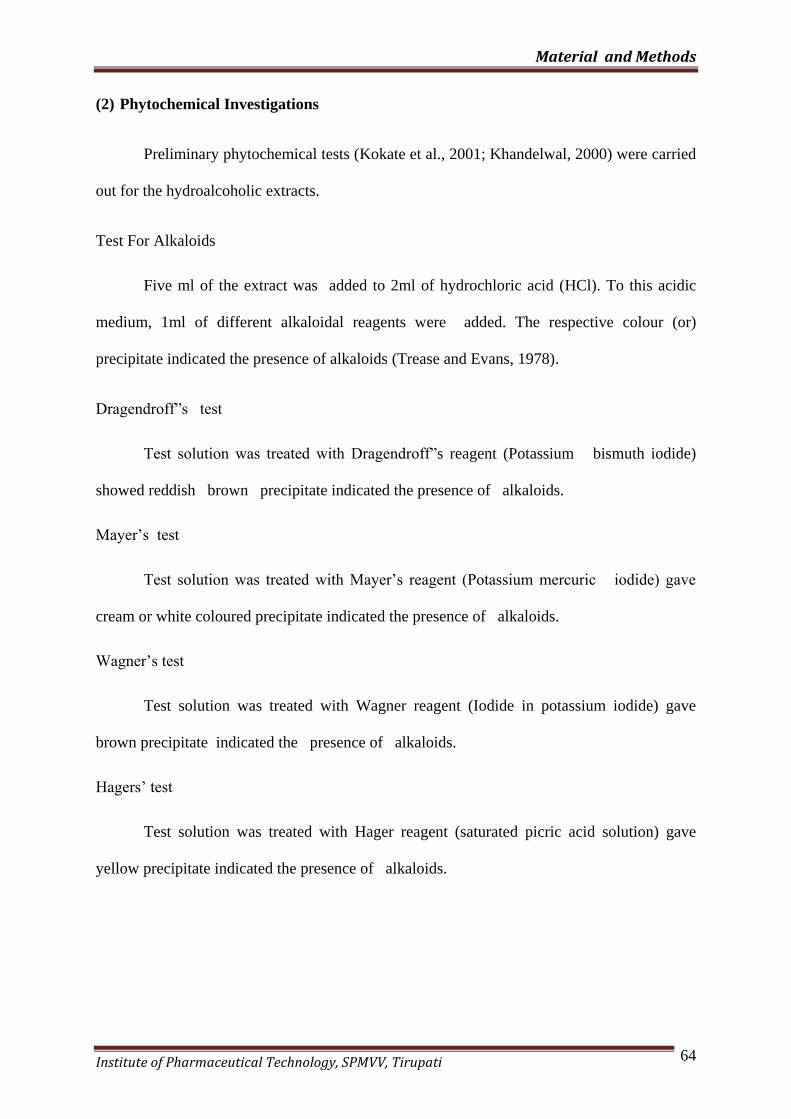
(1) Fractionation of hydroalcoholic extracts
Each extract about 30 g was suspended in distilled water (100 ml) in a superating funnel
and was fractionated successively using petroleum ether (60-800C) (3×200 ml), Chloroform
(3×200 ml) and ethyl acetate (3×200 ml). The left over portion was designated as aqueous
fraction (Table 4).
Table 4. Percentage yield of the fractions (%W/W)
Extract
Name
Pet Ether
(PF)
Chloroform
(CF)
Ethyl acetate
(EF)
Aqueous
(AF)
ANE 3.15 5.74 6.35 7.53
JSE 1.15 2.33 4.33 8.07
PFE 1.56 3.26 2.71 9.42
SEE 1.15 2.47 1.24 5.44
Page 3
Material and Methods
Institute of Pharmaceutical Technology, SPMVV, Tirupati 64
(2) Phytochemical Investigations
Preliminary phytochemical tests (Kokate et al., 2001; Khandelwal, 2000) were carried
out for the hydroalcoholic extracts.
Test For Alkaloids
Five ml of the extract was added to 2ml of hydrochloric acid (HCl). To this acidic
medium, 1ml of different alkaloidal reagents were added. The respective colour (or)
precipitate indicated the presence of alkaloids (Trease and Evans, 1978).
Dragendroff”s test
Test solution was treated with Dragendroff”s reagent (Potassium bismuth iodide)
showed reddish brown precipitate indicated the presence of alkaloids.
Mayer’s test
Test solution was treated with Mayer’s reagent (Potassium mercuric iodide) gave
cream or white coloured precipitate indicated the presence of alkaloids.
Wagner’s test
Test solution was treated with Wagner reagent (Iodide in potassium iodide) gave
brown precipitate indicated the presence of alkaloids.
Hagers’ test
Test solution was treated with Hager reagent (saturated picric acid solution) gave
yellow precipitate indicated the presence of alkaloids.
Page 4
Material and Methods
Institute of Pharmaceutical Technology, SPMVV, Tirupati 65
Test for Tannins
Gelatin test
Test solution was treated with 1% solution of gelatin containing 10% sodium
chloride gave white precipitate indicated the presence of tannins (Trease and Evans 1978).
Test for catechin
Test solution was treated with Conc. Hydrochloric acid warmed near a flame red
coloration development indicated the presence of tannins.
Test for chlorogenic acid
The aqueous solution was exposed to air developed green colour indicated the
presence of tannins.
Test for Cardiac Glycosides
Keller Killani test for Desoxy sugar
Test solution was treated with few drops of ferric chloride solution and mixed with
sulphuric acid containing Ferric chloride solution forms two layers, lower layer reddish
brown, upper layer bluish green indicated the presence of desoxy sugar (Trease and Evans,
2002; Kar, 2003).
Baljet test
Test solution was treated with sodium picrate, yellow to orange color development
indicated the presence of glycosides.
Bromine Water test
Test solution was treated with bromine water, yellow precipitate indicated the
presence of glycosides.
Raymond test
Page 5
Material and Methods
Institute of Pharmaceutical Technology, SPMVV, Tirupati 66
Test solution was treated with dinitrobenzene in hot methanolic alkali, violet colour
indicated the presence of glycosides.
Legal test
Test solution was treated with pyridine and was made alkaline by adding sodium
nitroprusside solution pink colour indicated the presence of glycosides.
Test for Anthraquinone Glycosides
Borntrager test
The powder drug was boiled in 5 ml of 10% sulphuric acid for 5 minutes, filtered
while hot the filtrate was cooled and was shaken gently with equal volumes of benzene.
Benzene layer was separated and then treated with solution of ammonia (10%) allowed to
separate, ammonical layer acquired pink colour indicated the presence of anthraquinones.
Modified Borntrager’s test
C-glycosides of anthraquinone require more drastic conditions for hydrolysis.
Hydrolysis of the drug was carried out with 5 ml of dilute hydrochloric acid and 5 ml of
5% solution of ferrichloride, hydrochloric extract was used for to perform the Borntrager’s
test.
Test for Cyanogenetic Glycosides
Grignard’s test
The test solution was taken in flask stoppered with strips of sodium picrate. Care
was exercised not to touch the inner side of the test tube with paper strips. The content was
warmed for half an hr. The strip of paper turned to red colour indicated the presence of
cyanogenetic glycosides.
Ferriferrocynaide test
Page 6
Material and Methods
Institute of Pharmaceutical Technology, SPMVV, Tirupati 67
Test solution was treated with 5 ml alcoholic potassium hydroxide solution and was
allowed to stand for 5 minutes, then transferred to an aqueous solution containing ferrous
sulphate and ferric chloride and was warmed over a water bath for 10 minutes. The
appearance of Prussian blue colour indicated the presence of hydrogen cyanide.
Precipitation of mercury from mercury nitrate
Test solution was treated with mercury nitrate solution, reduction of mercury by
hydrogen cyanide indicated the presence of hydrogen cyanide.
Cuprocynaide test
Test solution was made to contact with the paper saturated with guaic resin in
absolute alcohol and was moistened with copper sulphate solution turned to distinct stain
indicated the presence of hydrogen cyanide.
Test for Coumarin Glycosides
With ammonia
Test solution was placed over a paper impregnated with ammonia developed
fluorescence indicated the presence of coumarins (Kokate, 1999).
With alkali solution
Test solution was extracted with alcohol and made alkaline showed blue or green
fluorescence indicated the presence of coumarins.
Page 7
Material and Methods
Institute of Pharmaceutical Technology, SPMVV, Tirupati 68
Test For Iridoidal Glycosides
Trim –Hill test
The test solution was treated with 5 ml of 1% aqueous HCl for 3-6 hours. About 0.1
ml was decanted into another test tube containing Trim Hill reagent (10 ml of acetic acid,
1ml of 0.2 % Copper sulphate, and 0.5 ml Conc. Hydrochloric acid) and it was heated over a
flame, production of blue colour indicated the presence of iridoids (Harbourne, 2007).
Test For Flavonoids
Shinoda test
1 g of the powder was extracted with 10 ml of ethanol (95%) for 15 minutes on a
boiling water bath and filtered. To the filtrate a small piece of magnesium ribbon and 3 drops
of hydrochloric acid was added, formation of red colour indicated the presence of flavonoids.
Fluorescence test
1 g of powder was extracted with 15 ml methanol for 2 min on a boiling water bath
and was filtered while hot and evaporated to dryness. To the residue 0.3 ml boric acid
solution (3%v/v) and 1 ml oxalic acid solution (10%w/v) were added. The mixture was
evaporated to dryness and the residue was dissolved in 10 ml of ether. The ethereal layer
showing greenish fluorescence under Ultra Violet light indicated the presence of flavonoids.
Page 8
Material and Methods
Institute of Pharmaceutical Technology, SPMVV, Tirupati 69
Test For Saponins
Froth test
0.1 g powder was shaken vigorously with 5 ml of water in a test tube for 30 minutes
and was left undisturbed for 20 minutes. Persistent froth indicated the presence of
saponins.
Test for Steroidal saponins
The extract was hydrolysed with dilute sulphuric acid and extracted with chloroform.
The chloroform layer was tested for sterols.
Test for Triterpenoidal saponins
The extract was hydrolysed with dilute sulphuric acid and extracted with chloroform.
The chloroform layer was tested for triterpenoids.
Test For Sterols
Libbermann - Burchadt test
1 g powder was moistened with 1 ml of acetic anhydride on a clean tile and 2 drops of
sulphuric acid was added. The powder was mixed well and the colour gained was observed.
The formation of green blue colour indicated the presence of sterols.
Salkowski reaction
2 ml of extract was treated with chloroform and 2 ml of conc. Sulphuric acid and was
shaken well with chloroform, red precipitate indicated the presence of sterols.
Page 9
Material and Methods
Institute of Pharmaceutical Technology, SPMVV, Tirupati 70
Test For Carbohydrates
Reduction of Fehling’s solution
Test solution was taken in test tube and heated, an equal volume of Fehiling’s solution
A and B were added and heated over a water bath, formation of brick red precipitate
indicated the presence of reducing sugar.
Molisch test
Test solution was treated with alpha napthol and Conc. Sulphuric acid formation of
purple precipitate formation at the junction of two liquids indicated the presence of sugars.
Test for pentose
Test solution was heated in a test tube with an equal volume of hydrochloric acid
containing little phlororglucinol, red color production indicated the presence of pentose
sugars.
Test for ketoses
Test solution was warmed with equal volume of hydrochloric acid and a crystal of
resorcinol over a water bath, formation of rose colour indicated the presence of ketose sugar.
Test For Phenolic Compounds
To the extract few drops 5% alcoholic. Ferrric chloride solution was added. Bluish
black (or) dark green colour formation indicated the presence of tannins and phenolic
compounds.
Page 10
Material and Methods
Institute of Pharmaceutical Technology, SPMVV, Tirupati 71
Test for Proteins and Amino Acids
Million’s Test
To the various plant extracts the Million’s reagent was added and heated on water
bath, red colour formation indicated presence of proteins.
Biuret Test
To few ml of extract, equal volume of 10% sodium hydroxide and 0.5% copper
suplphate solution was added drop by drop and heated. Purple blue colour indicated presence
of proteins
Ninhydrin Test
To 5 ml of test extract 0.5ml of 0.1% Ninhydrin was added and heated for 1-2 min,
appearance of purple colour showed the presence of amino acids.
Test For Lignin
The extract was treated with alcoholic solution of phloroglucinol and allowed to dry
and Conc. Hydrochloric acid was added, pink colour formation indicated the presence of
lignin.
Test for Fixed Oils and Volatile Oils
A small quantity of extract was pressed separately between two filter papers. Oil
stains on the paper indicated the presence of fixed oil, evaporation of oil at room temperature
indicated the presence of volatile oil.
Page 11
Material and Methods
Institute of Pharmaceutical Technology, SPMVV, Tirupati 72
Detection of DNA
The fresh plant material reacts with non- ionic detergent and forms complex with
total cellular nucleic acid (form a wide array of plant genera and tissue types) was
precipitated by adding 0.6 volumes of isopropanol. The precipitate was eluted by
electrophoresis and viewed under Ultra Violet light (366 nm) fluorescence indicated the
presence of DNA (Dellaporte et al., 1983).
(3) Thin Layer Chromatography (TLC)
TLC was used for the detection of phytochemicals in extracts and for monitoring the
progress of column chromatography and for testing the homogeneity of the isolates (Stahl,
1969; Wagner et al., 1984).
Preparation of Chromatographic plates
The chromatographic plates of size 15 × 8 × 0.4 cm were cleaned thoroughly and
dried in hot air oven at 1050C. A uniform suspension of silica gel G was prepared by
dispersing one part of adsorbent in 2.5 parts of distilled water using a glass mortar and a
pestle. The suspension was applied to plates as films, care was taken to eliminate air bubbles
in the slurry. The plates were allowed to dry at room temperature and then activated at 105oC
for one hour in a hot air oven. The plates were taken out and cooled to room temperature
before use. The following solvent systems were used as mobile phases.
Chloroform : methanol 80 : 20 solvent system (lipids)
Chloroform : glacial acetic acid : methanol : water 64 : 32: 12 : 8 (for saponins)
Ethyl acetate : ethanol : water 100 : 13.5 : 10 (for analysis of polar compounds
(glycosides), alkaloids, anthroquinone glycosides, bitters, flavonoids and saponins).
Page 12
Material and Methods
Institute of Pharmaceutical Technology, SPMVV, Tirupati 73
Ethyl acetate : formic acid : glacial acetic acid: water 100 : 11: 11 : 26 (for
flavonoids)
Ethyl acetate : ethanol : water 7 : 2: 1 (Deoxy sugars)
Detection of compounds
The extracts and isolated compounds were observed under Ultra Violet light and
exposed to ammonia vapors / Iodine vapors.
Spray Reagents
5% alcoholic neutral ferric chloride solution (phenols)
10% ethanolic sulfuric acid (sugars)
Detection of steroids / triterpenoids, flavonoids and their glycosides were carried
out by using Vanillin – sulfuric acid reagent.
Solution I: 5 % ethanolic solution of sulfuric acid
Solution II : 1% ethanolic solution of vanillin
The plate was sprayed vigorously with solution I so as to wet it, followed by solution
II and then heated for 5-10 minutes at 1100C under observation. Steroids / triterpenoids and
their glycosides give blue, blue-violet or pink spots. The yellow colour of the flavonoids and
their glycosides gets intensified.
Page 13
Material and Methods
Institute of Pharmaceutical Technology, SPMVV, Tirupati 74
(4) HPTLC
The hydroalcoholic extract of AN, JS, PF and SE was subjected to HPTLC studies
with the following specifications and its Rf values, percentage and area were determined
Instrument used : HPTLC (Shimadzu)
Stationary phase : HPTLC precoated silica plate (Merck, Mumbai).
Mobile phase : n-butanol : acetic acid : water [4:1:1]
Software : Wincats: 1.4.3
Preparation of sample: extract was dissolved in alcohol
Sample application : Linomat 5.
Migration distance : 7 cm
Detection: @254nm, @366nm in Densiometry TLC Scanner III,.
Spraying agent: vanillin –sulphuric acid and was heated at 105◦ for 5 minutes.
(5) Standardization of extracts
Determination of the total phenols
The total phenolic content of the extracts were determined with the Folin-Ciocalteau
assay. An aliquot (1 ml) of extracts or a standard solution of gallic acid (20, 40, 60, 80 and
100 mg/l) was added to a 25 ml volumetric flask, containing 9 ml of distilled deionised water
(H2O). A reagent blank using double distilled H2O was also prepared. One milliliter of the
Folin-Ciocalteu’s phenol reagent was added to the mixture and shaken. After 5 min, 10 ml of
7% Na2CO3 solution was added to the mixture. The solution was diluted to 25 ml with H2O
and mixed. After incubation for 90 min at room temperature, the absorbance against the
prepared reagent blank was determined at 750 nm with an UV-VIS Spectrophotometer. The
Page 14
Material and Methods
Institute of Pharmaceutical Technology, SPMVV, Tirupati 75
data for the total phenolic content was expressed as milligrams of gallic acid equivalents
(GAE) per 100 grams dry mass (mg GAE/100g). All samples were analysed in triplicate
(Marinova et al., 2005).
Determination of the total flavonoids
The total flavonoid content was measured with an aluminum chloride colorimetric
assay. An aliquot (1 ml) of extracts or a standard solution of (+)-Quercetin (20, 40, 60, 80 and
100 mg/l) was added to a 10 ml volumetric flask, containing 4 ml of distilled deionized water
(H2O). To the flask was added 0.3 ml 5 % sodium nitrate. After 5 min, 0.3 ml of 10 %
Aluminum Chloride was added. At the sixth minute, 2 ml of 1 M NaOH was added and the
total volume was made up to 10 ml with H2O. The solution was mixed well and the
absorbance was measured against a prepared reagent blank at 510 nm with an UV-VIS
Spectrophotometer. The data of the total flavonoid content was expressed as milligrams of
(+) Quercetin equivalents (QE) per 100 g dry mass (mg QE/100 g dw). All samples were
analyzed in triplicates (Marinova et al., 2005).
Determination of total tannins
The total tannin content in the two extracts was determined by modified method of
Polshelttiwar et al., (2007). The sample (0.1 ml) was mixed with 0.5 ml of Folin-Denis
reagent followed by 1 ml of sodium carbonate (0.5% w/v) solution and distilled water (up to
5 ml). The absorbance was measured at 755 nm within 30 min of the reaction against the
blank. The total tannin in the extract was expressed as the equivalents of tannic acid (g
TAE/g extract).
(6) Isolation of phytochemicals
Column chromatography
Page 15
Material and Methods
Institute of Pharmaceutical Technology, SPMVV, Tirupati 76
The hydroalcoholic extract of AN, JS, PF and SE were subjected to column
chromatography using silica gel 60-120 or 100-200 mesh as adsorbent (Column
chromatography grade, SD Fine Chemicals) by gradient dilution. The extract was packed
over the surface of the silica gel and the solvents were made to run according to increasing
order of polarity (Remington, 2005).
Column chromatography of hydroalcoholic extract of AN
Preliminary qualitative chemical investigations and TLC studies on hydroalcoholic
extract of AN revealed the presence of alkaloids / tannins / phenolic compounds / flavonoids /
sterols / sugars / lignin / deoxy ribonucleic acid. Therefore the hydroalcoholic extract of AN
was subjected to column chromatography using silica gel 60-120 mesh as adsorbent by
gradient dilution to isolate the phytoconstituents.
The bottom of the column (45 cm length, 12 cm diameter) was packed with adsorbent
cotton, above which silica gel (60 g) was filled as a slurry in ethyl acetate. Care was taken to
prevent entrapment of air bubbles into the column. About 3 g of the hydro alcoholic extract
of AN was dissolved in 25 ml of alcohol, dispersed uniformly in 20 g of silica gel and loaded
over the filled column. The top portion of the column was covered with a piece of Whattman
No.1 filter paper, above which mobile phase level was maintained. The column was prepared
in ethyl acetate and left overnight. Next morning, the column contents were eluted with
gradient elution starting with pet ether : toluene followed by chloroform, ethyl acetate,
methanol and water (90:10, 70:30, 50:50, 30:70 and 10:90). Each time, 100 ml of elute was
collected. Elution of different components was monitored by TLC on silica gel-G to know
the nature of compounds in the fractions and homogeneity of the compounds.
Chloroform:Ethyl acetate (80:20) and ethyl acetate : Methanol (20:80) elutes produced a
single spot on TLC with silica gel – G. The fractions were combined and concentrated under
Page 16
Material and Methods
Institute of Pharmaceutical Technology, SPMVV, Tirupati 77
reduced pressure, yielded a white substance, which was recrystallized from acetone. It was
found to be homogenous by TLC studies and was designated as AN - 1 and AN - 2. The
isolated compound was subjected to physical, chemical and spectral studies.
Column chromatography of hydroalcoholic extract of JS
Preliminary qualitative chemical investigations and TLC studies on hydroalcoholic
extract of JS revealed the presence of tannins / phenolic compounds / flavonoids / sterols /
triterpenoids / sugars / coumarins / deoxy ribonucleic acid. Therefore the hydroalcoholic
extract of JS was subjected to column chromatography using silica gel 60-120 mesh as
adsorbent by gradient dilution to isolate the phytoconstituents.
The bottom of the column (45 cm length, 12 cm diameter) was packed with adsorbent
cotton, above which silica gel (60 g) was filled as a slurry in ethyl acetate. Care was taken to
prevent entrapment of air bubbles into the column. About 3 g of the hydro alcoholic extract
of JS was dissolved in 25 ml of alcohol, dispersed uniformly in 20 g of silica gel and loaded
over the filled column. The top portion of the column was covered with a piece of Whattman
No.1 filter paper, above which mobile phase level was maintained. The column was prepared
in ethyl acetate and left overnight. Next morning, the column contents were eluted with
gradient elution starting with pet ether:toluene followed by chloroform, ethyl acetate,
methanol and water (90:10, 70:30, 50:50, 30:70 and 10:90). Each time, 100 ml of elute was
collected. Elution of different components was monitored by TLC on silica gel-G to know
the nature of compounds in the fractions and homogeneity of the compounds. Chloroform
:Ethyl acetate (80:20) and ethyl acetate : Methanol (20:80) elutes produced a single spot on
TLC with silica gel–G respectively. The fractions were combined and concentrated under
reduced pressure, yielded a white substance, which was recrystallized from acetone. It was
found to be homogenous by TLC studies and was designated as JS - 1 and JS - 2. The isolated
Page 17
Material and Methods
Institute of Pharmaceutical Technology, SPMVV, Tirupati 78
compound was subjected to physical, chemical and spectral studies.
Column chromatography of hydroalcoholic extract of PF
Preliminary qualitative chemical investigations and TLC studies on hydroalcoholic
extract of PF revealed the presence of alkaloids / tannins / phenolic compounds / glycosides /
flavonoids / sterols / sugars / lignins / deoxy ribonucleic acid. Therefore the hydroalcoholic
extract of PF was subjected to column chromatography using silica gel 60-120 mesh as
adsorbent by gradient dilution to isolate the phytoconstituents.
The bottom of the column (45 cm length, 12 cm diameter) was packed with adsorbent
cotton, above which silica gel (60 g) was filled as a slurry in ethyl acetate. Care was taken to
prevent entrapment of air bubbles into the column. About 3 g of the hydro alcoholic extract
of PF was dissolved in 25 ml of alcohol, dispersed uniformly in 20 g of silica gel and loaded
over the filled column. The top portion of the column was covered with a piece of Whattman
No.1 filter paper, above which mobile phase level was maintained. The column was prepared
in ethyl acetate and left overnight. Next morning, the column contents were eluted with
gradient elution starting with pet ether:toluene followed by chloroform, ethyl acetate,
methanol and water (90:10, 70:30, 50:50, 30:70 and 10:90). Each time, 100 ml of elute was
collected. Elution of different components was monitored by TLC on silica gel-G to know
the nature of compounds in the fractions and homogeneity of the compounds. Chloroform
(100) and ethyl acetate : Methanol (20:80) elutes produced a single spot on TLC with silica
gel – G respectively. The fractions were combined and concentrated under reduced pressure,
yielded a white substance, which was recrystallized from acetone. It was found to be
homogenous by TLC studies and was designated as PF - 1 and PF - 2. The isolated compound
was subjected to physical, chemical and spectral studies.
Column chromatography of hydroalcoholic extract of SE
Page 18
Material and Methods
Institute of Pharmaceutical Technology, SPMVV, Tirupati 79
Preliminary qualitative chemical investigations and TLC studies on hydroalcoholic
extract of SE revealed the presence of tannins / phenolic compounds glycosides / sterols /
triterpenoids / saponins / sugars / lignins / deoxy ribonucleic acid. Therefore the
hydroalcoholic extract of SE was subjected to column chromatography using silica gel 60-
120 mesh as adsorbent by gradient dilution to isolate the phytoconstituents.
The bottom of the column (45 cm length, 12 cm diameter) was packed with adsorbent
cotton, above which silica gel (60 g) was filled as a slurry in ethyl acetate. Care was taken to
prevent entrapment of air bubbles into the column. About 3 g of the hydro alcoholic extract
of SE was dissolved in 25 ml of alcohol, dispersed uniformly in 20 g of silica gel and loaded
over the filled column. The top portion of the column was covered with a piece of Whattman
No.1 filter paper, above which mobile phase level was maintained. The column was prepared
in ethyl acetate and left overnight. Next morning, the column contents were eluted with
gradient elution starting with pet ether : toluene followed by chloroform, ethyl acetate,
methanol and water (90:10, 70:30, 50:50, 30:70 and 10:90). Each time, 100 ml of elute was
collected. Elution of different components was monitored by TLC on silica gel-G to know
the nature of compounds in the fractions and homogeneity of the compounds. Toluene :
Chloroform (20:80) and ethyl acetate : Methanol (50:50) elutes produced a single spot on
TLC with silica gel – G respectively. The fractions were combined and concentrated under
reduced pressure, yielded a white substance, which was recrystallized from acetone. It was
found to be homogenous by TLC studies and was designated as SE - 1 and SE - 2. The
isolated compound was subjected to physical, chemical and spectral studies.
(7) Spectroscopy
UV-Spectra
The UV spectra and absorption maxima (λmax) for the isolated compounds were
Page 19
Material and Methods
Institute of Pharmaceutical Technology, SPMVV, Tirupati 80
recorded using Systronics UV-Visible Spectrophotometer.
IR Spectra
IR spectra for the pure isolates were recorded in KBr pellet using Perkin Elmer
Spectrum one FT-IR Spectrophotometer.
1H NMR-Spectra
1H NMR Spectra were recorded using
1H NMR AV 400 MHz high resolution
multinuclear FT-NMR Spectrometer (Bruker).
13C NMR-Spectra
13C NMR Spectra were recorded using
13C NMR AVIII 500 MHz high resolution
multinuclear FT-NMR Spectrometer (Bruker).
Page 20
Material and Methods
Institute of Pharmaceutical Technology, SPMVV, Tirupati 81
Mass Spectra
Mass spectra were recorded using HP 1100 MSD series Spectrometer for Electro
Spray Ionization Mass Spectra (ESIMS).
IR, 1H NMR,
13C NMR, Mass spectra were recorded at Indian Institute of
Technology, Chennai.
PHARMACOLOGICAL STUDIES
(1) In-vitro antioxidant studies
DPPH radical scavenging assay
DPPH scavenging activity was measured with spectrophotometer method (Sreejayan
and Rao, 1996). To the extract solution of concentration ranging from 40 microgram to 200
microgram 4 ml of DPPH was added and was made upto 5ml with ethanol, incubated for 30
minutes at room temperature. The absorbance was measured at 517nm against blank. The
percentage of inhibition of DPPH was calculated as follows. Ascorbic acid was used as
standard and the scavenging effect of DPPH was expressed in terms of ascorbic acid
equivalents and its results are presented in Table 15.
A control – A sample
% inhibition = x 100
A control
Scavenging activity of hydrogen peroxide
The scavenging effect of hydrogen peroxide was determined as per Ruch, 1989.
1 ml of extract solution was treated with 0.6 ml of hyrogen peroxide for 10 minutes, the
absorbance was read at 230 nm against blank. Ascorbic acid was used as standard and the
scavenging effect of hydrogen peroxide was expressed in terms of ascorbic acid equivalents
Page 21
Material and Methods
Institute of Pharmaceutical Technology, SPMVV, Tirupati 82
and its results are presented in Table 16.
A control – A sample
% inhibition = x 100
A control
Scavenging activity of nitric oxide
Nitric oxide was generated from sodium nitroprusside and its scavenging effect was
determined as per Green et al., 1982; Morocci et al., 1994. Different concentration of extract
solution in phosphate buffer was incubated with sodium nitroprusside for 5 hours at 25 °C.
Control experiments were performed with equal amount of buffer instead of extract solution.
After 5 hours of incubation, 0.5ml of supernatant liquid was removed and 0.5ml of Griess
reagent was added. The absorbance of the chromphpore formed during diazotization with
sulphanilamide and its subsequent coupling was read at 546nm. Ascorbic acid was used as
standard and the nitric oxide scavenging was expressed in terms of ascorbic acid equivalents
and its results are presented in Table 17.
Total antioxidant capacity
The total antioxidant capacity was determined by Spectrophotometric method of
Prieto et al., 1999. Extract test solution of concentration ranging from 40 to 200 µg was
taken in eppendroff tube and 1ml of reagent containing 0.6mM sulphuric acid, 28mM sodium
phosphate and 4 mM ammominum molybadate were added. The tubes were incubated at
95°C for 90 minutes and were cooled to room temperature, the absorbance was read at 695
nm. Ascorbic acid was used as standard and the total antioxidant capacity was expressed in
terms of ascorbic acid equivalents and its results are presented in Table 18.
Assay of Reducing Power
The reducing power assay was determined by Spectrophotometric method of
Page 22
Material and Methods
Institute of Pharmaceutical Technology, SPMVV, Tirupati 83
Oyazizu, 1986. The extract solution of various concentrations ranging from 40 to 200
microgram was treated with 2.5 mL of 0.2 M phosphate buffer (pH 6.6) , 2.5 ml of 1 %
potassium ferricyanide incubated at 50°C for 20 minutes cooled to which 2.5 ml of trichloro
acetic acid (TCA) was added and centrifuged at 3000 rpm for 10 minutes. The upper layer
of the solution was removed and 2.5 ml of methanol and 0.5 ml of (0.1% ferric chloride)
solutions were added, the absorbance of the resulting solution was read at 700 nm. Ascorbic
acid was used as standard and the reducing power was expressed in terms of ascorbic acid
equivalents and its results are presented in Table 19.
(2) In-Vivo antidepressant studies
Animals
Adult healthy Swiss Albino mice of either sex (20-30g) were used. The animals were
acclimatized for the laboratory conditions for a period of ten days i.e. room temperature
(27±3oC), relative humidity (65±10%), and 12h light/dark cycle. All animals were fed with
rodent-pellet diet and water was allowed ad libitum under strict hygienic conditions.
Acute toxicity study
The acute toxicity study was conducted as per the OECD guidelines 423 (OECD,
2001) where the limit test dose of 2000 mg/kg was used (Lipnick et al., 1995; Kulkarni,
1993). Observations were made and recorded systemically 1, 2, 4 and 24 h after dose
administration for skin changes, morbidity, aggressiveness, sensitivity of the sound and pain,
as well as respiratory movement.
Experimental protocol for antidepressant activity
Mice were randomly divided into 10 groups with six animals in each group. Group I
received only vehicle (1% tween 80 solution p.o, daily) and served as control; group II
received standard antidepressant drug- Imipramine (25mg/kg p.o, daily); group III and group
Page 23
Material and Methods
Institute of Pharmaceutical Technology, SPMVV, Tirupati 84
IV received AN 250mg/kg and 500mg/kg (p.o, daily) in 1% tween 80 respectively, group V
and VI received JS 250 and 500mg/kg in 1% tween 80 respectively, p.o, daily, group VII and
VIII received PF 250 and 500mg/kg in 1% tween 80 respectively, p.o. daily, group IX and X
received SE 250 and 500mg/kg in 1% tween 80 respectively, p.o, daily. At the end of
experimental period (7 days of treatment) the animals were fasted overnight and sacrificed by
cervical dislocation. The brains were excised immediately and the brain tissue was
homogenized and used for further analysis.
Behavioral parameters
Test for locomotor activity
The locomotor activity was measured using Actophotometer. It consists of cage which
has 30 X 30 X 30 cm, and at the bottom six lights and photocells were placed in the outer
periphery of the bottom in such a way that a single mouse blocks only one beam. Photocell is
activated when the rays of light falls in photocells, the beam of light is interrupted as and
when animal crosses the light beam, the number of interruptions were recorded for a period
of 5 minutes (Goyal, 2005).
Page 24
Material and Methods
Institute of Pharmaceutical Technology, SPMVV, Tirupati 85
Tail suspension test
The total duration of immobility by tail suspension was measured according to the
method of Steru et al., 1985. mice both acoustically and visually isolated and suspended
50cm above the floor by adhesive tape placed approximately 1cm from the tip of the tail,
immobility time was recorded during a 15minutes test for animals of all groups .
Forced swim test
FST is the most widely used pharmacological in vivo model for assessment of
antidepressant activity. In this model, mice were forced to swim in condition from which they
cannot escape and rapidly become immobile, floating in an upright position and making only
small movements to keep their heads above water. The development of immobility reflects
the cessation of persistent escape directed behavior or learned helplessness, and a decrease in
the duration of immobility, is interpreted as an antidepressant like effect. Mice were placed
individually in a glass cylinders (height: 21 cm, diameter: 14.5 cm) containing 15 cm of
water at 23 ± 10C. First 2 min were allowed for acclimatization and the duration of climbing,
swimming and immobility during 4 min were recorded (Porsolt et al., 1977a).
Biochemical estimations
Neurotransmitter estimations
It has been described that the antidepressant effects of drugs in the FST are related to
changes in monoaminergic neurotransmitters (Miura et al., 1999). To address some of the
mechanisms involved in antidepressant activity of selected extracts the neurotransmitter
estimations were done.
Mice were sacrificed after the treatment period (7 days) by decapitation and brains
were rapidly removed. The brains were placed in 800µl of ice-cold 0.1M perchloric acid.
Individual brain samples were homogenized and centrifuged at 20000 x g at 40C and stored in
Page 25
Material and Methods
Institute of Pharmaceutical Technology, SPMVV, Tirupati 86
a dark freezer at -700C until further analysis. The pellets were dissolved in 10mM NaOH
solution for protein determination using the Bradford protein assay (Bradford, 1976).
The samples were filtered through a 0.45-µm filter and 10 µl was injected in an HPLC
system. The HPLC eluent system consisted of aqueous component of citrate buffer and
acetonitrile (95:5, v/v) as organic phase, with an aqueous component of 12.16 mM citric acid,
11.60 mM (NH4)2HPO4, 2.34 mM sodium octylsulfonate, 3.32 mM DBAP and 1.1 mM
disodium EDTA. The pH of the eluent was adjusted to 3.71 with NaOH 2N after acetonitrile
addition and filtered through a 0.45-µm filter; the eluent was used at a flow rate of 1ml/min
(pressure was approximately 13.1 MPa) (Alburges et al., 1993).
Conditions for HPLC
The Wakosil C-18 (stainless steel column of 250mm x 4.6mm internal diameter, was
packed with porous silicon spheres of 5µm diameter, 100Ao
pore diameter- II5C-18rs-100a,
5µm, 4.6 x 250mm) was used at 27±0.20C. The chromatographic system consists of Jasco PU
- 2085 plus pump, Jasco AS – 2057 auto sampler, and a mellinium 32 software system. The
detection system consisted of Antec Leyden model II electrochemical detector with an
Antelec Leyden model sensel ISAAC flow- cell assembly (range 1nA, filter 0.005Hz, Eox=
0.60V, basal±0.001V, Ic =2.72nA).
Page 26
Material and Methods
Institute of Pharmaceutical Technology, SPMVV, Tirupati 87
Estimation of Monoamine oxidase A and B
Brain tissue was homogenized in ten volumes of cold sodium phosphate buffer
(200mM, pH-7.4) containing 320mM sucrose, at 4
oC for 30 seconds, using a Teflon glass
homogenizer. The homogenate was centrifuged at 600g for 10min at 4oC to remove nuclei
and debris. The mitochondrial fraction was obtained by further centrifugation at 1500g for
120min at 4oC and resuspended in buffer. The protein concentrate was determined the MAO
assay mixture contained 500µl of mitochondrial protein in the phosphate buffer. 300µl of
4mM serotonin and norepinephrine were added as substrate for MAO A and B. Mixtures
were incubated at 37oC for 20min, followed by the addition of HCl (600µl, 1M). Reaction
products were extracted into 4ml butyl acetate or cyclohexane respectively. The organic
phases were collected and absorbance was measured at 280nm for MAO A or 242nm for
MAO B respectively (Zheng and Liu, 2002; Zhou et al., 2006).
Antioxidant studies
Brain tissue samples were homogenized in 50 mM phosphate buffer (pH-7.0)
containing 0.1 mM of EDTA to give 5% w/v homogenate. The homogenates were
centrifuged at 10000 rpm for 10 min at 0oC in cold centrifuge; the resulting supernatant was
used for further studies.
Lipid peroxidation estimation
MDA level was measured according to the method of Ohkawa et al., 1979 at room
temperature. 200 µl of supernatant was added to 50 µl of 8.1% sodium dodecylsuphate,
vortexed and incubated for ten min at room temperature. 375 µl of thiobarbituric acid (0.6%)
was added and placed in a boiling water bath for 60 min and then the sample was allowed to
cool to room temperature. A mixture of 1.25ml of butanol:pyridine(1.5:1) was added,
vortexed and centrifuged at 1000rpm for 5min. the colored layer (500µl) was measured at
Page 27
Material and Methods
Institute of Pharmaceutical Technology, SPMVV, Tirupati 88
532nm on a (ELICO, 171) Spectrophotometer. The values were expressed in nmoles of MDA
formed for mg protein/hr/min (Ohkowa et al., 1979).
Reduced glutathione assay
Reduced glutathione was measured according to the method of Ellman, 1959 at room
temperature. 0.75 ml of supernatant was mixed with 0.75 ml of 4% sulfosalicylic acid then
centrifuged at 1200 rpm for 5min at 4 oC, from this 0.5 ml of supernatant was taken and
added to 4.5 ml of 0.01 M DTNB and absorbance was measured at 412 nm using a
(ELICO,171) UV-Visible Spectrophotometer (Ellman, 1959).
Determination of Vitamin C
The level of vitamin C was determined by the method of Oayama et al., 1994. To
0.5ml of brain homogenate, 0.5 ml of water and 1 ml of trichloroacetic acid were added,
mixed thoroughly and centrifuged. To 1 ml of supernatant 0.2 ml of DTC reagent was added
and incubated at 370C for 3 hrs. Then 1.5 ml of sulphuric acid was added mixed well and the
solutions were allowed to stand at room temperature for another 30 min. the color developed
was read at 520nm in a (ELICO,171) UV-Visible spectrophotometer. The values were
expressed as µg/mg protein (Oayama, 1994).
TOXICOLOGICAL STUDIES
Sub-acute toxicity studies
Rats were randomly divided into 9 groups with six animals in each group. The plant
extracts at the dose of 250 and 500 mg/kg body weight was administered orally to 9 groups
of five rats respectively at every 24 h for 28 days and control received vehicle at the same
volume. Group I received only vehicle (1% tween 80 solution p.o, daily) and served as
control; group II and group III received AN 250mg/kg and 500mg/kg (p.o, daily) in 1%
tween 80 respectively, group IV and V received JS 250 and 500mg/kg in 1% tween 80
Page 28
Material and Methods
Institute of Pharmaceutical Technology, SPMVV, Tirupati 89
respectively, p.o, daily, group VI and VII received PF 250 and 500mg/kg in 1% tween 80
respectively, p.o. daily, group VIII and IX received SE 250 and 500mg/kg in 1% tween 80
respectively, p.o, daily. The toxic manifestations such as body weight, mortality, food and
water intake was monitored. After 28 days all surviving animals were fasted overnight and
anaesthetized with ether. The heparinized blood samples were collected for determining
hematological indices like Haemoglobin (Hb), Red Blood Corpuscles (RBC), White Blood
Corpuscles (WBC), Packed Cell Volume (PCV); liver function parameters like (AST),
(ALP), (ALT); Kidney function parameters like urea, blood urea nitrogen (BUN), creatinine;
and the metabolic indices like low density lipoproteins (LDL), high density lipoproteins
(HDL), very low density lipoproteins (VLDL), triglycerides (TG) and Glucose.
Haematological parameters were determined by cell counter and biochemical functional tests
were performed using commercial kits. Animals were sacrificed after blood collection and
the internal organs were removed and weighed to determine the relative organ weights and
observed for gross lesions (Mounnissamy et al., 2010).
Statistical analysis
All data were expressed as mean ± SEM. Differences in mean values between groups
were analyzed by one – way analysis of variance (ANOVA) followed by Dunnett’s test in
order to detect inter-group differences. A value of p<0.05 was considered as statistically
significant.