96
PLASTICS RESIN AND SYNTHETIC RUBBER INDUSTRY REPORT Q1/2018
PLASTICS RESIN AND SYNTHETIC RUBBER INDUSTRY REPORT Q1/2018
TABLE OF CONTENTS
2
Abbreviations3 3. Plastic resins 63
Executive Summary4 4. Synthetic Rubber 70
I. Business environment 5 5. Price-affecting factors 74
1. Macroeconomic situation 5 IV. Industry risks 76
2. Legal framework 9 1. Industry risks 76
3. Trade agreements 13 2. SWOT analysis 79
II. Global market 15 V. Industry trend, forecast and planning 81
1. Definition and classification 15 1. Industry trend 81
2. Chain value of the industry 19 2. Global market forecast 83
4. Input material 22 3. Local market forecast 87
5. Plastic resins 38 4. Industry development planning 91
6. Synthetic Rubber 51 VI. Business analysis 94
III. Local market 58 1. Business Introduction 94
1. Industry scale 58 2. Financial analysis 97
2. Input material 60 VII. Appendix 107
Abbreviations
3
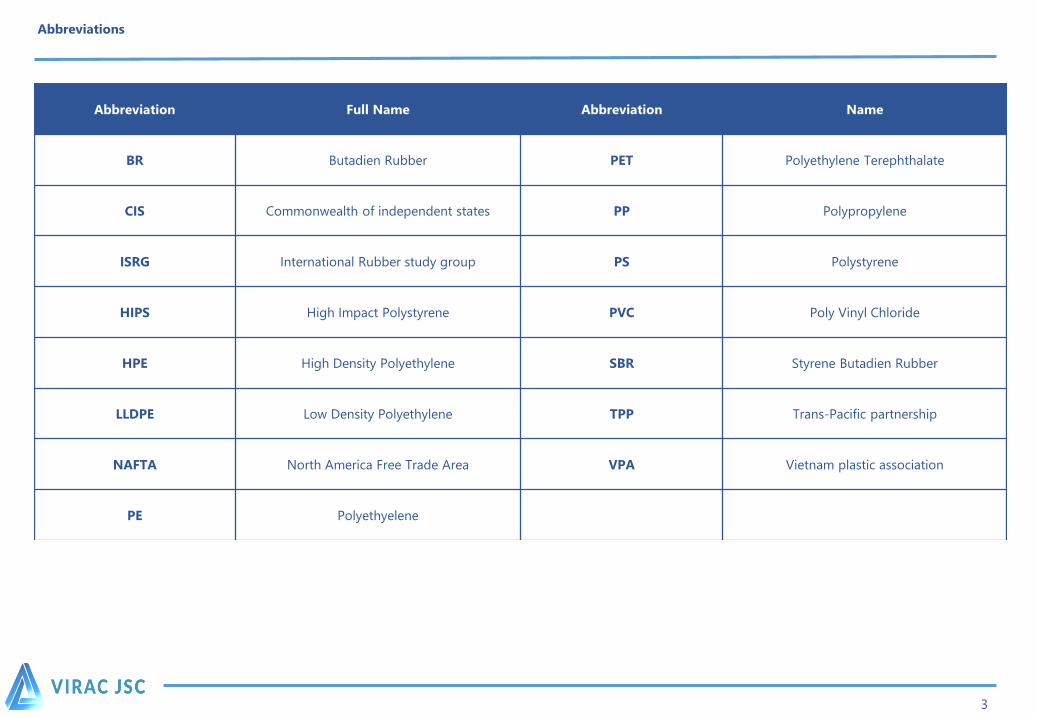
Abbreviation Full Name Abbreviation Name
BR Butadien Rubber PET Polyethylene Terephthalate
CIS Commonwealth of independent states PP Polypropylene
ISRG International Rubber study group PS Polystyrene
HIPS High Impact Polystyrene PVC Poly Vinyl Chloride
HPE High Density Polyethylene SBR Styrene Butadien Rubber
LLDPE Low Density Polyethylene TPP Trans-Pacific partnership
NAFTA North America Free Trade Area VPA Vietnam plastic association
PE Polyethyelene
Executive summary
4
• Primeval plastics and synthetic rubber are important input materials
for many industries, especially plastics and automobile industry.
• The development of the polymer industry relates to the petrochemical
industry and is affected by the price fluctuation, supply and demand
for the main raw materials like crude oil, gas.
• China takes the lead in thermoplastic production, with an output of
92.1 tons in 2016.
• In 2016, global sales of polymer-based products reached 851 billion
USD, up 6.2% compared to 2015.
• Global synthetic rubber production and consumption has been on the
upward trend in recent years, much greater than those of natural
rubber.
TÓM TẮT BÁO CÁO
5
• In Vietnam, the oil refinery sector has just newly-fledged, having only
Dung Quat oil refinery in operation.
• Plastic material and additive production in 9M/2017 were estimated at
915 thousand tons, up 32.8% over the same period in 2016 (689
thousand tons).
• In the first 9 months of 2017, the domestic consumption of plastic
materials reached 4,575 thousand tons, up 19.3% over the same period
in 2016.
• The demand for plastic resins has increased, resulting in a sharp
increase in plastic resin import volume between 2012 and 2016 with a
CAGR of 19%.
• Opec Plastics is a leading company among top importers of plastic raw
materials in 9M/ 2017.
• In recent years, Vietnam’s plastic industry has been highly appreciated
in terms of growth speed compared to ASEAN countries
TABLE OF CONTENTS
Part I. Business environment
1. Macroeconomic situation
2. Legal framework
3. Trade agreements
6
Part I. Business environment
1. Macroeconomic situation
Source: VIRAC, GDVC
Source: VIRAC, GSO
GDP growth rate by quarter, 2015 – 2017
Imports of plastic raw materials and percentage contribution to total turnover,
2010 – 2017
7
Content is intentionally removed for demo purpose
Part I. Business environment
1. Macroeconomic situation
Source: VIRAC, SBV
Source: VIRAC, SBV
USD/VND exchange rate, 2013 – 12/2017
CNY/VND exchange rate, 1/2016 – 12/2017
8
Content is intentionally removed for demo purpose
Part I. Business environment
1. Macroeconomic situation
FDI attraction by sector, 2017
Vietnamese plastic enterprise’s SCG ownership, 2016
9
Content is intentionally removed for demo purpose
TABLE OF CONTENTS
Part I. Business environment
1. Macroeconomic situation
2. Legal framework
3. Trade agreements
10
11
• The Prime Minister signed Decision No.45/2017/QD-TTg amending and supplementing Decision No. 36/2016/QD-TTg regulating the application of
ordinary tax tariff on imported goods.
Part I. Business environment
2. Legal framework
Part I. Business environment
2. Legal framework
12
Content is intentionally removed for demo purpose

Part I. Business environment
2. Legal framework
13
Content is intentionally removed for demo purpose
TABLE OF CONTENTS
Part I. Business environment
1. Macroeconomic situation
2. Legal framework
3. Trade agreements
14

15
• The plastic industry is opened to positive signals thanks to priorities brought about by free trade agreements.
• Joining free trade agreements has helped Vietnam to attract immensly FDI.
Part I. Business environment
3. Trade agreements
TABLE OF CONTENTS
Part II. Global market
1. Definition and classification
2. Chain value of the industry
3. Input materials
16
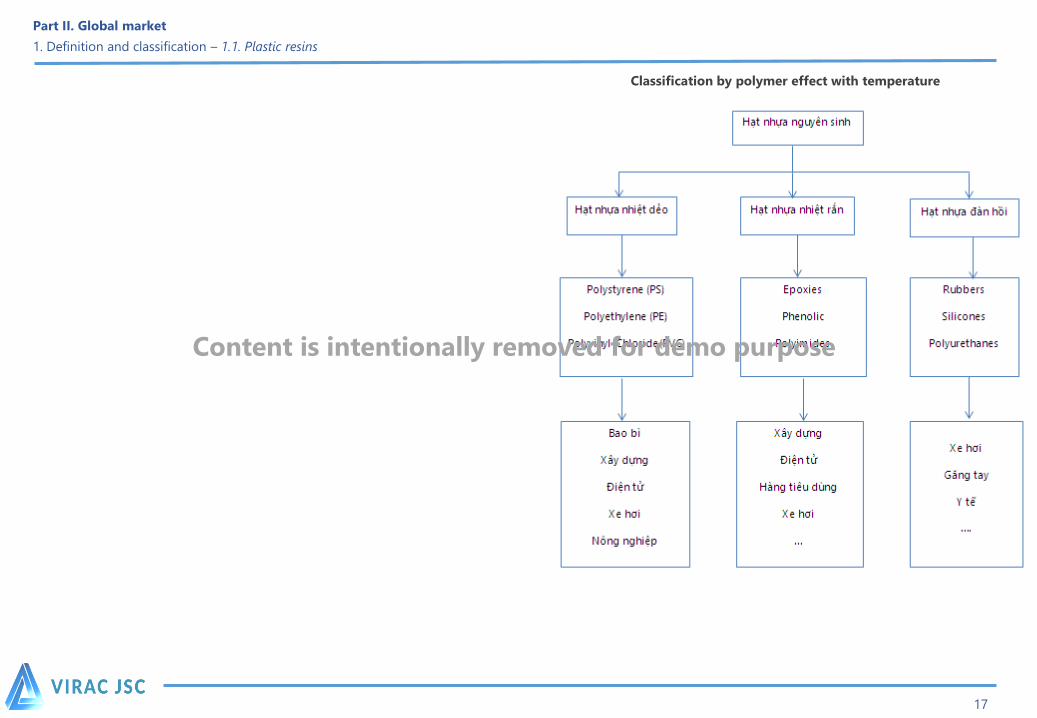
Part II. Global market
1. Definition and classification – 1.1. Plastic resins
Classification by polymer effect with temperature
17
Content is intentionally removed for demo purpose
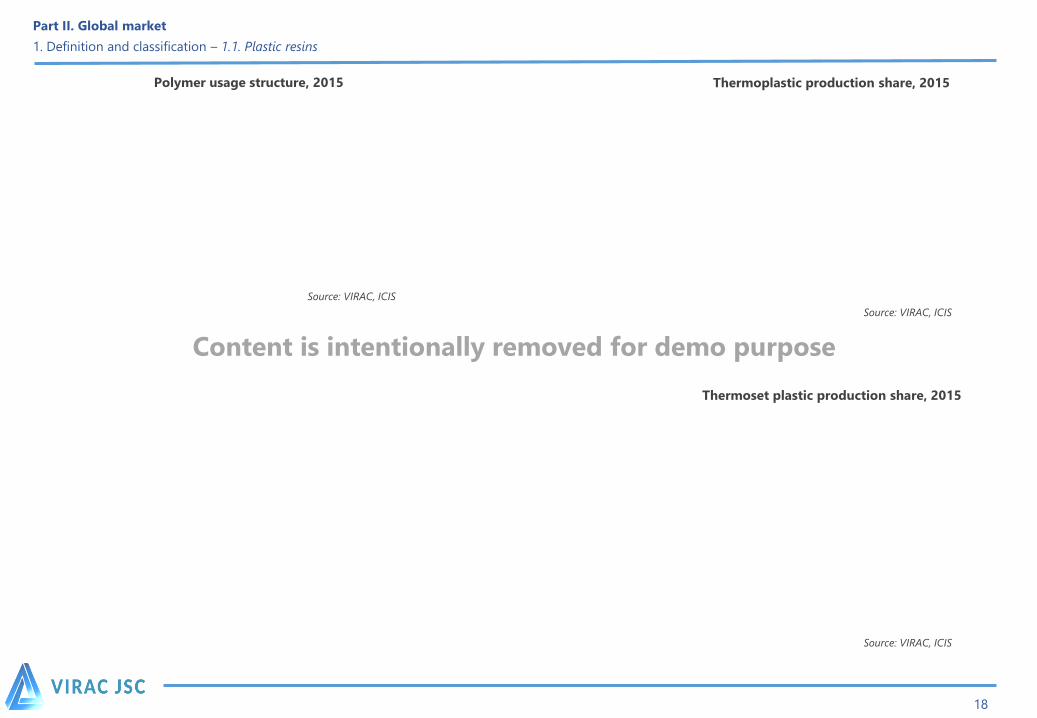
Thermoplastic production share, 2015
Thermoset plastic production share, 2015
Source: VIRAC, ICIS
Source: VIRAC, ICIS
Part II. Global market
1. Definition and classification – 1.1. Plastic resins
Polymer usage structure, 2015
Source: VIRAC, ICIS
18
Content is intentionally removed for demo purpose
Source: VIRAC, Rubbernews
Synthetic rubber production structure, 2015
Part II. Global market
1. Definition and classification – 1.2. Synthetic rubber
19
Content is intentionally removed for demo purpose
• Synthetic rubber is a compound made from chemical reactions which is mainly
comprised of oil and gas.
• Synthetic rubber is classified via multiple ways.
TABLE OF CONTENTS
Part II. Global market
1. Definition and classification
2. Chain value of the industry
3. Input materials
20

Part II. Global market
2. Chain value of the industry
21
Content is intentionally removed for demo purpose
Part II. Global market
2. Chain value of the industry
22
Content is intentionally removed for demo purpose
• Oil refinery plants:
• The oil refinery technology with various raw material combination alters chemical features to generate desirable products.
TABLE OF CONTENTS
Part II. Global market
1. Definition and classification
2. Chain value of the industry
3. Input materials
23
Part II. Global market
3. Input materials – 3.1. Overview
24
Content is intentionally removed for demo purpose
Part II. Global market
3. Input materials – 3.1. Overview
Source: VIRAC, IHS
Monomer input materials structure, 2016
25
Content is intentionally removed for demo purpose
Input materials for the plastic resin and synthetic rubber industry (generally known as polymer) are oil and gas products.
Part II. Global market
3. Input materials – 3.1. Overview
Source: VIRAC, ICIS
Source: VIRAC, ICIS
Products gained from Naphtha distillation, 2015
Products gained from Ethane distillation, 2015
26
Content is intentionally removed for demo purpose
Part II. Global market
3. Input materials – 3.2. Ethylene
Global ethylene supply and demand, 2010 -2016
Ethylene’s application, 2016
Source: VIRAC, IHS
Source: VIRAC, ICIS
27
Content is intentionally removed for demo purpose
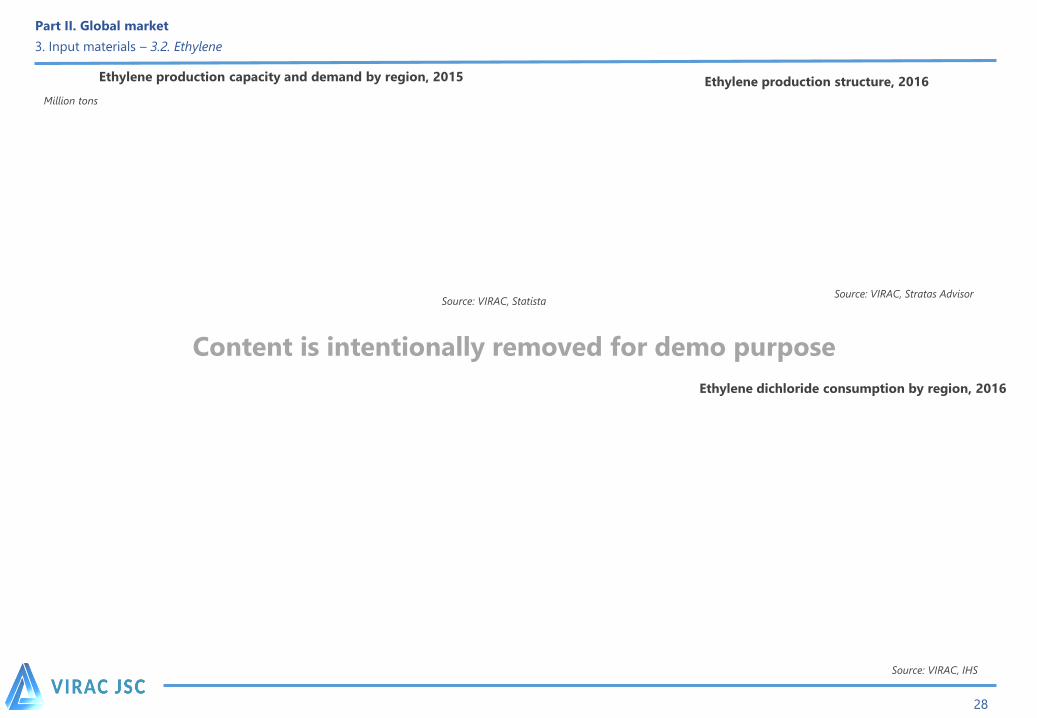
Part II. Global market
3. Input materials – 3.2. Ethylene
Source: VIRAC, Stratas Advisor
Ethylene production capacity and demand by region, 2015
Ethylene dichloride consumption by region, 2016
Source: VIRAC, IHS
28
Content is intentionally removed for demo purpose
Ethylene production structure, 2016
Source: VIRAC, Statista
Million tons
Source: VIRAC, Platts
Part II. Global market
3. Input materials – 3.2. Ethylene
Global ethylene prices, 11/2016 – 12/2017
29
Content is intentionally removed for demo purpose
Part II. Global market
3. Input materials – 3.2. Ethylene
Source: VIRAC, Uncomtrade
Source: VIRAC, UncomtradeSource: VIRAC, Uncomtrade
Global ethylene trade, 2011 - 2016
Global ethylene export structure, 2016 Ethylene import structure, 2016
30
Content is intentionally removed for demo purpose
Part II. Global market
3. Input materials – 3.3. Propylene
Source: VIRAC, ICIS
Source: VIRAC, ICIS
Global propylene export structure, 2010 – 2016
Propylene export structure by region, 2016
31
Content is intentionally removed for demo purpose
Part II. Global market
3. Input materials – 3.3. Propylene
Source: VIRAC, ICIS
Global Propylene export, 2011 – 2016e
Source:VIRAC, Platts
32
Content is intentionally removed for demo purpose
Global Propylene price, 11/2016 – 11/2017
Source: VIRAC, ICIS
Global butadiene capability and production, 2011 -2015
Butadiene production structure by country, 2015
Source: VIRAC, ICIS
Part II. Global market
3. Input materials – 3.4. Butadiene
33
Content is intentionally removed for demo purpose
Part II. Global market
3. Input materials – 3.4. Butadiene
Source: VIRAC, IHS
Source: VIRAC, American Chemical Society
Butadiene consumption structure by type 2017
SBR consumption by region, 2016
34
Content is intentionally removed for demo purpose
Part II. Global market
3. Input materials – 3.4. Butadiene
Fluctuations of butadiene prices, 1/2011 – 1/2017
Source: VIRAC, Bloomerg
35
Content is intentionally removed for demo purpose
Part II. Global market
3. Input materials – 3.4. Butadiene
Butadiene production capacity of some companies in the world
36
Content is intentionally removed for demo purpose
Part II. Global market
3. Input materials – 3.5. Benzene
Global benzene supply and demand, 2012 – 2017F
Source: VIRAC, IHS
37
Content is intentionally removed for demo purpose
Part II. Global market
3. Input materials – 3.5. Benzene
Source: VIRAC, Platts
Structure of benzene use in the world, 2015
Fluctuations of Benzene prices, 11/2016 – 11/2017
Source: VIRAC, Platts
38
Content is intentionally removed for demo purpose
TABLE OF CONTENTS
Part III. Vietnam's market
1. Industry scale
2. Input materials
3. Plastic resins
4. Synthetic rubber
5. Price-affected factors
39
Source: VIRAC
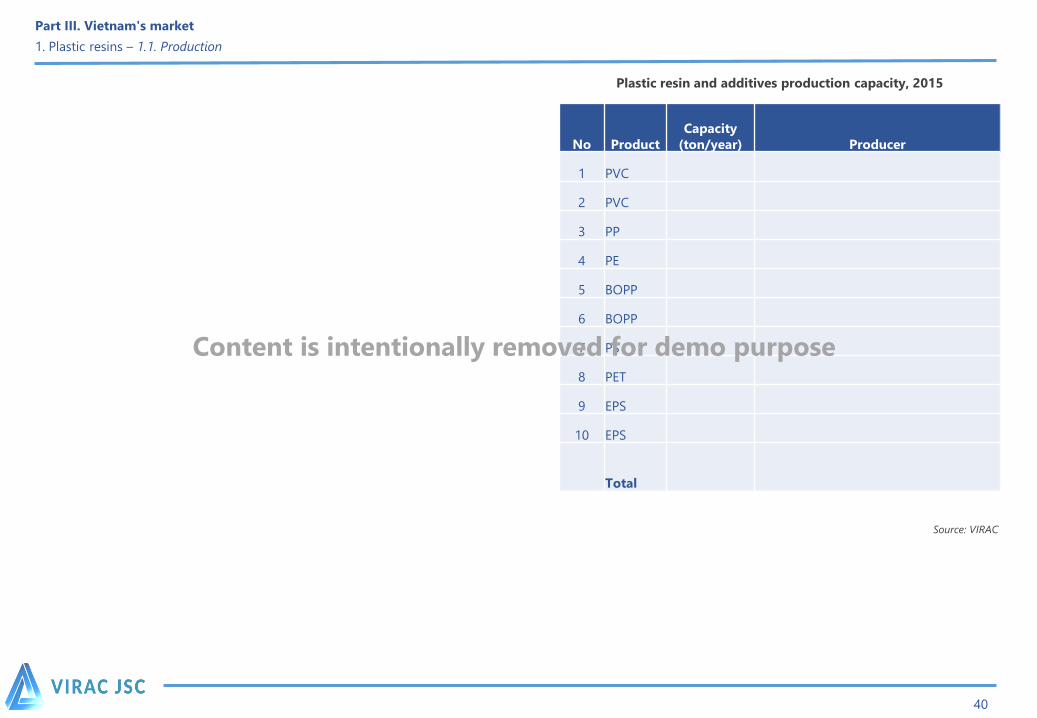
Part III. Vietnam's market
1. Plastic resins – 1.1. Production
40
No Product
Capacity
(ton/year) Producer
1 PVC
2 PVC
3 PP
4 PE
5 BOPP
6 BOPP
7 PS
8 PET
9 EPS
10 EPS
Total
Plastic resin and additives production capacity, 2015
Content is intentionally removed for demo purpose
TABLE OF CONTENTS
Part III. Vietnam's market
1. Industry scale
2. Input materials
3. Plastic resins
4. Synthetic rubber
5. Price-affected factors
41
Part III. Vietnam's market
2. Input materials
42
Content is intentionally removed for demo purpose
43
Part III. Vietnam's market
2. Input materials
Monomer imports, 2012 - 6T/2017e
Source: VIRAC, GDVC
Thousand USD
Aromatic compound imports, 2013 - 6T/2017e
Source: VIRAC, GDVC
Thousand USD
TABLE OF CONTENTS
Part III. Vietnam's market
1. Industry scale
2. Input materials
3. Plastic resins
4. Synthetic rubber
5. Price-affected factors
44
Source: VIRAC, MIT, GSO
Source: VIRAC, MIT, GSO
Part III. Vietnam's market
3. Plastic resins – 3.1 Production
Polymer Production, 2010 – 2017
45
Polypropylene supply and demand in Vietnam, 2010 – 2017
Content is intentionally removed for demo purpose
Source: VIRAC, TCTK
Part III. Vietnam's market
3. Plastic resins – 3.1 Production
46
Content is intentionally removed for demo purpose
LLDPE, LDPE, HDPE, PP distribution figures in the northern market,
2014-2015
Source: VIRAC, HCD White paper
PP production and consumption of Binh Son Oil Refinery, 2013 -
6T/2017
Source: VIRAC, HCD White paper
Plastic materials by region, 2017
Source: VIRAC, MIT, GSO
Source: VIRAC, MIT, GSO
Part III. Vietnam's market
3. Plastic resins – 3.2. Consumption
47
Polymer consumption in Vietnam, 2010 – 2017
Polymer consumption structure by sector in Vietnam, 2017
Content is intentionally removed for demo purpose
Source: VIRAC, GDVC
Source: VIRAC, GDVC
Part III. Vietnam's market
3. Plastic resins – 3.3 Import - Export
Plastic resins imports, 2010 – 2017
Plastic material importing market by output, 2017
48
Content is intentionally removed for demo purpose
Plastic material importing market by value, 2017
Source: VIRAC, GDVC
Source: VIRAC, GDVC
Part III. Vietnam's market
3. Plastic resins – 3.3 Import - Export
Source: VIRAC, GDVC
Polymer import structure by volume, 6T/2017e Proportion of top largest plastic material importers, 9T/2017
49
Content is intentionally removed for demo purpose
Plastic material import structure by type, 2017
Source: VIRAC, GDVC
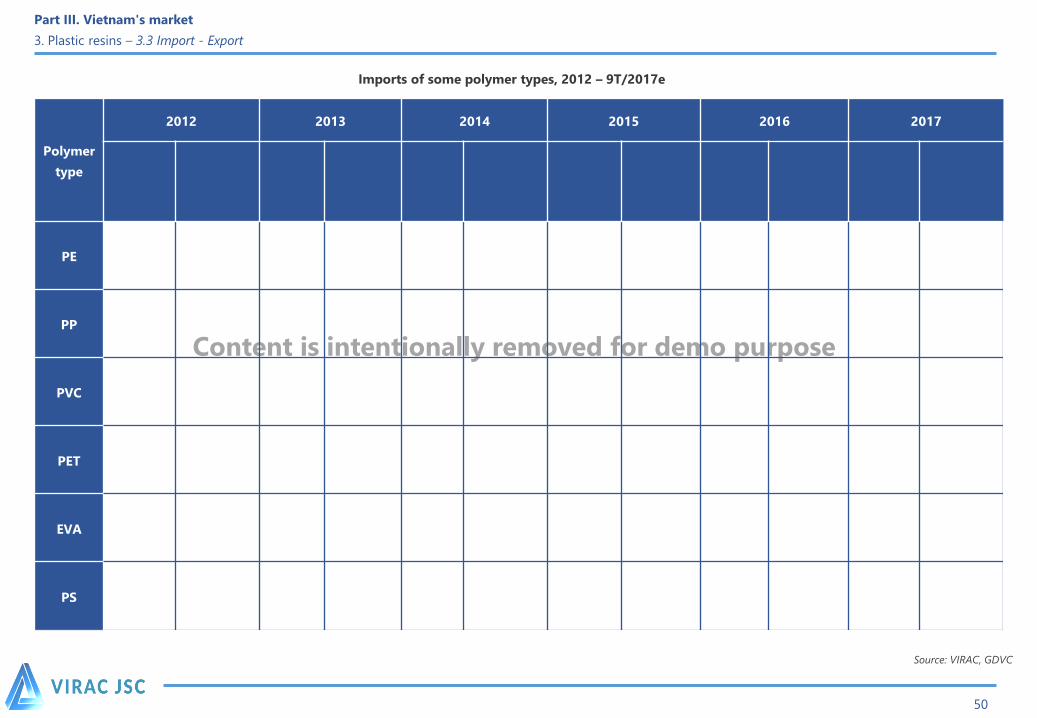
Part III. Vietnam's market
3. Plastic resins – 3.3 Import - Export
50
Content is intentionally removed for demo purpose
Source: VIRAC, GDVC
Polymer
type
2012 2013 2014 2015 2016 2017
PE
PP
PVC
PET
EVA
PS
Imports of some polymer types, 2012 – 9T/2017e
Source: VIRAC, GDVC
Part III. Vietnam's market
3. Plastic resins – 3.3 Import - Export
Source: VIRAC, GDVC
PP importing markets, 6T/2017e
51
Content is intentionally removed for demo purpose
Source: VIRAC, GDVC
PE import structure by type, 6T/2017ePE importing markets, 6T/2017e
Part III. Vietnam's market
3. Plastic resins – 3.3 Import - Export
Source: VIRAC, GDVC
52
Content is intentionally removed for demo purpose
Source: VIRAC, GDVC
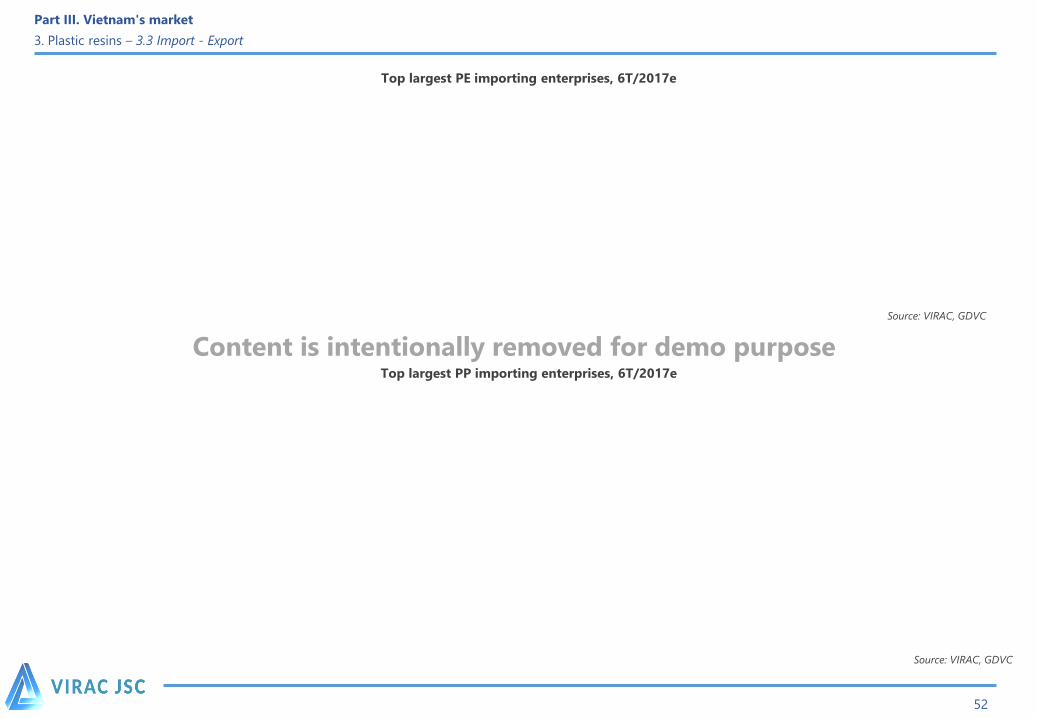
Top largest PE importing enterprises, 6T/2017e
Top largest PP importing enterprises, 6T/2017e
Source: VIRAC, GDVC
Part III. Vietnam's market
3. Plastic resins – 3.3 Import - Export
Source: VIRAC, GDVC
53
Content is intentionally removed for demo purpose
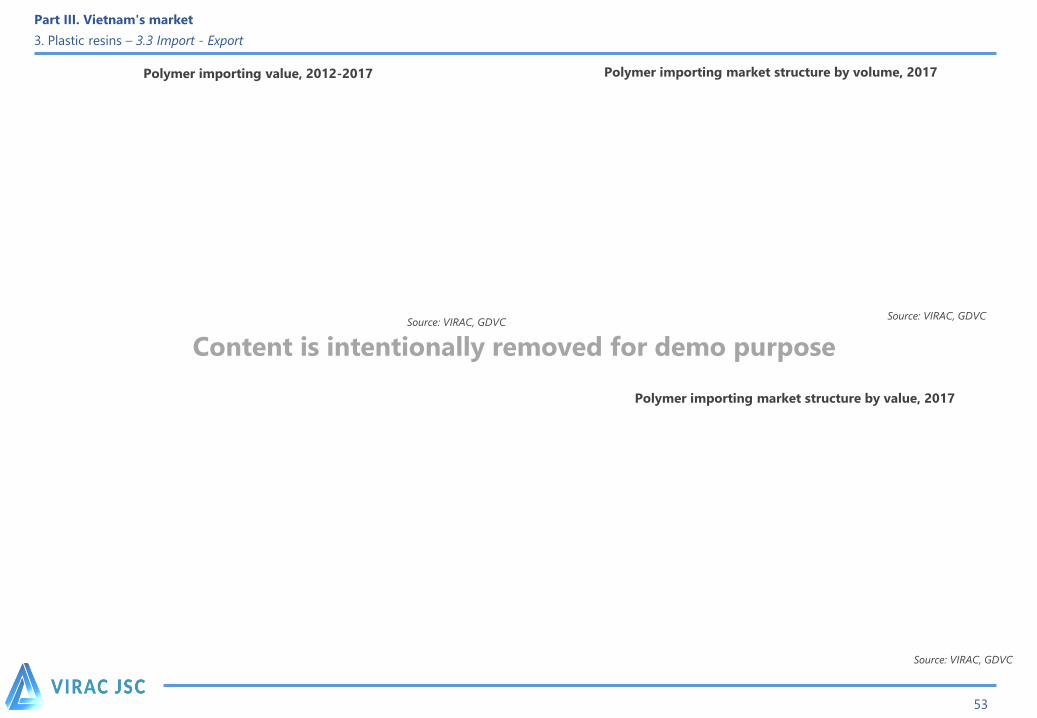
Source: VIRAC, GDVC
Polymer importing market structure by volume, 2017Polymer importing value, 2012-2017
Polymer importing market structure by value, 2017
Source: VIRAC, GDVC
Part III. Vietnam's market
3. Plastic resins – 3.3 Import - Export
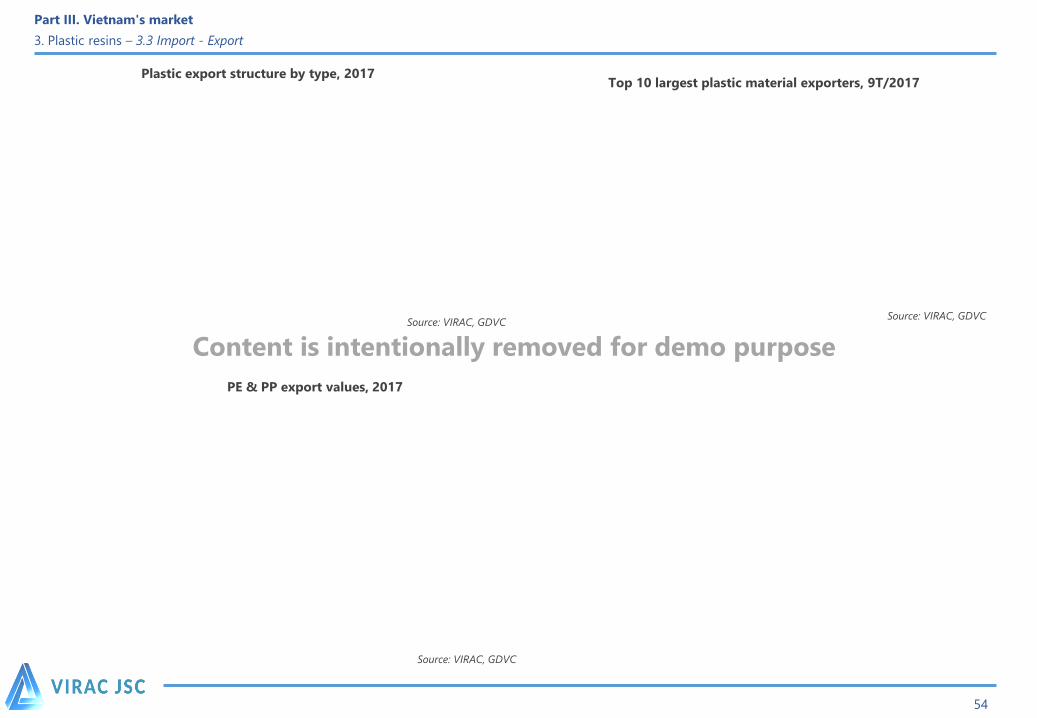
Source: VIRAC, GDVC
PE & PP export values, 2017
54
Content is intentionally removed for demo purpose
Source: VIRAC, GDVC
Top 10 largest plastic material exporters, 9T/2017Plastic export structure by type, 2017
Source: VIRAC, GDVC
Part III. Vietnam's market
3. Plastic resins – 3.3 Import - Export
Source: VIRAC, GDVC
55
Content is intentionally removed for demo purpose
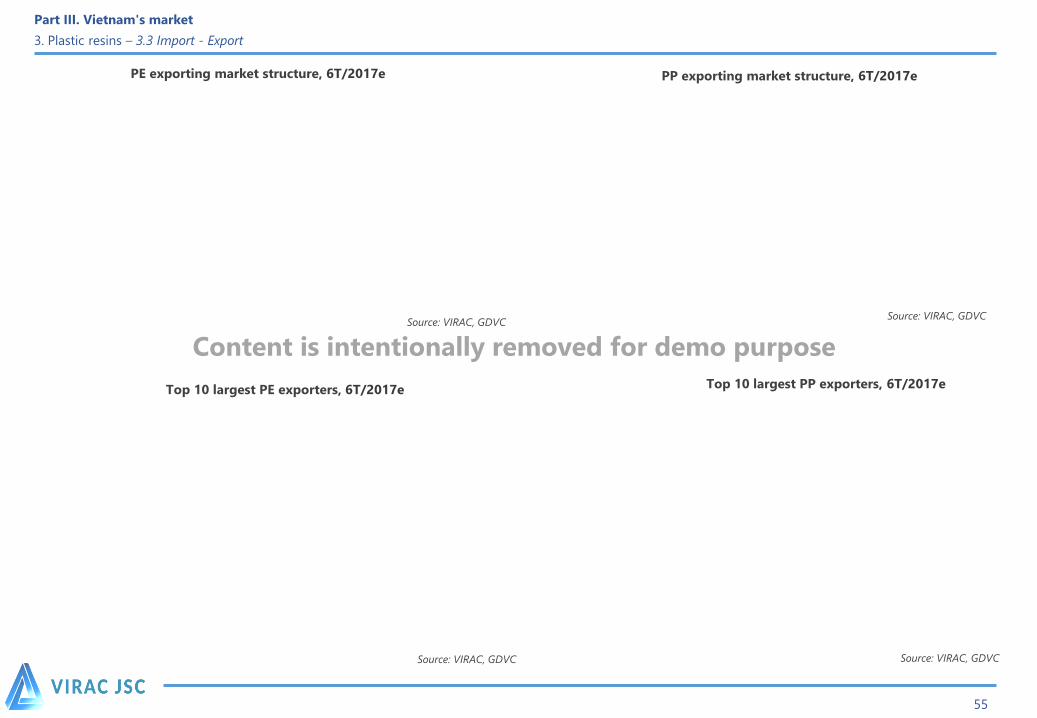
Source: VIRAC, GDVC
Top 10 largest PE exporters, 6T/2017e
PE exporting market structure, 6T/2017e PP exporting market structure, 6T/2017e
Top 10 largest PP exporters, 6T/2017e
Source: VIRAC, GDVC
Part III. Vietnam's market
3. Plastic resins – 3.4. Production technology
56
Content is intentionally removed for demo purpose
TABLE OF CONTENTS
Part III. Vietnam's market
1. Industry scale
2. Input materials
3. Plastic resins
4. Synthetic rubber
5. Price-affected factors
57
Source: VIRAC, UN Comtrade, GDVC
Part III. Vietnam's market
4. Synthetic rubber – 4.1 Import - Export
Synthetic rubber import and export, 2011 – 2017e
58
Content is intentionally removed for demo purpose
Part III. Vietnam's market
4. Synthetic rubber – 4.1 Import - Export
Source: VIRAC, GDVC
Export market structure of synthetic rubber, 2017e
Import market structure of synthetic rubber, 2017e
Source: VIRAC, GDVC
59
Content is intentionally removed for demo purpose
Part III. Vietnam's market
4. Synthetic rubber – 4.1 Import - Export
Source: VIRAC, GDVC
Top 10 largest synthetic rubber exporters, 9T/2017e
Top 10 largest synthetic rubber importers, 9T/2017e
Source: VIRAC, GDVC
60
Content is intentionally removed for demo purpose
TABLE OF CONTENTS
Part III. Vietnam's market
1. Industry scale
2. Input materials
3. Plastic resins
4. Synthetic rubber
5. Price-affected factors
61
World crude oil average price, 2014 -2017
Monomer price volatility, 2/2016 - 1/2017
Part III. Vietnam's market
5. Price-affected factors
Source: VIRAC, Bloomberg
Source: VIRAC, Bloomberg
62
Content is intentionally removed for demo purpose
TABLE OF CONTENTS
Part IV. Industry risks
1. Industry risks
2. SWOT analysis
63

Part IV. Industry risks
1. Industry risks
64
Content is intentionally removed for demo purpose
Part IV. Industry risks
1. Industry risks
65
Content is intentionally removed for demo purpose
TABLE OF CONTENTS
Part IV. Industry risks
1. Industry risks
2. SWOT analysis
66
Part IV. Industry risks
2. SWOT analysis
67
Strength Weaknesses
Opportunities Threats
Content is intentionally removed for demo purpose
TABLE OF CONTENTS
Part V. Industry trend, forecast and planning
1. Industry trend
2. Global market forecast
3. Vietnam's market forecast
4. Industry development planning
68
Source: VIRAC, European Bioplastic
Part V. Industry trend, forecast and planning
1. Industry trend
Bioplastic production capacity in the world,
2012 - 2018F
69
Content is intentionally removed for demo purpose
TABLE OF CONTENTS
Part V. Industry trend, forecast and planning
1. Industry trend
2. Global market forecast
3. Vietnam's market forecast
4. Industry development planning
70
Source: VIRAC, IHS
Part V. Industry trend, forecast and planning
2. Global market forecast
Global PP & PE demand growth, 2014 – 2019f
71
Content is intentionally removed for demo purpose
Part V. Industry trend, forecast and planning
2. Global market forecast
72
Content is intentionally removed for demo purpose
Source: VIRAC, Polymerupdate
Part V. Industry trend, forecast and planning
2. Global market forecast
73
Time Company Capacity Location
Synthetic rubber production projects in Asia, 2012 - 2016
Content is intentionally removed for demo purpose
TABLE OF CONTENTS
Part V. Industry trend, forecast and planning
1. Industry trend
2. Global market forecast
3. Vietnam's market forecast
4. Industry development planning
74
Source: VIRAC
Part V. Industry trend, forecast and planning
3. Vietnam's market forecast
75
Project Location Capital Capacity (million tons/year)
Some petrochemical refining projects in Vietnam, 2010 - 2020
Content is intentionally removed for demo purpose
Source: VIRAC, GDVC
Source: VIRAC, VPA
Part V. Industry trend, forecast and planning
3. Vietnam's market forecast
Plastics consumption per capita, 1989 – 2020F
Plastic export turnover, 2010 – 2017e
76
Content is intentionally removed for demo purpose
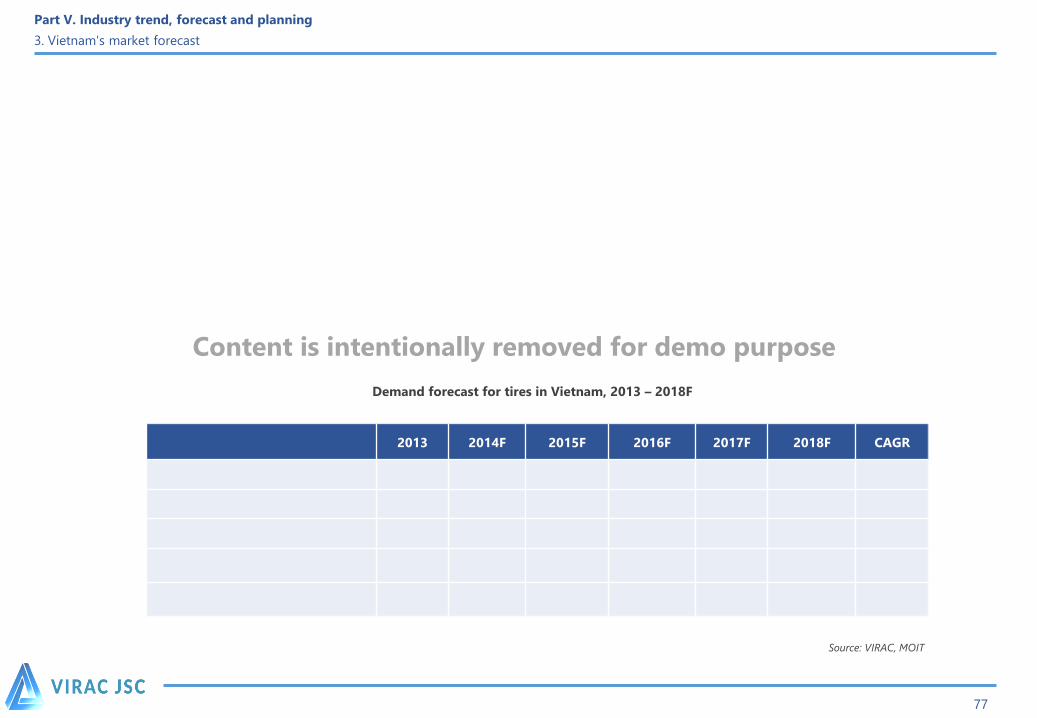
Source: VIRAC, MOIT
2013 2014F 2015F 2016F 2017F 2018F CAGR
Demand forecast for tires in Vietnam, 2013 – 2018F
Part V. Industry trend, forecast and planning
3. Vietnam's market forecast
77
Content is intentionally removed for demo purpose
Source: VIRAC,
PP and PVC production capacity forecast, 2016 – 2021f
Part V. Industry trend, forecast and planning
3. Vietnam's market forecast
78
Content is intentionally removed for demo purpose
Thousand tons/year
TABLE OF CONTENTS
Part V. Industry trend, forecast and planning
1. Industry trend
2. Global market forecast
3. Vietnam's market forecast
4. Industry development planning
79
Part V. Industry trend, forecast and planning
4. Industry development planning
80
Content is intentionally removed for demo purpose
Part V. Industry trend, forecast and planning
4. Industry development planning
Source: VIRAC, MOIT
81
No. Project name Location
Investment information
Capacity (1.000
tons/year)
Investment capital
(million USD)Time
Oil refinery projects, 2011 - 2020
Content is intentionally removed for demo purpose
TABLE OF CONTENTS
Part VI. Business analysis
1. Business introduction
2. Financial analysis
82
Company Logo
Total asset
(VND
billion)
Revenue
(VND billion)General information
Part VI. Business analysis
6.1 Business introduction
83
Content is intentionally removed for demo purpose
Part VI. Business analysis
6.1 Business introduction
Company Logo
Total asset
(VND
billion)
Revenue
(VND billion)General information
84
Content is intentionally removed for demo purpose
TABLE OF CONTENTS
Part VI. Business analysis
1. Business introduction
2. Financial analysis
85

Net revenue, 2015 - 2016
Part VI. Business analysis
6.2 Financial analysis – Business performance
86
Content is intentionally removed for demo purpose
Gross profit, 2015 - 2016
Part VI. Business analysis
6.2 Financial analysis – Business performance
87
Content is intentionally removed for demo purpose

Self-financing rate, 2015 - 2016
Part VI. Business analysis
6.2 Financial analysis – Business performance
88
Content is intentionally removed for demo purpose

Financial expenses, 2015 - 2016
Part VI. Business analysis
6.2 Financial analysis – Business performance
89
Content is intentionally removed for demo purpose

Total assets ratio, 2015 - 2016
Part VI. Business analysis
6.2 Financial analysis – Financial indicators
90
Content is intentionally removed for demo purpose
Fixed assets ratio, 2015 - 2016
Part VI. Business analysis
6.2 Financial analysis – Financial indicators
91
Content is intentionally removed for demo purpose
Total debt / equity, 2015 - 2016
Part VI. Business analysis
6.2 Financial analysis – Financial indicators
92
Content is intentionally removed for demo purpose
Profit ratio, 2015 - 2016
Part VI. Business analysis
6.2 Financial analysis – Financial indicators
93
Content is intentionally removed for demo purpose
Payment indicators of enterprises, 2015 - 2016
Part VI. Business analysis
6.2 Financial analysis – Payment indicators
94
Content is intentionally removed for demo purpose
Recommendation
Recommended usage
This report is made by Vietnam Industry Research and Consultancy (VIRAC), providing only the industry overview and business analyses. All information,
statements and projections are based on reliable sources with ultimate prudence as of the time of writing. However, due to subjective and objective reasons in
terms of published data sources, VIRAC does not guarantee or bear any responsibility for information accuracy and no liability for damages on using this report
partly or wholly. All viewpoints and statements in this report are subject to changes without notice. This publication is protected by copyright owned by Vietnam
Industry Research and Consultancy (VIRAC). Copying, modifying and printing without permission are strictly prohibited.
Please contact us for more details:
VIETNAM INDUSTRY RESEARCH AND CONSULTANCY
Floor 6, Anh Minh Building, 36 Hoang Cau Street, O Cho Dua Ward, Dong Da District, Hanoi
Website: http://virac.com.vn/
Email: [email protected] | Phone: +84 463289520
134

Thank you !


