42
SAE J2931 test plan: PLC Testing Results Tim Godfrey Arindam Maitra John Halliwell Daniel Foster John Harding Satish Rajagopalan 12-14-2011

SAE J2931 test plan:PLC Testing Results
Tim GodfreyArindam MaitraJohn HalliwellDaniel FosterJohn HardingSatish Rajagopalan12-14-2011

2© 2011 Electric Power Research Institute, Inc. All rights reserved.
Introduction
• SAE J2931 test plan (S316) was developed to test PLC communication technologies for the cordset– Test plan is based on requirements in J2931
• The objective is to test the communications technology, not a complete PEV or EVSE system implementation– Testing is done with a common reference point of the
IP layer. – IP layer testing allows the same tests to be run on
different communications technologies.– IPv6 is used because it is a requirement:
RD.UtilComm.5

3© 2011 Electric Power Research Institute, Inc. All rights reserved.
Overview of test plan
• Tests– Bandwidth and Latency tests– Crosstalk Tests– Coexistence Tests– Interference Tests– Association Tests
• Technologies under test– HomePlug GreenPHY (PL-14, PL-15, and XAV2001)
• QCA7000 HPGP chipset available mid January– G3-FCC (Maxim 2992)
• (Autorem G3 Cenelec – discontinued testing )– TI Concerto G3-FCC expected mid January (IPv6 in question)

4© 2011 Electric Power Research Institute, Inc. All rights reserved.
Differences between TCP and UDP testing
• TCP tests the available channel capacity. It pushes as much data through as possible. The result is the maximum data rate that can be carried.
• UDP tests whether a specific rate of packet flow can be carried through the channel. You tell the sender what rate to send at. At the receiver, the test result is how many packets made it through.
• CAN Tunneling would fall under the UDP test, where the application data flow determines the number of UDP packets that are sent. (Not part of test plan)

5© 2011 Electric Power Research Institute, Inc. All rights reserved.
General Lab Setup

6© 2011 Electric Power Research Institute, Inc. All rights reserved.
Test Setup for Bandwidth and Latency
• Bandwidth as measured by TCP throughput using IPv6
• PING script to test round trip time at IPv6– Script repeats test for packet sizes between 16 and
1024 bytes.

7© 2011 Electric Power Research Institute, Inc. All rights reserved.
Results for Bandwidth
4509 Kbpsaverage
Std Dev 59
4550 Kbpsaverage
Std Dev 107
59.4 Kbpsaverage
Std Dev 30
HPGP on Mains, IPv6 TCP/IP throughput, kbps
HPGP on Pilot, IPv6 TCP/IP throughput, kbps
G3 on Pilot, IPv6 TCP/IP throughput, kbps

8© 2011 Electric Power Research Institute, Inc. All rights reserved.
Combined results for Bandwidth
J2931 Test Limits: RD.UtilComm.3 MAC/PHY throughput shall be 100 kbps or greaterRD.DCComm.1 Application Data (payload) rate is 6 Kbps or greater concurrently (full-duplex)

9© 2011 Electric Power Research Institute, Inc. All rights reserved.
Results for Latency (Ping Time) (HPGP)
• Results are Ping round trip time (RD.DCComm.2: 25mS round trip)• Different packet sizes are tested: 16 to 1024 bytes
(average value of 4 pings for each size)
4 mStypical
4 mS
1 mSvariance
10© 2011 Electric Power Research Institute, Inc. All rights reserved.
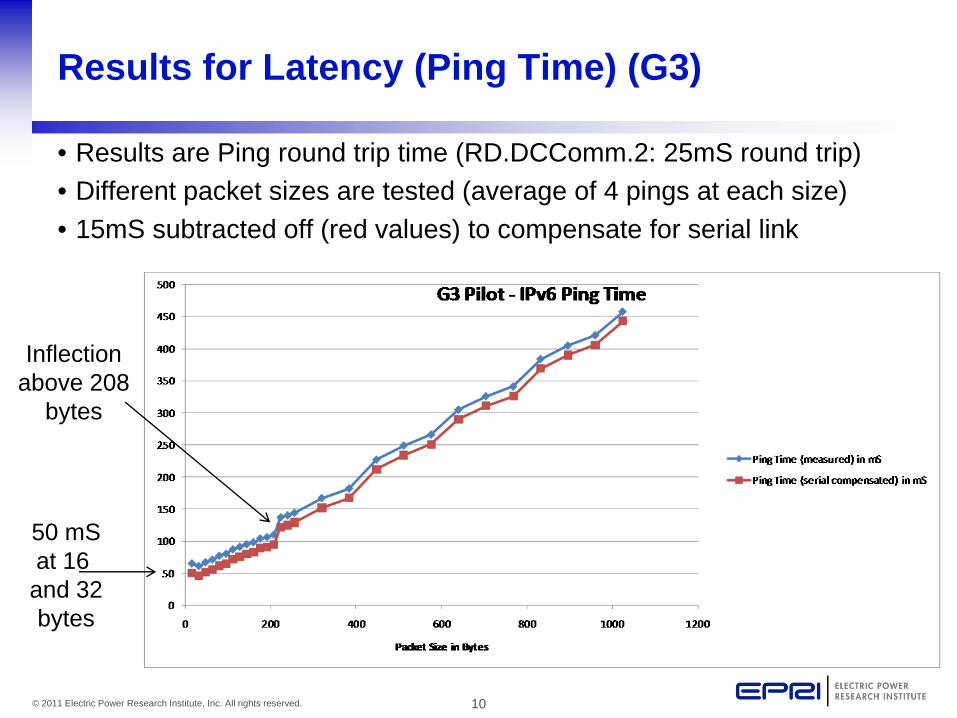
Results for Latency (Ping Time) (G3)
• Results are Ping round trip time (RD.DCComm.2: 25mS round trip)• Different packet sizes are tested (average of 4 pings at each size)• 15mS subtracted off (red values) to compensate for serial link
50 mSat 16 and 32bytes
Inflectionabove 208
bytes

11© 2011 Electric Power Research Institute, Inc. All rights reserved.
Summary results for Latency
Test Limit: 25mS
RD.DCComm.2
mS
Packet size,bytes
G3 latency is proportional to packet size, 50 –450mS
HPGP is constant latency, below 5mS

12© 2011 Electric Power Research Institute, Inc. All rights reserved.
HPGP Association Testing – basic setup
• DUT is PL-15 with INT7400 chipset and special SLAC firmware.
• DUT3 not necessary

13© 2011 Electric Power Research Institute, Inc. All rights reserved.
Association Tests – HPGP on Pilot (Untwisted)
Using PL-15
RSSI - Lower number is stronger signal. 0 – 60 is possible range. Each unit is 1 dB of attenuation Using 1.5nF coupling to Pilot. Average of 3 runs each.
RSSI Measurements:
EVSE2 PEV
EVSE1: 28EVSE2: 13 correct association.
EVSE1 PEV
EVSE1: 14EVSE2: 30correct association.

14© 2011 Electric Power Research Institute, Inc. All rights reserved.
Association Tests – HPGP on Pilot (Twisted)
Using PL-15
RSSI Measurements (average of 3 runs each):
EVSE2 PEV
EVSE1: 29EVSE2: 14 correct association.
EVSE1 PEV
EVSE1: 14EVSE2: 28correct association.

15© 2011 Electric Power Research Institute, Inc. All rights reserved.
Interference Testing
• Objective to determine system resilience to interference
• Interference testing is difficult with OFDM systems like HPGP and G3.– Wideband signal, adaptive modulation - work ‘around’ noise
• Interference tests used– White Noise – broadband, equal energy per Hz– Wideband FM – rapidly sweep interference across band
• Simulates short pulses of interference at various frequencies affecting the packets.
• Interference still to be done: Arc Lamp, DC Charger noise

16© 2011 Electric Power Research Institute, Inc. All rights reserved.
General Setup for Interference Tests
• Interference is always injected on Mains• Measurement point is mains or pilot, depending on type of
PLC being tested.

17© 2011 Electric Power Research Institute, Inc. All rights reserved.
AC Mains Interference Setup
Interference injection on Hot (L1) power conductor going to EVSE
(Someone didn’t pay attention to wire color standards)
Line Probefor spectrum measurement
Point of attachment for EVSE located Mains PLC (DUT2)L1 & L2 conductors in cordset)

18© 2011 Electric Power Research Institute, Inc. All rights reserved.
Measuring Signal to Noise ratio
• Difficult to measure because spectrum is not flat
• Objective is to raise interference level until 50% packet loss or throughput drop is seen.
• Measure power spectrum of signal, power spectrum of noise at same physical connection point.
• SNR is difference, in dB.

19© 2011 Electric Power Research Institute, Inc. All rights reserved.
HPGP MainsNoise floor and White Noise
White Noiseinterference
Noise Floor Signal Only
• Maximum output of signal generator – raise noise level to about -25dBm
• Above 10Mhz, noise floor is about -68dBm

20© 2011 Electric Power Research Institute, Inc. All rights reserved.
HPGP Data
Wideband FMinterference • Maximum output of signal
generator. -10 to -20dBm
• Signal only, no noise. Ranges from -30 to -60dBm
HPGP MainsFM and PLC Data

21© 2011 Electric Power Research Institute, Inc. All rights reserved.
White Noise
PLC Only
HPGP Mains White Noise Interference - SNR
>10dB
Noise is 0 to 20dB stronger than HPGP signal. No impairment of throughput or latency
22© 2011 Electric Power Research Institute, Inc. All rights reserved.
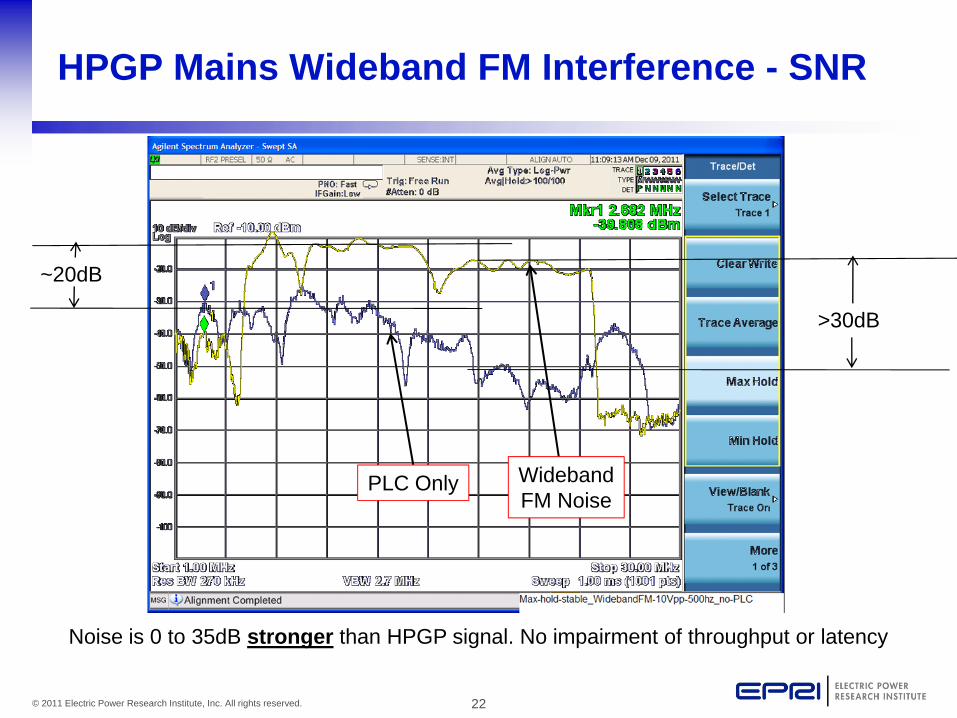
HPGP Mains Wideband FM Interference - SNR
>30dB
Noise is 0 to 35dB stronger than HPGP signal. No impairment of throughput or latency
PLC Only WidebandFM Noise
~20dB

23© 2011 Electric Power Research Institute, Inc. All rights reserved.
HPGP Mains interference results: Ping Latency
• Ping latency reveals MAC-layer retries– Even if there is no packet loss at the IP layer, interference may be
causing packet loss in the MAC and PHY layers. – An increase in MAC layer retries will be visible as increase in
round trip time.
NoMeasurable
Effect

24© 2011 Electric Power Research Institute, Inc. All rights reserved.
HPGP Mains interference results: TCP throughput
NoMeasurable
Effect
No Noise 4607
White Noise 4595
Wide FM 4612

25© 2011 Electric Power Research Institute, Inc. All rights reserved.
Setup for G3 Pilot Interference
• Pilot noise injection CT
• Maxim G3 Modem
• Spectrum Analyzer Active Probe

26© 2011 Electric Power Research Institute, Inc. All rights reserved.
G3 PilotFM and PLC Data
G3 Data only
Wideband FMinterference
• Screen Range 100-500KHz– Signal range 160-478KHz– Noise Range 75% of signal
(200-438 KHz)
• Noise spectrum: Approx -28dBm
• Signal only, no noise. Approx -38dBm

27© 2011 Electric Power Research Institute, Inc. All rights reserved.
G3 Pilot Wideband FM Interference - SNR
WidebandFM Noise
PLC Only
10dB
Noise is approx 10dB stronger than G3signal
28© 2011 Electric Power Research Institute, Inc. All rights reserved.
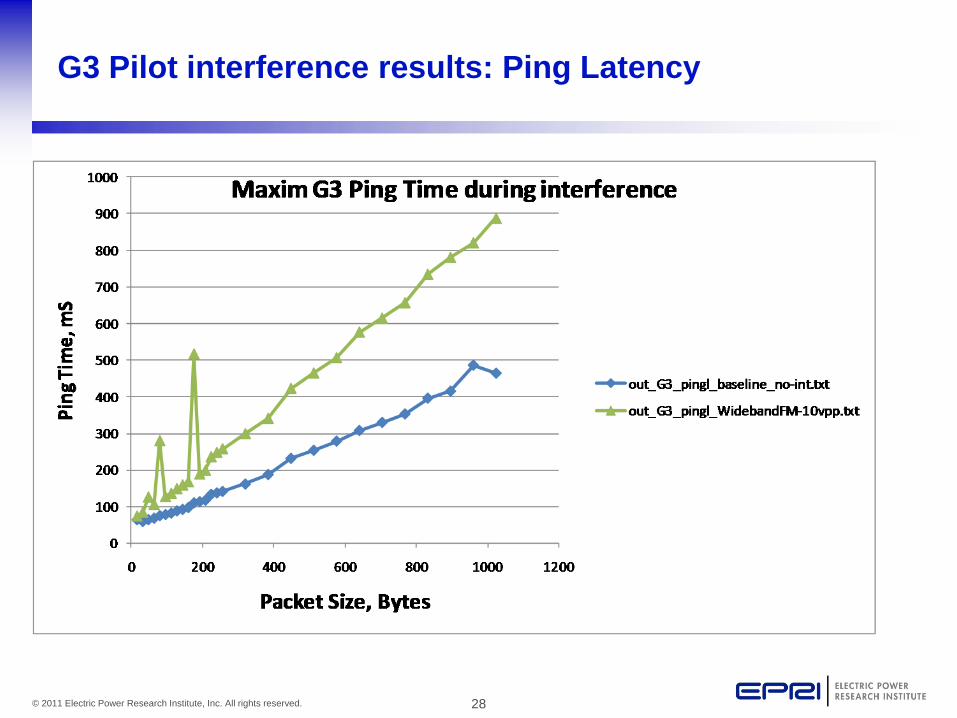
G3 Pilot interference results: Ping Latency

29© 2011 Electric Power Research Institute, Inc. All rights reserved.
G3 Pilot interference results: Ping Latency (zoom)

30© 2011 Electric Power Research Institute, Inc. All rights reserved.
G3 Pilot interference results: Latency increase %
Approx 80% increase in latency with Interference

31© 2011 Electric Power Research Institute, Inc. All rights reserved.
G3 Pilot interference results: TCP throughput
40.4 Kbps AverageNo Interference
18.9 Kbps AverageWith Interference

32© 2011 Electric Power Research Institute, Inc. All rights reserved.
G3 Pilot interference results: TCP (avg) throughput
40.4 Kbps AverageNo Interference
18.9 Kbps AverageWith Interference
53% reduction

33© 2011 Electric Power Research Institute, Inc. All rights reserved.
Interference Summary
• HPGP On Mains– SNR minus 20-30dB (Noise stronger than signal) for WB
FM interference– SNR minus 0-20dB (Noise stronger than signal) for White
Noise interference– No significant change in Ping latency or TCP throughput
beyond normal random variations.
• G3 on Pilot– SNR minus 10dB (Noise stronger than signal) for WB FM
interference– Approx 80% increase in Ping latency– Approx 53% reduction in TCP throughput

34© 2011 Electric Power Research Institute, Inc. All rights reserved.
Schedule, Next Steps
• EPRI will complete Interference, Crosstalk, and coexistence tests for these platforms by Mid January
• Starting Mid-January, we will repeat tests with QCA7000 platform for HPGP
• If TI Concerto G3 platform is available with IPv6, they will be tested in parallel with QCA7000.
• Complete all testing by end of February
• At that point, SAE must make technology selection (if a decision has not been made by then)
• Once the technology has been selected, HAN testing may be conducted as needed.

35© 2011 Electric Power Research Institute, Inc. All rights reserved.
Together…Shaping the Future of Electricity

36© 2011 Electric Power Research Institute, Inc. All rights reserved.
QoS Test Results
Backup

37© 2011 Electric Power Research Institute, Inc. All rights reserved.
DSCP Tagging
• Can be generated by JPERF application:– Consistent with test plan
• Results in packet tagged with DSCPvalue of 0x01:
• DSCP tag is upper 6 bitsof 8 bit field (0x04)
• Homeplug GreenPHY PIB configured like this toassign CAP 2 priority:

38© 2011 Electric Power Research Institute, Inc. All rights reserved.
Baseline
• Two TCP streams over HPGP – no QoS tagging used• Right trace runs concurrently for 10 seconds in middle of left trace• Result – Bandwidth shared equally – 50% drop with 2nd TCP stream
39© 2011 Electric Power Research Institute, Inc. All rights reserved.
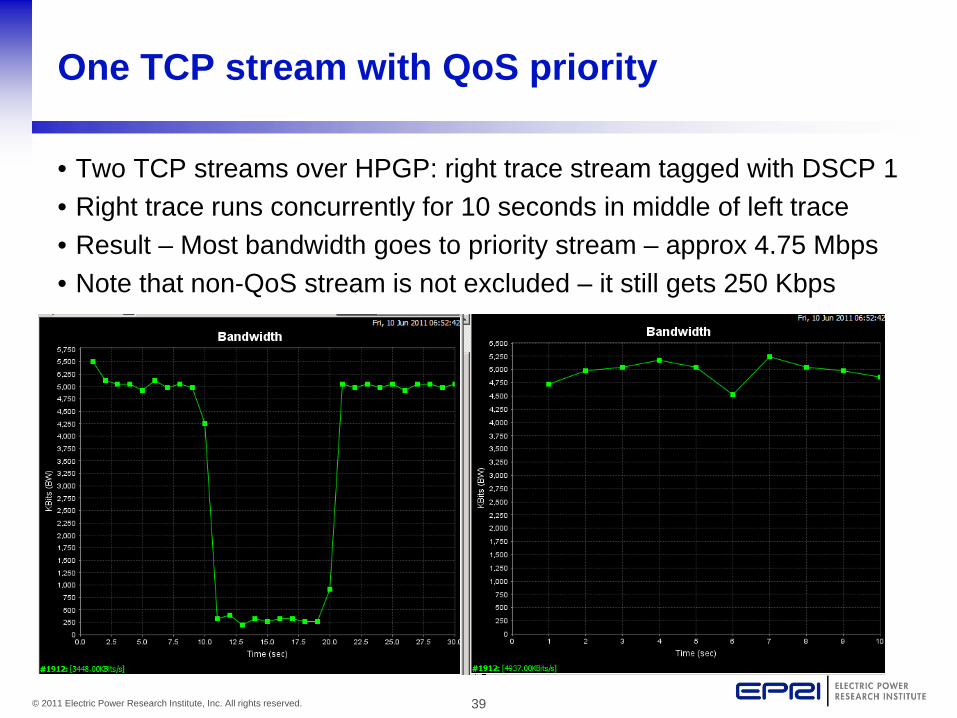
One TCP stream with QoS priority
• Two TCP streams over HPGP: right trace stream tagged with DSCP 1• Right trace runs concurrently for 10 seconds in middle of left trace• Result – Most bandwidth goes to priority stream – approx 4.75 Mbps• Note that non-QoS stream is not excluded – it still gets 250 Kbps
40© 2011 Electric Power Research Institute, Inc. All rights reserved.
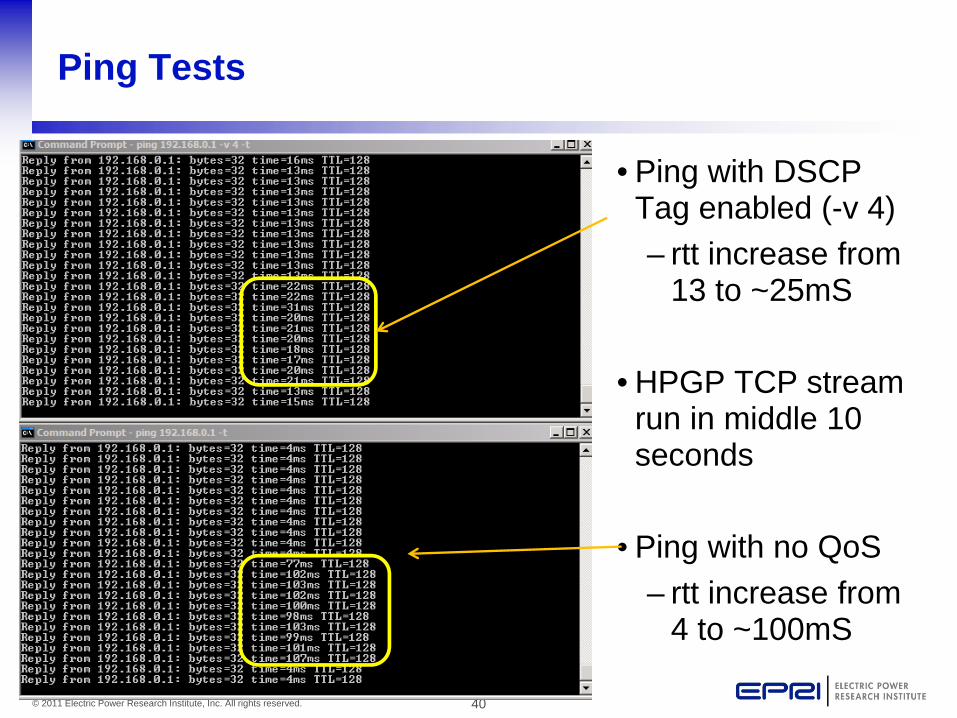
Ping Tests
• Ping with DSCP Tag enabled (-v 4)– rtt increase from
13 to ~25mS
• HPGP TCP stream run in middle 10 seconds
• Ping with no QoS– rtt increase from
4 to ~100mS

41© 2011 Electric Power Research Institute, Inc. All rights reserved.
HPGP 7% Bandwidth Limit
Backup

42© 2011 Electric Power Research Institute, Inc. All rights reserved.
About the HPGP 7% Bandwidth limit
• A HPGP device may be limited to 7% of “time on wire” from a HPAV network on a shared medium under these conditions:– The HPAV network must be highly loaded, using 93% of time.
Otherwise HPGP is free to contend for more than 7% of time.– The limit only takes effect if coupling from HPAV network to
cordset is sufficient to decode the HPAV traffic.• If and only if these conditions are true, then:
– Basic HPGP PHY rate is 10Mbps, 7% is 700Kbps– HPGP TCP/IP throughput after MAC overhead is ~5Mbps, 7%
of that is 350Kbps.– J2931 test throughput is 100Kbps. (RD.UtilComm.1)– J2931 test data will not exceed 7% under any circumstances. – 7% of HPGP bandwidth is more than enough to meet J2931
requirements


