PllfCTiaSea D) USDA tor OfflCla( n~ PERFORMANCE OF A CHEMICAL INJECTION SPRAYER SYSTEM K. A. Sudduth, S. C. Borgelt, J. Hou ABSTRACT. The dynamic and steady state performance of a commercial chemical injection system was evaluated to determine if the system could be modified for variable-rate herbicide application. A helium-neon (He-Ne) laser system was used to quantify concentration uniformity across the spray pattern, along with the response characteristics of the system controller, the injection pump module, and the overall system. A range of operating conditions were created by changing system pressure and simulated sprayer travel speed. There was little variation in nozzle output distribution (CV < 10.5%) and chemical concentration (CV < 7.0%) across the spray path. The delay of the injection controller was slightly more than 1 s and injection pump delay was approximately 4 s. Controller and pump responses were rapid enough to qualify these components for use in a variable-rate application system. The long delay time (14 to 21 s) for chemical concentration response after a step change in travel speed was attributed to transport delays in the mixing chamber and spray boom. Accurate variable-rate application will require reduction of this delay and!or development of control algorithms to compensate for the delay. Keywords. Direct injection, Chemical control, Control performance, Controller response, Nozzles. C hemical sprayers are used for production agriculture worldwide. In a traditional system, the concentrated chemical and the carrier, usually water, are mixed together and carried in one tank. The mixture is pumped from the tank and sprayed out the nozzles. In a chemical injection sprayer, the undiluted chemical and carrier are contained in separate tanks. The carrier is pumped to the nozzles at a constant rate per unit time, while chemical is metered and injected into the carrier on the basis of desired chemical application rate. A mixing device may be used to insure that the chemical and carrier are mixed before being discharged through the nozzles. Compared to conventional sprayers, injection sprayer systems can reduce applicator exposure to chemicals during the mixing and loading process. Disposing of unused chemical is less of a problem, since the chemical is undiluted and can be returned to the original container for later use or disposal. Also, injection technology may be more easily adaptable to the variable-rate applicators which will be needed to apply varying amounts of pesticide at Article was submitted for publication August 1994; reviewed and approved for publication by the Power and Machinery Div. of ASAE in December 1994. Presented as ASAE Paper No. 93-1117. Contribution of the Missouri Agricultural Experiment Station, Joumal Series No. 12,176. Names are necessary to report factually on available data; however, the USDA and the University of Missouri neither guarantee nor warrant the standard of the product, and the use of the name implies no approval of the product to the exclusion of others that may also be suitable. The authors are Kenneth A. Sudduth, ASAE Member Engineer, Agricultural Engineer, Cropping Systems and Water Quality Research Unit, USDA-Agricultural Research Service, Steven C. Borgelt, ASAE Member Engineer, Assistant Professor, Jian-xun HOD, former Graduate Research Assistant, Agricultural Engineering Dept., University of Missouri, Columbia. different locations within a field for site-specific crop management. In this project, the steady state and dynamic performance characteristics of a commercial chemical injection sprayer system, the Raven SCS-700, were evaluated to determine the feasibility of modifying the system for variable-rate herbicide application. It was imperative to understand the operational characteristics and limitations of the chemical injection sprayer system available, before a successful variable-rate system could be developed. Tests of a similar system by Budwig et al. (1988) provided a basis for the investigation, but their work only reported on overall system response, and did not include the required information on controller and injection pump response characteristics. LITERATURE REVIEW Reports of systems to meter, or inject, concentrated pesticides into the diluent stream began to appear in the research literature in the mid 1970s (Hughes and Frost, 1985). Vidrine et al. (1975) developed and tested a laboratory system which demonstrated the feasibility of injecting concentrated pesticides. Problems noted with this system included nonuniform pesticide application and transient application errors resulting from changes in operating speed. Reichard and Ladd (1983) developed a field sprayer which included injection of pesticides at the proper rate for variations in travel speed. The unit was reported to work well in field tests. Chi et al. (1988) developed an electronic flow rate control system for metering concentrated pesticides. Ghate and Phatak (1991) developed and tested a field sprayer which used compressed air to inject concentrated chemical into the carrier stream. Koo et al. (1987) found the time delay of concentrated pesticides through injection sprayers to be significant, and VOL. 11(3):343-348 Applied Engineering in Agriculture 1995 American Society of Agricultural Engineers 343 - ---
Transcript
PllfCTiaSea D) USDAtor OfflCla(n~
PERFORMANCE OF A CHEMICAL INJECTION SPRAYER SYSTEM
K. A. Sudduth, S. C. Borgelt, J. Hou
ABSTRACT.The dynamic and steady state performance of a commercial chemical injection system was evaluated todetermine if the system could be modified for variable-rate herbicide application. A helium-neon (He-Ne) laser systemwas used to quantify concentration uniformity across the spray pattern, along with the response characteristics of thesystem controller, the injection pump module, and the overall system. A range of operating conditions were created bychanging system pressure and simulated sprayer travel speed. There was little variation in nozzle output distribution(CV < 10.5%) and chemical concentration (CV < 7.0%) across the spray path. The delay of the injection controller wasslightly more than 1 s and injection pump delay was approximately 4 s. Controller and pump responses were rapidenough to qualify these components for use in a variable-rate application system. The long delay time (14 to 21 s) forchemical concentration response after a step change in travel speed was attributed to transport delays in the mixingchamber and spray boom. Accurate variable-rate application will require reduction of this delay and!or development ofcontrol algorithms to compensate for the delay. Keywords. Direct injection, Chemical control, Control performance,Controller response, Nozzles.
Chemical sprayers are used for productionagriculture worldwide. In a traditional system, theconcentrated chemical and the carrier, usuallywater, are mixed together and carried in one tank.
The mixture is pumped from the tank and sprayed out thenozzles. In a chemical injection sprayer, the undilutedchemical and carrier are contained in separate tanks. Thecarrier is pumped to the nozzles at a constant rate per unittime, while chemical is metered and injected into thecarrier on the basis of desired chemical application rate. Amixing device may be used to insure that the chemical andcarrier are mixed before being discharged through thenozzles.
Compared to conventional sprayers, injection sprayersystems can reduce applicator exposure to chemicalsduring the mixing and loading process. Disposing ofunused chemical is less of a problem, since the chemical isundiluted and can be returned to the original container forlater use or disposal. Also, injection technology may bemore easily adaptable to the variable-rate applicators whichwill be needed to apply varying amounts of pesticide at
Article was submitted for publication August 1994; reviewed andapproved for publication by the Power and Machinery Div. of ASAE inDecember 1994. Presented as ASAE Paper No. 93-1117.
Contribution of the Missouri Agricultural Experiment Station, JoumalSeries No. 12,176. Names are necessary to report factually on availabledata; however, the USDA and the University of Missouri neitherguarantee nor warrant the standard of the product, and the use of the nameimplies no approval of the product to the exclusion of others that may alsobe suitable.
The authors are Kenneth A. Sudduth, ASAE Member Engineer,Agricultural Engineer, Cropping Systems and Water Quality ResearchUnit, USDA-Agricultural Research Service, Steven C. Borgelt, ASAEMember Engineer, Assistant Professor, Jian-xun HOD, former GraduateResearch Assistant, Agricultural Engineering Dept., University ofMissouri, Columbia.
different locations within a field for site-specific cropmanagement.
In this project, the steady state and dynamicperformance characteristics of a commercial chemicalinjection sprayer system, the Raven SCS-700, wereevaluated to determine the feasibility of modifying thesystem for variable-rate herbicide application. It wasimperative to understand the operational characteristics andlimitations of the chemical injection sprayer systemavailable, before a successful variable-rate system could bedeveloped. Tests of a similar system by Budwig et al.(1988) provided a basis for the investigation, but their workonly reported on overall system response, and did notinclude the required information on controller and injectionpump response characteristics.
LITERATURE REVIEWReports of systems to meter, or inject, concentrated
pesticides into the diluent stream began to appear in theresearch literature in the mid 1970s (Hughes and Frost,1985). Vidrine et al. (1975) developed and tested alaboratory system which demonstrated the feasibility ofinjecting concentrated pesticides. Problems noted with thissystem included nonuniform pesticide application andtransient application errors resulting from changes inoperating speed. Reichard and Ladd (1983) developed afield sprayer which included injection of pesticides at theproper rate for variations in travel speed. The unit wasreported to work well in field tests. Chi et al. (1988)developed an electronic flow rate control system formetering concentrated pesticides. Ghate and Phatak (1991)developed and tested a field sprayer which usedcompressed air to inject concentrated chemical into thecarrier stream.
Koo et al. (1987) found the time delay of concentratedpesticides through injection sprayers to be significant, and
VOL. 11(3):343-348
Applied Engineering in Agriculture
1995 American Society of Agricultural Engineers 343
- ---
proposed injection at the individual nozzles as a possiblesolution to shorten delays. Tompkins et al. (1990) injecteda tracer chemical into the diluent stream at three points ona boom sprayer-immediately before and after the diluentpump, and at the individual nozzles. They found that as theinjection point was moved downstream, transient time wasreduced, but variations in chemical concentration betweennozzles were greater. Miller and Smith (1992) reported ondevelopment of a direct nozzle injection system thatovercame the concentration variation problems reported byprevious researchers. Way et al. (1992) used simulation tocompare chemical application accuracies for variousdesigns of injection sprayers. They found that reducing thediameter of the fluid lines near the end of the spray boomsimproved overall application accuracy.
Budwig et al. (1988) analyzed the Raven SCS-700commercial chemical injection system. A helium-neonlaser was used to optically measure the concentrationvariations of potassium permanganate injected into thesprayer boom. Tests revealed consistent chemicalconcentrations among the sprayer nozzles, satisfactorymixing of the diluent and chemical streams, and large delaytimes when chemical rates (or simulated travel speeds)were changed.
OBJECTIVESThe objectives of this research were to:
Measure spray distribution, uniformity of chemicaland diluent mixing, and time delay at differentnozzles along the boom at various pressures andsimulated travel speeds.Determine the influence of the chemical injectioncontroller and the injection pump on systemresponse at various simulated travel speeds.
EQUIPMENT AND PROCEDURESSYSTEM TESTED
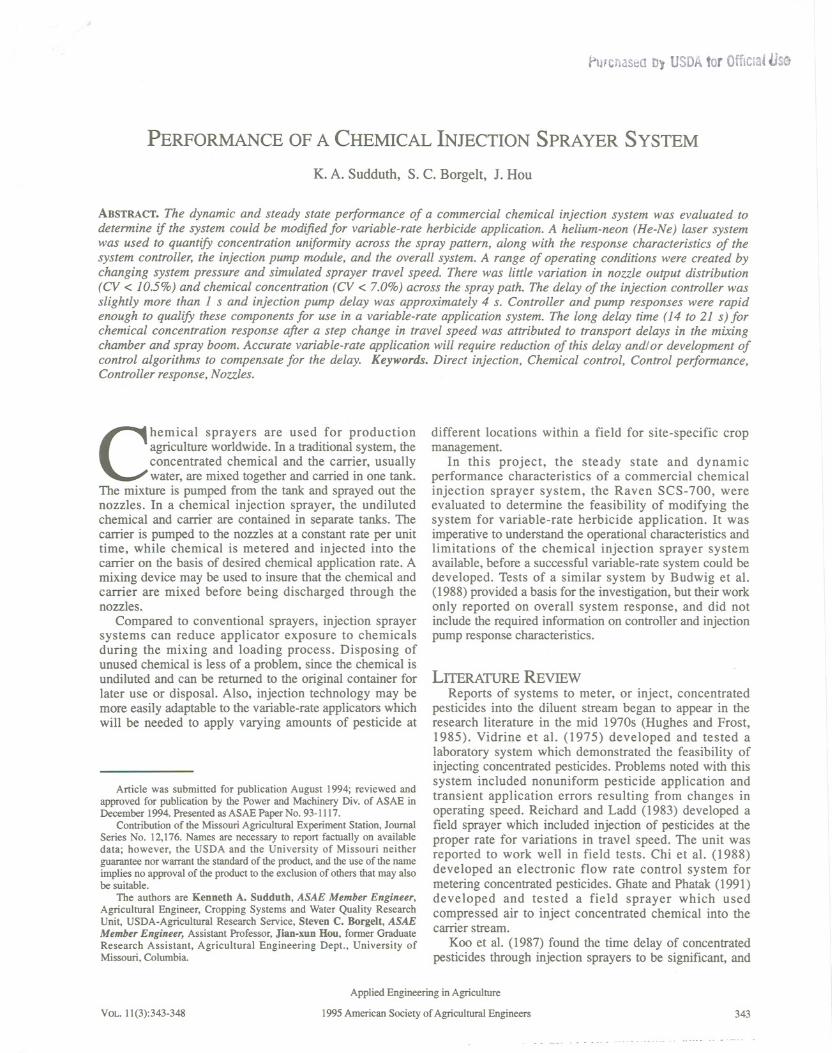
The system tested was a Raven SCS- 700 chemicalinjection spray system (fig. 1). The SCS-7oo consisted of acontrol console, a radar speed sensor, two injectionmodules with metering pumps, and an in-line mixer.
Figure I-Chemical injection sprayer system as configured forlaboratory dynamic response tests.
344
The chemical metering pumps were positivedisplacement piston pumps, and operated with submergedinlets due to the position of the chemical tanks above thepumps. A variable speed DC motor drove each injectionpump at the proper speed based on travel speed and thedesired theoretical application rate. The control console,mounted at the operator's station, contained amicroprocessor and associated circuitry to monitor theradar ground speed sensor and to control the speed of theinjection pump motors as required. The console allowedthe operator to select sprayer boom widths, pump responseparameters, and desired chemical application rates. It alsocalculated and displayed application rate, ground speed,area sprayed, and volume of chemical used.
In normal field operation, a power take-off- (pto-)driven or engine-driven pump would be used inconjunction with a pressure regulator to maintain aconstant pressure in the spray boom, and therefore aconstant flow rate of the carrier. However, in these tests itwas desirable to reduce pressure variations that might beencountered with this type of system and to provide easyand repeatable pressure adjustments. This wasaccomplished by pressurizing the carrier (water) tankthrough an adjustable air regulator.
CHEMICAL CONCENTRATION MEASUREMENT
Potassium permanganate (KMnO4) at a concentration of2.5 g/L was used as the tracer to represent concentratedchemical. Tap water was used as the carrier. As anincreased volume of the KMn04 solution was injected intothe carrier fluid, the optical density or opacity of the spraysolution changed accordingly. The relationship betweenopacity of the solution and chemical concentration wasestablished and used to calibrate the sprayer performancetests.
The concentration of KMn04 in the spray solution wasmeasured using an Aerotech LSR5P He-Ne laser and aUnited Detector Technology UDT-455 photodetector. Thelaser beam was oriented to pass through a known thicknessof solution held in a cuvette or a flow-through sample cell.The photodetector was positioned to measure that portionof the laser output transmitted through the solution. A100 Hz low-pass filter was implemented to attenuate high-frequency electrical noise from the photodetector signal.All electrical grounds, including the AC power supplyearth ground, were connected together. Shielded wireswere used, and the measurement system was powered by aseparate DC supply.
The spray solution was collected in small square glasscuvettes (10 x 10 x 44 mm) during steady state tests. Initialtests using conventional test tubes were unsuccessful, dueto the difficulty of maintaining alignment of the laser beamon the diametral axis of the tube. The data recorded fromidentical concentration solutions showed a coefficient ofvariation (CV) of 1.5% with the square cuvette comparedto 8% with a round test tube. For dynamic tests, a samplecell was constructed and mounted in the spray boom hose.Parallel optical glass windows on two sides of the samplecell provided the optical pathway for laser optical densitymeasurements.
A voltage-to-frequency converter circuit was built tosimulate the output of the radar speed sensor. Changes inthe simulated travel speed of the sprayer, and therefore the
APPLIED ENGINEERING IN AGRICULTIJRE
injected chemical flow rate, could then be made byadjusting the voltage input to the circuit.
Data were collected with a MetrabyteDAS.16plug.indata acquisition board in an IBM XT computer. A programwritten in QuickBasic recorded the photodetector outputand injection pump control signals. This program alsocontrolled the voltage-to-frequency circuit used to simulatetravel speed.
STEADY STATE TESTS
A 9.5 mm (0.375 in.) diameter test boom with twoTeejet 8003 nozzles (Spraying Systems Co., Wheaton, TII.)spaced 510 mm (20 in.) apart was used for the steady statetests. The two nozzles were installed 460 mm (18 in.)above a spray table with 32 mm (1.25 in.) wide channels.The output from the nozzles was collected for 60 s on thespray table and pattern uniformity was evaluated for theportion of the spray pattern between the two nozzles.
To measure chemical concentration uniformity, a smallamount of solution from each tube on the spray table wastransferred to a square cuvette. The cuvette was then placedin a holder installed between the laser and thephotodetector. The mean output voltage from thephotodetector for each sample was obtained as the averageof 500 individual readings (10 s at a 50 Hz sampling rate).
Six operating conditions were used in the steady statemeasurements. Three system pressure settings, 207, 276,and 345 kPa (30, 40, and 50 psi) were combined with twosimulated travel speeds, 1.8 and 2.7 mls (4 and 6 mile/h).Using a target application rate of 5.2 Llha (0.5 gall A),these speeds corresponded to chemical flow rates of3.4 and 5.1 mLis (6.9 and 10.3 oz/min), respectively.
DYNAMIC RESPONSE TESTS
The dynamic response of the system was quantified bythe standard approach of imposing a step change in thecommand input, which in this case was simulated travelspeed. It was recognized that this was a more severe test ofsystem response than would be expected in field operationof a sprayer, where changes in travel speed would not beinstantaneous. However, the goal of these tests was not tosimulate normal field operation, but rather to measureresponse parameters which could then be used to evaluatethe applicability of the tested system for variable-ratechemical application. In this regard, the step change testdid simulate the response which might be required in amap-based approach to variable-rate chemical application.The input to the injection controller would exhibit a stepchange as the sprayer traversed from an area mapped withone application rate to an adjacent area mapped with adifferent rate.
A symmetrical spray boom with six Teejet 8002 nozzlesspaced 510 mm (20 in.) apart in a 9.5 mm (0.375 in.)diameter line was used for the dynamic tests. Data werecollected with the test cell installed at three locations onone side of the boom, adjacent to each nozzle (fig. 1).
Data collection for the dynamic tests began with thesystem in steady state. After 1500 data points werecollected (30 s), the data acquisition system simulated astep change in sprayer travel speed. Another 3000 datapoints were collected after the change in simulated speed,allowing the system to come to steady state at the newoperating level. Four channels of analog data were
VOL. 11(3):343-348
recorded during the dynamic tests-photodetector outputvoltage, injection pump speed, and the two control signalsfrom the systemcontroller to the injection pump drivemotor. Controller response could then be determined bymeasuring the time from input command change tocontroller output change. Similarly, pump response wasquantified by measuring the time from controller outputchange to pump speed change.
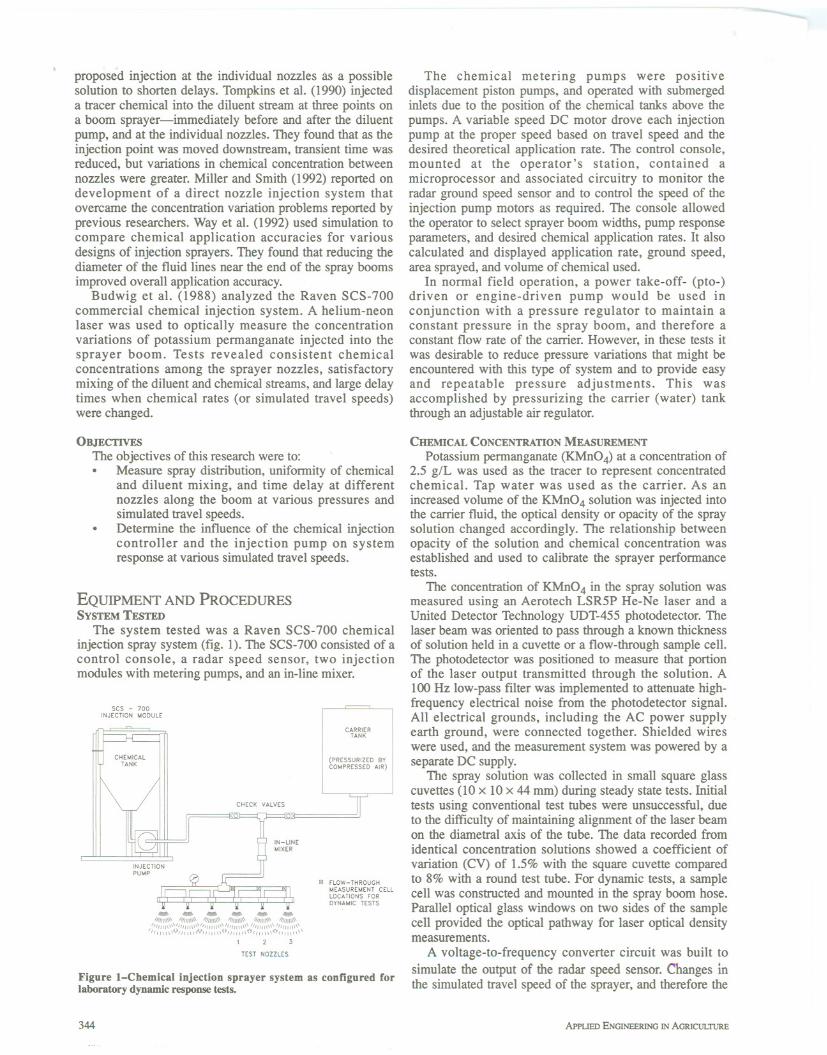
The response parameters quantified from these dataincluded delay time, dead time, and rise time (fig. 2). Delaytime was defined as the time required for the outputresponse to a step input to reach 50% of its final value.Dead time was defined as the time required for the outputresponse to a step input to reach 10% of its final value.Rise time was defined as the time required for the outputresponse to a step input to rise from 10 to 90% of its finalvalue (DiStefano et aI., 1967). All three responseparameters were measured for chemical concentration andinjection pump speed. The delay time between thesimulated speed input signal to the controller and theoutput from the controller to the injection pump motor wasalso measured.
Four operating conditions were tested, with thesimulated travel speed of the sprayer changing stepwisefrom 1.8 to 2.7 mls (4 to 6 milelh, 3.4 to 5.1 mLls), from2.7 to 1.8 mis, from 1.8 to 3.1 mls (4 to 7 milelh, 3.4 to6.0 mLls), and from 3.1 to 1.8 m/s. The wider speed rangeapproached the maximum dynamic range available with asingle manual setting of the Raven injection pump. Use ofthe second, narrower speed range allowed for testing of thelinearity of the system response with inputs of variousmagnitudes, information which would would be importantfor detailed control system design. System pressure wasmaintained at 207 kPa (30 psi) for the dynamic responsetests. Three replications of data were obtained for eachoperating condition.
RESULTS AND DISCUSSIONCONCENTRATION CALmRATION CURVE
Calibration curves for the relationship betweenphotodetector output voltage and KMn04 concentrationwere obtained experimentally. In order to stabilize outputvoltages from the photodetector, the laser andphotodetector instrumentation were preheated for at least
100 Input Command~----------------1 ,IIIII
T '
IIII
--_u_-Imumumm. ., ./ .. i .:Rise Time: .:DelayTime:
--i DeadTime i :
Q)'":5 80"-'"Q)
a:
Ii} 60ii5'5LL 40'5c:Q)e 20Q)D..
0
Time
Figure 2-Definitions of delay time, dead time, and rise time.
345
2 h before calibration tests and the subsequent responsetests.
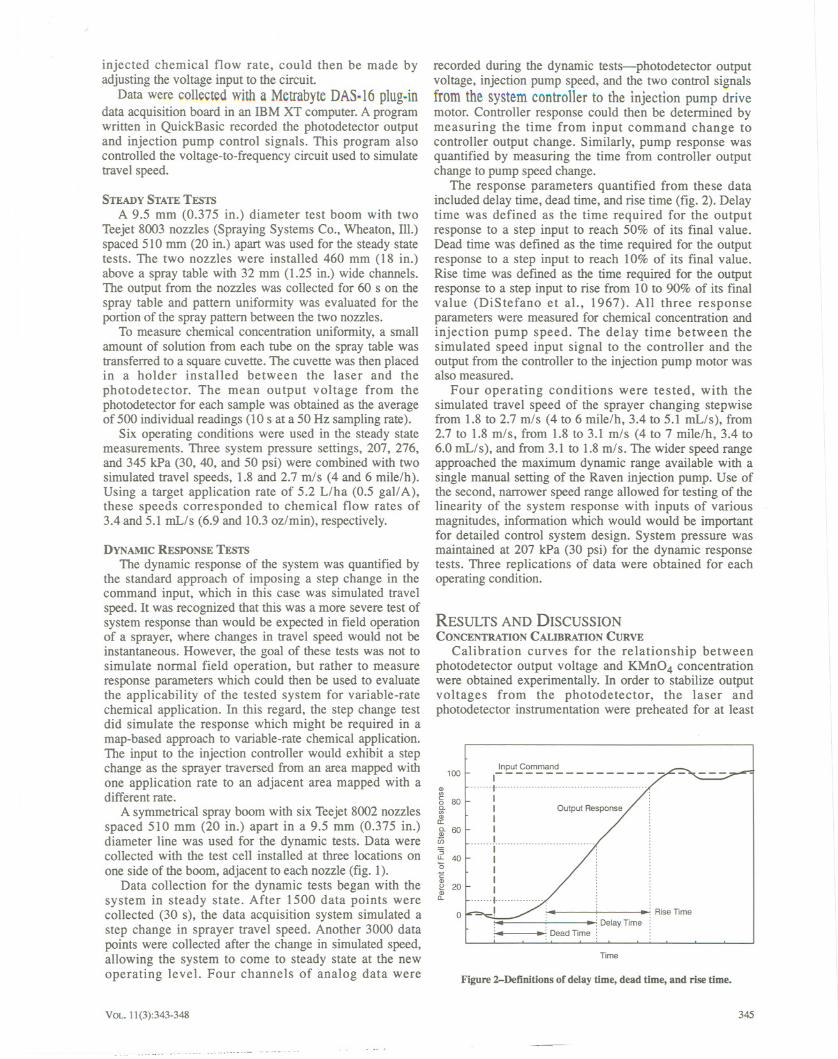
The calibration equation was assumed to followLambert's Law for the absorbance of light by a mediumwith negligible fluorescence and light scattering (Freeman,1990). Experimental data obtained at a number ofconcentrations were fit to the following equation:
v = Be-ac
whereV = photodetector output (V)C = concentration of KMnO4 (g/L)a, B = experimental coefficientsGood calibrations were obtained both for the steady
state test configuration with the glass cuvettes (fig. 3) andfor the dynamic test configuration using the flow-throughsample cell (R2 > 0.995 in all cases). Although the value ofthe coefficient a remained constant over multiplecalibration tests, the value of B varied considerably over anumber of hours or days. As shown by equation 1, B wasthe photodetector output at zero concentration, a parameterwhich could be expected to change due to drift in themeasurement system. However, tests showed the drift of Bwithin 1 h was less than 1%. Therefore, the value of B wasredetermined every 60 min or sooner by calibrating thesystem with tap water. For future use of the measurementsystem, it would be desirable to include additional signalconditioning circuitry to stabilize photodetector output overlonger time periods.
STEADY STATE RESULTS
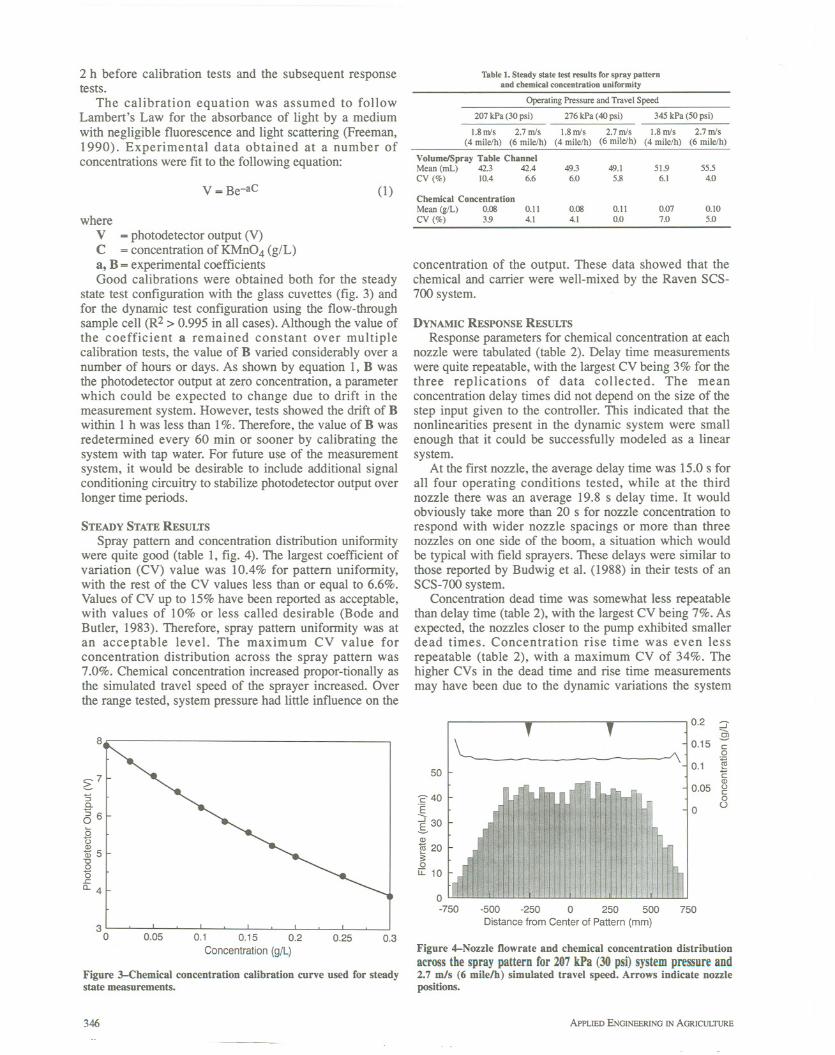
Spray pattern and concentration distribution uniformitywere quite good (table 1, fig. 4). The largest coefficient ofvariation (CV) value was 10.4% for pattern uniformity,with the rest of the CV values less than or equal to 6.6%.Values of CV up to 15% have been reported as acceptable,with values of 10% or less called desirable (Bode andButler, 1983). Therefore, spray pattern uniformity was atan acceptable level. The maximum CV value forconcentration distribution across the spray pattern was7.0%. Chemical concentration increased propor-tionally asthe simulated travel speed of the sprayer increased. Overthe range tested, system pressure had little influence on the
8
~7'5c.'5600U*5"U00.r:0..4
30 0.05 0.1 0.15 0.2
Concentration (g/L)
0.25
Figure 3-Chemical concentration calibration curve used for steadystate measurements.
346
Table 1. Steady state test results for spray patternand chemical concentration uniformity
Operating Pressure and Travel Speed
(1)
concentration of the output. These data showed that thechemical and carrier were well-mixed by the Raven SCS-700 system.
DYNAMIC RESPONSE RESULTS
Response parameters for chemical concentration at eachnozzle were tabulated (table 2). Delay time measurementswere quite repeatable, with the largest CV being 3% for thethree replications of data collected. The meanconcentration delay times did not depend on the size of thestep input given to the controller. This indicated that thenonlinearities present in the dynamic system were smallenough that it could be successfully modeled as a linearsystem.
At the first nozzle, the average delay time was 15.0 s forall four operating conditions tested, while at the thirdnozzle there was an average 19.8 s delay time. It wouldobviously take more than 20 s for nozzle concentration torespond with wider nozzle spacings or more than threenozzles on one side of the boom, a situation which wouldbe typical with field sprayers. These delays were similar tothose reported by Budwig et al. (1988) in their tests of anSCS-7oo system.
Concentration dead time was somewhat less repeatablethan delay time (table 2), with the largest CV being 7%. Asexpected, the nozzles closer to the pump exhibited smallerdead times. Concentration rise time was even lessrepeatable (table 2), with a maximum CV of 34%. Thehigher CVs in the dead time and rise time measurementsmay have been due to the dynamic variations the system
~0.2 :::J
:§0.15 §
-"\ 10.1 g<::Q)
0.05 g0
()
50
'240'E
~30Q)
1ii 20~0
u: 10
0
0-750 -500 -250 0 250 500
Distance from Center of Pattern (mm)750
0.3Figure 4-Nozzle flowrate and chemical concentration distributionacross the spray pattern for 207 kPa (30 psi) system pressure and2.7 m/s (6 milelh) simulated travel speed. Arrows indicate nozzlepositious.
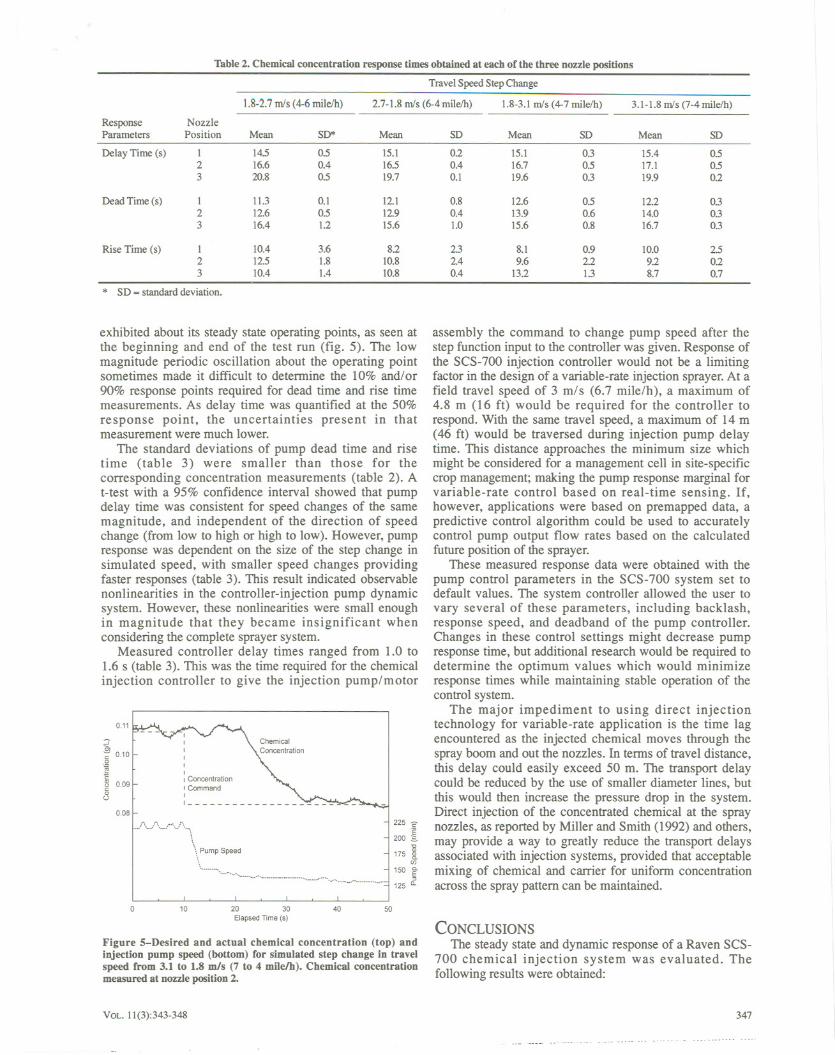
exhibited about its steady state operating points, as seen atthe beginning and end of the test run (fig. 5). The lowmagnitude periodic oscillation about the operating pointsometimes made it difficult to determine the 10% and/or90% response points required for dead time and rise timemeasurements. As delay time was quantified at the 50%response point, the uncertainties present in thatmeasurement were much lower.
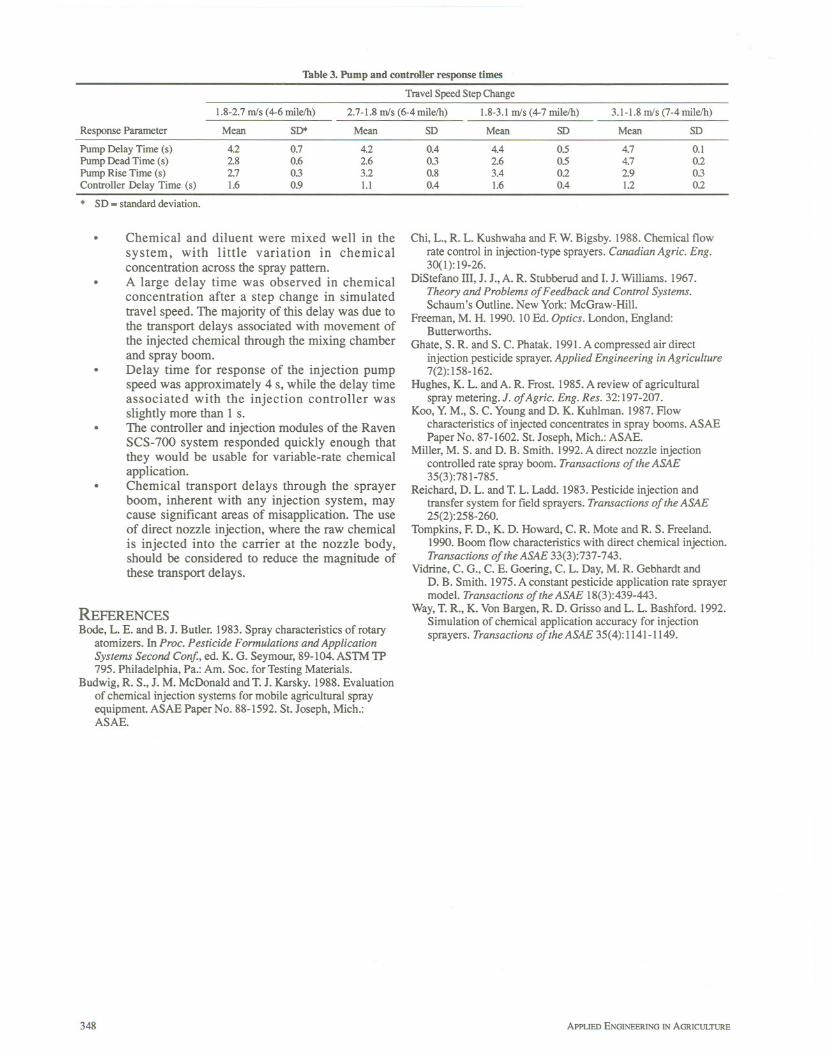
The standard deviations of pump dead time and risetime (table 3) were smaller than those for thecorresponding concentration measurements (table 2). At-test with a 95% confidence interval showed that pumpdelay time was consistent for speed changes of the samemagnitude, and independent of the direction of speedchange (from low to high or high to low). However, pumpresponse was dependent on the size of the step change insimulated speed, with smaller speed changes providingfaster responses (table 3). This result indicated observablenonlinearities in the controller-injection pump dynamicsystem. However, these nonlinearities were small enoughin magnitude that they became insignificant whenconsidering the complete sprayer system.
Measured controller delay times ranged from 1.0 to1.6 s (table 3). This was the time required for the chemicalinjection controller to give the injection pump/motor
::Jen~ 0.10~E~ 0.090
()
IIIII1I Concentration
I CommandI
1 ~--0.08
.f-.->"'"-",-,,./".,-.
1
225 ~\ 200 :s.\ ~\ Pump Speed 175 :!i
\ v » ;:: i0 10 20 30
Elapsed lime (s)
40 50
Figure 5-Desired and actual chemical concentration (top) andinjection pump speed (bottom) for simulated step change in travelspeed from 3.1 to 1.8 mls (7 to 4 mileJh). Chemical concentrationmeasured at nozzle position 2.
VOL. 11(3):343-348
assembly the command to change pump speed after thestep function input to the controller was given. Response ofthe SCS-700 injection controller would not be a limitingfactor in the design of a variable-rate injection sprayer.At afield travel speed of 3 m/s (6.7 mile/h), a maximum of4.8 m (16 ft) would be required for the controller torespond. With the same travel speed, a maximum of 14 m(46 ft) would be traversed during injection pump delaytime. This distance approaches the minimum size whichmight be considered for a management cell in site-specificcrop management; making the pump response marginal forvariable-rate control based on real-time sensing. If,however, applications were based on premapped data, apredictive control algorithm could be used to accuratelycontrol pump output flow rates based on the calculatedfuture position of the sprayer.
These measured response data were obtained with thepump control parameters in the SCS-700 system set todefault values. The system controller allowed the user tovary several of these parameters, including backlash,response speed, and deadband of the pump controller.Changes in these control settings might decrease pumpresponse time, but additional research would be required todetermine the optimum values which would minimizeresponse times while maintaining stable operation of thecontrol system.
The major impediment to using direct injectiontechnology for variable-rate application is the time lagencountered as the injected chemical moves through thespray boom and out the nozzles. In terms of travel distance,this delay could easily exceed 50 m. The transport delaycould be reduced by the use of smaller diameter lines, butthis would then increase the pressure drop in the system.Direct injection of the concentrated chemical at the spraynozzles, as reported by Miller and Smith (1992) and others,may provide a way to greatly reduce the transport delaysassociated with injection systems, provided that acceptablemixing of chemical and carrier for uniform concentrationacross the spray pattern can be maintained.
CONCLUSIONSThe steady state and dynamic response of a Raven SCS-
700 chemical injection system was evaluated. Thefollowing results were obtained:
347
._- m- m.o--
Response NozzleParameters Position Mean SD* Mean
Delay Time (s) I 14.5 0.5 15.12 16.6 0.4 16.53 20.8 0.5 19.7
Dead Time (s) 1 11.3 0.1 12.12 12.6 0.5 1293 16.4 1.2 15.6
Rise Time (s) 1 10.4 3.6 822 12.5 1.8 10.83 10.4 1.4 10.8
Pump Delay Time (s)Pump Dead Time (s)Pump Rise Time (s)Controller Delay Time (s)
1.8-2.7 mls (4-6 milelh)
Mean SD*
422.82.71.6
0.70.6030.9
3.1-1.8 mls (7-4milelh)
Mean SD
4.74.72.91.2
0.10.20302
* SD-standard deviation.
. Chemical and diluent were mixed well in thesystem, with little variation in chemicalconcentration across the spray pattern.A large delay time was observed in chemicalconcentration after a step change in simulatedtravel speed. The majority of this delay was due tothe transport delays associated with movement ofthe injected chemical through the mixing chamberand spray boom.Delay time for response of the injection pumpspeed was approximately 4 s, while the delay timeassociated with the injection controller wasslightly more than 1 s.The controller and injection modules of the RavenSCS-700 system responded quickly enough thatthey would be usable for variable-rate chemicalapplication.Chemical transport delays through the sprayerboom, inherent with any injection system, maycause significant areas of misapplication. The useof direct nozzle injection, where the raw chemicalis injected into the carrier at the nozzle body,should be considered to reduce the magnitude ofthese transport delays.
.
.
.
REFERENCESBode, L. E. and B. J. Butler. 1983. Spray characteristics of rotary
atomizers. In Proc. Pesticide Formu/ations and ApplicationSystems Second Conf., ed. K. G. Seymour,89-104.ASTM 1P795. Philadelphia, Pa.: Am. Soc. for Testing Materials.
Budwig, R. S., J. M. McDonald and T. J. Karsky. 1988.Evaluationof chemical injection systems for mobile agricultural sprayequipment. ASAE Paper No. 88-1592. St. Joseph, Mich.:ASAE.
348
Chi, L., R. L. Kushwaha and F. W. Bigsby. 1988. Chemical flowrate control in injection-type sprayers. Canadian Agric. Eng.30(1):19-26.
DiStefano III, J. J., A. R. Stubberud and I. J. Williams. 1967.Theory and Problems of Feedback and Control Systems.Schaum's Outline. New York: McGraw-Hill.
Freeman, M. H. 1990. 10 Ed. Optics. London, England:Butterworths.
Ghate, S. R. and S. C. Phatak. 1991. A compressed air directinjection pesticide sprayer. Applied Engineering in Agriculture7(2): 158-162.
Hughes, K. L. and A. R. Frost. 1985. A review of agriculturalspray metering. J. of Agric. Eng. Res. 32: 197-207.
Koo, Y. M., S. C. Young and D. K. Kuhlman. 1987. Flowcharacteristics of injected concentrates in spray booms. ASAEPaper No. 87-1602. St. Joseph, Mich.: ASAE.
Miller, M. S. and D. B. Smith. 1992. A direct nozzle injectioncontrolled rate spray boom. Transactions of the ASAE35(3):781-785.
Reichard, D. L. and T. L. Ladd. 1983. Pesticide injection andtransfer system for field sprayers. Transactions of the ASAE25(2):258-260.
Tompkins, F. D., K. D. Howard, C. R. Mote and R. S. Freeland.1990. Boom flow characteristics with direct chemical injection.Transactions of the ASAE 33(3):737-743.
Vidrine, C. G., C. E. Goering, C. L. Day, M. R. Gebhardt andD. B. Smith. 1975. A constant pesticide application rate sprayermodel. Transactions of the ASAE 18(3):439-443.
Way, T. R., K. Von Bargen, R. D. Grisso and L. L. Bashford. 1992.Simulation of chemical application accuracy for injectionsprayers. Transactions of the ASAE 35(4): 1141-1149.