Pensions in Europe A personal perspective on some important developments by Falco Valkenburg Independent Actuary Chairperson Pensions Committee of the Actuarial Association of Europe Member of the Occupational Pensions Stakeholder Group of the European Insurance and Occupational Pensions Authority FIAR PRIVATE PENSIONS Conference Poiana-Brasov, 24 May 2017
Transcript
Pensions in EuropeA personal perspective on some important developments
by Falco ValkenburgIndependent ActuaryChairperson Pensions Committee of the Actuarial Association of EuropeMember of the Occupational Pensions Stakeholder Group
of the European Insurance and Occupational Pensions Authority
FIAR PRIVATE PENSIONS ConferencePoiana-Brasov, 24 May 2017
2
Actuarial Association of Europe
Established in 1978 by 12 national associations Belgium, Denmark, France (2), Germany, Ireland, Italy (2), Luxembourg, Netherlands, UK (2)
Now representing over 22.000 actuaries in Europe Full Member Associations (32) Observer Member Associations (4)
Purpose advise European institutions on issues of actuarial interest provide a forum for discussion among actuarial associations in Europe promote high standards of education and professionalism further the education and professional development
“… contributing to the well-being of society …”
Agenda
1rst Pillar Pensions• Ageing Report of the European Commission
Some impactful developments
My personal perspective• Additional savings needed• Household’s needs comes first• Make savings relevant now!
Main sources: 2015 Ageing Report
424 pages Economic Projections
436 pages Assumptions/Methods
2015 Pension Adequacy Report 396 pages Volume I 373 pages Volume II
That is 1.629 pages in total
Our discussion paper provides a summary and additional actuarial considerations in only 48 pages
Total fertility rates 1960-2060 for selected EU member states
Point of convergence(level UK and Sweden)
Demographic background in EUMale expectation of life at 65 to 2060 in selected countries
2013 2020 2030 2040 2050 206014.0
15.0
16.0
17.0
18.0
19.0
20.0
21.0
22.0
23.0
24.0 FRESSEITUKIEDENLATBEPTDKSICZ
Demographic background in EUFemale expectation of life at 65 to 2060 in selected countries
2013 2020 2030 2040 2050 206017.0
18.0
19.0
20.0
21.0
22.0
23.0
24.0
25.0
26.0
27.0 FRESITFIATBESEDEIENLSIUKDKEEPL
Period and cohort expectations of life, UK, 2015
Males 2015 Females 2015
Period Cohort Period Cohort
60 22.7 25.9 25.3 28.3
65 18.7 21.3 21.0 23.6
70 14.9 16.9 16.9 19.0
75 11.4 12.9 13.1 14.7
80 8.4 9.4 9.7 10.7
Important to draw the distinction between period and cohortexpectations of life. Difference of about 2.6 years at age 65.However, cohort expectations often not published.
Projection of net migration flows2013-2060
Net migration flow in 2020 (000s)
Cumulative net migration 2013-
2060
Cumulative as % of 2013
population
LU 11.7 429.0 85.8
BE 80.2 3192.0 28.5
IT 348.1 15511.0 25.8
SE 55.3 2273.0 23.7
AT 51.3 1994.0 23.5
FI 22.0 812.0 15.0
UK 172.1 9162.0 14.3
ES -79.0 6511.0 14.0
DE 228.7 7041.0 8.7
FR 90.2 3960.0 6.0
RO 0.4 -35.0 -0.2
LV -14.3 -237.0 -11.9
LT -37.4 -605.0 -20.2
Demographic background in EU
Old-age dependency ratios in some countries, 2013 to 2060
2013 2020 2030 2040 2050 20600.0
10.0
20.0
30.0
40.0
50.0
60.0
70.0 PT
PL
DE
EE
ES
IT
RO
AT
CZ
NL
FI
FR
UK
DK
SE
BE
IE
Demographic background in EU
Old-age dependency ratios in some countries, 2013 to 2060Adjusted for retirement age rising from 65 to 70
2013 2020 2030 2040 2050 20600.0
10.0
20.0
30.0
40.0
50.0
60.0
70.0PT
DE
PL
SI
ES
IT
RO
AT
NL
EE
FR
FI
UK
SE
DK
BE
IE
Demographic background in EUPension age to maintain cohort expectation of life (UK)
Year Expectation of 21.6 for males
Expectation of 24.3 for females
2020 65.7 65.5
2030 67.0 66.7
2040 68.2 67.8
2050 69.3 69.0
2060 70.5 70.1
Over 50 yrs 1.2 per decade 1.1 per decade
Member states with largest populations 2013-2060
2013 (millions)
2060 (millions)
Increase
UK 64.1 80.2 +25.1%
France 65.7 75.6 +15.1%
Germany 81.4 70.9 ‒12.9%
Italy 60.2 66.3 +10.1%
Spain 46.6 46.2 ‒0.9%
Poland 38.6 33.3 ‒13.7%
Romania 20.0 17.4 ‒13.0%
Total EU 507.2 522.7 +3.1%
Change in population of working age 2013-2060
% %
Lithuania –47.8 France +4.7
Latvia –42.0 Denmark +6.2
Bulgaria –39.1 Cyprus +6.4
Greece –35.5 United Kingdom +11.5
Portugal –35.5 Finland +13.1
Poland –33.9 Sweden +24.8
Romania –28.5 Belgium +25.3
Total EU –11.6 Luxembourg +87.1
The 2015 Ageing ReportPublic pension expenditures in 2013 and 2060, % of GDP Country 2013 2060 Increase 2012 AR
Luxembourg 9.4 13.4 4.0 9.4
Slovenia 11.8 15.3 3.5 5.8
Belgium 11.8 15.1 3.3 5.2
Germany 10.0 12.7 2.7 2.6
Ireland 7.4 8.4 1.0 4.2
Netherlands 6.9 7.8 0.9 1.8
United Kingdom 7.7 8.4 0.7 1.5
Romania 8.2 8.1 –0.1 3.7
Italy 15.7 13.8 –1.9 ‒0.9
France 14.9 12.1 –2.8 0.5
Denmark 10.3 7.2 –3.1 ‒1.2
EU 11.3 11.2 –0.1 1.0
Reform measures undertaken or in progress
Major reform measures include> raising eligibility age for public pensions> reductions in pension accrual rates> career average instead of final salary> less generous indexation of pensions in payment> notional defined contribution structures> contribution increases
Analysis of pension cost changes
The Ageing Report analyses changes into
components:
> changes in dependency ratio> changes in coverage ratio> labour market effects> changes in benefit ratio
Change in Benefit Ratios 2013-2060
% %
Cyprus –32.5 Finland –6.7
Spain –25.3 Italy –6.4
Sweden –16.9 Germany –5.2
Latvia –16.2 Slovenia –5.0
Portugal –15.8 Ireland –3.1
Slovakia –15.6 Netherlands –1.1
Romania –14.5 United Kingdom –0.7
Greece –14.1 Luxembourg +0.5
Total EU (weighted)
–8.1 Denmark +7.5
Benefit ratio is ratio of average pension to average wage.
Pension Adequacy Report 2015
DG Employment’s riposte to The Ageing Report 2015
> important to consider adequacy alongside sustainability> adequacy and also fairness> importance of wider considerations> …e.g. access to health care, housing> limitations of theoretical measures such as replacement ratios> need to look at many different facets
Striking comment in the 2015 Ageing Report:
Need for additional savings
• Are people willing to save?– Means sacrificing purchase power now– To build purchase power in retirement
• Tax incentives?• Mandatory savings?
• Suggestion: Make savings relevant now
21
Australia
Example linking current themes(Energy) Savings resulting in additional (Pension) Savings
• Pension savings in The Netherlands: some 1.250 billion euro• If only 10% of the Members would be interested for only 1% of their money… (125 million euro)• Potential other areas: food, health care, housing, …
LocalCooperativ
es
LocalCooperativ
es
Member Communit
y
Member Communit
y
Community of CommunitiesCommunity of Communities
Community Platform
Exte
rnal S
erv
ic es Po
rt als
Exte
rnal S
erv
ic es Po
rt als
• We could benefit individually• We could benefit collectively• We could change society
Empowering the membersfrom pension communication to informing on all income and all spending
Approximately but relevant instead of
exact but irrelevant
• 3 easy steps to arrive at this chart
• Using already available data
• PSD2 will further boost the relevancy of information
27
Newsflash:
Foxconn has a factory for 20,000 workers building 1,000,000 robots that make 500,000 workers unneccessary
Pension
Health
Housing
28
My Charcoal Sketch
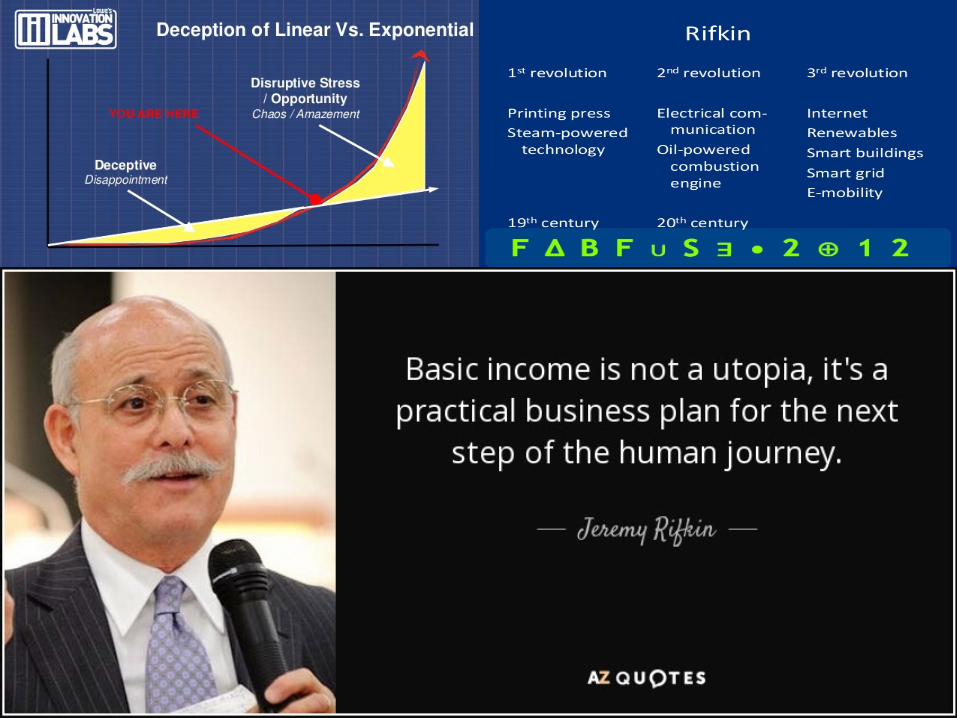
1rst Pillar: BASIC INCOME
• Solidarity with the weaker civilized society• Reasonable level (political decision)
My Charcoal Sketch
2nd/3rd Pillar (combined, no difference):
• Individual savings, collectively managed
• Multiple goals (such as education, child care, start of own business, mortgage repayment, pension, health care)
• Encore!– A National (or even European) Program for your 2nd, 3rd or 4th career– including Test-Driving your Dream Job
Making pension savings relevant now
I see a very relevant role for innovative insurers and pension funds
My Charcoal Sketch
BASIC INCOME+
Individual savings (collectively managed)+
ENCORE! – programme
“Creating a Life & Work You Love and Never want to Retire from”


![Cap. 173] Pensions CHAPTER 173. PENSIONS. 173.pdf · Pensions, etc., to cease on bankruptcy. 14. Pensions, etc., may cease on sentence to term of imprisonment. 15. Pensions, etc.,](https://static.documents.pub/doc/80x56/5f32c41fe2aa25713c052446/cap-173-pensions-chapter-173-173pdf-pensions-etc-to-cease-on-bankruptcy.jpg)


