31
POL 168 Chican@/Latin@ Politics Professor Jones Dept. of Political Science UC-Davis Winter 2008
| Date post: | 02-Jan-2016 |
| Category: |
Documents |
| Upload: | martina-nichols |
| View: | 30 times |
| Download: | 0 times |

POL 168 Chican@/Latin@ Politics
Professor JonesDept. of Political Science
UC-DavisWinter 2008

Images: Tancredo
• http://www.youtube.com/watch?v=Zng6I74L5QY&feature=related
• http://www.youtube.com/watch?v=rBK7bWh1m04&NR=1
• http://www.youtube.com/profile?user=TeamTancredo
Discussion
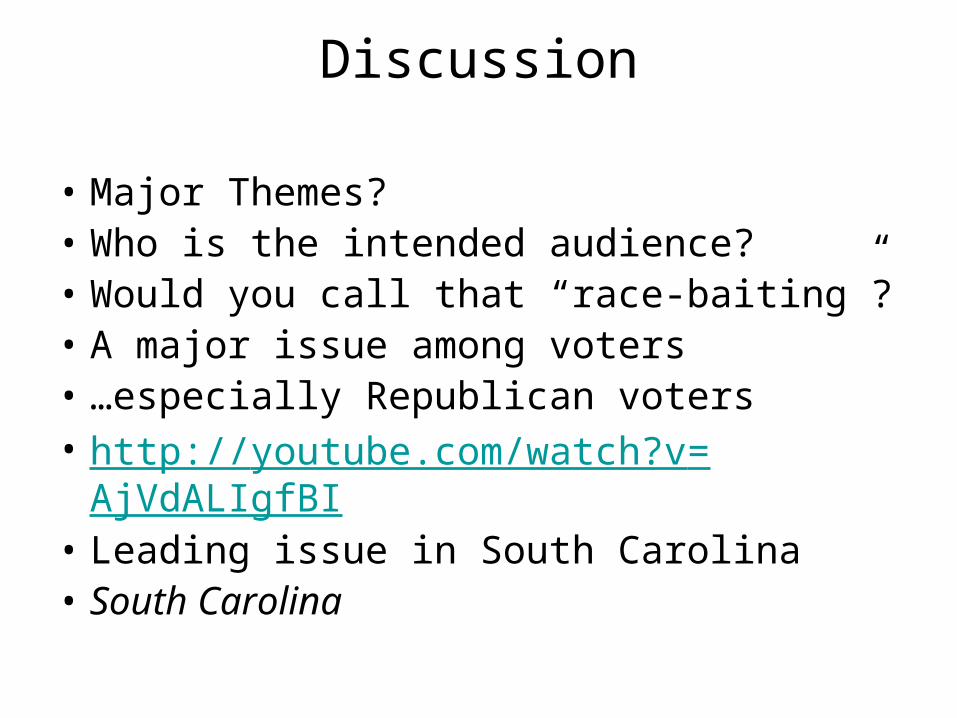
• Major Themes? • Who is the intended audience? • Would you call that “race-baiting”? • A major issue among voters• …especially Republican voters• http://youtube.com/watch?v=AjVdALIgfBI• Leading issue in South Carolina• South Carolina

Census Data…
• South Carolina
• http://www.censusscope.org/us/s45/chart_race.html

Who are “Latinos”?
• What counts as “Latino”…as “Hispanic”• The problem of “Spanish Origin” • 22 Countries satisfy this condition• Is it fair to say that anyone from one of these 22
countries is “just like” anyone from another of these 22 countries.
• How should we view “Latinos”• A bloc? Monolithic interests? • Pan-ethnicity vs. Groups
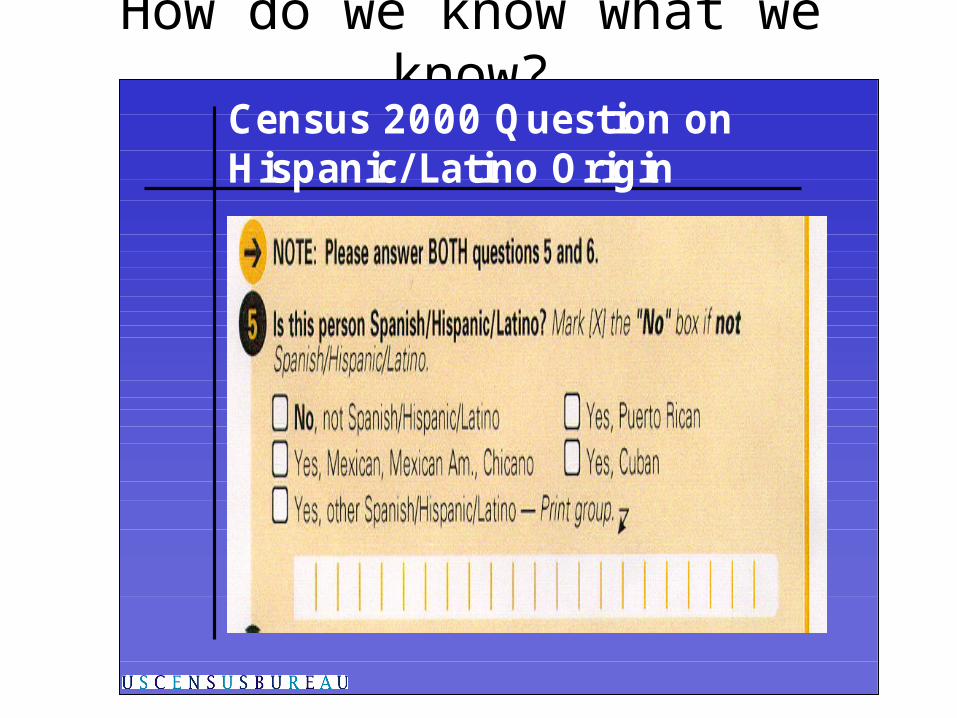
How do we know what we know?Census 2000 Question on Hispanic/ Latino Origin
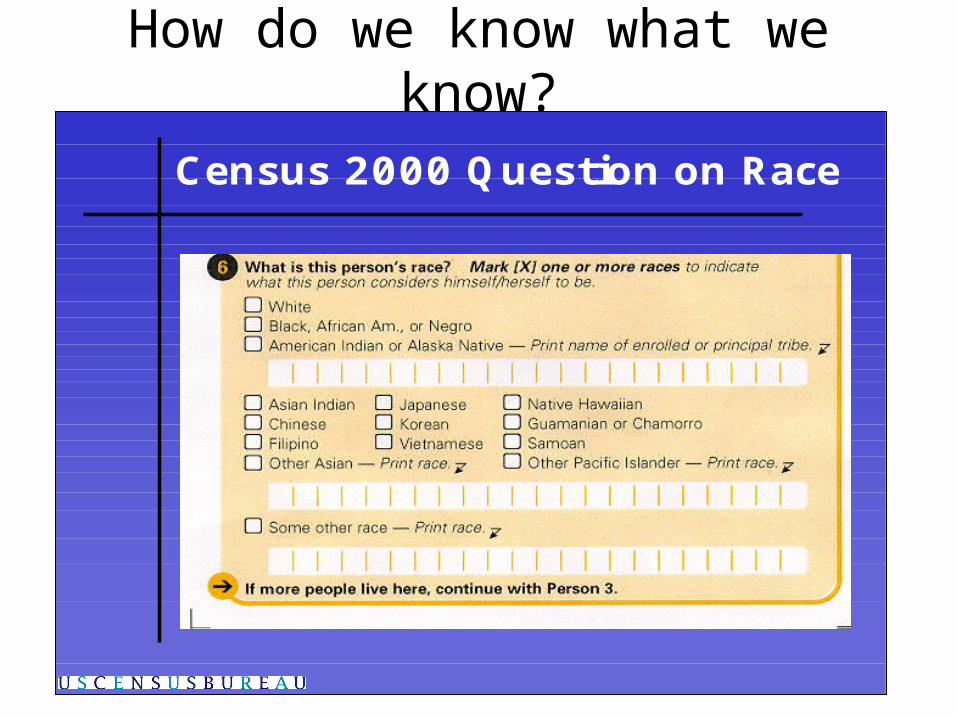
How do we know what we know?
Census 2000 Question on Race

Hispanic Population by Race: 2000
Race Number PercentTotal 35,305,818
One race 33,081,736 93.7White 16,907,852 47.9Black or African
American 710,353 2.0American Indian &
Alaska Native 407,073 1.2Asian 119,829 0.3Native Hawaiian &
Other Pacific Islander 45,326 0.1Some other race 14,891,303 42.2
Two or more races 2,224,082 6.3
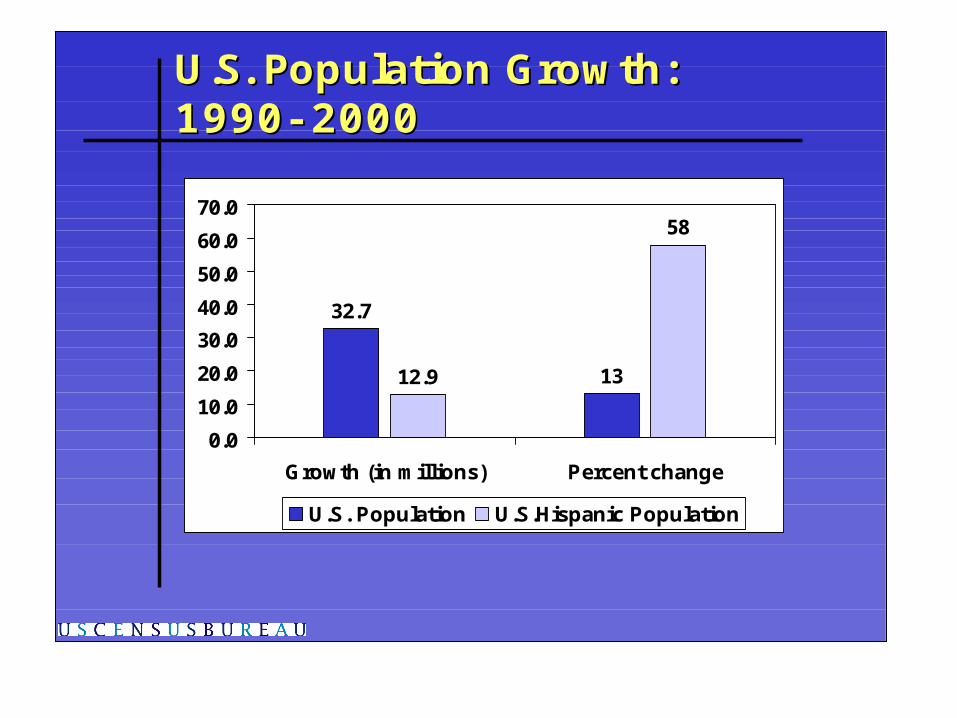
U.S. Population Growth: U.S. Population Growth: 19901990-- 20002000
32.7
1312.9
58
0.0
10.0
20.0
30.0
40.0
50.0
60.0
70.0
Growth (in millions) Percent change
U.S. Population U.S.Hispanic Population

Census 2000: Top 10 States By Census 2000: Top 10 States By Percent HispanicPercent Hispanic
12.3
13.3
15.1
16.8
17.1
19.7
25.3
32.0
32.4
42.1
Percent of total population
New MexicoCaliforniaTexasArizonaNevadaColoradoFloridaNew YorkNew JerseyIllinois

Census 2000: Top 10 States By Census 2000: Top 10 States By Hispanic Percent ChangeHispanic Percent Change
155
166
173
208
211
217
278
300
337
394
Percent change
N. CarolinaArkansasGeorgiaTennesseeNevadaS. CarolinaAlabamaKentuckyMinnesotaNebraska

Who are “Latinos”?
• Where are “Latinos” from?
• “Border Invasion”
• Implies the population is largely of Mexican descent.
• In fact, it is…
• However, substantial populations exist from Central and Latin American nations.
• Some Data

Percent Distribution of the Percent Distribution of the Hispanic Population by Type: 2000Hispanic Population by Type: 2000
Puerto Rican
Cuban
Mexican
All OtherHispanicCentral American
Spaniard
South American

Hispanic Population by Hispanic Population by Type: 2000Type: 2000
Central American 1,686,937Costa Rican 68,588
Guatemalan 372,487
Honduran 217,569
Nicaraguan 177,684
Panamanian 91,723
Salvadoran 655,165
Other Central American 103,721
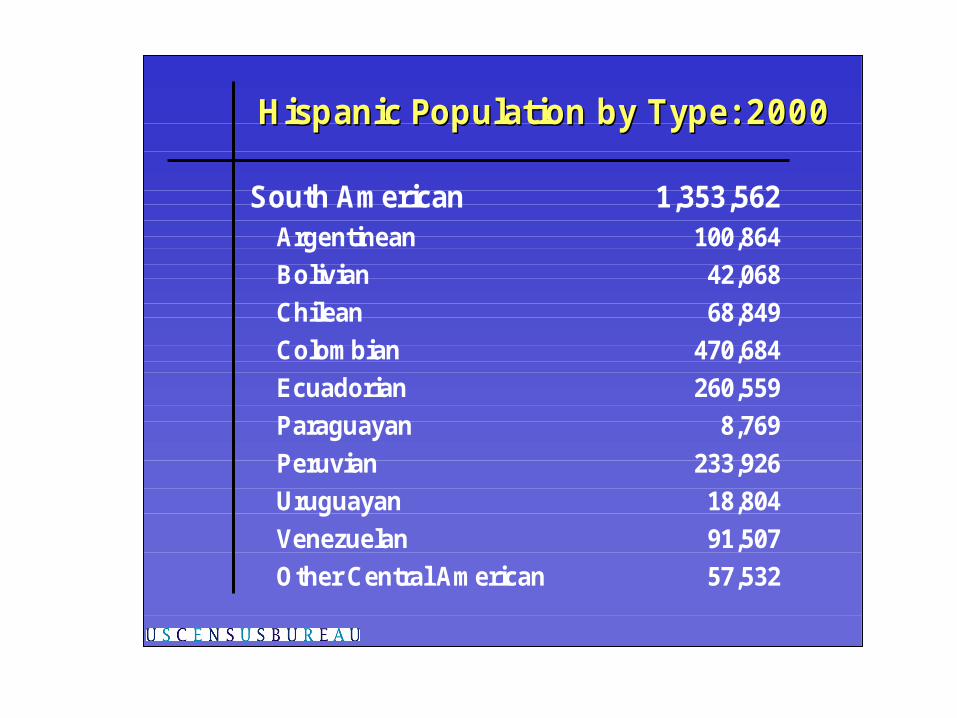
Hispanic Population by Type: 2000Hispanic Population by Type: 2000
South American 1,353,562Argentinean 100,864
Bolivian 42,068
Chilean 68,849
Colombian 470,684
Ecuadorian 260,559
Paraguayan 8,769
Peruvian 233,926
Uruguayan 18,804
Venezuelan 91,507
Other Central American 57,532

Current Estimates and Projections
• U.S. Population will be “majority-minority” by about 2050.
• Largest growth rate among minority populations are “Hispanic origin”
• Remember, we’re tied to Census definitions here.
• What will it mean to be a “minority” in the future? • “Minority” status becoming more and more
awkward in some local settings.

Ten Places with Highest Percent Ten Places with Highest Percent Hispanic: 2000Hispanic: 2000
East Los Angeles, CA 97%Laredo, TX 94%Brownsville, TX 91%Hialeah, FL 90%McAllen, TX 80%El Paso, TX 77%Santa Ana, CA 76%El Monte, CA 72%Oxnard, CA 66%Miami, Fl 66%

Predicted Population of US
0.0
10.0
20.0
30.0
40.0
50.0
60.0
70.0
80.0
90.0
2000 2010 2020 2030 2040 2050
Year
Per
cen
t o
f T
ota
l P
op
.
White Alone Black Alone Asian Alone
Hispanic (of any race) White, non-Hispanic All other races
Population Estimates: US Census Bureau

More Clips for Thought
• Anti-McCain Attack Ad: http://www.youtube.com/watch?v=vs6wwg_ie6Y
• Anti-McCain Attack Ad Part II: http://www.youtube.com/watch?v=WmhaypWwFPY
• Ron Paul: http://www.youtube.com/watch?v=2T-iJKwskH4
• Rudy Giuliani Attack Ad: http://www.youtube.com/watch?v=XfsHe8zg9o4
• Bi-Partisan Attack Ad: http://www.youtube.com/watch?v=Qiw85f5fYGY
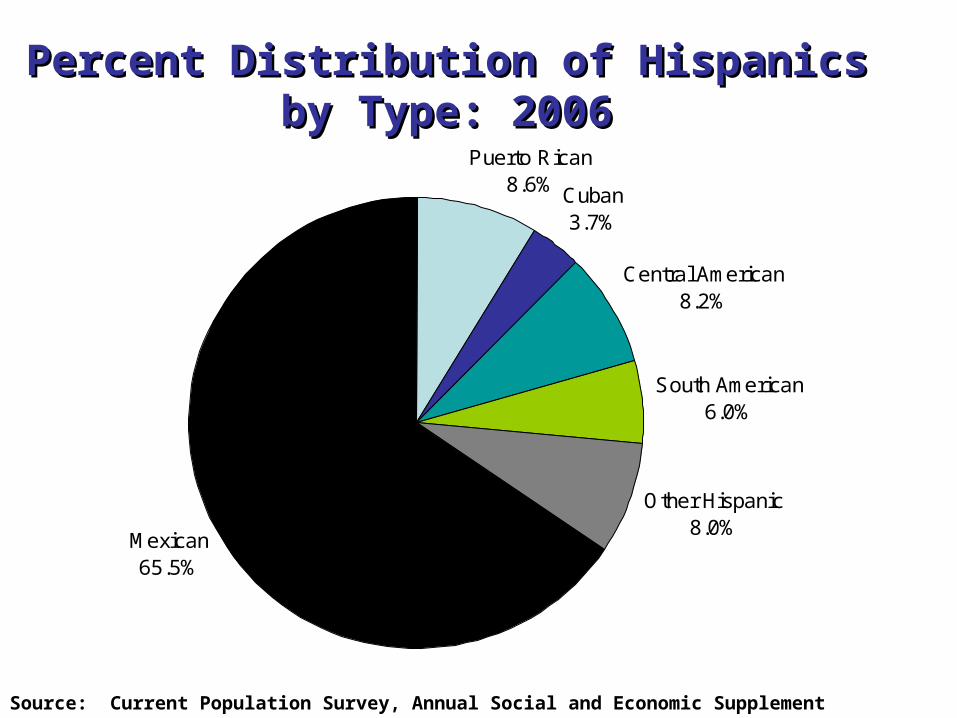
Percent Distribution of HispanicsPercent Distribution of Hispanicsby Type: 2006by Type: 2006
Source: Current Population Survey, Annual Social and Economic Supplement 2006
Puerto Rican8.6% Cuban
3.7%
Central American8.2%
South American6.0%
Other Hispanic8.0%
Mexican65.5%

Hispanic Population by Type: 2006Hispanic Population by Type: 2006
43.2
28.3
3.71.6
3.5 2.6 3.4
Hispanic Mexican PuertoRico
Cuban CentralAmerican
SouthAmerican
OtherHispanic
Mill
ion
s
Source: Current Population Survey, Annual Social and Economic Supplement 2006

Nativity by Type of Hispanic Origin: 2006Nativity by Type of Hispanic Origin: 2006
87.9
60.1
31.3
68.4
0.6
61.868.8
31.238.2
99.4
61.4
31.638.6
68.7
39.9
12.1
Total Hispanic Mexican PuertoRican
Cuban CentralAmerican
SouthAmerican
OtherHispanic
Per
cent
Native Foreign Born
Source: Current Population Survey, Annual Social and Economic Supplement 2006
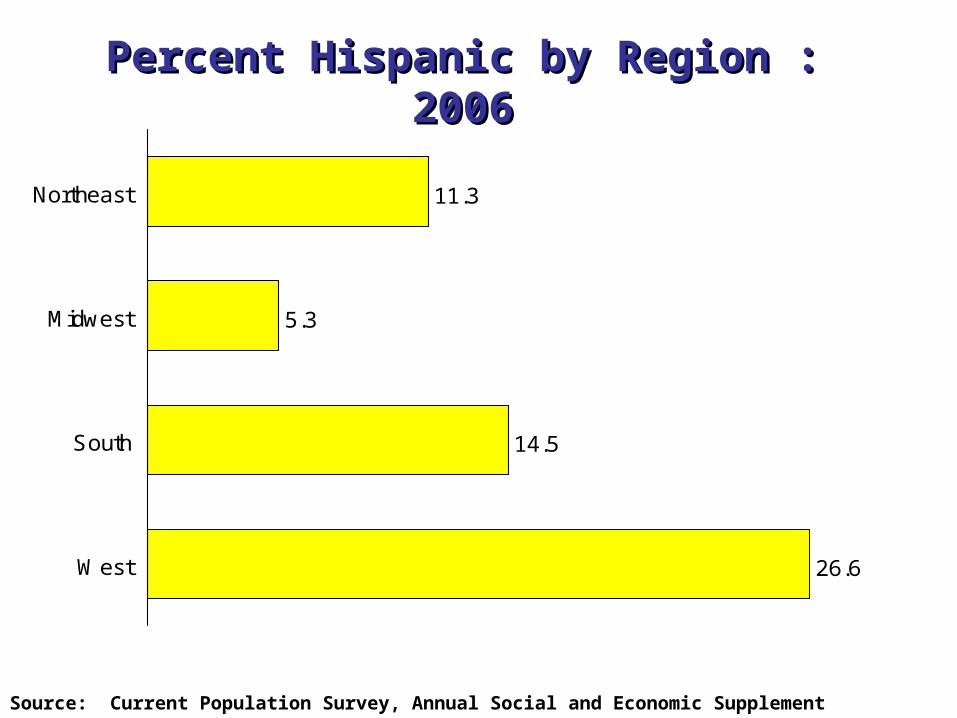
Percent Hispanic by Region : 2006Percent Hispanic by Region : 2006
Source: Current Population Survey, Annual Social and Economic Supplement 2006
26.6
14.5
5.3
11.3
West
South
Midwest
Northeast

Clips for Thought
• Humorous Clip (not meaning to pick on the President!)
• http://www.youtube.com/watch?v=sBskbZ9Pl6A
• Manassas Controversy
• http://www.youtube.com/watch?v=_9rnC9UZhV0&feature=related
Some Data
• Let’s take a look at population change:
• http://www.censusscope.org/us/map_hispanicpop.html
• Occupation Characteristics (Pew Report)
• http://pewhispanic.org/files/reports/59.pdf
• Another site (NDN; has a political agenda)
• http://www.ndn.org/hispanic/hispanics-rising.pdf
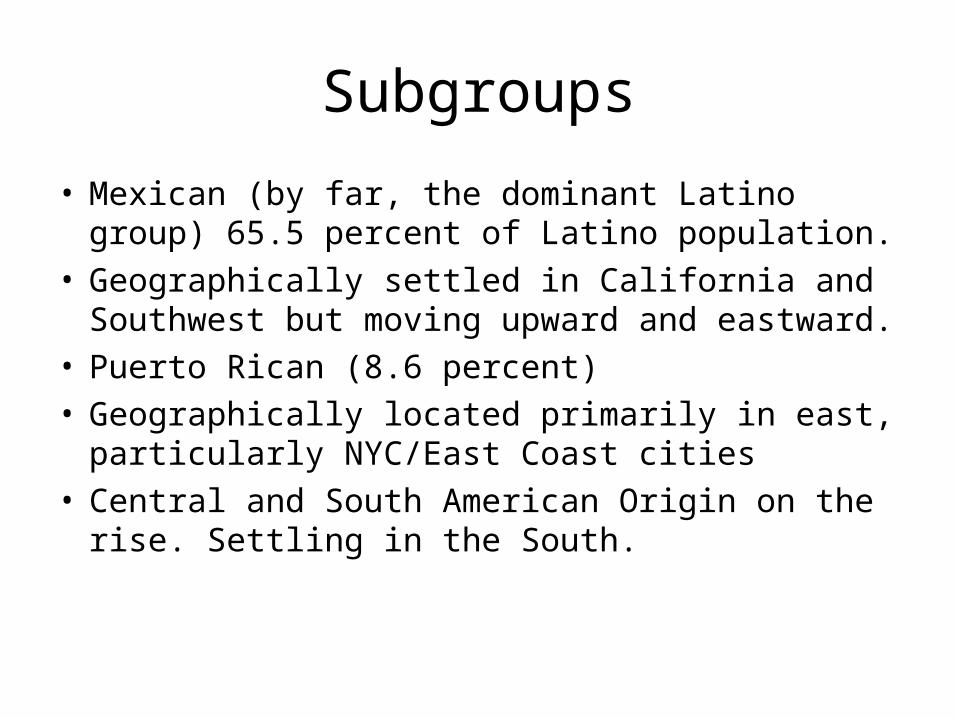
Subgroups
• Mexican (by far, the dominant Latino group) 65.5 percent of Latino population.
• Geographically settled in California and Southwest but moving upward and eastward.
• Puerto Rican (8.6 percent)• Geographically located primarily in east,
particularly NYC/East Coast cities• Central and South American Origin on the rise.
Settling in the South.
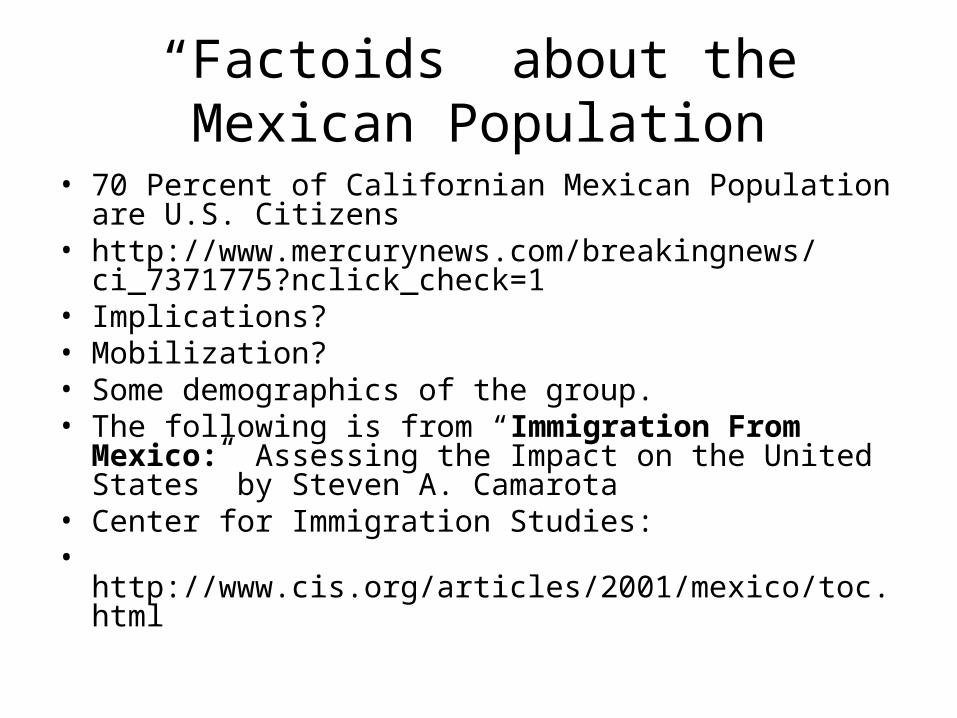
“Factoids” about the Mexican Population
• 70 Percent of Californian Mexican Population are U.S. Citizens
• http://www.mercurynews.com/breakingnews/ci_7371775?nclick_check=1
• Implications? • Mobilization? • Some demographics of the group.• The following is from “Immigration From Mexico:
Assessing the Impact on the United States” by Steven A. Camarota
• Center for Immigration Studies:• http://www.cis.org/articles/2001/mexico/toc.html

Data from Center for Imm. Studies

Data from Center for Imm. Studies: Education

Data from Center for Imm. Studies: Labor

Data from Center for Imm. Studies: SES


