40
POLICY DISCUSSION PAPER NUMBER 8 Submission by the Department of Social Security to the Financial System Inquiry KEN OLIVER AND TONY MORGAN STRATEGIC PLANNING DIVISION FEBRUARY 1998
| Date post: | 18-Mar-2018 |
| Category: |
Documents |
| Upload: | nguyennguyet |
| View: | 213 times |
| Download: | 1 times |

POLICY DISCUSSION PAPER NUMBER 8
Submission by the Department of Social Security to the Financial System Inquiry
KEN OLIVER AND TONY MORGANSTRATEGIC PLANNING DIVISION
FEBRUARY 1998

Department of Social SecurityPOLICY DISCUSSION PAPER NO. 8
SUBMISSION BYTHE DEPARTMENT OF SOCIAL SECURITY
TO THE FINANCIAL SYSTEM INQUIRY
Ken Oliver and Tony MorganStrategic Planning Division
February 1998

Commonwealth of Australia 1997
ISBN 0 642 266581
This work is copyright. Apart from any use as permitted under the Copyright Act 1968, no part may bereproduced by any process without prior written permission of the Australian Government PublishingService. Requests and inquiries concerning the reproduction and rights should be addressed to theManager, Commonwealth Information Services, Australian Government Publishing Service, GPO Box84, Canberra ACT 2601.
This report was prepared by Ken Oliver of the Strategic Planning Division of the Department of SocialSecurity.
The opinions expressed in this paper cannot be taken in any way as expressions of government policy.
Produced by the Commonwealth Department of Social Security.

PREFACE
The Financial System Inquiry is charged with, among other things, 'examining and reporting on ... thechoice, quality and costs of financial services available to consumers and other users' (Terms ofReference). This submission deals with the impact of financial deregulation on choice, quality and costsfor two groups of consumers:
• the disadvantaged in the community, especially the customers of the Department of Social Security;and
• users of housing finance.
It concentrates mainly, therefore, on retail banking, particularly small-transaction services and housingfinance. Financial issues that are of interest to DSS but are peripheral to the Financial Services Inquiry,such as retirement-income arrangements, are not dealt with except as they impinge on these.
This submission, therefore, has two parts:
• banking services for low-income people and rural Australia; and
• deregulation of financial services and the housing market.

TABLE OF CONTENTS
1. Banking services and DSS customers .....................................................................................1Background issues ...........................................................................................................1
Use of financial institutions by DSS customers .........................................................1Regulation and deregulation of financial services......................................................1
Banking services for those on low incomes......................................................................2A basic banking product ...........................................................................................3The user pays principle .............................................................................................3The social obligations of banks .................................................................................5The Prices Surveillance Authority Inquiry.................................................................6
Providing financial services to rural Australia ..................................................................7DSS payments to rural Australia ...............................................................................7Wider implications of bank closures..........................................................................8
2. Financial market competition and the impact on housing...................................................11Introduction ...................................................................................................................11The Australian housing system ......................................................................................12
Economic and institutional framework....................................................................12Social factors ..........................................................................................................13Demographic factors...............................................................................................13Access to and affordability of home ownership .......................................................14The development of superannuation........................................................................15
Competitive developments in the housing finance market ..............................................15Impact of securitised lending on housing loan interest rates ....................................16Prospective investment by super funds in mortgage-backed securities.....................18Significance of mortgage-backed securities as housing finance ...............................18Benefits of competition for the housing sector and for borrowers/buyers.................20Uniform Consumer Credit Code (UCCC)................................................................21Other regulatory issues............................................................................................22
Attachment AThe Australian housing system ......................................................................................23Housing wealth..............................................................................................................26Impact of the institutional framework ............................................................................27
Private rental...........................................................................................................28Public housing ........................................................................................................28Home ownership.....................................................................................................29Direct assistance .....................................................................................................29Other support ..........................................................................................................29Housing supply .......................................................................................................30
Attachment BAsset composition of superannuation funds....................................................................32
Attachment CSecuritisation .................................................................................................................33
FIGURES
1. Housing in Australia by Type of Tenure.....................................................................................122. Comparison of Housing Affordability to Home Loan Interest Rates ..........................................143. Income Required to Afford Home Ownership (80 per cent of Median Price)
Based on 10 per cent Deposit at Variable Interest Rates by Capital Cities..................................154. Competition from Mortgage Securitisation Industry Average Interest
Rates (per cent) .........................................................................................................................165. Estimated Cost Structure of Issuing Mortgage-backed Securities...............................................176. Housing Finance by Lender Type As Percentage of Total Secured Housing
Finance Commitments 1995-96.................................................................................................197. Growth of Lending Share by Mortgage Managers .....................................................................20
Attachment A1. Housing in Australia by Type of Tenure................................................................................. 232. Structure of the Australian Housing System............................................................................ 233. Housing Tenure by Age of Household Head, 1994 ................................................................. 244. Housing System by Family Type (per cent) ............................................................................ 255. Home Ownership as Percentage of all Tenure Types by States and Territories........................ 256. Nominal Private Sector Wealth by Asset Classes.................................................................... 267. Real House Price Index by Capital City, 1986-1996 ............................................................... 278. Annual Service Flow Subsidies by Tenure by Household Income Quintiles
Australia, 1990-1991 ($ per household) .................................................................................. 289. Comparison of Income Required to Purchase a Median Priced House by
Private Lender and State HPA Authorities.............................................................................. 2910. Value and Number of Secured Housing Commitments ........................................................... 3011. Estimate of Oversupply of Dwellings ..................................................................................... 31
Attachment B1. Total Assets of Superannuation Funds and Approved Deposit Funds:
Distribution by Asset Classes (per cent) ................................................................................. 32
Attachment C1. Simplified Securitisation Funding/Lending Structure ............................................................. 34
1
1. BANKING SERVICES AND DSS CUSTOMERS
Background Issues
Use of financial institutions by DSS customers
The Department of Social Security has a major involvement with the retail banks; we make about sevenmillion payments, to a total value of $1.2 billion dollars, each fortnight into banks and other financialinstitutions. About 92 per cent (by dollar value) of these payments are made directly into bank accounts;about 4 per cent each into building societies and credit unions, and less than 1 per cent by cheque directlyto customers. Of the major banks, the Commonwealth seems to still have the major share -about 35 percent of all DSS payments are made through it (about 57 per cent of pension payments, 15 per cent offamilies payments and 60 per cent of NSA/JSA (unemployment) payments). Westpac processes 13 percent, NAB 9.5 per cent and the ANZ 9 per cent. Funds from the Reserve Bank to cover DSS paymentsare credited to banks a day in arrears, a day's interest added to cover the delay. Although some of thismoney is probably spent in short order, it is reasonable to assume that institutions have access to much ofit for lending.
Research indicates that about 1.6 million age pensioners have about $17 billion deposited in all forms ofbank accounts. Information has not been extracted on other pensioners or recipients of unemploymentand families payments, but it is likely that they too hold significant amounts. DSS customers are,therefore, important bank customers.
Regulation and deregulation of financial services
Regulation of financial services falls under three headings:
. prudential regulation;
. regulation of market structures; and
. direct regulation of market behaviour (consumer protection).
Prudential regulation is outside this submission's scope and, beyond noting that ensuring reasonablecompetitive neutrality in this area between differing financial institutions will help in the development ofcompetitive markets, we do not deal with it here.
Regulation of market structures, too, is largely outside this submission's ambit-although such regulation isintended ultimately to protect consumers by maintaining the discipline of competition, the influence isindirect.
We would note, however, that there is an important flaw in the widely held view that there is little riskthat bank mergers will result in market dominance because the banks hold a diminishing share of nationalsavings. The great majority of Australians use banks not only, or even mainly, for savings but as vehiclesfor routine financial transactions. It is not clear that consumers' interests would be served by permittingan oligopoly in the market for small financial transactions. That market, whatever the recommendationsof this inquiry, is likely to

2
be dominated by banks for the foreseeable future because of their extensive infrastructure.
Linked with this matter of market structure there are elements regarding consumer interests and marketbehaviour.
Market behaviour: Deregulation and technological change have allowed financial-service providers,including the retail banking industry, to increase vastly both the range and complexity of their products-deregulation's substantial direct benefit to consumers. Certainly the retail banks' ability to maintain veryhealthy operating margins throughout the business cycle suggests that there has been such demand forthese new services that price competition in some of them is less intense than it might have been.
Although the variety of services on offer is a considerable improvement on the situation beforederegulation, many ordinary Australians are not well equipped to weigh the full costs and benefits ofcompeting, complex bank products; there are important and increasing information asymmetries.Although there are circumstances in which institutions might have little market incentive to make cleartheir full costs to potential customers, there is in principle a continuing case to ensure that customers canget the necessary information to make informed choices.
In our view, there is a case for information to be made available in simple standardised forms to users ofbasic banking services. Feedback from our payees suggests that many of them discover the level andstructure of account fees only after they have been deducted from their very limited balances and,furthermore, are unable to compare them easily with those that would be charged by another bank. Thisis of particular concern because the Social Security Act dictates that almost all payments be made bydirect credit, thereby requiring our customers to use bank or other retail accounts.
Improvements in technology have vastly reduced the costs to banks and inconvenience to customers ofmost retail transactions, the incidence of which has increased enormously as a result. It has made iteasier, too, for the banks to impose direct transaction fees rather than subsume the costs in their interest-rate margins. This is a much more efficient approach to pricing services, but it does create two concerns:
• Those who are neither substantial borrowers from nor lenders to the banks will not recoup the costof the fees through reduced interest-rate margins; they lose unambiguously from the move to directfees. Many Social Security customers would be in this category.
• Some fees seem to be much more than the actual cost of the transaction; they are intended tostrengthen the market position of the bank concerned. An example is the substantial fees chargedby some banks for withdrawals made through other banks' ATMs.
Banking services for those on low incomes
In November 1991, the House of Representatives Standing Committee on Finance and PublicAdministration handed down the Martin Report' on banking and deregulation, which
1. Martin, Stephen 1991, Report of the House of Representatives Standing Committee on Finance andPublic Administration

3
contained two recommendations-of particular significance to DSS clients-concerning a code of bankingpractice and a basic banking product.
In recommendation 76, the Committee proposed that a code be drawn up through a process ofconsultation. The Code, now operational, sets out general principles governing fair banking operationsand a self-regulatory framework for resolving disputes. To that extent it is of value to all bank clients.
However, it does not address the specific problems of DSS payment recipients and other low-incomecustomers, and could be extended to cover rights of access to basic banking services, including accounts.
A 'Basic banking product'
Recommendation 101 of the Martin Report was:
'That retail banks and the Department of Social Security jointly investigate the feasibility of developing abasic banking product. The product should be offered by all retail banks, should allow for a set numberof free withdrawals each week and should be targeted to the needs of low income Australians.'2
DSS responded by seeking discussions with one of the major banks, but the response made it clear thatindividual banks are reluctant to increase their share of DSS-customer clients because attracting too manyof them would place them at a competitive disadvantage in attracting more profitable customers. Thisfear might be as important as any direct cost of concessions in banks' reluctance to accommodate therecommendation. If so, it might be necessary for the Government, the Australian Bankers' Associationand the representatives of non-banking financial institutions (NBFIS) to negotiate an agreement on acommon approach.
Banks and other financial institutions do offer some basic banking services- accounts for which chargesare relatively low if usage is minimal-but the prospect of their being maintained as cost pressures increaseis not clear.
Two matters that need to be taken into account in assessing the viability of proposals for a basic bankingproduct are:
• the user-pays principle as it applies to social-security and low-income clients;
• the notion that banks should be considered to have a social obligation to provide accounts at modestcost in circumstances in which commercial considerations dictate larger charges.
The 'user-pays principle'
The Martin Committee observed (at para 7.1) that:
'The term 'user pays' refers to the general practice of charging consumers in such a way
2. ibid.

4
that the prices they face reflect the costs of providing the goods or services. The philosophy of user paysis not an end in itself but is held to lead to desirable consequences. It avoids (often arbitrary) crosssubsidies. It also increases overall economic efficiency as clients face appropriate price signals ratherthan being encouraged to overconsume some apparently 'free' services and underconsume others.’3
In considering the application of this principle to low-income clients, it is useful to examine what itmeans in a little more detail. Strictly, it could be taken to mean that each individual service is charged atits cost, with or without a profit margin. In this sense, it is a practice from which banks and otherbusinesses commonly depart on commercial grounds. Cross-subsidisation within a bank's dealings withan individual client is widespread and is reflected in the apparently increasing practice of reducingaccount-keeping fees and transaction charges to clients with large deposits or loans. In this context thepoint is that, over all, the user pays.
DSS notes, having regard to the claimed benefits of 'user pays' in encouraging appropriate behaviour bythe users of services, that the current charging regime-with its multiplicity of charges and cross-subsidiesfor clients who have loans or investments with banks-might not in fact provide clear incentives forappropriate behaviour. Customers cannot understand clearly the costs of their usage patterns, andconcessions for wealthier clients might encourage over-use of services.
Banks seem sometimes to take the long view in assessing their capacity to profit from individual clients,as witness in the availability of low-charge accounts for young people and the competition for thebusiness of first-year university students. It is seen as worthwhile to cross-subsidise the user for anextended period because he or she may be a source of profit in future.
Some of the cross-subsidisation that would be required to reduce charges to low-income customers seemsconsistent, therefore, with existing commercial practice. About 5.3 million DSS customers-about 30 percent of the Australian population-receive income support. Over their lifetimes many of these people willbe net contributors to bank profits. The time at which that profit is made might be the present (e.g.,pensioners who have substantial asset holdings with banks); the future (younger unemployed people,those of any age temporarily out of work, or family-payment clients); or in the past (age-pensionrecipients who do not have substantial assets).
In the first and second cases, taking a long-term view is clearly consistent with the user-pays principleand sound commercial practice generally. It would be poor practice for banks to govern their dealingswith social-security clients on the premise that they represent either a small or a permanentlydisadvantaged group.
In the third case, there is still some argument for cross-subsidisation on commercial grounds. It might notbe good public relations to be seen (correctly or not) to be discriminating against older clients, and goodreputation might be a quantifiable commercial asset to banks in their dealings with the next generation.
3. Martin op. cit.
5
This point is capable of more general application. Public criticism of banks concerning increases incharges or their alleged role in business or farm failures seems to imply that they are not to be judged inexactly the same way as other businesses. More prudent and ethical behaviour is expected of them and,although this can be explained partly in historical terms, deregulation and increasing competition mightnever entirely remove that expectation. Perhaps banks will always have difficulty in applying strictly apurely commercial principle like 'user pays'.
Whether or not banks want to cross-subsidise different groups, there is a quite separate question: whetherincreasing competition leaves them the capacity to operate as they have in the past. In particular, recentpublic comment suggests that increasing competition from boutique banks and other specialised financialinstitutions is attracting the more profitable business away from the retail banks, putting pressure on themargins in those areas.
It should be noted also that giving concessions to low-income earners does not require the abandonmentof the user-pays principle and its price signals. Over-use of services can be discouraged by restrictingcost concessions to accounts with limited usage and increasing charges steeply beyond that limit.However, it must still be recognised that in commercial dealings the user is the individual client and atany point in time there are clients on whose business banks make no profit and are unlikely to do so.Similarly, as far as older clients are concerned, pure gratitude for past profits is not a commercialconsideration. In relation to these groups, notions of a social contract or other obligation must beconsidered if it is to be argued that banks should make concessions that clearly reduce profits.
The social obligations of banks
The Martin Report recommended a basic banking facility after reviewing banks' place in society andcompeting views of their social obligations.
It noted that banks have access to the Reserve Bank's lender-of-last-resort facility and benefit, therefore,from a public perception that the Reserve Bank will intervene to prevent bank failure. Although thisperception is not perfectly accurate (there is ultimately no guarantee of bank deposits by the ReserveBank) any such perception is of commercial benefit to banks.
It was noted also that:
• new technology has resulted in people's moving increasingly away from cash transactions andtoward greater use of bank services and facilities;
• banks perform the essential social function of providing a 'safe haven' for funds; their fees andcharges have much more impact on economically disadvantaged people than on the general run ofbank clients;
• in other countries there have been some examples of banks' being obliged to provide services thatthey do not regard as profitable; for example, in many states in the United States there are rulesrequiring banks to open accounts for low-income consumers. The issue of charging has been raisedthere but somewhat inconclusively; non-bank financial institutions do have a role in ensuring accessto payment and financial systems generally
6
for low-income clients, but it is not clear, given banks' market dominance, why they could beexpected to take on this role completely.
Summarising opposing views on these issues, the Martin Report referred to submissions by consumerrepresentatives to the effect that banks are parties to a social contract in which, in return for a licence toperform an essential and profitable function, they should be obliged to provide community access tobanking on fair and equitable terms. The contrary view, put by bank representatives, was that banksshould charge for their services on the basis of the cost of providing them and that any necessarysubsidies of specific groups should be provided explicitly by governments, not cross-subsidisation bybanks' other clients.
The Committee's concluding recommendation of a basic banking product was based on the view that:
'... one of the payments which society should demand of banks for their privileges is to ensure thatall Australians can afford to deposit their savings and other funds in the safety of a bank.’4
To assess this line of argument it is appropriate to consider whether banks' social obligations should bedistinguished from those of other businesses. Banks are licensed and supported by government to providean essential service that virtually everyone must use. Their function is part of the Australian economy'sinfrastructure and similar to that of other regulated sectors of the economy, such as the electrical,telecommunications and airlines.
On similar grounds it is necessary to qualify the claim that cross-subsidisation involves an arbitraryrequirement that some clients subsidise (that is, if everyone is a bank client or shareholder, everyone isproviding the subsidy). The 'user-pays' principle needs qualification too, because banks themselvesdepart from it via a variety of charging regimes involving cross-subsidisation.
The Department's view is that banks and other financial institutions should continue to accept aresponsibility to give low-income clients access to services at reasonable cost and work with governmentto find ways to do so without unfair burdens on specific institutions and to educate low-income clients touse banking services economically.
The PSA Inquiry
In 1995 the Prices Surveillance Authority inquired into fees and charges imposed by banks and otherfinancial institutions, and recommended that institutions give priority to restructuring fees rather thanincreasing them, and seek to provide fee options for customers.
It made three recommendations that related to DSS's business;5 that:
• Consumer and welfare groups and DSS liaise with financial institutions on how best to satisfy theinformation needs of their clients and how the institutions can best help assist consumer and welfareorganisations give their clients effective advice;
4. Martin op. cit.5. Prices Survillance Authority 1995, Inquiry into fees and charges imposed on retail accounts by banksand other financial institutions and by retailers on AFTPOS transactions
7
• Consumer and welfare groups and DSS consider developing a computer-based system that whichcan correlate an individual's account-balance information and transaction patterns and generatecomparative costs across a selection of accounts;
• the Commonwealth Bank consult DSS on the feasibility of introducing the bank's 'GovernmentTransaction Account' or similar proposal.
The 'Government Transaction Account' has been superseded by the introduction of a basic bankingproduct by the major players in the financial industry. Development of a computer-based comparison hasnot proceeded because of its cost and the question of who would pay for it. In any case, DSS does not seeitself as the appropriate arm of government to assess the products of companies in a free market. Such acomparison could easily seem to promote one product over another, which could lay the Department opento accusations of partiality. However, DSS is already heavily involved in disseminating more generalinformation to customers and various third parties such as interest groups and financial planners, andwould be willing to disseminate an impartial and authoritative assessment, prepared by another body, ofservices to low-income clients.
The advantage of doing so is that it would not only improve the customers' knowledge of accounts onoffer but also improve competition between account providers. The PSA observed in its report that it wasalmost impossible for the average person to choose the best account-information on the various accountswas in the words of various advertising agencies. Customers' choice would be enhanced by mandatoryprovision of a standard set of figures or even form of words, as is required for many loan contracts andeven for the purchase of a mobile phone.
There is concern at the recent introduction of fees charged to customers who use rival institutions' ATMs.Apart from the possibility that such fees do not promote competition, they can disadvantage people onlow incomes who cannot afford to travel to other suburbs or towns to use their own organisations' ATMs.Both problems are aggravated in rural areas.
Providing Financial Services to Rural Australia
The move to more transparent pricing structures and the increasing pressure of competition has madebanks markedly less willing to provide 'unprofitable' rural services. Between June 1992 and June 1994the four major banks closed more than 500 branches, most in rural areas, resulting in large-scale loss ofservice to many rural Australians to the extent that DSS has had to explore other ways of deliveringpayments in some areas.
DSS payments in rural Australia
The whole topic of access to banking facilities in rural and remote areas is of great concern to DSS. Thelack of financial infrastructure in remote areas and its erosion in many others has made it difficult forsome DSS clients to get access to their payments. This has encouraged the growth of informal creditmechanisms, often to the serious disadvantage of DSS clients. In researching the policy options inresponse to these closures, the Department has examined the possibility of services provided by EFTPOSand Electronic Funds Transfer
8
Point of Banking (EFTPOB, which has been developed only by the Commonwealth Bank and is availablemainly at its post-office agencies). In its search for ways to transmit funds to rural and remotecommunities, DSS defined its basic model as a financial service that would provide facilities for:
• direct credit of DSS benefits and other payments;
• personal deposit; personal withdrawal; periodical payment (of rent, housing, electricity andcommunity charges);
• micro-lending; and
• Christmas Club-type savings.
Neither EFTPOS nor EFTPOB satisfies these requirements fully, and were seen as viable only as servicesof last resort for rural communities:
• EFTPOS allows only withdrawals and is vulnerable to transaction fees. The Retail Traders'Association of Australia has indicated recently that it would support the imposition of fees onEFTPOS transactions. In more remote communities in which a monopoly trader is the bank agent,the possibility of transaction fees that cannot be avoided is obviously heightened;
• EFTPOB is certainly more promising as it allows direct deposits, personal deposits andwithdrawals, but it is non-passbook, making it difficult for people of low literacy and/or of non-English speaking background (for example, Aboriginal people in remote communities) to keeptrack of their money.
One departmental response to this situation was to reach agreement with the Credit Union ServicesCorporation (Australia) Limited (CUSCAL) to provide development services for rural communitieswishing to develop community credit unions. Known as the Creditcare initiative, this provides financial-services infrastructure in some rural and remote areas.
Under the agreement, Creditcare staff help communities assess their financial-services needs and developthe most appropriate means of satisfying them. As a result some existing credit unions have expandedinto target communities, and work toward development of new community-based credit unions (whichoperate under state legislation, like all other credit unions) has increased.
The Creditcare Project began in July 1995, and ran until June 1997. Commonwealth funding of it is $1.6million over the two years, the NSW Government has added $205,000 for 1996-97 and CUSCAL itself isproviding $250,000 a year. To date, with the support of the project, established credit unions haveextended their services to 11 communities. Creditcare field staff are operating also with eight Aboriginaland Torres Strait Islander communities.
Wider implications of bank closures
DSS's concern for its clients' payments is only one consequence of the withdrawal of the banks from ruralAustralia. The closure of the last bank branch in a country town has a flow-

9
on effect on the local economy extending far beyond the loss of tellers' jobs: other businesses in such atown often do not long survive it. This can only increase dependence on social security.
Although many affected areas have suffered long, slow population declines, improvements in technologyand user-pays policies ought to have markedly reduced both the absolute costs and the economies of scalein branch operations. It is therefore reasonable to ask whether some banks are not missing opportunitiesto build a market. It is possible that some of the closures have resulted from assessments of profitabilitybased on too short a time frame (the parts of Queensland and NSW that were recently drought-strickenseem to have suffered more from bank closures than some other areas) and also that perhaps insufficientattention has been paid to more innovative ways of making these services profitable.

10

11
PART 2. FINANCIAL MARKET COMPETITION AND THE IMPACT ON HOUSING
Introduction
This chapter of the submission to the Wallis inquiry flows directly from the Mission of the Inquiry in theTerms of Reference and in particular that:
'Recommendations will be made on the nature of regulatory arrangements that will best ensure anefficient, responsive, competitive and flexible financial system to underpin stronger economicperformance consistent with financial stability, prudence, integrity and fairness.’6
The Government has outlined a commitment to restoring home ownership as a real choice. This is at thecore of its housing policy, which is to ensure that access to appropriate, affordable and secure housingremains the right of all Australians. Key elements of the strategy to maintain access and affordability arethe Government's macroeconomic policies and microeconomic-reform policies, including the continuedpursuit of a balanced and competitive financial system. Both will help keep pressure off interest rates, amajor determinant of mortgage-repayment levels for home-buyers and those, particularly in lower incomegroups, contemplating entering home ownership. Ensuring a competitive financial sector, too, will helpavailability of private-sector housing-loan products designed to accommodate individual circumstances.
Reflecting this, our concentration is on financial-market competition and the relationship betweenhousing and the development of mortgage-backed securities to fund lending that facilitates access tohome ownership. To make clear the impact of financial-market deregulation on competition for housingfinance, the housing system and its complexities are first outlined. The effect of this competition on theflow of benefits to the home-ownership sector generally, and lower-income households aspiring to homeownership, is then discussed.
This chapter contains a brief overview of the Australian housing system, home ownership in particular,and the effects on them of the economic, social and demographic changes in Australia. It deals with thesignificance of superannuation in the over-all flow of household savings and its implications for fundinghome purchase. It covers the growth of mortgage-backed securities as a source of home-purchasefinance, including the impact of securitisation on the cost and availability of housing finance, and thefuture of securitisation, including influences on future fund flows for securitisation, the UniformConsumer Credit Code and other regulatory matters.
6. Wallis, S 1997, Financial Systems Inquiry

12
The Australian Housing System
Australians display a strong preference for home ownership. The proportion of households in owner-occupied housing, about 70 per cent since the early 1960s, is among the highest in the world. In 1994there were 6,677,900 households- 17.1 million people- in private dwellings in Australia. Of these 41.8per cent were home owners and 28.3 per cent buyers (Figure 1).
Economic and institutional framework
The performance of the Australian housing system is, in large measure, influenced by the institutionalframework within which it operates. It is a sophisticated system, and an integrated approach to housingpolicy is necessary to maintain its efficiency. At the Commonwealth level, the system's performance isinfluenced by monetary, taxation, retirement-income and savings policies, rent subsidies and foreign-investment guidelines, and at the state and local-government levels by land-taxation provisions, planningpolicies, residential-tenancy legislation and stamp duty and other access costs.
The performance of the housing system goes hand in hand with that of the economy, which is well-placed, in the low-interest-rate and low-inflation environment, for continued investment and sustainableeconomic growth.
Maintaining and strengthening its position as a globally competitive economy, Australia will have to keepreducing structural and regulatory impediments as it pursues economic growth. A basic requirement ofthis is increased flexibility in the management and the utilisation of the nation's resources.
Internationalisation, combined with greater emphasis on the benefits of market competition, has had aprofound effect on the housing sector. Deregulation of the financial sector has generated a radicallydifferent capital market for housing finance. Interest rates are generated on the basis of prevailingeconomic pressures rather than being underpinned by low-cost

13
borrowings and capped by government policies. Rationing of credit by lenders has been replaced bymarket-based tests of affordability as the price of credit, rather than institutional allocation processes,determines access to housing finance. Equally, housing investment is subject to a greater range ofinvestment options. These options include superannuation.
Social factors
The nation is experiencing also a number of significant social changes which affect the way Australianslive, work and invest. Some relate to the economic changes mentioned above, particularly employmentlevels, and the demographic changes discussed below. Others operate independently. Key factors haveincluded:
• the more effective participation of women in the workforce and the increased incidence of dual-income households;
• increased skill levels and higher levels of participation in secondary and post-secondary education;
• changes in family-formation patterns, including later marriage and child-bearing, reductions innumbers of children, and the increased proportion of sole-parent households; and
• trends to early retirement.
All of these have affected households' capacity to achieve home ownership and the means by which theyacquire housing.
Demographic factors
Australia's population is ageing. In 1995, over-65-year-olds represented 10.35 per cent of the population,but an increase to 23.3 per cent by 2031 is projected [ABS Catalogue No 3101.0].
This fundamental demographic trend is being reflected in changes in family composition. Between 1985and 1995 the size of the average family declined from 3.3 to 3. 1. The number of people over 15 wholived alone increased from 8.2 per cent to 10 per cent.
There was a similar trend in the proportion of families composed of a couple only-from 29.6 per cent to33.6 per cent-but that of families comprising couples with dependents declined from 46.7 per cent to 41.4per cent and, between 1988 and 1995, that of sole-parent families increased from 8 per cent to 9.7 percent. [ABS Catalogue No 4102.01.]
Given the relatively short time these changes have taken, the extent of change is dramatic, and there arestrong indications that the trends will continue, although in a more attenuated way.
Australia's population is also among the world's most mobile. Australians move house, on average, morethan 11 times in their lives [Newton and Bell 1996]. This high rate affects the housing system. Theabove factors are leading to substantial changes in the way Australians

14
acquire and 'consume' housing. The changes will become even more obvious and affect the demand forhousing, its location and form, cost and methods of financing.
Access to and affordability of home ownership
Affordability of home ownership is determined not only by households' ability to amass the requisitedeposit and pay legal and other costs and stamp duty, but also by their ability to maintain mortgagerepayments.
The above factors are dependent on a number of interrelated factors including the level and sustainabilityof income, property values, savings accumulation rates which can be affected by rent levels and othercalls on household income, access to loan funds, loan establishment costs and interest rates. Of these,income, interest rates and house prices are the key determinants of affordability.
There are several measures of home-ownership affordability, the Commonwealth Bank/ Housing IndustryAssociation Affordability Index being perhaps the most used. It measures affordability for an averagefirst-home buyer, using the ratio of average disposable income per household to the income necessary torepay a loan to buy a median-priced established dwelling. An increase in the ratio represents animprovement in affordability; a decline represents a deterioration. Figure 2 illustrates movements in theindex since June 1993. In particular, it shows that affordability has increased slightly since the December1994 quarter but is still less than in the December 1993 Quarter.
This Figure shows also variable interest rates offered by banks and building societies which were about10.5 per cent for most of 1995-96. The Commonwealth Bank's decision on 31 May 1996 and ANZ's on 3June to reduce their standard variable rates by 0.6 per cent to 9.9 per cent began interest-rate reductions,particularly among the primary lenders. After another recent round of reductions (after a 0.5 per centreduction in official rates in July) rates for standard variable-rate bank loans were commonly 9.25 percent at September 1996.
Figure 3 demonstrates the impact of varying interest rates on the income required to service a loan to buya house at 80 per cent of the median house price, in major capital cities.

15
Figure 3: Income Required to Afford Home Ownership (80 per cent of Median Price) Based on 10 per cent Deposit at Variable Interest Rates by Capital Cities
Sydney Canberra Brisbane Perth Melb. Adelaide Hobart
10.5 per cent $63082 $41087 $40788 $40245 $36846 $32740 $325229.75 per cent $59542 $38780 $38497 $37983 $34775 $30900 $306959.25 per cent $57220 $37267 $36995 $36502 $33419 $29695 $294988.5 per cent $53802 $35041 $34785 $34322 $31423 $27921 $27736Source: Median Housing Prices-REIA (March 96), Income required to service a Commonwealth Bankvariable loan over 25 years with a 10 per cent minimum deposit.
More detailed coverage of these and other elements of the Australian Housing System is in Attachment A.
The development of superannuation
The superannuation industry in Australia has grown rapidly, particularly in the last decade or so, and hashad a considerable impact on the direction of household savings. Reserve Bank data indicates changes inthe savings pattern particularly a strong increase in the proportion of households' net investment infinancial assets held by life offices and superannuation funds. These assets' proportion increased from 20per cent in the 1970s to 39 per cent in the 1980s and 55 per cent in the 1990s. Although it notes that avariety of factors could be at work (e.g., unemployment) leading to a decline in bank deposits, theReserve Bank estimates that, in the same period, the proportion of household-sector assets held in themdeclined from 42 per cent to 36 per cent, and then to 27 per cent in the 1990s [Reserve Bank BulletinApril 1996 and the 1996 Reserve Bank Annual Report].
The superannuation industry has become an essential part of Australia's future economic and socialpolicies. Policies that encourage the growth of superannuation funds will help deal with the decline inprivate savings. Acknowledging the large increase in the ratio of aged dependents to the workingpopulation, in the next century self-funded retirement through superannuation savings will play animportant role in improving the adequacy of retirement incomes and reducing the growth in age-pensionoutlays.
Although there has been a modest decrease since 1989 in the proportion of aggregate superannuation-fund assets held in debt-type securities (as shown in Attachment B on asset composition ofsuperannuation funds) superannuation funds are likely to continue to hold a substantial proportion of theirassets in such securities. In the last few years they have been acquiring mortgage-backed securities as acomponent of their debt-type asset holdings.
Competitive Developments in the Housing Finance Market
The housing-finance market has been characterised in recent years by vigorous competition as lendershave sought to attract borrowers in an increasingly informed and mobile market. In the mid-1990slenders have offered an increasing range of housing-loan products with various forms of interest-ratediscount and enhancements. The benefits of competitive market conditions were evidenced in late 1994when, after increases in official indicator rates of

16
about 2.75 per cent, banks increased the prevailing rate on standard variable-rate loans by a total of 1.75per cent, effectively absorbing pail of the increase in funding costs and narrowing their margins onhousing loans.
In large measure, however, interest-rate competition among the primary (bank) lenders has beenconcentrated on concessions intended to attract borrowers at the point of taking out loans (notably'honeymoon' rates for the first year) and has not centred on the continuing rate charged on standardvariable-rate loans, which applies once borrowers become established clients.
Although greater diversity has been evident in the rates for various lenders' housing loans with fixed ratesand terms, the rates charged for standard loans have tended to stay nearly uniform for considerableperiods among most banks of significant size.
Impact of securitised lending on housing-loan interest rates
Nevertheless, in 1994 and 1995 the growing availability and promotion of loans by nontraditional lenders,notably mortgage originators using funds from securitised sources (see Attachment C on securitisation),engendered an increasingly competitive lending environment. Because they combined the tapping ofdifferent funding sources with an ability to operate on lower interest-rate margins, these nontraditionallenders were able to undercut, sustainably, the continuing rates that traditional lenders were generallywilling to offer on standard housing loans.
Although most banks were unwilling to meet this competition by offering similar rates for the bulk of theloan term, a few did respond by introducing 'no-frills' loans at similar, lower rates. As a result, for muchof the second half of 1995-96 the rates charged by larger mortgage originators making loans withsecuritised funding were between 1.5 and 1.8 per cent less than the traditional-lender classes' long-termrate for standard loans (see Figure 4).
In June 1996, however, before any reduction in the cash rate by the monetary authorities, the major banks,following the initiative of the Commonwealth Bank, undertook reductions of about 0.75 per cent in thestandard-loan rate. This led to a narrowing of the order of 0.75 per cent in the margin the banks chargedrelative to the mortgage originators.
These reductions can be attributed reasonably to competition by non-traditional loan originators lendingfrom securitised funding sources for both house-buying and refinancing. The decision in the NSW 1996-97 Budget to remove stamp duty for refinancing house loans can be seen as a significant trigger toencouraging competition in this sector.
Figure 4: Competition from mortgage securitisation industry average interest rates(per cent)
May 1995 March 1996 September 1996Banks 10.48 10.34 49.2Building Societies 10.48 10.39 9.44Securitised Loan Originators 9.74 9.21 8.65Source: Cannex Mortgage Rate Data
17
After a reduction in the cash rate by the Reserve Bank of 0.5 per cent in late July, both traditional andnon-traditional lenders reduced loan interest rates again. The effect has been to narrow the marginbetween standard bank loans and non-traditional originators' loans to about 0.6 per cent, from at least 1.5per cent for most of the second half of 1995-96. Another response by many banks to loan originators'competition has been the introduction of 'basic option' loans at rates about 0.7 per cent less than thestandard loan rate. These effectively matched die (nominal) rate charged by non-traditional originators,but for effective comparison it should be noted that loans offered by some non-traditional lendersincorporate features not included in the banks' 'basic-option' loans, and the varying incidence and level offees, too, cloud direct comparisons.
The competitive environment at the beginning of 1996-97 resulted also in a shrinking of the spreadbetween the banks' predominant housing-mortgage rate and the average cost of fonds (as estimated by theReserve Bank) to the narrowest since deregulation of housing-loan interest rates in April 1986. Theestimated spread at August 1996 was 3.8 per cent, based on a mortgage rate of 9.25 per cent. The marginthat has prevailed since January 1989 (when monthly estimates of the average cost of funds becameavailable) was 4.5 to 5 per cent. The Reserve Bank noted also that, despite this narrowing, scope existson the basis of international comparisons for another reduction in the margin. Nonetheless it is notpossible to conclude either that the recent changes reflect a structural shift in banks' housing lending, orthat it is a shorter-term response directed at inhibiting the growth of non-bank lenders and their incursioninto this area of finance.
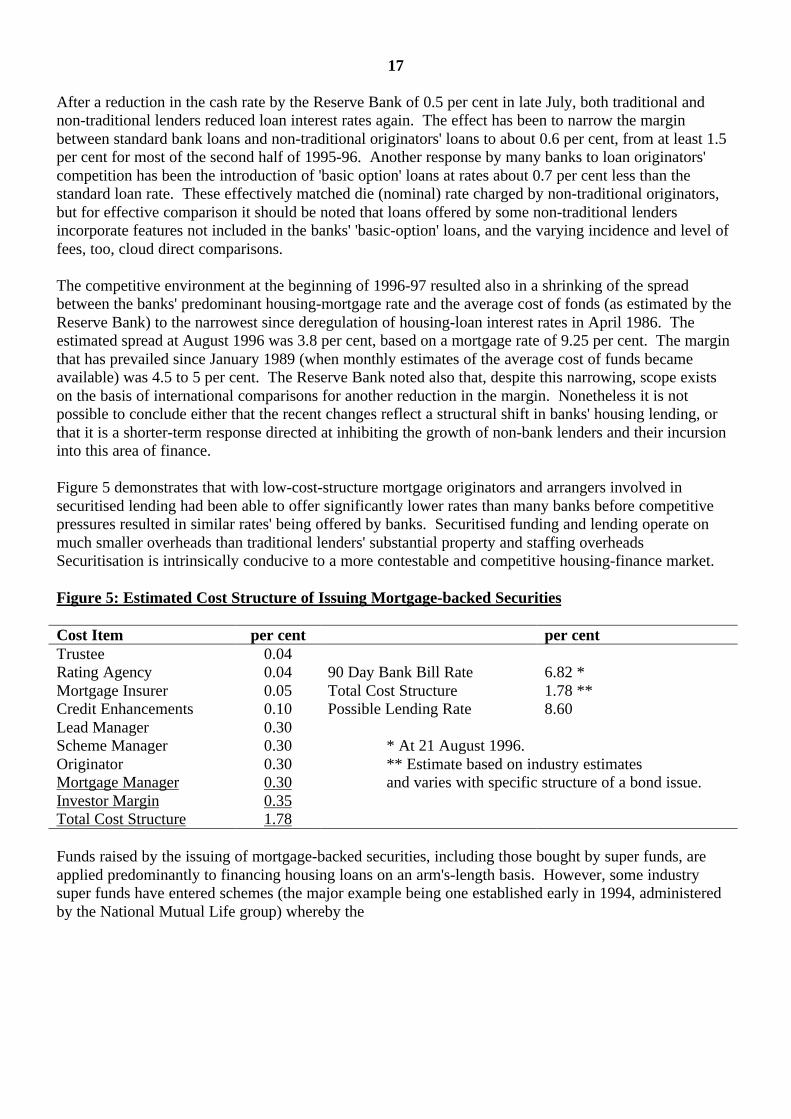
Figure 5 demonstrates that with low-cost-structure mortgage originators and arrangers involved insecuritised lending had been able to offer significantly lower rates than many banks before competitivepressures resulted in similar rates' being offered by banks. Securitised funding and lending operate onmuch smaller overheads than traditional lenders' substantial property and staffing overheadsSecuritisation is intrinsically conducive to a more contestable and competitive housing-finance market.
Figure 5: Estimated Cost Structure of Issuing Mortgage-backed Securities
Cost Item per cent per centTrustee 0.04Rating Agency 0.04 90 Day Bank Bill Rate 6.82 *Mortgage Insurer 0.05 Total Cost Structure 1.78 **Credit Enhancements 0.10 Possible Lending Rate 8.60Lead Manager 0.30Scheme Manager 0.30 * At 21 August 1996.Originator 0.30 ** Estimate based on industry estimatesMortgage Manager 0.30 and varies with specific structure of a bond issue.Investor Margin 0.35Total Cost Structure 1.78
Funds raised by the issuing of mortgage-backed securities, including those bought by super funds, areapplied predominantly to financing housing loans on an arm's-length basis. However, some industrysuper funds have entered schemes (the major example being one established early in 1994, administeredby the National Mutual Life group) whereby the

18
funds concerned invest in mortgage-backed securities and fund members are eligible to apply for housingloans within such schemes.
Because of cost savings associated with introducing applicants and loan establishment and administration,the interest rate on loans made through such schemes was about 0.3 per cent less at September 1996 thanthe rate charged typically on new loans funded through securitisation. Nevertheless, funds buying suchmortgage-backed securities earn a market-rate return on them.
Housing loans funded from securitised sources have attributes similar to those of loans by banks andpermanent building societies, being predominantly on a principal-and-interest basis, at variable interestrates and for long terms, with provision for prepayments or discharge before maturity.
Prospective investment by super funds in mortgage-backed securities
Financial-market analysts are forecasting that, because of a continuing tightening in. AustralianGovernments' fiscal policy stance. there will be a marked decline in the years ahead in the supply of newgovernment and other public-sector securities. The expected conjunction of this drying-up and limitedavailability of new longer-term corporate-sector debt securities (reflecting a preference by corporates toborrow overseas) creates a situation of increased demand for private-sector debt securities. The likelyimplication is that in future the domestic capital market generally will have a capacity to take up asubstantially greater volume annually of mortgage-backed securities and other asset-backed securities.
In recent years, super funds have held in aggregate about 25 to 32 per cent of their assets in various typesof short-term and long-term securities (public- and private-sector combined). In compliance with therequirement to exercise prudent investment strategies, including reasonable portfolio diversification,super funds are likely to try to continue to hold a substantial proportion of their aggregate assets in debt-type securities.
The prospective emergence of increased demand for non-traditional types of debt securities points to anopening for a substantial increase in the proportion of new investible funds that super funds allocateannually to mortgage-backed securities. Given the forecast multiplication of the flows of funds availableannually for investment by super funds, there is the potential for a quantum expansion in the years aheadin the absolute level of mortgage-backed securities (and other asset-backed securities) held in super funds'portfolios.
This assessment presupposes continuation of attractive rates of return on mortgage-backed securities, thatthe legal structures and underlying security of mortgage-backed securities will continue to be viewedfavourably by ratings agencies and investment managers, and that no more significant regulatory issuesemerge as impediments to the investment attractiveness of mortgage-backed securities.
Significance of mortgage-backed securities as housing finance
The proportion of new lending for owner-occupied housing (gross value of lending, includingrefinancing) which was both provided by specialist (non-traditional) loan

19
originators and funded from securitised sources increased from about 5.6 per cent in the first half of 1995-96 to 7.4 per cent in the second half, averaging 6.5 per cent (see Figure 6) for the financial year.
At 7.4 per cent this represents more than $3 billion annualised of a projected home-ownership financemarket of $43.6 billion for 1995-96. In addition to this lending for owner occupation, loans fundedthrough securitisation are made for investment in private rental housing.
The value of mortgage-backed securities and other asset-backed securities issued in 1995 is understood tohave been of the order of $6 billion, mortgage-backed securities accounting for slightly more than half.Industry sources suggest that the aggregate of mortgage-backed securities issued in 1996 is expected toincrease considerably, reflecting a substantial expansion in new lending being planned by loanoriginators.
Although the Department does not necessarily endorse such forecasts, leaders in the securitised-loan-origination industry have forecast that within two to five years 25 per cent (about $ 10 billion in currentterms) of new lending for housing will be funded from securitised mortgages (SBC Warburg forecast thatthe proportion would increase steadily toward 25 per cent within two years) [AIC Mortgage 2000Conference Paper, 1996]. It seems likely that most lending funded from securitised sources will beoriginated and managed by non-traditional loan originators and/or managers, although it is possible thatbanks and other traditional lenders will fund part of their future lending for housing from securitisedsources. As an illustration of the potential of such lending, mortgage companies in the United Statesrepresented 56.4 per cent of the market in the last quarter of 1995, against the commercial banks' 23.5 percent and savings and loans institutions' 15.7 per cent [US Dept of Housing and Urban Development,1995].
20
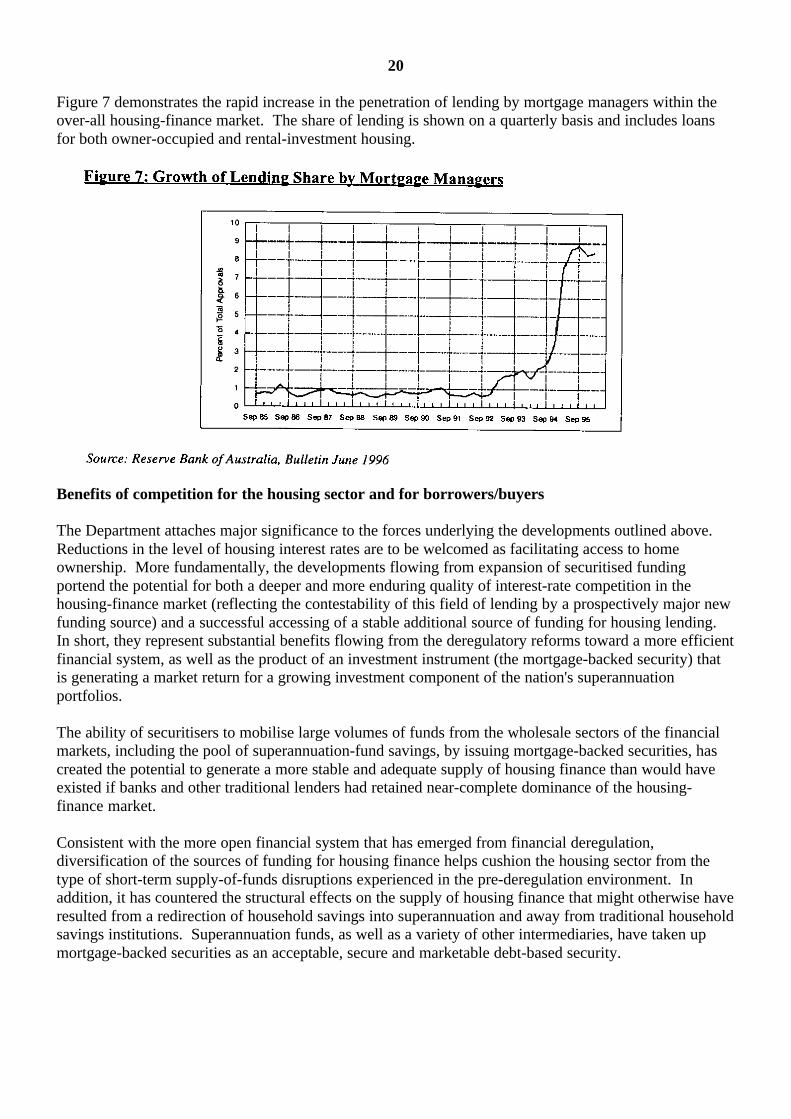
Figure 7 demonstrates the rapid increase in the penetration of lending by mortgage managers within theover-all housing-finance market. The share of lending is shown on a quarterly basis and includes loansfor both owner-occupied and rental-investment housing.
Benefits of competition for the housing sector and for borrowers/buyers
The Department attaches major significance to the forces underlying the developments outlined above.Reductions in the level of housing interest rates are to be welcomed as facilitating access to homeownership. More fundamentally, the developments flowing from expansion of securitised fundingportend the potential for both a deeper and more enduring quality of interest-rate competition in thehousing-finance market (reflecting the contestability of this field of lending by a prospectively major newfunding source) and a successful accessing of a stable additional source of funding for housing lending.In short, they represent substantial benefits flowing from the deregulatory reforms toward a more efficientfinancial system, as well as the product of an investment instrument (the mortgage-backed security) thatis generating a market return for a growing investment component of the nation's superannuationportfolios.
The ability of securitisers to mobilise large volumes of funds from the wholesale sectors of the financialmarkets, including the pool of superannuation-fund savings, by issuing mortgage-backed securities, hascreated the potential to generate a more stable and adequate supply of housing finance than would haveexisted if banks and other traditional lenders had retained near-complete dominance of the housing-finance market.
Consistent with the more open financial system that has emerged from financial deregulation,diversification of the sources of funding for housing finance helps cushion the housing sector from thetype of short-term supply-of-funds disruptions experienced in the pre-deregulation environment. Inaddition, it has countered the structural effects on the supply of housing finance that might otherwise haveresulted from a redirection of household savings into superannuation and away from traditional householdsavings institutions. Superannuation funds, as well as a variety of other intermediaries, have taken upmortgage-backed securities as an acceptable, secure and marketable debt-based security.

21
The substantial increase in numbers of housing lenders whose operations and funding techniques and/orsources are quite independent of those of banks and other traditional lenders has opened the housing-finance market considerably, creating, arguably, conditions for meaningful and durable interest-ratecompetition in housing finance for the first time since interest-rate deregulation in 1986, whencompetition developed initially only on the basis of product. The ability of mortgage securitisers, inalliance with mortgage originators and trustee companies, to operate with far narrower margins thantraditional lenders, will act as a constraint on the interest-rate margins of the traditional lenders and mightalso exert more downward pressure, over time, on those margins.
Uniform Consumer Credit Code (UCCC)
The UCCC, which took effect in November 1996, represents the first application of consumer-credit lawto housing loans. It will apply to the full range of housing lenders. The requirement that the lender beliable for lending arrangements in certain circumstances might tighten the loan-acceptance requirementsof both institutional and non-institutional lenders.
Specifically, Section 70 of the Code empowers the Court to 'reopen unjust transactions including thoseimposing conditions that would be unreasonably difficult to comply with, and those where the creditprovider knew or could have ascertained that the debtor could not pay in accordance with the terms of thecontract or not without substantial hardship'. Section 71, concerning 'orders on reopening of transactions',provides that the Court may, among other matters, relieve the debtor from payment of any amountexceeding what the Court considers to be reasonably payable.
Market commentators have suggested that such provisions will influence lenders to adopt moreconservative standards. If this were to eventuate, it would most probably affect some lower-incomehouseholds' access to housing finance. This reflects the need for governments to ensure that appropriatebalance is struck between ensuring that borrowers have access to adequate finance but are not subject tounsustainable arrangements.
In addition, the level of documentation required might put more pressure on small lenders and give rise togreater centralisation of mortgage origination and management operations to ensure consistency ofstandards and full compliance with UCCC requirements that would be difficult for traditionaldecentralised administrations to achieve [article on Westpac's new national mortgage-processing centre,Business Review Weekly, 29 April 1996].
Some industry observers believe also that the UCCC will raise more specific and serious difficulties forsecuritisation programs, significant enough to threaten the continued operation of existing programs[Clayton Utz, AIC Conference Paper No 6, 30 April 1996]. On this issue the key question is who thecredit-provider is. A submission has been made recently to the Ministerial Council on Consumer Affairsby the Trustee Corporations' Associations of Australia seeking amendments to the UCCC in recognitionof the differing functions of the trustee and the manager/service/originator in a securitisation program. Itis understood that discussions between state authorities and the industry have been progressing towardagreement on a workable but less-than-optimal transitional arrangement.
22
Other regulatory issues
There are generally no substantial regulatory impediments to the operation and development of mortgagesecuritisation and related lending operations. Securitised funding operations do not require a base ofequity capital and are not subject to prudential requirements for capital backing for funds raised frommortgage-backed securities. By contrast, banks and permanent building societies operate with an equitycapital base and are subject to minimum capital-adequacy ratio requirements set by the Reserve Bank andthe Australian Financial Institutions Commission respectively. For the securitisers, this represents acompetitive advantage in that their operations do not need to incorporate a margin to provide a return onany capital base. From a wider perspective, the operation of securitisation represents an efficiency gain.
Given the role securitisation has played in linking the growing pool of superannuation funds with thehousing-finance market and exerting influence on lending margins, it will be important for governmentsand regulatory authorities to stay aware of any emerging factors that could weaken the effectiveness ofsecuritised funding and lending operations. Due attention should be given to any regulatory or structuralweaknesses. The Department notes, in this regard, that the difficulties encountered by the securitised-loans industry in the formulation of the credit-provider role might be cited as such, and reflects the needfor effective coordination.

23
ATTACHMENT A
The Australian Housing System
Australians have a strong preference for home ownership. The proportion of households in owner-occupied housing, which has been about 70 per cent since the early 1960s, is among the world's largest.In 1994, 6,677,900 households-17.1 million people-lived in private dwellings. Of these, 41.8 per centwere home owners and 28.3 per cent buyers.
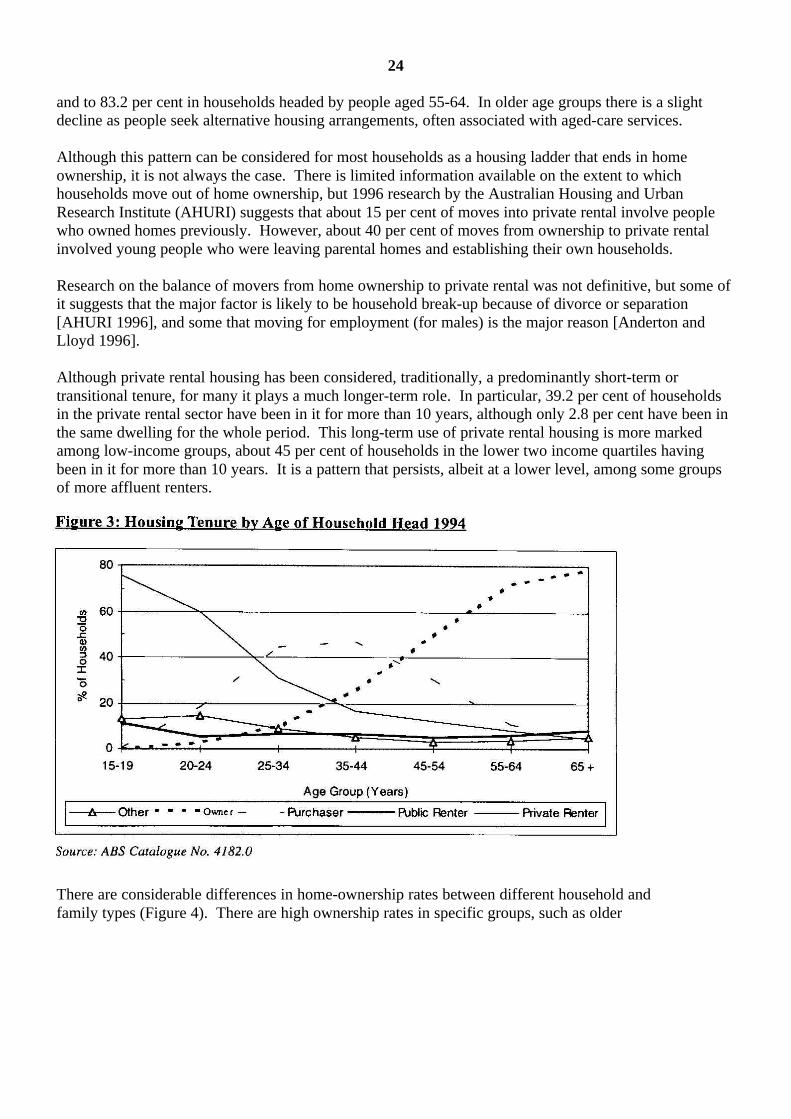
Figure 3 depicts clearly the general lifecycle progression of people from private rental housing into homepurchase and then ownership. Indeed, the aggregate level of ownership and purchase increases from 20.5per cent in the 20-24 age group to 54.1 per cent at 25-34
24
and to 83.2 per cent in households headed by people aged 55-64. In older age groups there is a slightdecline as people seek alternative housing arrangements, often associated with aged-care services.
Although this pattern can be considered for most households as a housing ladder that ends in homeownership, it is not always the case. There is limited information available on the extent to whichhouseholds move out of home ownership, but 1996 research by the Australian Housing and UrbanResearch Institute (AHURI) suggests that about 15 per cent of moves into private rental involve peoplewho owned homes previously. However, about 40 per cent of moves from ownership to private rentalinvolved young people who were leaving parental homes and establishing their own households.
Research on the balance of movers from home ownership to private rental was not definitive, but some ofit suggests that the major factor is likely to be household break-up because of divorce or separation[AHURI 1996], and some that moving for employment (for males) is the major reason [Anderton andLloyd 1996].
Although private rental housing has been considered, traditionally, a predominantly short-term ortransitional tenure, for many it plays a much longer-term role. In particular, 39.2 per cent of householdsin the private rental sector have been in it for more than 10 years, although only 2.8 per cent have been inthe same dwelling for the whole period. This long-term use of private rental housing is more markedamong low-income groups, about 45 per cent of households in the lower two income quartiles havingbeen in it for more than 10 years. It is a pattern that persists, albeit at a lower level, among some groupsof more affluent renters.
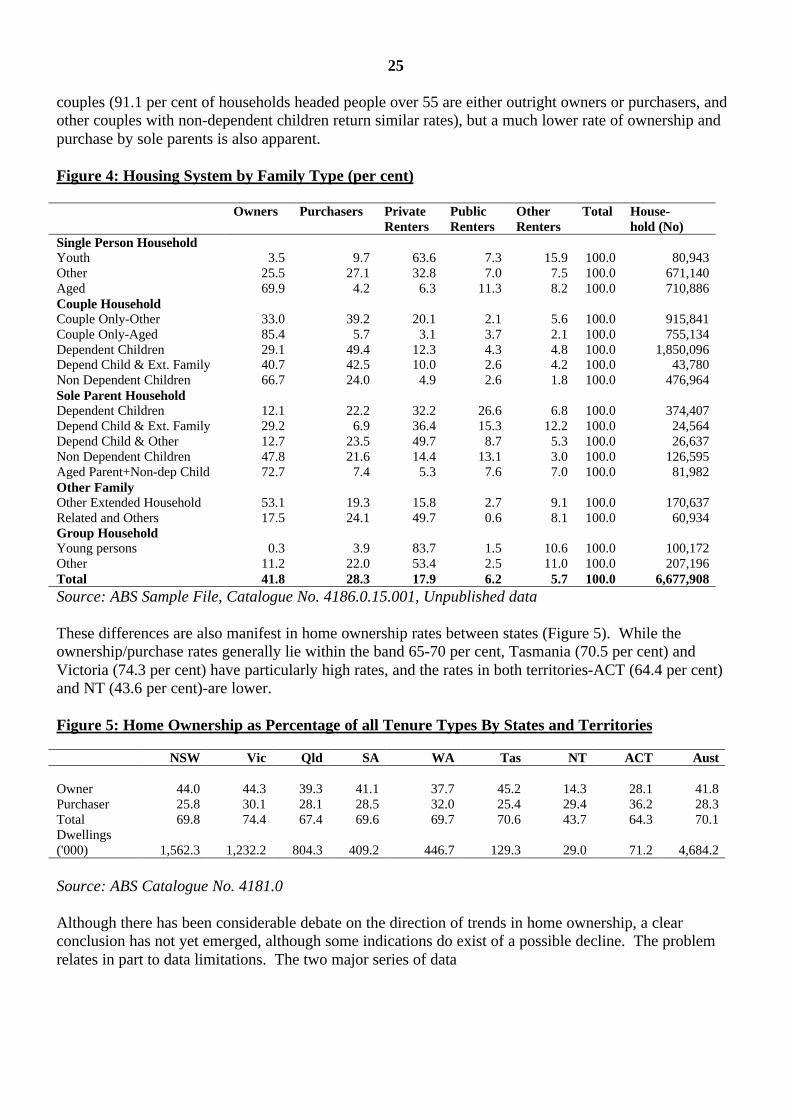
There are considerable differences in home-ownership rates between different household andfamily types (Figure 4). There are high ownership rates in specific groups, such as older
25
couples (91.1 per cent of households headed people over 55 are either outright owners or purchasers, andother couples with non-dependent children return similar rates), but a much lower rate of ownership andpurchase by sole parents is also apparent.
Figure 4: Housing System by Family Type (per cent)
Owners Purchasers PrivateRenters
PublicRenters
OtherRenters
Total House-hold (No)
Single Person HouseholdYouth 3.5 9.7 63.6 7.3 15.9 100.0 80,943Other 25.5 27.1 32.8 7.0 7.5 100.0 671,140Aged 69.9 4.2 6.3 11.3 8.2 100.0 710,886Couple HouseholdCouple Only-Other 33.0 39.2 20.1 2.1 5.6 100.0 915,841Couple Only-Aged 85.4 5.7 3.1 3.7 2.1 100.0 755,134Dependent Children 29.1 49.4 12.3 4.3 4.8 100.0 1,850,096Depend Child & Ext. Family 40.7 42.5 10.0 2.6 4.2 100.0 43,780Non Dependent Children 66.7 24.0 4.9 2.6 1.8 100.0 476,964Sole Parent HouseholdDependent Children 12.1 22.2 32.2 26.6 6.8 100.0 374,407Depend Child & Ext. Family 29.2 6.9 36.4 15.3 12.2 100.0 24,564Depend Child & Other 12.7 23.5 49.7 8.7 5.3 100.0 26,637Non Dependent Children 47.8 21.6 14.4 13.1 3.0 100.0 126,595Aged Parent+Non-dep Child 72.7 7.4 5.3 7.6 7.0 100.0 81,982Other FamilyOther Extended Household 53.1 19.3 15.8 2.7 9.1 100.0 170,637Related and Others 17.5 24.1 49.7 0.6 8.1 100.0 60,934Group HouseholdYoung persons 0.3 3.9 83.7 1.5 10.6 100.0 100,172Other 11.2 22.0 53.4 2.5 11.0 100.0 207,196Total 41.8 28.3 17.9 6.2 5.7 100.0 6,677,908Source: ABS Sample File, Catalogue No. 4186.0.15.001, Unpublished data
These differences are also manifest in home ownership rates between states (Figure 5). While theownership/purchase rates generally lie within the band 65-70 per cent, Tasmania (70.5 per cent) andVictoria (74.3 per cent) have particularly high rates, and the rates in both territories-ACT (64.4 per cent)and NT (43.6 per cent)-are lower.
Figure 5: Home Ownership as Percentage of all Tenure Types By States and Territories
NSW Vic Qld SA WA Tas NT ACT Aust
Owner 44.0 44.3 39.3 41.1 37.7 45.2 14.3 28.1 41.8Purchaser 25.8 30.1 28.1 28.5 32.0 25.4 29.4 36.2 28.3Total 69.8 74.4 67.4 69.6 69.7 70.6 43.7 64.3 70.1Dwellings('000) 1,562.3 1,232.2 804.3 409.2 446.7 129.3 29.0 71.2 4,684.2
Source: ABS Catalogue No. 4181.0
Although there has been considerable debate on the direction of trends in home ownership, a clearconclusion has not yet emerged, although some indications do exist of a possible decline. The problemrelates in part to data limitations. The two major series of data

26
collections, the Census and ABS Household Surveys, have different methodologies which limit theircomparability, and some problems exist within the series. For example, although the 1991 Censusrecorded a home-ownership rate of 67.3 per cent (69.1 per cent in 1986), it recorded also a relatively largeincrease in 'other and inadequately described' responses to the question on housing tenure, which bringcomparability into question.
Similarly, changes in the weighting process of the 1994 Australian Housing Survey to improve itsaccuracy have limited its value for comparison with earlier surveys. For example, although the 1994survey indicated that 70.1 per cent of households were owners or purchasers, if it had been weighted likeearlier surveys the figure would have been 71.1 per cent-which is more directly comparable with theestimates of 72.4 per cent from the 1988 Housing Survey and 71.6 per cent from the 1990 Survey ofIncome and Housing Costs.
Analysis of age-specific ownership rates presents similar difficulties. To the extent that conclusions canbe drawn, it highlights the importance of compositional change: over-all rates for specific age groups areaffected more by changes in the household circumstances of groups, such as increased numbers of sole-parent households, than by underlying propensity to seek home ownership.
Another important unresolved question is whether longer periods of education and training, and laterfamily formation, will affect lifelong levels of home ownership or merely lead to a delay.
Housing wealth
Residential dwellings represent more than half the private wealth in Australia (Figure 6).Their estimated $1,040 billion value is 55 per cent more than the value of all private-sector businessassets.

27
For the great majority of Australian households, the owner-occupied dwelling has been the main form ofasset. Although, as noted above, about 70 per cent of households either own or are buying their homes,peak lifecycle rates reaching more than 80 per cent, only 20 per cent of the adult population own shareseither directly or through share or property trusts [Australian Stock Exchange's Australian ShareOwnership Survey 1994] and many of these holdings are probably relatively small.
Although housing has been seen traditionally as an appreciating asset in the shorter and medium terms,there has been significant variation in house prices, as illustrated in Figure 7.
The development of a system of compulsory superannuation, if implemented fully and assuminginclusion of the employee and government co-contribution, would change this dramatically and result in aradical increase in the lifetime savings of most Australian workers. It would deliver to workers on theirretirement an amount several times as large as the value of a typical dwelling.
For example, projections made to illustrate the benefits available under the superannuation regimeannounced in the 1995 Commonwealth Budget indicate that, on retirement at 65 after 40 years'continuous work, a male who had consistently earned average weekly ordinary-time earnings wouldreceive a 'real gross final benefit (in 1995 dollars) of $462,000'. The median value of established housesis of the order of $168,000 in capital cities and $118,000 in other areas [Commonwealth Bank data onborrowers for June Quarter 1996].
Impact of the Institutional Framework
As a result of the complex economic, fiscal and regulatory environment-including the three levels ofgovernment-within which housing operates, and the many ways in which access
28
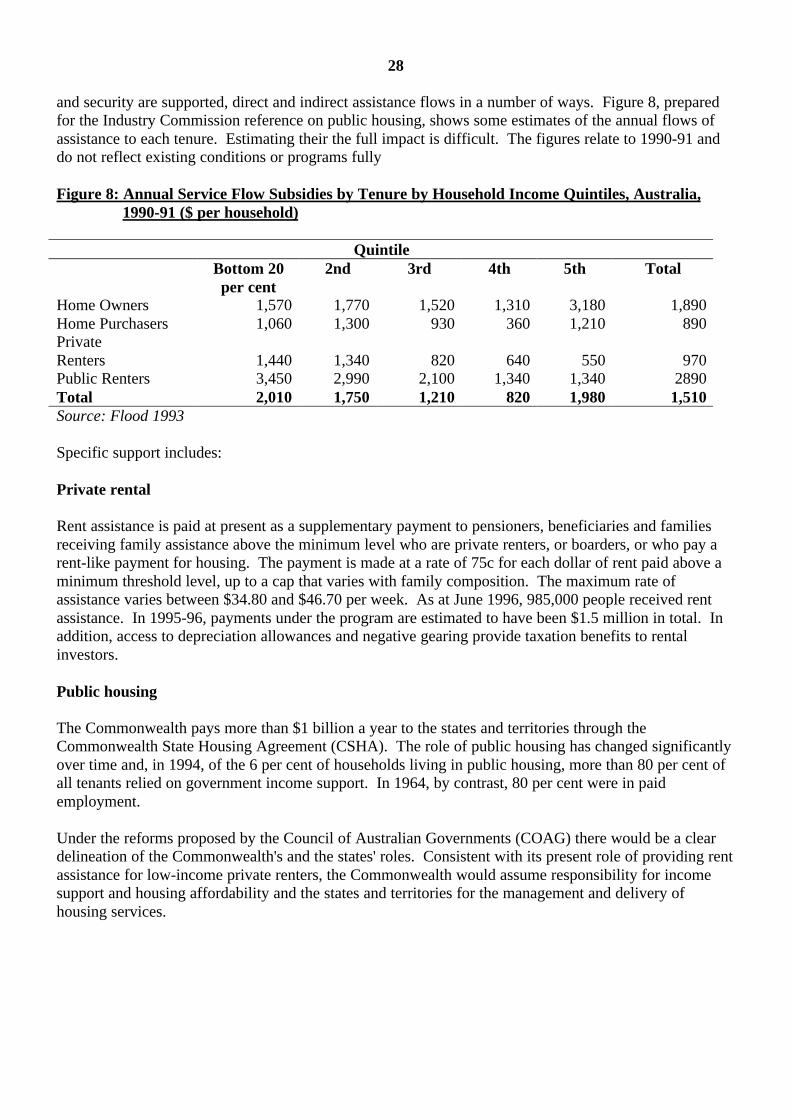
and security are supported, direct and indirect assistance flows in a number of ways. Figure 8, preparedfor the Industry Commission reference on public housing, shows some estimates of the annual flows ofassistance to each tenure. Estimating their the full impact is difficult. The figures relate to 1990-91 anddo not reflect existing conditions or programs fully
Figure 8: Annual Service Flow Subsidies by Tenure by Household Income Quintiles, Australia,1990-91 ($ per household)
QuintileBottom 20 2nd 3rd 4th 5th Totalper cent
Home Owners 1,570 1,770 1,520 1,310 3,180 1,890Home Purchasers 1,060 1,300 930 360 1,210 890PrivateRenters 1,440 1,340 820 640 550 970Public Renters 3,450 2,990 2,100 1,340 1,340 2890Total 2,010 1,750 1,210 820 1,980 1,510Source: Flood 1993
Specific support includes:
Private rental
Rent assistance is paid at present as a supplementary payment to pensioners, beneficiaries and familiesreceiving family assistance above the minimum level who are private renters, or boarders, or who pay arent-like payment for housing. The payment is made at a rate of 75c for each dollar of rent paid above aminimum threshold level, up to a cap that varies with family composition. The maximum rate ofassistance varies between $34.80 and $46.70 per week. As at June 1996, 985,000 people received rentassistance. In 1995-96, payments under the program are estimated to have been $1.5 million in total. Inaddition, access to depreciation allowances and negative gearing provide taxation benefits to rentalinvestors.
Public housing
The Commonwealth pays more than $1 billion a year to the states and territories through theCommonwealth State Housing Agreement (CSHA). The role of public housing has changed significantlyover time and, in 1994, of the 6 per cent of households living in public housing, more than 80 per cent ofall tenants relied on government income support. In 1964, by contrast, 80 per cent were in paidemployment.
Under the reforms proposed by the Council of Australian Governments (COAG) there would be a cleardelineation of the Commonwealth's and the states' roles. Consistent with its present role of providing rentassistance for low-income private renters, the Commonwealth would assume responsibility for incomesupport and housing affordability and the states and territories for the management and delivery ofhousing services.

29
Home ownership
In keeping with housing's important role in maintaining high standards of living in Australia, homeownership is supported by the Commonwealth Government by a number of mechanisms, includingmacroeconomic policies that affect interest rates, direct help through the CSHA, and certain taxationpolicies.
Direct Assistance
As well as supporting public housing, the CSHA promotes home ownership by supporting state-government-administered Home Purchase Assistance (HPA) programs, and providing mortgage reliefHPA programs are directed at people who are unable to obtain private-sector funding to buy adequatehousing. Mortgage relief is available to low-income households experiencing short-term problems inmeeting payments.
Except for South Australia, Western Australia and the Northern Territory, the states and territories haveminimal or no housing lending programs planned for 1996-97 under HPA. The unprecedented level ofcompetition in the housing lending market, accompanied by lower interest rates, has created a situation inwhich many lower-income households serviced previously by HPA programs have access to private-sector finance. Figure 9 shows a comparison between the income requirements to qualify for a loan foran 80 per cent median-priced home under HPA programs (at June 1996 and excluding NSW, which doesnot offer HPA programs) and private-sector finance (90 per cent loan to value ratio).
Other Support
As well as this direct support, the taxation and social-security treatment of home ownership can also beconstrued as indirect support. It includes:
• non-taxation of capital gains on owner-occupied housing;
• non-taxation of imputed rent from owner-occupation;

30
• substantial exemptions by states from stamp duty for first-home buyers, exemption of most owner-occupiers from state government land tax and some reductions in local government rates,particularly for low-income groups such as pensioners; and
• exemption of the primary residence from social-security means test.
The relative magnitude of each of these is difficult to ascertain although it may be considered that alltenures-home ownership and public and private rental-receive a flow of benefits either directly or throughtaxation expenditures.
Housing Supply
In April 1996 the Indicative Planning Council (IPC) [Housing Prospects Report Vol 2 No 2] forecast thatnew-dwelling commencements would decline to 119,000 in 1995-96 from 170,000 in 1994-95. The IPCexpected a marginal upturn in 1996-97 to 124,000. Oversupply of dwellings is expected to dampen over-all activity levels into 1996-97 and the recovery in dwelling commencements to be modest relative tothose in the first years in previous housing-cycle upturns. The IPC expects underlying requirements fornew dwellings to average just fewer than 138,000 a year for the five years 1995-96 to 1999-2000. Figure10 shows the seasonally adjusted value and number of secured housing commitments since June 1986.
The estimated oversupply of residential dwellings of 20,000 for June 1996 (Figure 11) represents asignificant reduction from the 49,000 estimated in the previous year. It is expected that the currentoversupply should be absorbed by the market some time in 1997.
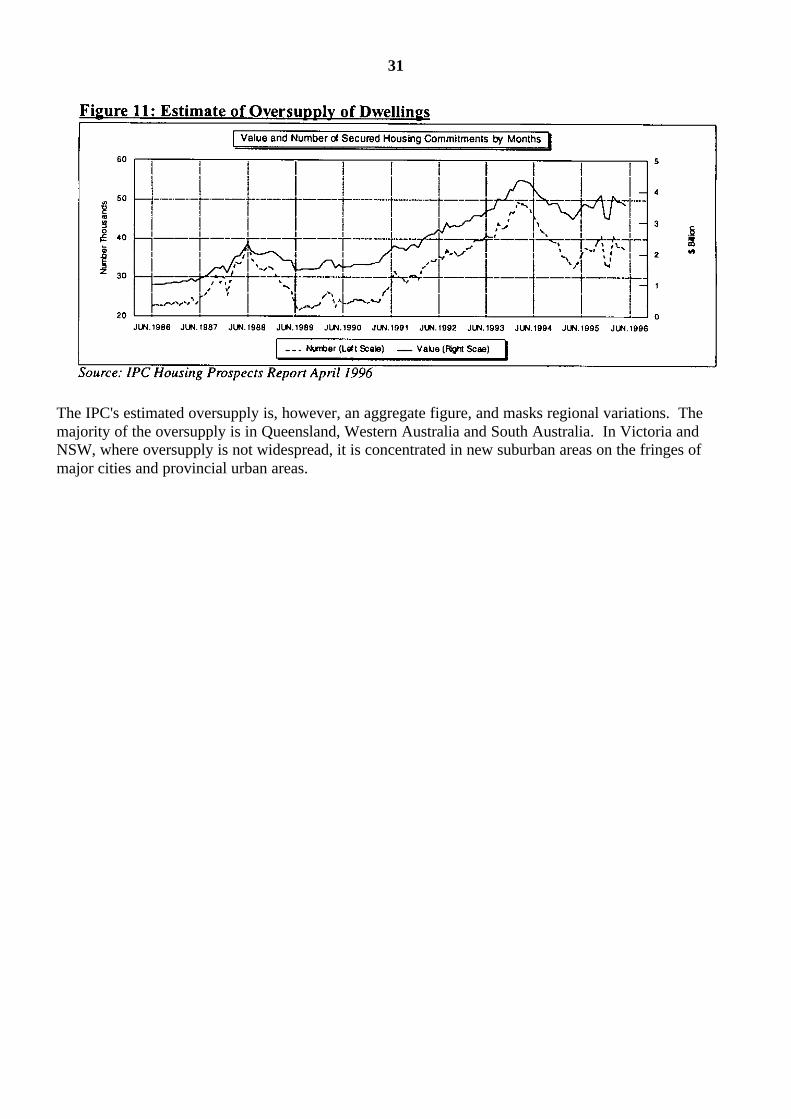
31
The IPC's estimated oversupply is, however, an aggregate figure, and masks regional variations. Themajority of the oversupply is in Queensland, Western Australia and South Australia. In Victoria andNSW, where oversupply is not widespread, it is concentrated in new suburban areas on the fringes ofmajor cities and provincial urban areas.

32
ATTACHMENT B
Asset Composition of Superannuation Funds
The increase in the average annual addition to the pool of superannuation funds over time reflects therising contribution rate and the flow of investment income, among other factors. As the level ofsuperannuation assets increases, changes are occurring also in the composition of the asset base of thefunds (Figure 1).
Figure 1: Total Assets of Superannuation Funds and Approved Deposit Funds:Distribution by Asset Classes (per cent)
June June June June June June June1989 1990 1991 1992 1993 1994 1995
ASSET CLASSAssets in Australia
Financial AssetsCash & Deposits 5.7 6.2 5.8 5.6 4.1 4.6 4.1Loans & Placements 7.9 8.5 7.3 6.3 5.9 4.5 4.7Short Term Securities 8.6 7.6 7.1 8.3 8.4 8.1 7.6Long Term Securities 19.1 18.9 22.4 22.8 23.2 21.8 21.7Equities, Units in Trusts,Other Assets 30.3 30.3 31.2 34.2 34.3 37.1 37.4Non-financial AssetsLand & Buildings 16.5 15.2 13.3 10.1 7.9 7.3 7.4Other 1.5 2.1 1.3 0.9 0.8 0.6 1.1Total Assets in Australia 89.6 88.8 88.4 88.2 84.6 84.1 83.9Assets Overseas 10.3 11.3 11.6 11.9 15.4 15.9 16.1TOTAL ASSETS ($bn) 107.9 123.8 134.5 155.4 170.4 185.4 197.9Superannuation Funds 102.1 116.6 126.3 145.3 159.9 175.5 188.7Approved Deposit Funds 5.7 7.3 8.2 10.1 10.5 9.9 9.2Source: ABS Catalogue No. 5656.0
Several trends were evident in the changing asset composition of super funds (including those ofapproved deposit funds) from June 1989 to June 1995. Notable was the move from debt and land andbuildings to equity investments. Pronounced increases occurred in the proportions of assets invested inAustralian equities, units in trusts and other financial assets (from 30.3 per cent in June 1989 to 37.4 percent in June 1995) and in assets overseas (from 10.3 per cent to 16.1 per cent). The proportion of assetsin long-term securities peaked in 1993 but eased back moderately thereafter. By contrast, the proportionof assets in land and buildings declined markedly (from 16.5 per cent to 7.4 per cent), as did theproportions of cash and deposits, and loans and placements.
Movements in the proportions of the respective classes of asset are generally consistent with the over-allperformances by sector as indicated by a number of benchmark indicators. The indexes indicate thatdomestic Australian equities and international equities provided opportunities for superior investmentperformance in the early 1990s.

33
ATTACHMENT C
Securitisation
Securitisation involves the creation of a liquid security backed by non-marketable or illiquid financialassets, such as mortgages or credit-card receivables. Mortgage-backed securities are backed by a pool ofhousing or other mortgages that might have been originated by various types of 'lender', ranging frombanks or other traditional intermediaries to specialised loan originators. The latter have establishedarrangements to generate loans for a 'packager' or 'securitiser' which will parcel such loans into pools ofmortgages serving as the underlying security for the mortgage-backed securities. An authorised trustee isappointed to safeguard the interests of investors in the mortgage-backed securities.
Figure 1 shows a simplified outline of a securitised funding and lending structure. It covers only five ofthe parties central to the securitisation process and omits some of the relatively secondary partiessupplying 'enhancement' services (e.g., pool insurer, liquidity-facility provider). Flows of funds(including payments of interest and fees) are indicated by continuous lines; broken lines denote provisionof services.
The five parties are:
• a 'manager' responsible for managing the trust, the securitisation function, and supervision of themortgage originator/servicer (for example, PUMA Management);
• the originator and servicer, which originates the individual loans to households and handlessubsequent administration (for example, Aussie Home Loans);
• a trustee whose role includes safeguarding the interests of investors, and to which repayments fromindividual borrowers are paid for on-payment to investors in mortgage-backed securities (forexample, Perpetual Trustees);
• individual borrowers to whom loans are made and whose mortgage loans provide the underlyingsecurity for mortgage-backed securities; and
• investors (i.e., super funds and other institutions) which provide wholesale funds by buyingmortgage-backed securities (e.g., company and industry superannuation funds).
Investors in mortgage-backed securities are virtually entirely 'wholesale' institutions, includingsuperannuation funds, life offices, friendly societies, money-market corporations etc. Advice fromsecuritisation-industry sources is that, although super funds probably take up less than half the total valueof new mortgage-backed securities issued, the proportion is considerable.
In the late 1980s, when products were first introduced, MBSs were issued mainly by the NSWGovernment-sponsored First Australian National Mortgage Acceptance Corporation (FANMAC). Today,however, the sector has expanded and is composed predominantly of wholly private-sector players.
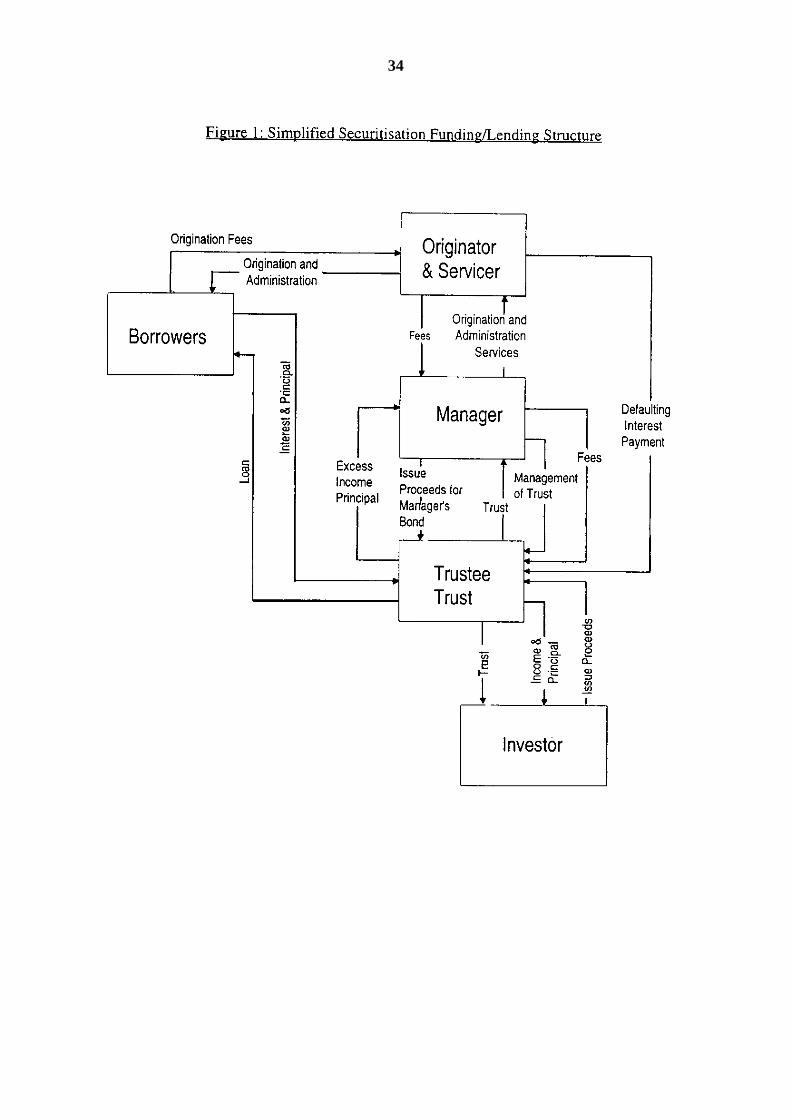
34


