Policy, Legal and Institutional Development for Groundwater Management in the SADC Member States (GMI-PLI) Guidance Document: Building Groundwater Resilience September 2019 Report Number 3.3
Transcript
Policy, Legal and Institutional Development
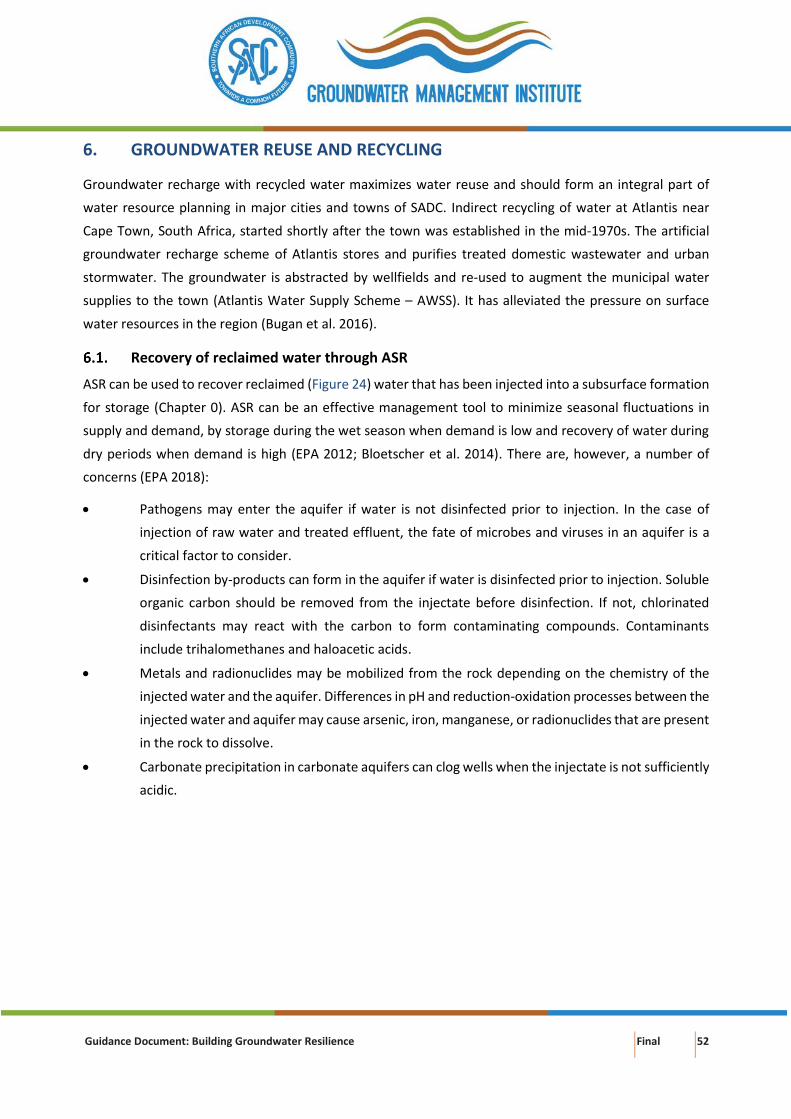
for Groundwater Management in the SADC
Member States (GMI-PLI)
Guidance Document: Building Groundwater Resilience
September 2019
Report Number 3.3
Guidance Document: Building Groundwater Resilience Final i
This report emanates from the project Policy, Legal and Institutional Development for Groundwater
Management in the SADC Member States (GMI-PLI) commissioned by the Southern African
Development Community Groundwater Management Institute (SADC-GMI), and executed by
Guidance Document: Building Groundwater Resilience Final ii
FOREWORD
The Southern African Development Community (SADC) Member States, through the support of
International Cooperating Partners have gone through a series of Water Sector Reforms which varied
in terms of policy, legal and institutional development. The focus of the water sector reforms has been
on Integrated Water Resources Management and aimed at achieving sustainable and equitable
distribution of water resources in the respective Member States. To a large extent, the water sector
reforms did not comprehensively address the sustainable management of groundwater resources, yet
70% of the population in the SADC region depend on it. Climate change continues to negatively affect
the availability of surface water, placing significance reliance on the use of groundwater for both urban
and rural supply throughout the region. Human wellbeing, livelihoods, food security, ecosystems,
natural habitats, industries and urban centres growth throughout the SADC Region are increasingly
becoming more reliant on groundwater. The SADC region in general has an abundance of groundwater
resources. However, due to several factors which include the lack of an enabling policy, legal and
institutional environment, only an estimated 1.5% of the available renewable groundwater resources
are currently being utilised.
It is estimated that there are about 30 Transboundary Aquifers (TBAs) and 15 transboundary river
systems and that these systems are central to the water security of the region. There is therefore a
need for Members States to establish and strengthen existing policy, legal and institutional frameworks
to achieve equitable and sustainable access to water resources through joint management of the
transboundary resources. It is in view of the above and in response to the need to strengthen the
sustainable use of groundwater resources conjunctively with surface water at both the national and
regional level, that the Southern African Development Community – Groundwater Management
Institute (SADC-GMI) was established by the SADC Secretariat, on behalf of the Member States.
The vision of the SADC-GMI is, “to be a Centre of Excellence in promoting equitable and sustainable
groundwater management in the SADC region”. The key focus areas of SADC-GMI are to 1)advocate,
raise awareness and provide technical support in SADC around sustainable management through the
dissemination of information and knowledge; 2) create an enabling environment for groundwater
management through policy, legal and regulatory frameworks; 3) promote action-oriented research;
4) promote impact-oriented capacity building and training for groundwater management in the region;
5) lead and promote regional coordination for groundwater management; and 6) support
infrastructure development for groundwater management.
Guidance Document: Building Groundwater Resilience Final iii
In pursuance of the focus area of creating an enabling environment, SADC-GMI implemented the
project entitled “Policy, Legal and Institutional Development for Groundwater Management in the
SADC Member States, (GMI-PLI)”. The methodology for said project included the development of the
Desired Future State, conducting a baseline study of best practices, and description of policy, legal and
institutional frameworks which promote sustainable groundwater management. Using an in-Country
Experts model, a systematic analysis of the existing policy, legal and Institutional frameworks in
comparison with the Desired Future State was conducted to identify gaps that required to be
addressed in order to fulfil the SADC-GMI mandate – to achieve sustainable groundwater management
in all 16 SADC Member States. The analytical assessment of the gaps identified at national level
culminated in the production of 16 National Gap Analysis & Action Plan Reports and the higher-level
Regional Gap Analysis Report. The latter summarises the findings across the SADC region.
This Guidance Document provides guidance to groundwater managers to understand and implement
measures related to the role of groundwater in water resilience as the SADC region is prone to
environmental, political, economic and social shocks and stresses. It is hoped that this Guidance
Document will aid the SADC Member States to understand the importance of groundwater in water
resilience and ultimately advance the groundwater narrative and bring it at par with surface water in
terms of policy, legal and institutional frameworks which will no doubt enhance sustainable
groundwater management at a national and regional level in the SADC Region.
James Sauramba Executive Director
Guidance Document: Building Groundwater Resilience Final iv
ACKNOWLEDGEMENTS
The following individuals and organisations are thanked for their contributions to the project:
SADC – Ground Water Management Institute
Project Team
Mr James Sauramba Executive Director Ms Nyakallo Khoabane Administration and Finance Assistance Mr Brighton Munyai Technical Advisor Mr Micah Majiwa Governance and Institutional Consultant Ms Mampho Ntshekhe Grant Officer Mr Thokozani Dlamini Communications and Knowledge Management Specialist
Mr Derek Weston Project Lead and Institutional Expert Ms Traci Reddy Project Manager Ms Deepti Maharaj Project Coordinator Ms Barbara Schreiner Policy Expert Dr Amy Sullivan Knowledge Management Expert Ms Jessica Troell Legal Expert Dr Kevin Pietersen Groundwater Management Expert Dr Pinnie Sithole Cluster Lead Ms Susan Byakika Cluster Lead Ms Pretty Ntuli Project Administrator Stakeholders Engaged
The project team would like to thank all those stakeholders that contributed to the project from
Government, Private Sector, Civil Society and Academia and Research.
The authors also like to express sincere appreciation to members of the SADC Sub-Committee on Hydrogeology for identifying the need for this project, following on the numerous challenges that they experience in their respective countries. Without the dedicated facilitation and support from the members of the SADC Sub-Committee on Hydrogeology, who also serve as focal points for groundwater development in their respective countries, this exercise would not have been accomplished.
In this regard, special thanks are given to:
Mr Manuel Quintino, Angola; Mr Kedumetse Keetile, Botswana; Mr Cyrille Masamba, Democratic Republic of Congo; Mr Trevor Shongwe, Kingdom of eSwatini, Ms Christinah Makoae, Lesotho; Mr. Luciano Andriavelojaona, Madagascar; Ms Zione Uka, Malawi; Mr Pokhun Rajeshwar, Mauritius; Ms Ana Isabel Fotine, Mozambique; Ms Maria Amakali, Namibia; Mr Frankie Jose Dupres, Seychelles; Mr Zacharia Maswuma, South Africa; Ms Mwanamkuu Mwanyika, United Republic of Tanzania; Mr Frank Ngoma, Zambia; and Mr Robert Mutepfa, Zimbabwe.
Additionally, the authors thank all other professionals from the Member States who contributed to the project by providing ideas and feedback, in particular, professionals from various organisations who contributed to the over-all project, and senior officials from the Member States. The contribution of all institutions and individuals who supported the project through ideas and comments and may not have been credited by name, is greatly appreciated.
Guidance Document: Building Groundwater Resilience Final v
DOCUMENT INDEX
Presented in the table below is a list of products developed during the GMI-PLI Project:
Phase Document Report No.
Country
Reports
Gap Analysis and Action Plan – Scoping Report: Angola 1.1
Gap Analysis and Action Plan – Scoping Report: Botswana 1.2
Gap Analysis and Action Plan – Scoping Report: Democratic Republic of
Congo
1.3
Gap Analysis and Action Plan – Scoping Report: Kingdom of Eswatini 1.4
Gap Analysis and Action Plan – Scoping Report: Lesotho 1.5
Gap Analysis and Action Plan – Scoping Report: Madagascar 1.6
Gap Analysis and Action Plan – Scoping Report: Malawi 1.7
Gap Analysis and Action Plan – Scoping Report: Mauritius 1.8
Gap Analysis and Action Plan – Scoping Report: Mozambique 1.9
Gap Analysis and Action Plan – Scoping Report: Namibia 1.10
Gap Analysis and Action Plan – Scoping Report: Seychelles 1.11
Gap Analysis and Action Plan – Scoping Report: South Africa 1.12
Gap Analysis and Action Plan – Scoping Report: Tanzania 1.13
Gap Analysis and Action Plan – Scoping Report: Zambia 1.14
Gap Analysis and Action Plan – Scoping Report: Zimbabwe 1.15
Gap Analysis and Action Plan – Scoping Report: Comoros 1.16
Tanzania GW-PLI Roadmap 1.17
Kingdom of Eswatini GW-PLI Roadmap 1.18
Regional
Reports
Regional Gap Analysis and Action Plan 2
Groundwater
Management
Guidance
Documents
Development of a Groundwater Policy, Legal and Institutional Roadmap 3.1
Operation and Maintenance of Groundwater Schemes 3.2
Building Groundwater Resilience 3.3.
Institutionalisation of Groundwater Management 3.4
Strategic Approach to Financing Groundwater Management 3.5
Guidance Document: Building Groundwater Resilience Final vi
EXECUTIVE SUMMARY
Groundwater resources - The road to water resilience
The South African Development Community (SADC) faces several risks to water security from extreme
weather events, natural disasters and state collapse or crisis. Building resilience in groundwater
resources provides an opportunity to improve water security by diversifying the water supply-mix.
The region has undergone severe droughts during the 2015/2016 and 2016/2017 rainy seasons and
floods (2019) through tropical storms Idai and Kenneth which caused deaths and extensive damage in
Mozambique, Malawi and Zimbabwe resulting in water crises and food shortages. Unplanned urban
population growth in cities and informal settlements presents another major challenge for water
security. Resilience system analysis is increasingly applied to water governance to understand socio-
ecological systems ability to recover from imposed shocks such as extreme weather events. Guidelines
are needed to support groundwater resource managers to implement measures in support of
groundwater resilience in SADC.
What is groundwater resilience?
A risk is the likelihood of a negative event and its consequences. A shock occurs when a risk becomes
reality (OECD 2014). A fundamental principle of resilience is being able to respond and adapt to shocks
and stresses and to transform when conditions require it (Brown and Boltz 2016). Drivers that have a
major bearing on groundwater, unfolding role and governance [in SADC], include widespread poverty
and food insecurity in the region, the continuing need for a basic domestic water supply in both rural
and informal urban areas, rapid urbanisation, and the need for drought security as part of all water
provision (Braune and Adams 2013). Groundwater resilience refers to the ability of groundwater
resources to recover from disturbances to its natural state or establish a new equilibrium in response
to imposed shocks.
The natural absorptive capacity of groundwater resources
Absorptive capacity is the ability of a system to prepare for, mitigate or prevent negative impacts, using
predetermined coping responses in order to preserve and restore essential basic structures and
functions (OECD 2014). This includes coping mechanisms used during periods of shock. Examples of
absorptive capacity for groundwater resources include groundwater storage availability, natural
attenuation to pollution and is clearly related to the duration and magnitude of a perturbation.
Groundwater storage serves as a key buffer for achieving groundwater resilience under extreme
climate events e.g. extended drought conditions. Using the groundwater resource strategically and
sustainably means that it can be a crucial factor to bridge gaps between water resource availability and
water demand. This requires careful consideration and includes: (i) setting a limit on how much water
can be safely pumped to avoid irreversible subsidence caused when too much water is removed from
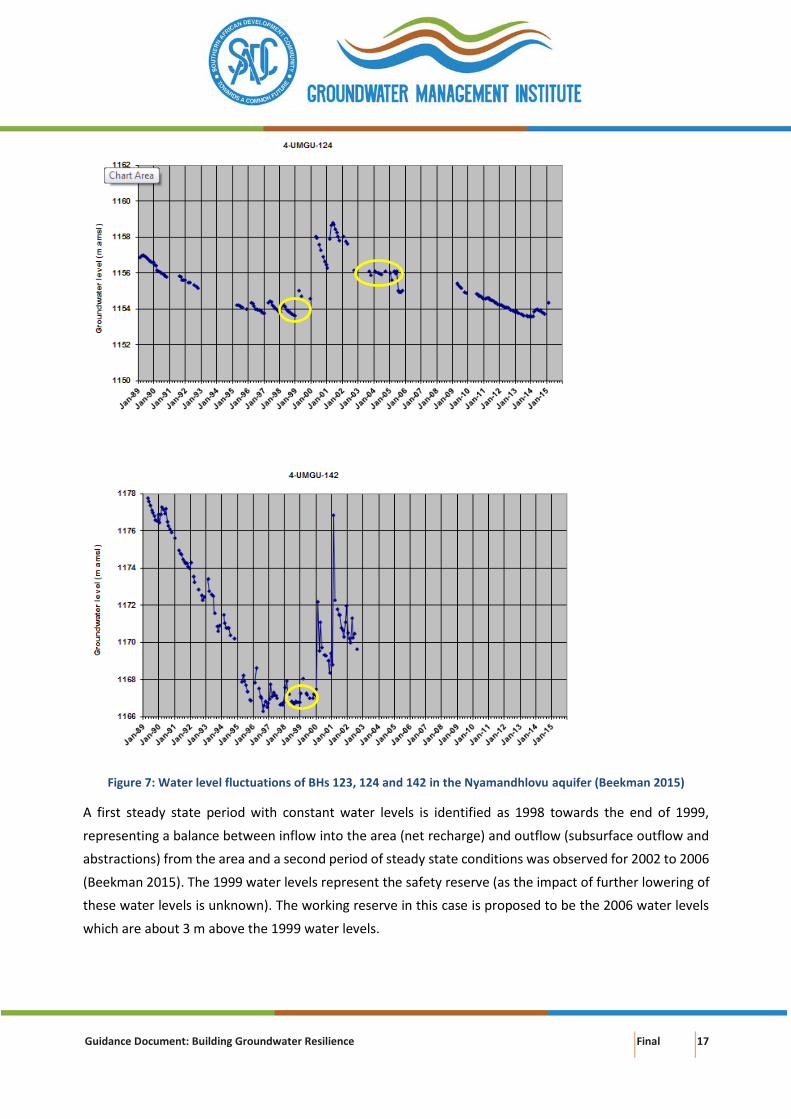
the aquifer; (ii) defining a safety reserve to ensure an adequate water supply in a worst-case scenario,
Guidance Document: Building Groundwater Resilience Final vii
such as a multi-year-interruption in surface water supplies; and (iii) defining a management level – a
target groundwater level that allows use of the aquifer as a working reserve that can be used during
dry times and refilled when adequate surface water supplies are available while protecting the safety
reserve and while preventing exceedance of the irreversible subsidence limit.
The capacity of a groundwater system to recover from pollution is critical to the concept of resilience
as natural disasters and extreme weather events undermine the effectiveness of remediation
measures. Determining the natural attenuation capacity of groundwater systems at a local scale is
complex as it requires detailed knowledge of: (i) the type and quantity of pollutants involved; (ii) the
chemical and hydraulic characteristics of both unsaturated and saturated zones; and (iii) other factors
controlling the spatial extent and persistence of pollutants. Because of the overall complexity (often
unsuccessful) and costs of groundwater remediation the focus should be on prevention of pollution.
Interventions to support groundwater resilience
There are several measures to support groundwater resilience such as conjunctive management of
water resources; managed aquifer recharge (MAR); and groundwater reuse and recycling.
Conjunctive management
Conjunctive management in support of long-term groundwater (and surface water) resilience refers
to management of the combined use of groundwater, surface water and other sources of water in a
manner that prevents irreversible impacts (quantity and quality) on either of the resources. The
benefits of coordinated management of the water sources should exceed the benefits obtained
through their separate management. Benefits of conjunctive (planned) management are: (i)
diversification of water supply mix; (ii) improved water supply security and security of water sources
(prevention of over-exploitation, preparedness for extreme weather events); (iii) larger net water
supply yield (efficient use of both water resources); and (iv) reduced environmental impact
(prevents/limits over-exploitation of groundwater and surface water, water logging and salinisation).
In rapidly expanding cities, conjunctive use of groundwater and surface water is often unplanned and
includes ‘traditional’ groundwater sources (springheads or water wells) at the urban nucleus e.g.
Lusaka, Zambia and immediate neighbouring surface watercourses either one of which subsequently
become insufficient with urban growth.
Managed aquifer recharge
MAR is the replenishment of groundwater by planned subsurface infiltration which is recovered at a
later stage. The main objective of MAR is to create additional storage in a controlled manner to meet
future water needs, hence lessen the risk of over-exploitation. MAR usually forms part of a broader
water management plan to ensure sustainable utilisation of the groundwater resource. Benefits of
MAR other than storage enhancement includes flood and drought risk reduction, salinity improvement
and ecosystem enhancement. In the case of Windhoek, the capital of Namibia, groundwater
Guidance Document: Building Groundwater Resilience Final viii
contributes about 10% to the water supply (Christelis and Struckmeier 2011). A system of artificially
recharging groundwater resources has been put in place (Murray et al. 2018). The aim is to make
available up to 8 million cubic metre per annum (Mm3/annum) of groundwater for abstraction
(Tredoux et al. 2009). The present Windhoek water demand is about 20 Mm3/annum (Christelis and
Struckmeier 2011). MAR has contributed to water security in the Windhoek area.
Groundwater reuse and recycling
Groundwater recharge with recycled water maximizes the reuse and should be an important
component of water resource planning in major cities and towns of SADC. Indirect recycling of water
at Atlantis near Cape Town, South Africa, started shortly after development of the town in the mid-
1970s. The artificial groundwater recharge scheme of Atlantis stores and further purifies treated
domestic wastewater and urban stormwater. The groundwater is abstracted at wellfields and re-used
to augment the municipal water supplies for the town. It has alleviated the pressure on surface water
resources in the region (Bugan et al. 2016).
The road to water resilience requires broadening the water supply mix to include urban stormwater,
water harvesting, water reuse, recycled wastewater, desalinated water and groundwater.
Guidance Document: Building Groundwater Resilience Final ix
CONTENTS
FOREWORD .................................................................................................................................. II
ACKNOWLEDGEMENTS ................................................................................................................. iv
DOCUMENT INDEX ....................................................................................................................... v
EXECUTIVE SUMMARY .................................................................................................................. vi
CONTENTS ................................................................................................................................... ix
LIST OF FIGURES ........................................................................................................................... xi
LIST OF TABLES ............................................................................................................................. xi
LIST OF BOXES ............................................................................................................................. xii
LIST OF ACRONYMS .................................................................................................................... xiii
Box 5: Variation of the dynamics and constraints of conjunctive use with hydrogeological setting ... 31
Box 6: Conjunctive use of groundwater and surface water in a canal command ................................ 33
Box 7: Up-coning of saline water – critical abstraction rate ................................................................. 34
Box 8: Atlantis planned urban water supply ......................................................................................... 38
Box 9: MAR in Southern Africa .............................................................................................................. 46
Box 10: Examples of GBNI solutions ..................................................................................................... 49
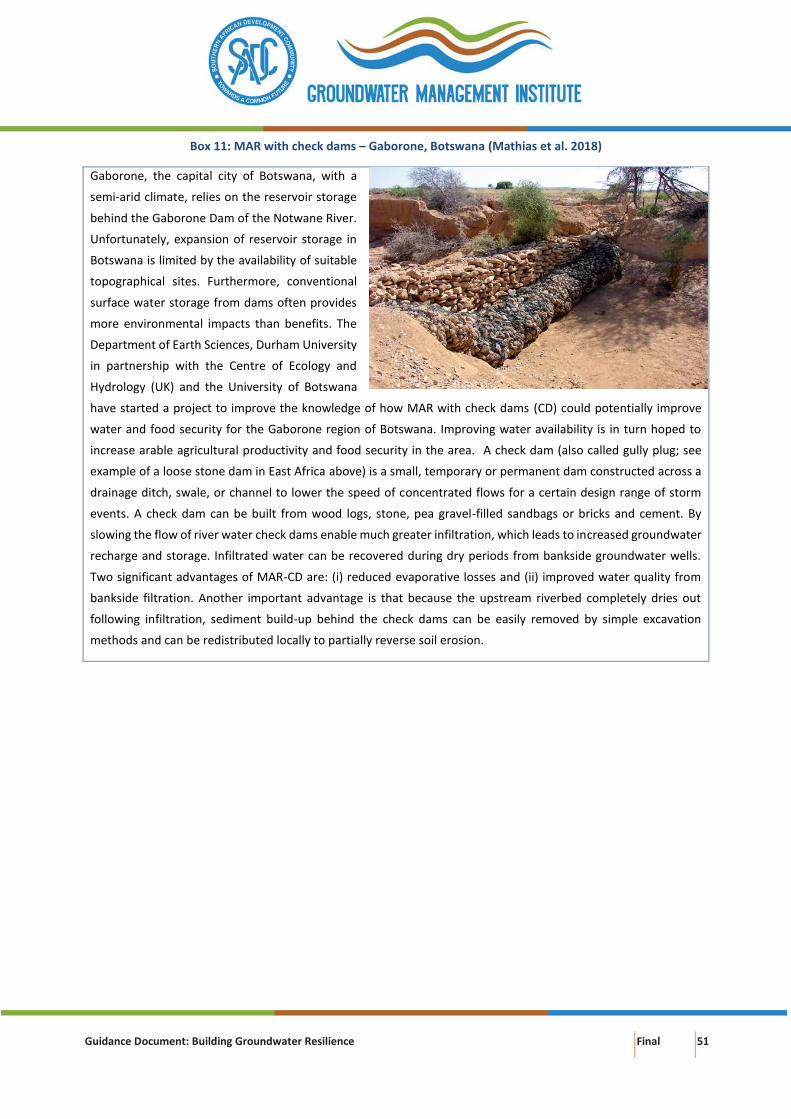
Box 11: MAR with check dams – Gaborone, Botswana ........................................................................ 51
Guidance Document: Building Groundwater Resilience Final xiii
LIST OF ACRONYMS
Acronym Definition
AWSS Atlantis Water Supply Scheme
MAR Managed Aquifer Recharge
NSC North-South Carrier
SADC Southern African Development Community
SADC-GMI Southern African Development Community
Groundwater Management Institute
mbgl Metres Below Ground Level
mg/ ℓ Milligram Per Litre
mm Millimetres
Mm3/a Million Cubic Metre Per Annum
t/ha Tons Per Hectare
Guidance Document: Building Groundwater Resilience Final 1
1. INTRODUCTION
The purpose of the document is to provide guidance to groundwater managers to understand and
implement measures related to the role of groundwater in water resilience (referred to hereafter as
groundwater resilience) as the Southern African Development Community (SADC) region is prone to
environmental, political, economic and social shocks and stresses (Box 1).
Box 1: Resilience systems different type of shocks and stresses (OECD 2014)
Resilience systems analysis considers different types of risks, shocks and stresses:
• Infrequent events with an impact on almost everyone in the target group, such as violent conflict,
volcanic eruptions or currency devaluations - covariate shocks
• Significant events that specifically affect individuals and families, such as the death of the main
breadwinner or the loss of income-generating activity - idiosyncratic shocks
• Seasonal shocks, such as annual flooding linked to the rainy season, food market price changes, or
recurring shocks such as frequent displacement or endemic cholera communities
• Long term trends, weakening the potential of a system and deepening the vulnerability of its actors,
like increased pollution, deforestation, exchange rate fluctuations and electoral cycles - stresses
Examples of recent shocks and stresses in the region include:
• Drought: The SADC-region has undergone severe droughts during the 2015/2016 and 2016/2017
summer rainfall seasons (Blamey et al. 2018; Siderius et al. 2018; Archer 2019; Nhamo and
Mabhaudhi 2019). In the past, droughts were driven by natural climate variability but with
anthropogenic influences the characteristics of droughts are changing to include a type of
drought that has a rapid onset and short duration (Yuan et al. 2018).
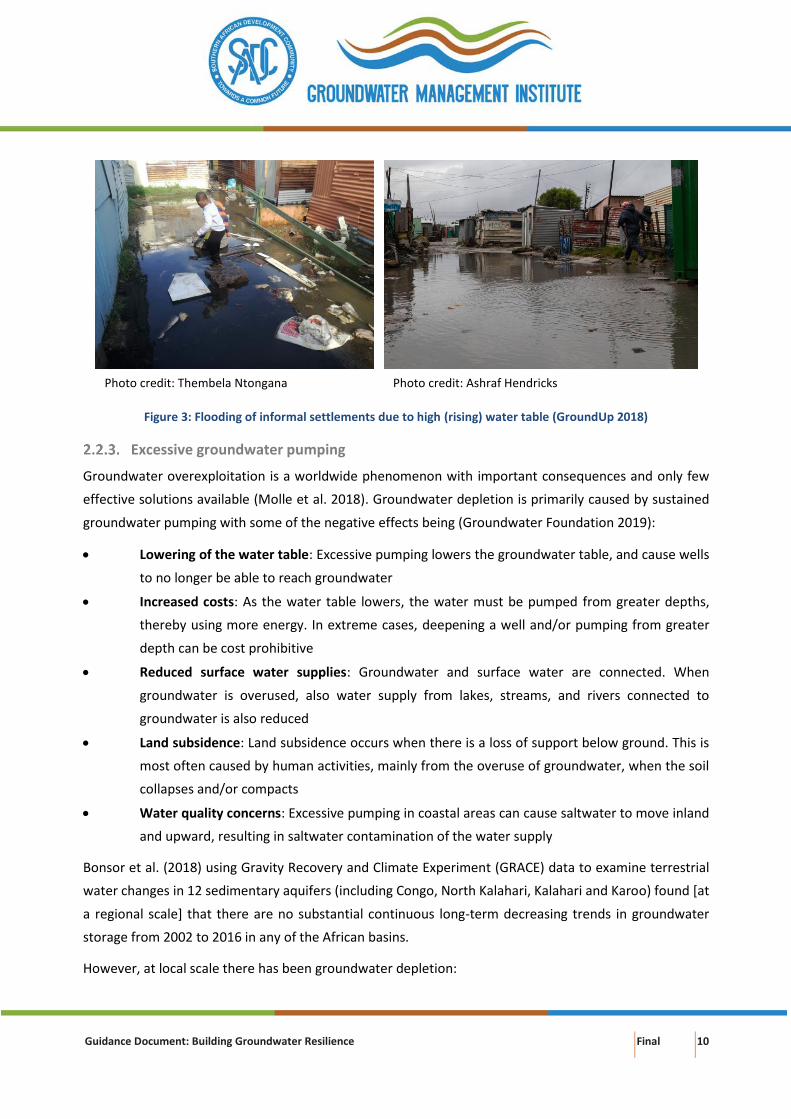
• Flooding: Widespread flooding over parts of Malawi, Mozambique, and Madagascar occurred in
January 2015 resulting in huge damage to property, infrastructure, and agriculture over several
regions in south-eastern Africa as well as significant loss of life (Rapolaki and Reason 2018). The
flooding was associated with tropical storm Chedza which developed in the Mozambique
Channel on 11 January 2015 (Rapolaki and Reason 2018), similar to tropical storm Idai and
Kenneth (Box 2).
• Disease: Rieckmann et al. (2018) compared cholera outbreaks during droughts and floods with
drought- and flood-free periods in 40 sub-Saharan African countries and found an increased
incidence rate of cholera outbreaks during droughts and floods. In Zimbabwe, the most recent
cholera outbreak began on 1 September 2018, in Harare. The Ministry of Health and Child Care
reported approximately 2,000 suspected cholera cases, of which 58 (2.9%) were confirmed cases,
and 24 (1.2%) resulted in death (WHO Regional Office for Africa 2018 in Ahmad et al. 2019).
Box 2: Tropical storms Idai and Kenneth (Brackett and Wright 2019; Oxfam Education 2019).
Guidance Document: Building Groundwater Resilience Final 2
Cyclone Idai made landfall in Mozambique on the
night of 14 to 15 March 2019 - this weather
system caused extensive damage in
Mozambique, Malawi and Zimbabwe. Strong
winds, a storm surge, heavy rains and
widespread flooding had devastating impacts.
More than 800 people died across the three
countries, with many more still missing and
millions of people left homeless without food or
basic services.
The UN Secretary General declared this “one of the worst-weather related catastrophes in the history of Africa”.
The cyclone that tore across southern Africa may have destroyed more than $1 billion of infrastructure. Tropical
storm Idai was quickly followed by tropical storm Kenneth – two major storms within two months. Tropical
Cyclone Kenneth destroyed hundreds of homes and killed at least six people in Mozambique. The Category 4-
equivalent storm brought flooding and landslides to the Indian Ocean archipelago nation of Comoros; local
authorities reported at least three deaths. Ninety percent of homes 'flattened' on the Mozambique tourist island
of Ibo.
Photo credit: Sergio Zimba/Oxfam
The capacity of social-ecological systems to deal with shocks, adapting to changing conditions and
transforming in situations of crisis are fundamentally dependent on the functions of water to regulate the
Earth’s climate, support biomass production, and supply water resources for human societies (Falkenmark
et al. 2019). Resilience systems analysis is increasingly applied to water governance to understand the
socio-ecological systems ability to recover from shocks and stresses. Thresholds or tipping points are
critical to understand as beyond these there is a point of no return. This document focusses on
groundwater systems ability to cope and recover from disturbances and measures which can be put in
place to support groundwater resilience. The guidance document has 8 Chapters (Table 1).
Guidance Document: Building Groundwater Resilience Final 3
Table 1: Structure of the Building Groundwater Resilience guidance document
Chapter Contents
1. Introduction This chapter presents the introduction to the guidance document.
2. Groundwater resilience In this chapter groundwater resilience is defined and the global environmental
and societal risks discussed. Further information is provided about the
groundwater risks related to droughts, floods, excessive groundwater pumping,
pollution and sea-level rise.
3. Absorptive capacity for
groundwater resilience
The natural absorptive capacity of groundwater resources is discussed in Chapter
3. Examples of absorptive capacity of groundwater resources include
groundwater storage availability and natural attenuation to pollution. Absorptive
capacity is clearly related to the duration and magnitude of any perturbation as
discussed in Chapter 3.
4. Conjunctive
management
Chapter 4 deals with conjunctive management of the combined use of
groundwater, surface water and other sources of water in a manner that
prevents irreversible impacts (quantity and quality) on either of the resources.
5. Management aquifer
recharge
Managed aquifer recharge (MAR) which is the replenishment of groundwater by
planned subsurface infiltration recovered at a later stage is discussed in Chapter
5.
6. Groundwater reuse and
recycling
Groundwater recharge with recycled water maximizes water reuse and should
form an integral part of water resource planning in major cities and towns of
SADC is discussed in Chapter 6.
7. Conclusions and
recommendations
The conclusions and recommendations are presented in Chapter 7.
8. References The references cited in the guidance document is presented in Chapter 8.
Guidance Document: Building Groundwater Resilience Final 4
2. GROUNDWATER RESILIENCE
Defining resilience
A risk is the likelihood of a negative event and its consequences. A shock occurs when a risk becomes
reality (OECD 2014). A fundamental principle of resilience is being able to respond and adapt to shocks
and stresses and to transform when conditions require it (Brown and Boltz 2016). In the World Economic
Forum (WEF) 2019 Global Risks Perception Survey, environmental risks have grown in prominence in
recent years with the five most prominent types of risks in the environmental category (extreme weather
events, natural disasters, failure of climate change mitigation and adaptation, man-made environmental
disasters and biodiversity loss and ecosystem collapse) being ranked higher than average for both
likelihood and impact over a 10-year horizon (WEF 2018; WEF 2019; Figure 1) compared to other risks.
Water crises1 have also been consistently ranked over the same time-period and defined as a societal
global risk in terms of likelihood and impact (Figure 1).
In the SADC-region, the global environmental and societal risks are predicted to put further pressure on
groundwater resources. The socio-economic drivers include (after Pegasys 2019):
• Water crises: SADC has about 280 million people of which 40% has no access to an adequate safe
drinking water supply, whilst 60% has no access to adequate sanitation service (SADC 2016). Like
the rest of Africa, urban population growth in SADC is outpacing economic, social and
institutional development (Bello-Schünemann and Aucoin 2016). Unplanned urban population
growth remains a serious threat to water security, especially in cities and informal settlements
of sub-Saharan Africa (Dos Santos et al. 2017). Kinshasa (Democratic Republic of Congo – DRC) is
already classed as a megacity with a population exceeding the 10 million mark with Johannesburg
(South Africa), Dar es Salaam (Tanzania), and Luanda (Angola) emerging as megacities by 2030
(United Nations 2016; Van Niekerk and Le Roux 2017). The high rate of urbanisation is already
putting strain on water infrastructure; poses problems for human and environmental health; and
disparate socioeconomic development and access to water; all resulting from governance failure
of water management institutions.
1 A significant decline in the available quality and quantity of fresh water, resulting in harmful effects on human health and/or economic activity (WEF 2018).
Guidance Document: Building Groundwater Resilience Final 5
• Groundwater recharge impacted by surface water use: damming rivers and abstracting water reduces
downstream flow for indirect groundwater recharge through riverbed infiltration (e.g. in arid and semi-
arid environments); irrigation excess and wastewater discharge are also sources of groundwater
recharge.
• Groundwater use, particularly from shallow unconfined aquifers, delays the timing and reduces the
amount of surface run-off in the rainy season and decreases baseflow in the dry season. Such baseflow
may be of critical importance especially during periods of low flow and in semi-arid climates.
• Groundwater may provide perennial water to groundwater dependent ecosystems and the
communities that survive from these resources.
• Interaction between surface and groundwater can cause pollution to be transferred from one to the
other. Groundwater pollution can persist for centuries thereby reducing water resources availability for
generations to come.
Opportunities for conjunctive management arise when (CapNet et al. 2010):
• Groundwater holds large volumes of water in storage, while surface water storage is moderate
or small. Surface water could be allocated during the rainy season and groundwater use could
be increased in the dry season. Groundwater volumes in storage can provide a buffer in times of
drought and water scarcity.
• Managed aquifer recharge (MAR) of sandy aquifers may be done with surplus surface water
during the wet season if there is excess flow (Chapter 0). Recharging aquifers in this way will not
only provide additional dry season water resources but will also allow for natural purification of
any bacterial contamination in the surface water.
Guidance Document: Building Groundwater Resilience Final 31
• Groundwater may be developed where demand is dispersed and moderate, while development
of surface water focuses on large-scale demand and irrigation development.
• Upstream and downstream interests: by considering the entire suite of water resources, both
surface and groundwater, along the length of a catchment, managers are better able to provide
for equitable upstream and downstream demands.
The potential for conjunctive use, e.g. in irrigated agriculture, varies with differing hydrogeological setting
(Box 5). The implementation choice therefore needs to be adapted to the prevalent conditions. It is best
implemented on the local level, as it is easier to identify the special needs and circumstances of the
community and monitoring at local level is more easily carried out (Waelti and Spuhler 2019).
Box 5: Variation of the dynamics and constraints of conjunctive use with hydrogeological setting (Foster et al.
2010)
Hydrogeological typology Examples Dynamics of conjunctive
use
Constraints on
conjunctive use
Upstream humid or arid
outwash Peneplain
Indian Punjab-Indus
Peneplain,
Upper Oases Mendoza-
Argentina,
Yaqui Valley,
Sonora-Mexico
deep groundwater table
with major groundwater
recharge from rivers and
unlined canals, where
river flow reduces
seasonally groundwater
use predominates
in more arid areas
widespread natural soil
salinity which can be
mobilised to groundwater
during irrigation
development and
requires careful
management
Humid but drought-prone
middle alluvial plain
Middle Gangetic Plain–
India,
Middle Chao Phyra Basin-
Thailand
shallow groundwater
table and surface water
and groundwater
resources generally freely
available
excessive recharge in
canal head-water sections
can lead to serious soil
waterlogging/salinity and
poor canal-water service
levels in tail-end sections
causing excessive
groundwater pumping
Hyper-arid middle alluvial
plain
Middle Indus Plain-
Pakistan,
Lower Ica Valley-Peru,
Tadla – Morocco,
Tihama - Yemen
major rivers and primary
irrigation canals generate
locally important fresh
groundwater recharge/
lenses, in some cases
further augmented by
spate irrigation
conjunctive use of
groundwater important
to counter rising water-
table problems, and
concomitantly reach
higher cropping intensity,
but extreme care needed
Guidance Document: Building Groundwater Resilience Final 32
Hydrogeological typology Examples Dynamics of conjunctive
use
Constraints on
conjunctive use
to avoid saline-water
encroachment
Downstream alluvial plain
or delta with confined
groundwater
Ganges Delta-Bangladesh,
Lower Oasis Mendoza-
Argentina,
Nile Delta-Egypt
irrigation predominantly
from major rivers and
associated canals but,
where seasonal river flow
reduction marked,
supplementary
groundwater irrigation
can be important
alluvial aquifers often
semiconfined by surficial
clayey silts (also
sometimes with saline
phreatic groundwater) –
thus water well use
constrained by recharge
limitation and sometimes
by saline-water
mobilisation
Irrigated agriculture
Conjunctive water management in shared water resources of the SADC region is steadily gaining ground,
as the understanding of the benefits of coordinated use and management of surface and groundwater
increases (Mukuyu 2018; SADC-GMI 2018). Changing climatic conditions and concerns around water
scarcity in the region has made conjunctive management a viable option to mitigate water variability and
food insecurity. From a groundwater perspective, groundwater storage of aquifers will act as a buffer to
water supply variability (from surface water), groundwater salinisation and waterlogging for sustained
agricultural production. Conjunctive management in SADC is not yet as advanced as in other parts of the
world but lessons can be drawn from experiences elsewhere (Box 6).
Guidance Document: Building Groundwater Resilience Final 33
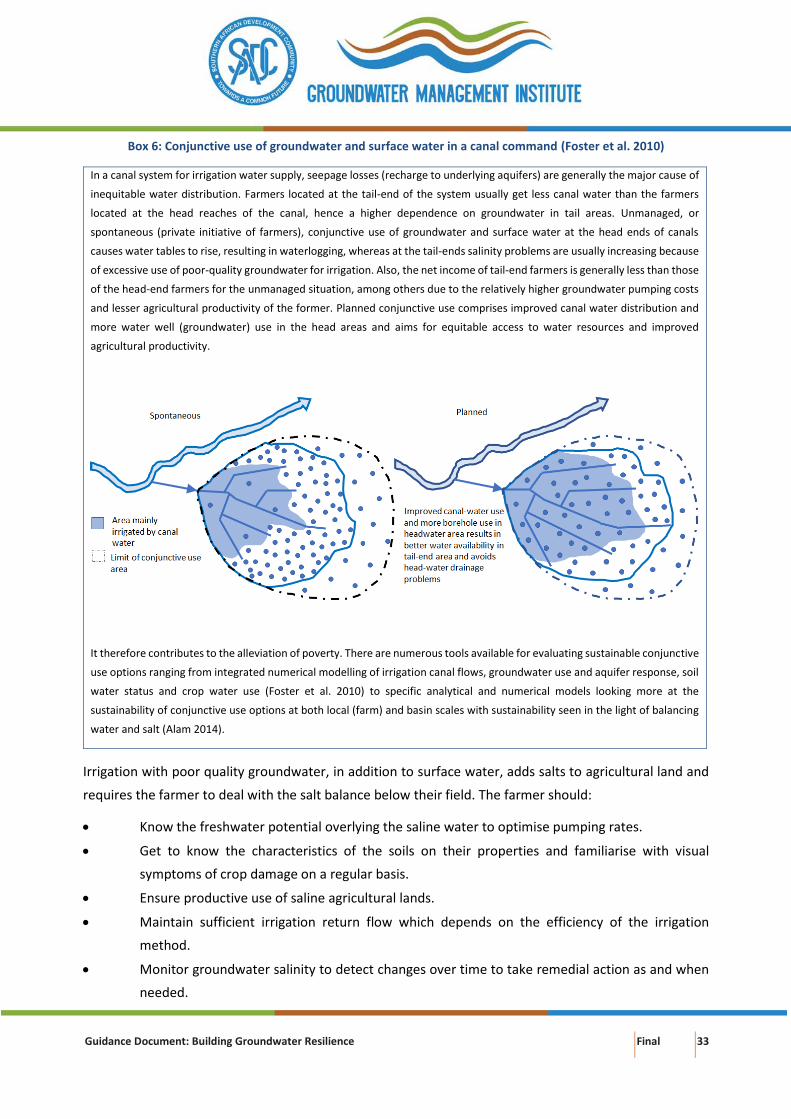
Box 6: Conjunctive use of groundwater and surface water in a canal command (Foster et al. 2010)
In a canal system for irrigation water supply, seepage losses (recharge to underlying aquifers) are generally the major cause of
inequitable water distribution. Farmers located at the tail-end of the system usually get less canal water than the farmers
located at the head reaches of the canal, hence a higher dependence on groundwater in tail areas. Unmanaged, or
spontaneous (private initiative of farmers), conjunctive use of groundwater and surface water at the head ends of canals
causes water tables to rise, resulting in waterlogging, whereas at the tail-ends salinity problems are usually increasing because
of excessive use of poor-quality groundwater for irrigation. Also, the net income of tail-end farmers is generally less than those
of the head-end farmers for the unmanaged situation, among others due to the relatively higher groundwater pumping costs
and lesser agricultural productivity of the former. Planned conjunctive use comprises improved canal water distribution and
more water well (groundwater) use in the head areas and aims for equitable access to water resources and improved
agricultural productivity.
It therefore contributes to the alleviation of poverty. There are numerous tools available for evaluating sustainable conjunctive
use options ranging from integrated numerical modelling of irrigation canal flows, groundwater use and aquifer response, soil
water status and crop water use (Foster et al. 2010) to specific analytical and numerical models looking more at the
sustainability of conjunctive use options at both local (farm) and basin scales with sustainability seen in the light of balancing
water and salt (Alam 2014).
Irrigation with poor quality groundwater, in addition to surface water, adds salts to agricultural land and
requires the farmer to deal with the salt balance below their field. The farmer should:
• Know the freshwater potential overlying the saline water to optimise pumping rates.
• Get to know the characteristics of the soils on their properties and familiarise with visual
symptoms of crop damage on a regular basis.
• Ensure productive use of saline agricultural lands.
• Maintain sufficient irrigation return flow which depends on the efficiency of the irrigation
method.
• Monitor groundwater salinity to detect changes over time to take remedial action as and when
needed.
Guidance Document: Building Groundwater Resilience Final 34
Leaching of salts from the root-zone, e.g. by flood MAR (Chapter 0), remains the most effective salt
management measure from an agricultural perspective. Best leaching of salts from the topsoil occurs when
the soil profile is near saturation and the water applied has little salt and water is applied slowly and evenly,
either by rainfall or irrigation. Box 7 presents a simple guideline for the calculation of a critical abstraction
rate Q (m3/day) for a single borehole (with no interference from neighbouring boreholes) for
homogeneous unconsolidated sediments beyond which there will be ingress of saline water into the
borehole when only taking into account the density difference between fresh and saline water. The
calculated critical abstraction rate should be considered a maximum rate as in reality dispersion
characteristics of the porous medium will mostly determine, and lower, this rate. The guideline is useful
for a first estimate of a maximum abstraction rate if there is a risk of up-coning or ingress of underlying
saline water.
Box 7: Up-coning of saline water – critical abstraction rate
The critical abstraction rate Qmax is a function of the horizontal hydraulic conductivity Kh (m/day), the Total Dissolved Solids of the deeper and underlying salt water (TDS) and L the distance between the fresh-salt water interface and the bottom of the borehole:
Q
max ~ 1.12x10⁻⁶ K
h TDS
saltwater L2
• Steady horizontal flow of freshwater to the borehole
• No lateral movement of saltwater; sharp freshwater-saltwater interface; t (time) = ∞ (infinite)
• Q in m3/day; Kh in m/day; TDS in mg/L; Z = 0.25 L in m
For a specific Kh, a graph can be constructed using the above equation to estimate Qmax such as the graph below for Kh = 30m/day and for different TDS and L. If for example L=40 m and TDS=4000 mg/l (Kh=30 m/day), Qmax=200 m3/day (follow the red dotted line and arrows in the graph).
Guidance Document: Building Groundwater Resilience Final 35
Modified after Bear and Dagan, 1968 in Bouwer, 1978.
0
100
200
300
400
500
600
700
800
900
1000
0 10 20 30 40 50
Q (
m3/d
ay)
L (m)
1000
2000
3000
4000
5000
6000
7000
8000
9000
10000
TDS (mg/l)
Guidance Document: Building Groundwater Resilience Final 36
Figure 16 presents an overview of the benefits from improved planning and management of conjunctive
water use for irrigated agriculture such as increased agricultural productivity, improved flood
management, and improved drinking water quality. The benefits also vary with hydrogeological setting.
Figure 16: Benefits of conjunctive use of groundwater and surface water for irrigated agriculture (modified from
Foster et al. 2010)
Urban water supply
In rapidly-expanding cities, conjunctive use of groundwater and surface water is often unplanned and
includes ‘traditional’ groundwater sources (springheads or water wells) at the urban nucleus and
immediately neighbouring surface watercourses either one of which subsequently become insufficient
with urban growth (Figure 17). Criteria on which a planned operational strategy of urban conjunctive use
is normally based include (Foster et al. 2010;Figure 18):
• Abstract preferentially from the river whilst its flow-level is above the minimum required for
‘downstream’ wastewater assimilation and dilution and/or ecological interests (except where
river water is periodically not treatable because of high suspended solids and/or pollution)
Guidance Document: Building Groundwater Resilience Final 37
• Use water wells at other times, especially during extended drought when surface-water
availability is limited – whenever possible ensuring that the impact of water well abstraction is
mainly delayed until higher river flow periods.
Figure 17: Conjunctive use of groundwater and surface water for urban water supply (Foster et al. 2010)
Figure 18: Typical hydrological modifications caused by successful conjunctive use of groundwater and surface-
water resources for urban water-supply (Foster et al., 2010)
Guidance Document: Building Groundwater Resilience Final 38
Only in a few cases, the use of groundwater has evolved as part of planned urban water-supply
development (e.g. Atlantis – South Africa, Box 8), but more often it has occurred in response to water
shortage or service deficiency, and often through private initiative (e.g. Lusaka, Dar-es-Salaam, Cape Town,
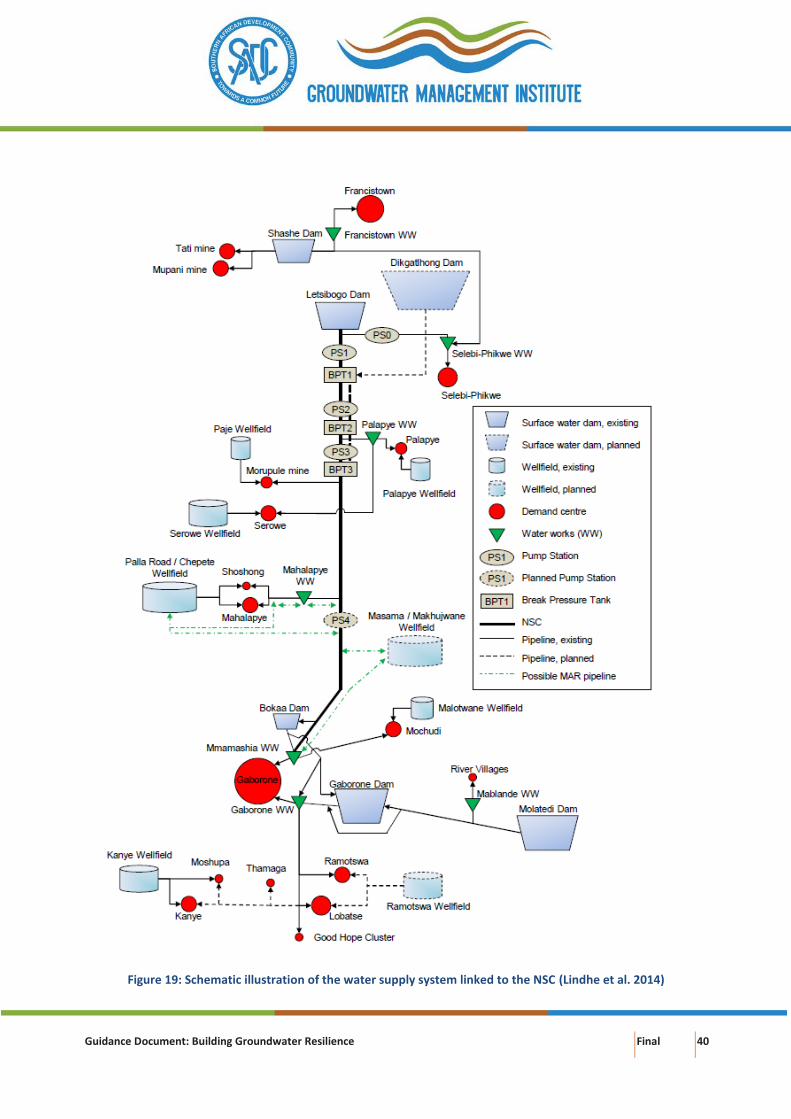
Windhoek and Gaborone and probably elsewhere). An example of conjunctive use is the North-South
Carrier (NSC), which is a bulk water supply system running from north to south in eastern Botswana,
connecting a number of surface water dams, groundwater aquifers and water treatment facilities (Lindhe
et al. 2014). The NSC system includes:
• 6 surface water dams
• 8 wellfields
• 7 water works
• 18 demand centres
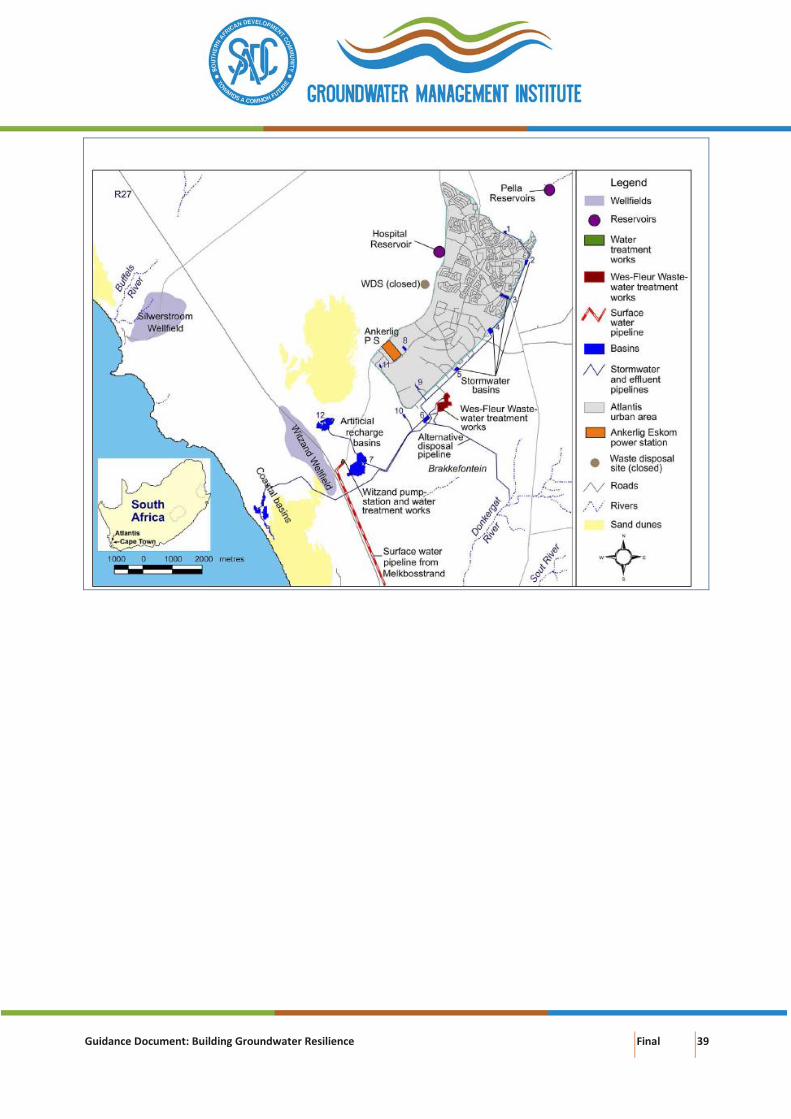
Box 8: Atlantis planned urban water supply (Buchan et al., 2016)
The primary aquifer at Atlantis (Western Cape, South Africa) is ideally suited for water supply and the indirect
recycling of urban stormwater runoff and treated domestic wastewater for potable purposes. The relatively thin,
sloping aquifer requires careful management of artificial recharge and abstraction for balancing water levels.
Water quality management is a further key issue at Atlantis for ensuring the highest quality potable water.
Groundwater quality varies from point to point in the aquifer, while urban runoff and wastewater qualities vary
greatly. The layout of the town allows for the separation of stormwater from the residential and industrial areas
as well as separate treatment of domestic and industrial wastewater. This permits safe artificial recharge of the
various water quality portions at different points in the aquifer, either for recycling or for preventing seawater
intrusion. Lessons learnt from the Atlantis experience can be transferred to other potential sites for establishment
of similar systems in arid and semi-arid areas of Southern Africa.
Guidance Document: Building Groundwater Resilience Final 39
Guidance Document: Building Groundwater Resilience Final 40
Figure 19: Schematic illustration of the water supply system linked to the NSC (Lindhe et al. 2014)
Guidance Document: Building Groundwater Resilience Final 41
Requirements for conjunctive management
Conjunctive water management requires:
• A proper institutional framework comprising a regulatory body to control water distribution,
groundwater use and groundwater abstraction. The institutional framework should focus on
water agencies at local and provincial levels capable of implementing Integrated Water
Resources Management, and water user associations representing the stakeholders
• Minimum standards for sustainable conjunctive use of groundwater and surface water.
• Public awareness raising on the beneficial concept of conjunctive water use
• Capacity building of stakeholders to manage groundwater resources
• Implementation of solutions for sustainable groundwater use and groundwater abstraction
Guidance Document: Building Groundwater Resilience Final 42
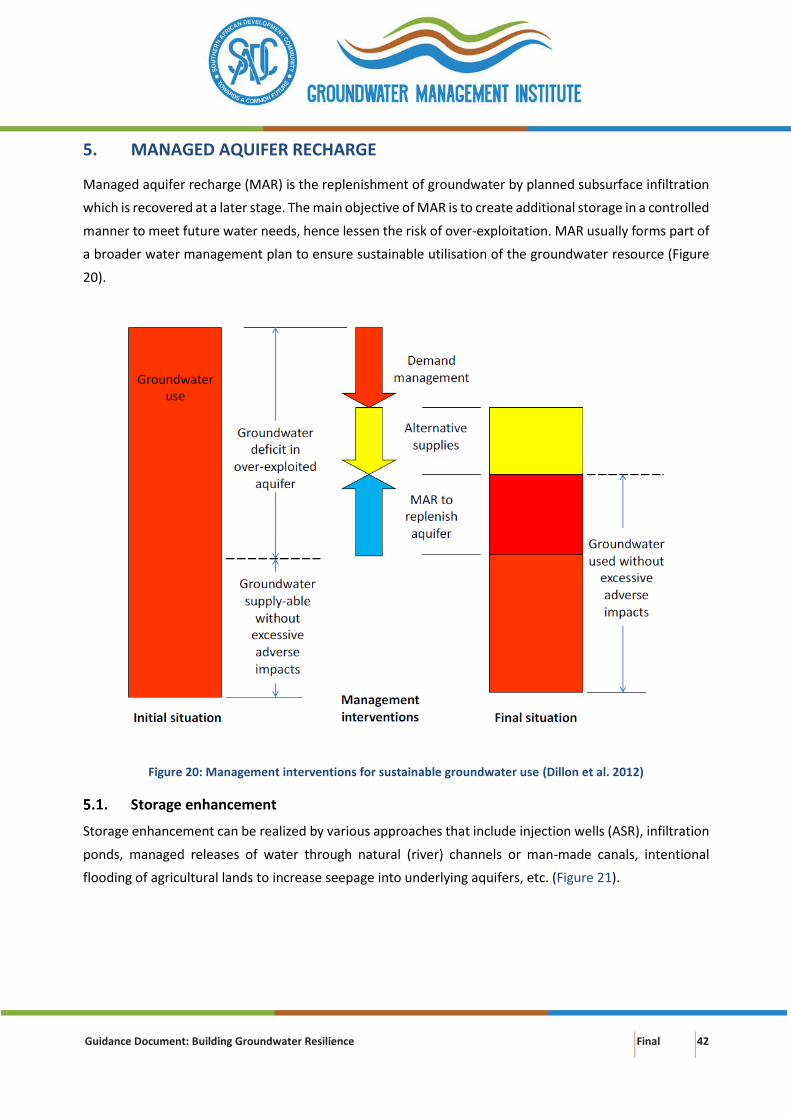
5. MANAGED AQUIFER RECHARGE
Managed aquifer recharge (MAR) is the replenishment of groundwater by planned subsurface infiltration
which is recovered at a later stage. The main objective of MAR is to create additional storage in a controlled
manner to meet future water needs, hence lessen the risk of over-exploitation. MAR usually forms part of
a broader water management plan to ensure sustainable utilisation of the groundwater resource (Figure
20).
Figure 20: Management interventions for sustainable groundwater use (Dillon et al. 2012)
Storage enhancement
Storage enhancement can be realized by various approaches that include injection wells (ASR), infiltration
ponds, managed releases of water through natural (river) channels or man-made canals, intentional
flooding of agricultural lands to increase seepage into underlying aquifers, etc. (Figure 21).
Guidance Document: Building Groundwater Resilience Final 43
Figure 21: Schematic of types of managed aquifer recharge ( adapted from Dillon 2005 as cited by Dillon et al.,
2012)
Groundwater replenishment can also occur indirectly as a secondary benefit of specific actions, including
deep percolation from applied irrigation water and water placed into unlined conveyance canals.
Guidance Document: Building Groundwater Resilience Final 44
In the light of climate change and population growth there is an increasing need to secure city water
supplies, especially cities that are affected to a large extent by seasonal variations in water sources in
addition to inter-annual variability (Dillon et al. 2009). Cities with prolonged dry periods or with low ratio
of mean annual rainfall to evaporation have a greater need for water storage, than wetter cities with more
uniform rainfall. A 25% reduction in rainfall near Perth, Australia, resulted in more than 50% reduction in
stormwater runoff from rural water supply catchments. In urban catchments, annual runoff is expected to
decline by the same proportion as rainfall, hence the relative efficiency of urban catchments to rural
catchments will increase as water supplies become more stressed, and MAR could play a role in averting
the need to augment urban stormwater systems.
Figure 22 shows two examples of MAR systems under different hydrogeological settings near an urban
area.
Figure 22: Aquifer Storage and Recovery (a) and Soil Aquifer Treatment (b) (Dillon et al., 2009)
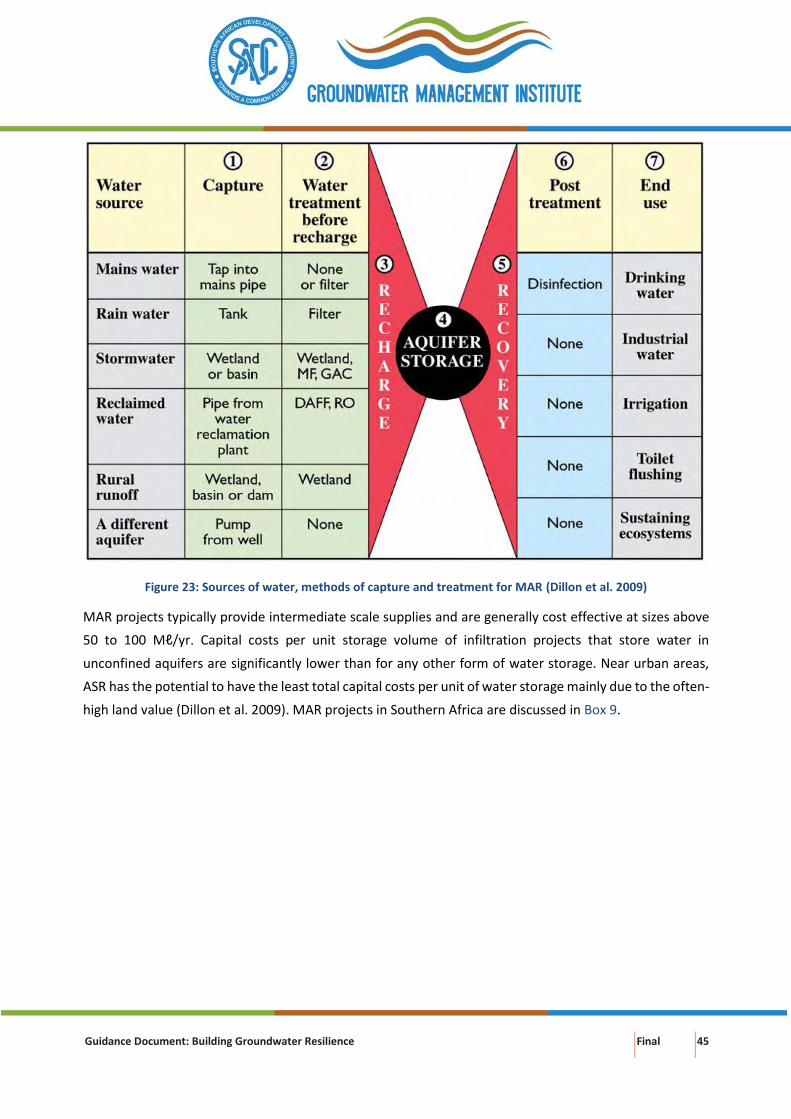
The seven elements common to all types of MAR projects depicted in Figure 22 are explained in Figure 23.
Guidance Document: Building Groundwater Resilience Final 45
Figure 23: Sources of water, methods of capture and treatment for MAR (Dillon et al. 2009)
MAR projects typically provide intermediate scale supplies and are generally cost effective at sizes above
50 to 100 Mℓ/yr. Capital costs per unit storage volume of infiltration projects that store water in
unconfined aquifers are significantly lower than for any other form of water storage. Near urban areas,
ASR has the potential to have the least total capital costs per unit of water storage mainly due to the often-
high land value (Dillon et al. 2009). MAR projects in Southern Africa are discussed in Box 9.
Guidance Document: Building Groundwater Resilience Final 46
Box 9: MAR in Southern Africa (Murray 2016; Murray et al. 2018)
In the early to mid-1900s sand storage dams were constructed in stages in Namibia for the storage of water in
“artificial” aquifers and in South Africa the Atlantis scheme near Cape Town started infiltrating storm run-off and
treated wastewater in 1979. In addition to these, farmers over the years have built numerous earth dams for the
purpose of enhancing groundwater recharge. In recent times a major borehole injection scheme for the City of
Windhoek, Namibia was constructed, and the South African government developed and rolled-out its national
MAR strategy.
The Windhoek’s MAR scheme involves large-scale borehole injection and recovery in a highly complex, fractured
quartzite aquifer. The first injection boreholes were commissioned in 2005. Its current injection capacity is 420
m3/hr and with the new boreholes that have been drilled, this will increase to over 1 000 m3/hr.
Besides the larger schemes of Windhoek and Atlantis mentioned above, a few small-medium scale MAR schemes
have been implemented in South Africa (mostly borehole injection), and several feasibility studies have been
conducted with the intention of implementation in the near future. In addition to these a major feasibility study
was undertaken for the Botswana government with the aim of assessing the value of MAR for the more industrious
eastern part of the country. In most cases, the main purpose of MAR in Southern Africa is to augment water
supplies and to enhance water security.
Guidance Document: Building Groundwater Resilience Final 47
Basin infiltration is a more cost-effective MAR approach for irrigated agriculture in rural areas. The farmer
must first consider access to recharge water and conveyance to the recharge area. Farms that are adjacent
to rivers and irrigation canals2 are more fortunate than areas lacking surface water conveyance facilities
which may constrain MAR implementation. There are several factors that determine the feasibility of MAR
on agricultural land (Geen et al. 2015):
• Deep percolation: Soils must be readily able to transmit water beyond the root zone.
• Root zone residence time: The duration of saturated/near saturated conditions after water
application must be acceptable for the crops grown on lands under consideration for MAR for
the entire crop root zone.
• Topography: Slopes that negatively influence the even distribution of water will be more difficult
to manage.
• Chemical limitations: High soil salinity and sodicity may result in saline leachate (poor water
quality) that must be avoided to protect and sustain good groundwater quality.
• Soil surface condition: Certain soils may be susceptible to compaction and erosion if large
volumes of water are applied. Surface horizons with high sodium are prone to crusting that may
contribute to decreased surface infiltration rates.
The following actions are proposed that farmers can take to enhance fresh groundwater storage:
• Review suitability of crops and farming practices for on-farm groundwater recharge by
flood/streamflow retention and aquifer storage and recovery techniques.
• Consider differentiated use of groundwater and surface water to optimise water quantity and
quality
Murray (2017) furthermore formulated key questions related to a wide range of topics from
engineering/environmental to legal/institutional/socio-economic perspectives that need to be addressed
prior to embarking on a MAR project (Table 3).
Table 3: Key questions to be addressed for MAR projects (Murray 2017)
Topic Some key questions
1. The need for the scheme • Is artificial recharge really necessary?
• Could you not increase your groundwater yield by
expanding the wellfield or by managing existing
wellfields better?
2 There may be a governance issue at play – as surface water is a public good but groundwater considered private water.
Guidance Document: Building Groundwater Resilience Final 48
Topic Some key questions
2. The source water • What volume of water is available for recharge,
and when is it available?
3. Aquifer hydraulics • Will the aquifer receive and store the water?
4. Water quality • Is the quality of the source water suitable for
artificial recharge?
5. Engineering issues • How will the water be transferred into the
aquifer?
6. Environmental issues • What are the potential environmental benefits,
risks and constraints?
7. Legal and regulatory issues • What type of authorisation is required?
8. Economics • How much will the scheme cost, how much will it
cost to operate it, and what will the cost of
supplied water per m3 be?
9. Management and technical capacity • What skills are required to operate the scheme,
and are they available?
10. Institutional arrangements • Who will be responsible for supplying the source
water and ensuring its quality is suitable for
recharge?
• Are there other users of the aquifer?
• Who will regulate the use of the scheme?
Flood mitigation (Green infrastructure)
Urban stormwater, rainwater that runs off urban surfaces such as roofs, pavements, car parks, and roads,
flows into storm water drains, creeks and rivers and forms part of the fresh water that ultimately flows to
estuaries and the ocean.
Stormwater in urban areas is usually abundant but may require treatment and storage before reuse (Page
et al. 2018). The primary limitation to storm water harvesting and reuse in urban areas is the ability to
store the water from runoff events in the wet season for subsequent use when water is in demand,
typically during the dry season. MAR can provide an economical method of storing and treating
stormwater in urban areas. Common uses of stormwater recycled via an aquifer include the irrigation of
parks and gardens, ovals and golf courses, other municipal and commercial purposes, and drinking water.
Guidance Document: Building Groundwater Resilience Final 49
With increasing adoption of MAR, green infrastructure3 and water-sensitive urban design practices, the
quality of urban stormwater and the quantity of harvestable should improve, and with tightening
requirements on urban (coastal) water quality, investments in wastewater, will make more water available
for use and for storage. These practices also contribute to mitigating floods and flood damage.
In the context of irrigated agriculture, flood MAR (including spate irrigation; see Latif 2015) purposefully
captures water from flood events and spread over land using diversion structures. Kocis and Dahlke (2017)
studied the magnitude, frequency, duration, and timing of high-magnitude flow (i.e. flow above the 90th
percentile) in the Central Valley, California, in order to assess the physical availability of surface water for
groundwater banking and found that these flows could provide enough water to balance more than two
times the annual groundwater overdraft. Similarly, wet years can provide over four times the average
annual groundwater overdraft.
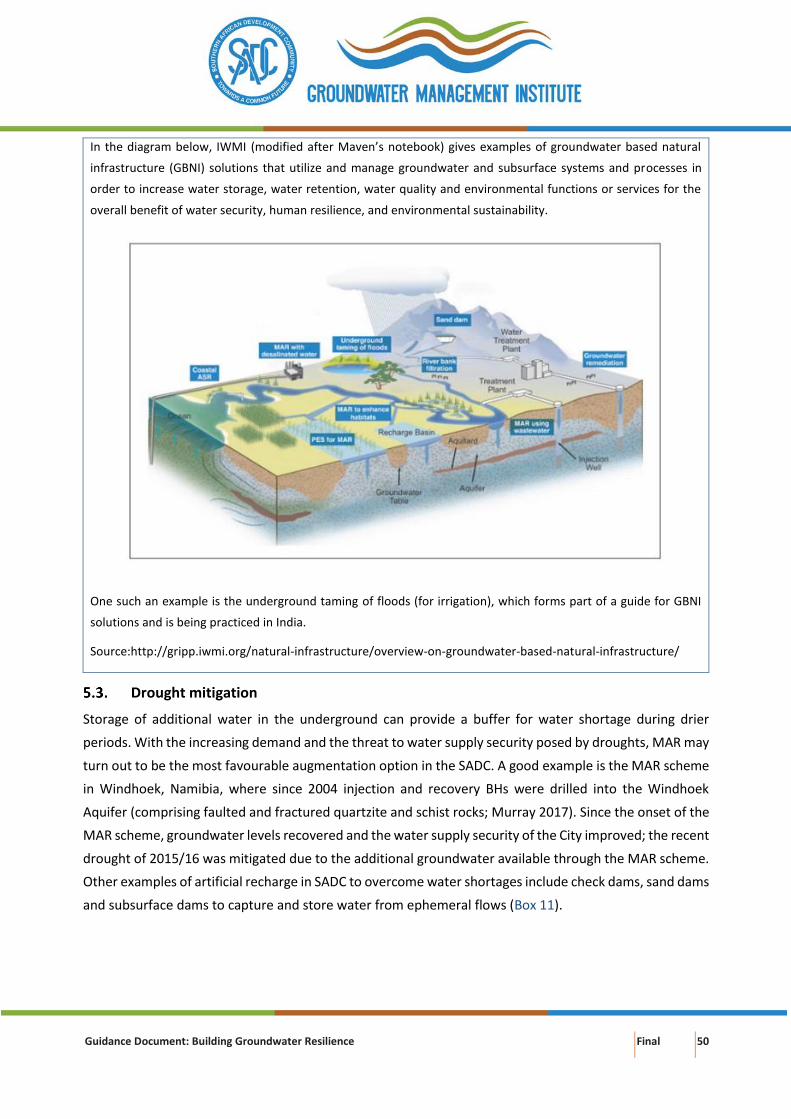
In Box 10 groundwater based natural infrastructure (GBNI) solutions are presented to increase water
storage, water retention, water quality and environmental functions or services.
Box 10: Examples of GBNI solutions
3 Green infrastructure uses vegetation, soils, and other elements and practices to restore some of the natural processes required to manage water and create healthier urban environments. At the city scale, green infrastructure is a patchwork of natural areas that provides habitat, flood protection, cleaner air, and cleaner water.