132
vol. 35 no. 2 2009 POLISH ACADEMY OF SCIENCES INSTITUTE OF ENVIRONMENTAL ENGINEERING COMMITTEE OF ENVIRONMENTAL ENGINEERING ARCHIVES OF ENVIRONM`ENTAL PROTECTION

1
vol. 35 no. 2 2009
POLISH ACADEMY OF SCIENCESINSTITUTE OF ENVIRONMENTAL ENGINEERINGCOMMITTEE OF ENVIRONMENTAL ENGINEERING
ARCHIVES OFENVIRONM`ENTAL PROTECTION

2
ARCHIVES OF ENVIRONMENTAL PROTECTIONvol. 35 no. 2 2009
3
15
27
41
53
67
75
87
97
105
115
125
CONTENTS
Structure of Atmospheric Aerosol in Upper Silesia (Poland) – Contribution of PM2.5 to PM10 in Zabrze, Katowice and Częstochowa in 2005–2007 – Krzysztof Klejnowski, Wioletta Rogula-Kozłowska, Andrzej Krasa . . . . . . .
Advanced Oxidation of Diclofenac in Various Aquatic Environments – Ewa Felis, Jarosław Wiszniowski, Korneliusz Miksch . . . . . . . . . . . . . . . . . . . . . .
Influence of Fishery Management and Environmental Factors on Occurrence of Heterotrophic, Hemolytic and Mesophilic Bacteria and Aeromonas Hydrophila in Waters of the Drwęca River, Poland – Iwona Gołaś, Karol Korzekwa, Monika Harnisz, Izabella Zmysłowska, Mariusz Teodorowicz, Elżbieta Terech-Majewska, Wiesława Rodziewicz, Mariola Bieńkowska . . .
Characteristic of Granulated Activated Sludge Fed with Glycerin Fraction from Biodiesel Production – Agnieszka Cydzik-Kwiatkowska, Andrzej Białowiec, Irena Wojnowska-Baryła, Lech Smoczyński . . . . . . . . . . . . . . . . .
Formation of the Activated Sludge Biocenosis during Landfill Leachate Pre-Treatment in SBR – Mirosław Szyłak-Szydłowski, Anna Grabińska-Łoniewska . . . . . . . . . . . . . . . . . . . . . . . . . . . . . . . . . . . . . . . . . . . . . . . . . . . .
Phosphorus Release from Lake Bottom Sediments Affected by Abiotic Factors – Tadeusz Sobczyński . . . . . . . . . . . . . . . . . . . . . . . . . . . . . . . . . . . .
Effects of Gneiss Mining on Water Quality – Mladen Zelenika, Božo Soldo, Damir Štuhec . . . . . . . . . . . . . . . . . . . . . . . . . . . . . . . . . . . . . . . . . . . . . . . . . .
Technogenic and Geogenic Magnetic Susceptibility of Mountain Forest Soils on Example of Forest Division Kamienna Góra – Adam Łukasik, Zygmunt Strzyszcz. . . . . . . . . . . . . . . . . . . . . . . . . . . . . . . . . . . . . . . . . . . . . .
Heavy Metals and Selected Physicochemical Properties of Rendzic Leptosols of the Ponidzie Region (Southern Poland) – Anna Świercz . . . . . . . . . . . .
The Influence of the Method of Reclamation and Selection of Tree Species for Afforestation on Changes in Landscape Degraded by Fire – Elżbieta Jolanta Bielińska, Agnieszka Mocek-Płóciniak . . . . . . . . . . . . . . . . . . . . . . . .
The Removal of Cr(VI) from the Aqueous Solution by Granular Ferric Hydroxide (GFH) – Bai Yuan, Bronisław Bartkiewicz . . . . . . . . . . . . . . . . .
Polychlorinated Dibenzo-p-Dioxins (PCDDs) and Polychlorinated Dibenzofurans (PCDFs) Compounds in Sediments of Two Shallow Reservoirs in Central Poland – Magdalena Urbaniak, Marek Zieliński, Wiktor Wesołowski, Maciej Zalewski . . . . . . . . . . . . . . . . . . . . . . . . . . . . . . .
PL ISSN 0324-8461

3
PL ISSN 0324-8461
© Copyright by Institute of Envionmental Engineering of the Polish Academy of Sciences, Zabrze, Poland 2009
ARCHIVES OF ENVIRONMENTAL PROTECTIONvol. 35 no. 2 pp. 3 - 13 2009
STRUCTURE OF ATMOSPHERIC AEROSOL IN UPPER SILESIA (POLAND) – CONTRIBUTION OF PM2.5 TO PM10
IN ZABRZE, KATOWICE AND CZĘSTOCHOWA IN 2005–2007
KRZYSZTOF KLEJNOWSKI*, WIOLETTA ROGULA-KOZŁOWSKA, ANDRZEJ KRASA
Institute of Environmental Engineering of the Polish Academy of Sciencesul. M. Skłodowskiej-Curie 34, 41-819, Zabrze, Poland
* Corresponding author e-mail: [email protected]
Keyword: PM10, PM2.5, dust fraction, suspended dust, dust concentrations, particles, winter season, summer season.
Abstract: The PM2.5/PM10 ratio expresses the anthropogenic share in atmospheric dust. Very high values of this ratio, i.e. high contribution of PM2.5 to PM10, have occurred recently in atmospheric air within European industrialized areas. The paper compiles results of three year pair wise measuring of concentrations of PM2.5 and PM2.5–10 and compares shares of PM2.5 in PM10 at three urban background sites in Upper Silesia Poland (towns of Zabrze, Katowice and Częstochowa). At all the three locations, the PM2.5/PM10 ratio of daily con-centrations of dust only occasionally differed considerably from the PM2.5/PM10 ratios for the seasonal and yearly concentrations that, in turn, did not differ from the PM2.5/PM10 ratios at urban sites in Europe.
INTRODUCTION
The size of ambient particles depends on their origin. Almost all their properties, their impact on the environment or health – on their size. The smaller they are the farther from their source they float [8] and more deeply penetrate lungs.
Therefore, most often the ambient dust is classified by size of its particles. The am-bient air contains particles of aerodynamic diameters from 0.002 to 100 μm [21], but in most cases, due to their influence on the chemistry of atmosphere, their physical proper-ties and significance to human health, it is necessary and sufficient to consider the two main fractions:
− fine dust, PM2.5 – particles of aerodynamic diameter not exceeding 2.5 μm, most often related to combustion, may be of primary (from a source) or secon- dary (from chemical reactions in the atmosphere) origin [4, 6];

4 KRZYSZTOF KLEJNOWSKI, WIOLETTA ROGULA-KOZŁOWSKA, ANDRZEJ KRASA
− coarse dust, PM2.5–10 – particles of aerodynamic diameter between 2.5 and 10 μm, mainly from mechanic processes, includes also pollens and spores;
− and their sum, PM10, i.e. particles of aerodynamic diameter not exceeding 10 μm.
According to the data published by the European Commission [4], the concentration of PM2.5 plays the key role in assessment of the health hazard from air pollutants. For some last few years, PM2.5 in Europe has been investigated quite thoroughly [2, 18, 22]. Many studies yield close or identical PM10 and PM2.5 concentrations [1, 7] i.e. negligi-ble PM2.5–10 mass. Therefore, replacement of the PM10 limit values with standards for PM2.5 and intensified researches on PM2.5–10 to recognize relations between both frac-tions seem to be necessary. They may help to limit emission of the dominating fraction in areas threatened by violation of the PM standards.
In the presented work, results from three years of simultaneous measurements of PM2.5 and PM2.5–10 are exploited to compare shares of PM2.5 in PM10 at three dif-ferent urban background sites (Zabrze, Katowice, Częstochowa). The specific conditions, different from conditions in other parts of Europe or Poland, affecting emission of PM were the reason for choosing the investigation areas. While emission of PM (both primary and secondary) in most European countries comes from traffic [3, 9, 24, 25], in Poland, especially in urban areas, municipal and industrial emission dominates [5, 16, 17, 19, 20].
SAMPLING SITES
The measurements were carried out during 2005–2007 period in three towns:1. Zabrze – the western part of the Upper Silesian agglomeration – the measuring point
was located in the premises belonging to the Institute of Environmental Engineer-ing, M. Skłodowskiej-Curie 34, in the town centre. About 500 m north there is a four-lane, quite busy, national 88 road. About 500 m east, behind not very trafficked six-lane Korfanty Lane; high blocks of flats and houses are situated. Towards the south and south-east stretches the diversified housing and industry of the Zabrze downtown. In the west, the Institute borders with high blocks of the M. Skłodowska-Curie housing estate. The surrounding buildings are heated by the central network or by combusting hard coal.
2. Częstochowa – the northern part of the Silesian region – the measuring point was located within premises belonging to the Regional Inspectorate of Environmental Protection, Rząsawska Street 24–28, in Wyczerpy, the north-eastern part of Częstochowa. About 100 m away, there is Rząsawska Street – a local road with moderate traffic. The sampler was located on a grassy yard in front of the building of the Regional Inspectorate of Environmental Protection. The site is neither affected by traffic nor by industry. In the adjacent areas there are large storehouses.
3. Katowice – the central part of the Upper Silesian agglomeration – the measuring point was located within premises belonging to the Institute for Ecology of Industrial Areas, Kossutha Street, the Witos residential quarter, the western part of Katowice.

5STRUCTURE OF ATMOSPHERIC AEROSOL IN THE UPPER SILESIAN AGGLOMERATION ...
Blocks of flats, railway line, the DTŚ highway and the Tysiąclecia housing estate in the north, market areas in the east, the Witos quarter in the south and in the west living quarters and industrial terrains abandoned by the hard coal mine “Kleofas” surround the site.All the sites represent urban background conditions. They are surrounded by hous-
ing estates and blocks of flats. Each site lies about 500 m away from a busy road which might be also a source of suspended dust. All the three points are described in [10–15].
Concentrations of PM2.5 and PM2.5–10 in Zabrze were measured from April to December 2006 and during every second month, starting from January, in 2007. In Kato-wice, the concentrations were measured every second month of 2007 starting from Febru-ary. In Częstochowa – during the whole year 2005 except for maintenance break.
Arrangement of the measuring points within Silesia is presented in Figure 1.
Fig. 1. Location of the measuring sites
METHOD
Application of a sequential two-channel Rupprecht and Patashnick’s Dichotomus Partisol®Plus 2025 sampler allowed to pair wise measuring of concentrations of coarse (PM2.5–10) and fine (PM2.5) particles. PM2.5–10 was collected on glass, PM2.5 on Teflon filters. The stream of dust was split into two fractions by a virtual impactor. The sampler recorded the meteorological parameters and volume of sucked air. PM2.5/PM10 ratio, concentrations of PM10 and statistical parameters of series of results were com-puted. Concentrations were determined gravimetrically (Mettler Toledo micro scales, electric charge neutralizer) according to the method described in [19–25].
Air humidity and temperature in the weighing room were controlled and kept equal to about 50% and 20°C, respectively. Before weighing, filters were conditioned for 48 hours in the weighing room.

6
RESULTS
CzęstochowaTable 1 presents basic statistical parameters of the series of PM2.5, PM2.5–10, PM10 concentrations and PM2.5/PM10 ratios for Częstochowa in 2005.
Table 1. Statistical parameters of the series of daily dust concentrations in Częstochowa, 2005
Period Statistical parameter
Concentration [µg/m3]
PM2.5/PM10PM2.5 PM2.5–10 PM10
I quarter
average 46.4 6.7 53.0 0.86minimum 17.6 0.2 23.0 0.75maximum 106.4 17.1 123.5 1.00number of measurements 13
II quarter
average 33.8 14.1 48.0 0.6minimum 0.1 0.0 10.1 0.0maximum 139.6 72.0 140.5 1.0number of measurements 72
III quarter
average 22.3 17.3 39.6 0.6minimum 2.7 1.4 6.4 0.1maximum 69.3 139.8 153.5 1.0number of measurements 86
IV quarter
average 42.4 9.2 51.6 0.8minimum 9.7 0.0 12.2 0.5maximum 98.6 28.7 113.5 1.0number of measurements 57
Winter(I and IV quarter)
average 43.1 8.8 51.9 0.8minimum 9.7 0.0 12.2 0.5maximum 106.4 28.7 123.5 1.0number of measurements 70
Summer(II and III quarter
2005)
average value 27.6 15.9 43.4 0.6minimum 0.1 0.0 6.4 0.0maximum 139.6 139.8 153.5 1.0number of measurements 158
2005
average value 32.3 13.7 46.0 0.7minimum 0.1 0.0 6.4 0.0maximum 139.6 139.8 153.5 1.0number of measurements 228
Zabrze – 2006Table 2 presents basic statistical parameters of the series of PM2.5, PM2.5–10, PM10 concentrations and PM2.5/PM10 ratios for Zabrze in 2006.
KRZYSZTOF KLEJNOWSKI, WIOLETTA ROGULA-KOZŁOWSKA, ANDRZEJ KRASA

7
Table 2. Statistical parameters of the series of daily dust concentrations in Zabrze, 2006
Period Statistical parameter
Concentration [µg/m3]
PM2.5/PM10PM2.5 PM2.5–10 PM10
I quarter
average valuemaintenance intervalminimum
maximumnumber of measurements 0
II quarter
average value 23.0 11.6 34.6 0.7minimum 5.0 1.4 9.2 0.2maximum 76.9 69.2 99.8 0.9number of measurements 85
III quarter
average value 18.8 12.3 31.1 0.6minimum 3.6 2.2 9.3 0.3maximum 54.5 29.6 82.9 0.9number of measurements 92
IV quarter
average 49.9 12.2 62.1 0.8minimum 5.4 2.5 8.2 0.5maximum 171.1 29.9 196.9 0.9number of measurements 90
Winter(IV quarter)
average 49.9 12.2 62.1 0.8minimum 5.4 2.5 8.2 0.5maximum 171.1 29.9 196.9 0.9number of measurements 90
Summer(II and III quarter)
average 20.8 12.0 32.8 0.6minimum 3.6 1.4 9.2 0.2maximum 76.9 69.2 99.8 0.9number of measurements 177
2006
average 30.6 12.0 42.7 0.7minimum 3.6 1.4 8.2 0.2maximum 171.1 69.2 196.9 0.9number of measurements 267
Zabrze – 2007Table 3 presents basic statistical parameters of the series of PM2.5, PM2.5–10, PM10 concentrations and PM2.5/PM10 ratios for Zabrze in 2007.
In 2007, the sampler worked alternately in Zabrze and Katowice, its location was changed monthly. The numbers of measurements at both sites were close and numbers of summer and winter measuring days comparable. In Zabrze, measurements were carried out in January, March, May, July, September and November. The quarterly averages in Table 3 refer to particular months as follows:− quarter I – January, March,− quarter II – May,− quarter III – July, September,− quarter IV – November.
STRUCTURE OF ATMOSPHERIC AEROSOL IN THE UPPER SILESIAN AGGLOMERATION ...

8
Table 3. Statistical parameters of the series of daily dust concentrations in Zabrze, 2007
Period Statistical parameter
Concentration [µg/m3]
PM2.5/PM10PM2.5 PM2.5–10 PM10
I quarter
average 43.3 12.9 56.2 0.8minimum 4.9 1.3 11.2 0.2maximum 215.6 123.7 277.0 0.9number of measurements 63
II quarter
average 15.2 3.0 18.2 0.8minimum 6.0 0.0 7.4 0.4maximum 39.5 19.1 58.6 1.0number of measurements 27
III quarter
average 19.3 11.1 30.4 0.6minimum 4.2 1.8 7.7 0.4maximum 68.6 25.3 88.4 0.9number of measurements 62
IV quarter
average 55.4 9.0 64.3 0.8minimum 6.5 2.8 10.4 0.3maximum 173.1 21.7 189.7 0.9number of measurements 30
Winter(I and IV quarter)
average value 47.2 11.6 58.9 0.8minimum 4.9 1.3 10.4 0.2maximum 215.6 123.7 277.0 0.9number of measurements 93
Summer(II and III quarter)
average 18.1 8.6 26.7 0.7minimum 4.2 0.0 7.4 0.4maximum 68.6 25.3 88.4 1.0number of measurements 89
2007
average 33.0 10.2 43.1 0.7minimum 4.2 0.0 7.4 0.2maximum 215.6 123.7 277.0 1.0number of measurements 182
Katowice – 2007Table 4 presents basic statistical parameters of the series of PM2.5, PM2.5–10, PM10 concentrations and PM2.5/PM10 ratios for Katowice in 2007.
Measurements were carried out in Katowice in February, April, June, August, Oc-tober and December. The quarterly averages in Table 3 refer to particular months as fol-lows:− quarter I – February,− quarter II – April, June,− quarter III – August,− quarter IV – October, December.
KRZYSZTOF KLEJNOWSKI, WIOLETTA ROGULA-KOZŁOWSKA, ANDRZEJ KRASA

9
Table 4. Statistical parameters of the series of daily dust concentrations in Katowice, 2007
Period Statistical parameter
Concentration [µg/m3]
PM2.5/PM10PM2.5 PM2.5–10 PM10
I quarter
average 43.3 10.5 53.8 0.8minimum 9.3 4.3 24.1 0.1maximum 85.0 53.8 102.2 0.9number of measurements 27
II quarter
average 19.1 15.0 34.0 0.6minimum 6.9 0.0 6.0 0.3maximum 75.1 40.1 105.5 1.0number of measurements 46
III quarter
average 17.4 13.0 30.4 0.6minimum 9.7 6.2 18.0 0.3maximum 28.1 23.1 41.6 0.8number of measurements 26
IV quarter
average 43.0 10.4 53.3 0.8minimum 5.6 3.1 18.9 0.2maximum 125.4 31.1 141.3 0.9number of measurements 61
Winter(I and IV quarter)
average 43.1 10.4 53.5 0.8minimum 5.6 3.1 18.9 0.1maximum 125.4 53.8 141.3 0.9number of measurements 88
Summer(II and III quarter)
average 18.5 14.3 32.7 0.6minimum 6.9 0.0 6.0 0.3maximum 75.1 40.1 105.5 1.0number of measurements 72
2007
average 32.0 12.2 44.1 0.7minimum 5.6 0.0 6.0 0.1maximum 125.4 53.8 141.3 1.0number of measurements 160
DISCUSSION
Each of Figures 2, 3 and 4 compares PM2.5/PM10 at the examined sites in appropriate measuring periods.
STRUCTURE OF ATMOSPHERIC AEROSOL IN THE UPPER SILESIAN AGGLOMERATION ...

10
Fig. 2. The box plots for PM2.5/PM10 in winter seasons
Fig. 3. The box plots for PM2.5/PM10 in summer seasons
KRZYSZTOF KLEJNOWSKI, WIOLETTA ROGULA-KOZŁOWSKA, ANDRZEJ KRASA

11
The winter PM2.5/PM10 ranges are quite similar for all sites. All lower quartiles are about 0.75, upper – 0.88. Medians for all sites and periods are almost equal (about 0.8). The PM2.5/PM10 ratio is high – a probable effect of residential heating. The winter PM2.5/PM10 ratio is statistically specific of kind of the three places – urban background. Parameters of winter PM2.5/PM10 distributions for Zabrze in 2006 and 2007 are close, for Katowice and Zabrze in 2007 nearly the same.
The situation changes a little in summer (Fig. 3). The summer PM2.5/PM10 ratios are lower for each place and year. The highest ratio, about 0.79, is for Zabrze 2007. The ratio ranges are wider than in winter at each site and year. The lower quartiles differ noticeably, upper ones – significantly. The medians also differ for each place and year. Statistically, Częstochowa 2005, Zabrze 2006, Zabrze 2007 and Katowice 2007 differ in summer more than in winter in terms of the PM2.5/PM10 ratio. In summer, the number of higher PM2.5/PM10 values is greater in Zabrze 2007 than in Zabrze 2006. The Katowice 2007 summer PM2.5/PM10 ratios are lower than in Zabrze 2007 and less diversified.
Comparison of the winter PM2.5/PM10 ratios for Częstochowa 2005, Zabrze 2006, Zabrze 2007 and Katowice 2007 to the summer ones (Figs 2 and 3) suggests a large effect of municipal emission. In winter its impact dominates and traffic jams emission, equal-izes the ratios. In summer, when there is no municipal emission, diversified influence of traffic occurs.
The yearly PM2.5/PM10 ratio series (Fig. 4) have high upper quartiles, exceeding 0.8, differing only a little for Częstochowa 2005, Zabrze 2007 and Katowice 2007. The upper quartiles for Zabrze 2006 is lower than 0.8. Medians for Częstochowa 2005, Zabrze 2007 and Katowice 2007 do not differ much. Medians for Zabrze 2006 and Zabrze 2007 differ more.
Fig. 4. The box plots for PM2.5/PM10 in 2005, 2006, 2007
STRUCTURE OF ATMOSPHERIC AEROSOL IN THE UPPER SILESIAN AGGLOMERATION ...

12
CONCLUSIONS
1. In winter, PM2.5 highly contributes to PM10 – it is a direct significant effect of the municipal emission.
2. Lowering of the share of PM2.5 in PM10 in summer suggests increased contri-bution of mineral fraction to immission.
3. The results of measurements in Częstochowa, Zabrze and Katowice are specific of urban background.
4. In the period under investigations, singular values of the PM2.5/PM10 ratio significantly differed from averages, but generally, the averages were close to averages in other European agglomerations.
The work was subsidized by the Regional Fund for Environmental Protection in Katowice according to the National Environmental Monitoring program realized by the Regional Inspectorate of Environmental Protection in Katowice.
REFERENCES
[1] Alastuey A., X. Querol, S. Rodríguez, F. Plana, A. Lopez-Soler, C. Ruiz, E. Mantilla: Monitoring of at-mospheric particulate matter around sources of secondary inorganic aerosol, Atmospheric Environment, 38, 4979–4992 (2004).
[2] Borbély-Kiss I., E. Koltay, G.Y. Szabó, L. Bozó, K. Tar.: Composition and Sources of Urban and Rural Atmospheric Aerosols in Eastern Hungary, Journal of Aerosol Science, 30, 369–391 (1999).
[3] Chow J.C., J.G. Watson, D.H. Lowenthal, R.J. Countess: Sources and chemistry of PM-10 aerosol in Santa Barbara county, CA, Atmospheric Environment, 30, 1489–1499 (1996).
[4] Commission of the EC: Commission staff working paper, Impact assessment of the thematic strategy on air pollution and the Directive on Ambient Air Quality and Cleaner Air for Europe, SEC 1133, Brussels 2005.
[5] Ćwiklak K., W. Rogula, H. Pyta: Ambient PM2.5 related PAHs in urban areas, Archives of Environmen-tal Protection, 33(3), 3–15 (2007).
[6] Grosjean D.: Solvent extraction and organic carbon determination in atmospheric particulate matter the organic extraction-organic carbon analyzer (OE-OCA) technique, Analytical Chemistry, 47(6), 797–805 (1975).
[7] Gussman R.A., L.C. Kenny: Design and Calibration of a Cyclone for PM1 Ambient Air Sampling, Journal of Aerosol Science, 31, Suppl. 1, 194–195 (2000).
[8] Hinds W.C.: Aerosol Technology: Properties, Behaviour and Measurement of Airborne Particles, Wiley, New York 1982.
[9] Houthuijs D., O. Breugelmans, G. Hoek, Ė. Vaskövi, E. Micháliková, J.S. Pastuszka, V. Jirik, S. Sache-larescu, D. Lolova, K. Meliefste, E. Uzunova, K. Marinescu, J. Volf, F. de Leeuw, H. van de Wiel, T. Flecher, E. Lebret, B. Brunekreef: PM-10 and PM-2.5 concentrations in central and eastern Europe: results from the CESAR study, Atmospheric Environment, 35, 2757–2771 (2001).
[10] IPIS PAN: Monitoring pyłu PM2,5 w Częstochowie w 2005 roku, Sprawozdanie z pracy zleconej przez WIOŚ w Katowicach, 2006.
[11] IPIS PAN: Monitoring pyłu PM2,5 w Zabrzu w 2006 roku, Sprawozdanie z pracy zleconej przez WIOŚ w Katowicach, 2007.
[12] IPIS PAN: Monitoring pyłu PM2,5 w Zabrzu i Katowicach w 2007 roku, Sprawozdanie z pracy zleconej przez WIOŚ w Katowicach, 2008.
[13] IPIS PAN: Zanieczyszczenie powietrza pyłem w aglomeracjach miejsko-przemysłowych, Sprawozdanie z realizacji pracy statutowej w roku 2005, praca niepublikowana, Zabrze 2006.
[14] IPIS PAN: Zanieczyszczenie powietrza pyłem w aglomeracjach miejsko-przemysłowych, Sprawozdanie z realizacji pracy statutowej w roku 2006, praca niepublikowana, Zabrze 2007.
[15] IPIS PAN: Zanieczyszczenie powietrza pyłem w aglomeracjach miejsko-przemysłowych, Sprawozdanie z realizacji pracy statutowej w roku 2007, praca niepublikowana, Zabrze 2008.
KRZYSZTOF KLEJNOWSKI, WIOLETTA ROGULA-KOZŁOWSKA, ANDRZEJ KRASA

13
[16] Klejnowski K., A. Krasa, W. Rogula: Seasonal variability of concentrations of total suspended particles (TSP) as well as PM10, PM2.5 and PM1 modes in Zabrze, Poland, Archives of Environmental Protec-tion, 33(3), 15–29 (2007).
[17] Klejnowski K., E. Talik, J. Pastuszka, W. Rogula, A. Krasa: Chemical composition of surface layer of PM1, PM1–2.5, PM2.5–10, Archives of Environmental Protection, 33(3), 89–97 (2007).
[18] Marcazzan G.M., S. Vaccaro, G. Valli, R. Vecchi: Characterization of PM10 and PM2.5 particulate mat-ter in the ambient air of Milan, Italy, Atmospheric Environment, 35, 4639–4650 (2001).
[19] Pastuszka J.S., K. Okada: Features of atmospheric aerosol particles in Katowice, Poland, The Science of the Total Environment, 175, 179–188 (1995).
[20] Pastuszka J.S.: Study of PM-10 and PM-2.5 concentrations in Southern Poland, Journal of Aerosol Sci-ence, 28, Suppl. 1, 227–228 (1997).
[21] Pitts J.N., B.J. Finlayson-Pitts: Atmospheric Chemistry: Fundamentals and Experimental Techniques, Wiley-Interscience, USA (1986).
[22] Querol X., A. Alastuey, S. Rodriguez, F. Plana, C.R. Ruiz, N. Cots, G. Massague, O. Puig: PM10 and PM2.5 Source Apportionment in the Barcelona Metropolitan Area, Catalonia, Spain, Atmospheric Envi-ronment, 35, 6407–6419 (2001).
[23] Rogula-Kozłowska W., J.S. Pastuszka, K. Klejnowski: Wpływ emisji komunikacyjnej na poziomy stężeń frakcji PM10 i PM2,5 w sezonie zimowym w okresie występowania epizodów smogowych w Zabrzu, [in:] Zapobieganie zanieczyszczeniu, przekształcaniu i degradacji środowiska, ATH Bielsko-Biała 2007, 353–365.
[24] Sheih C.M.: An estimation of present and projected diesel particle evolution over Chicago, Water, Air and Soil Pollution, 32, 417–425 (1987).
[25] Vogt R., U. Kirchner, V. Scheer, K.P. Hinz, A. Trimborn, B. Spengler: Identification of diesel exhaust particles at an Autobahn, urban and rural location using single-particle mass spectrometry, Journal of Aerosol Science, 34, 319–337 (2003).
Received: July 21, 2008; accepted: February 25, 2009.
STRUKTURA AEROZOLU ATMOSFERYCZNEGO NA GóRNYM ŚLąSKU – UDZIAŁ PM2,5 W PM10 W CZęSTOCHOWIE, ZABRZU I KATOWICACH W LATACH 2005–2007
Stosunek PM2,5/PM10 jest wskaźnikiem udziału pyłu pochodzenia antropogenicznego w zanieczyszczonym pyłem powietrzu na danym obszarze. Przeprowadzone w ostatnich latach badania w terenach silnie zurba-nizowanych pokazują bardzo wysoki udział PM2,5 w PM10. Celem pracy jest zestawienie otrzymanych na przestrzeni trzech lat wyników jednoczesnych pomiarów PM2,5 i PM2,5–10 i porównanie udziałów PM2,5 w PM10 w trzech różnych punktach charakterystycznych dla tła miejskiego na Górnym Ślasku (Zabrze, Katowice, Częstochowa). Wyniki pomiarów prowadzonych w Częstochowie, Zabrzu i Katowicach są rep-rezentatywne dla obszarów tła miejskiego aglomeracji. W okresie badań stosunek PM2,5/PM10 w badanych miejscach niekiedy przyjmował pojedyncze wartości znacznie odbiegające od średnich, generalnie jednak wartości średnie nie odbiegają od średniego notowanego stosunku tych frakcji w aglomeracjach miejskich Europy.
STRUCTURE OF ATMOSPHERIC AEROSOL IN THE UPPER SILESIAN AGGLOMERATION ...

14

15
PL ISSN 0324-8461
© Copyright by Institute of Envionmental Engineering of the Polish Academy of Sciences, Zabrze, Poland 2009
ARCHIVES OF ENVIRONMENTAL PROTECTIONvol. 35 no. 2 pp. 15 - 25 2009
ADVANCED OXIDATION OF DICLOFENAC IN VARIOUS AQUATIC ENVIRONMENTS
EWA FELIS*, JAROSŁAW WISZNIOWSKI, KORNELIUSZ MIKSCH
Silesian University of Technology, Environmental Biotechnology Departmentul. Akademicka 2, 44-100 Gliwice, Poland
* Corresponding author e-mail: [email protected]
Keywords: Diclofenac, Fenton’s reaction, photolysis, UV/H2O2, aquatic solution.
Abstract: Many of the drugs used are not completely metabolized in the human body and with urine and faces are introduced into the sewage system. Finally, due to their incomplete removal during the conventional waste-water treatment process (CWTP), they can be released into the receiving water. One of the medicaments fre-quently detected in surface water is diclofenac. The present study addresses the problem of diclofenac removal in various aquatic samples using advanced oxidation processes (AOPs). The experiments were performed in distilled water and in biologically treated wastewater. The following AOPs were applied: Fenton’s reagent, UV- and UV/H2O2-processes. The concentration of diclofenac in distilled water corresponded to the concentration of this drug in human urine (ca. 20 mg⋅dm-3). The real wastewater samples contained diclofenac concentrations ranging from 630 to 790 ng⋅dm-3. The photodegradation of diclofenac was carried out in the photoreactor with a medium pressure Hg-vapor lamp (400 W). In the Fenton’s reaction different molar ratios of H2O2/Fe2+ were used. The diclofenac mineralization (TOC removal) strictly depended on the amount of H2O2 applied in the Fenton’s reaction. Diclofenac was rapidly degraded by direct photolysis (UV) and in UV/H2O2 process both in distilled water and in wastewater samples. The results proved that the advanced oxidation processes are effec-tive in diclofenac removal from aquatic samples. The pseudo first order rate constants for diclofenac photodeg-radation were determined.
INTRODUCTION
Pharmaceuticals present in the environment are at a very low concentration (ng- or µg per dm3) [7], which is generally a non-toxic level [2] and frequently undergo rapid trans-formation or decay. Nevertheless their ubiquitous, continuous discharge into the envi-ronment and uncertainty regarding chronic impact of residual pharmaceutical on human health makes them intrinsically key pollutants.
After administration, many drugs are extracted non-metabolized by patients and enter with urine and faces the sewage system [10]. Finally, due to incomplete removal of pharmaceuticals and their metabolites during the conventional wastewater treat-ment process (CWTP), they are released into the receiving water. This is the most sig-nificant entry route for pharmaceuticals into the aquatic environment [20]. Diclofenac (2-[2’,6’-(dichlorophenyl)amino]phenylacetic acid) belongs to the group of analgesic agents and is classified as a non-steroidal anti-inflammatory drug. It is often used to treat inflammatory and painful diseases of rheumatic and non-rheumatic origin. The basic data

16 EWA FELIS, JAROSŁAW WISZNIOWSKI, KORNELIUSZ MIKSCH
concerning diclofenac is listed in Table 1. Approximately, 3.7 Mg of the prescription drug – diclofenac is annually sold in Poland. In comparison to other analgesic substance such as ibuprofen, which is degraded in more than 90%, diclofenac removal in CWTP is rather low ranging from 20 to 40% [4–8]. Non significant improvement of diclofenac removal (to about 50%) can be obtained using the membrane bioreactor (MBR) [11]. It can be explained by a very low sorption to activated sludge flocks (sorption coefficient Kd amounted to 1.6 dm3⋅kg-1), and low degradation in the biological system, i.e. the value of degradation constant kbiol is below 0.1 (dm3⋅g-1⋅d-1). According to the classification scheme proposed by Joss et al. [9], no substantial removal (generally below 20%) by degradation can be expected for diclofenac. Diclofenac is one of the medicaments most frequently detected in aquatic environment such as surface waters and its traces were found in drink-ing water [7]. Its concentration in raw municipal wastewater exceeded the level of few µg⋅dm-3 [1, 20].
Parameter DataName DiclofenacMolecular formula C16H11Cl2NO2
Molar mass 296.16 g⋅mol-1
CAS number 15307-86-5Structural formula(sodium salt of diclofenac)
Table 1. Basic data concerning diclofenac
Photochemical reaction is likely to be the most important abiotic process affect-ing the fate of non-biodegradable and non-sorbing pharmaceuticals in the environment. Diclofenac can be photodegraded in the surface waters by sunlight [1, 14]. For instance, even in winter conditions the half life for direct photolysis of diclofenac (µg level) in bi-distilled water was estimated as 5 days [1]. Recently, the degradation performance of high concentrated solutions of diclofenac (50 mg⋅dm-3) was proved in the pilot plant scale using compound parabolic collector [15]. The authors observed significant solar photolytic deg-radation reaching 85% for diclofenac solution within 62 h of operation.
The UV-based advanced oxidation processes (AOPs) have high potential for elimi-nation of diclofenac. Some previous studies reported the use of Fenton photo-assisted treatment [15, 18], H2O2/UV [6, 22], O3/UV [6] or TiO2/UV [3, 12]. In order to prevent accumulation and unfavorable transformation of pharmaceutics into the environment, an effective treatment technology for the removal of such compounds is indispensable. The aim of the study was to investigate the removal efficiency of diclofenac using such oxida-tion processes as: ultraviolet irradiation (UV), Fenton’s reaction and UV/H2O2-process. Two approaches were tested: i) elimination of diclofenac from the treated wastewater (end-of-pipe treatment), ii) diclofenac elimination from its relatively high concentrated

17ADVANCED OXIDATION OF DICLOFENAC IN VARIOUS AQUATIC ENVIRONMENTS
solutions, which corresponded to its concentration in human urine (ca. 20 mg⋅dm-3). This latter is reflected in treatment processes applied for a source separated waste.
MATERIALS AND METHODS
The experiments were performed in distilled water and biologically treated wastewater. The concentration of diclofenac in distilled water corresponded to the concentration of this drug in human urine (20 mg⋅dm-3). In the treated wastewater the experiments at real concentrations of diclofenac (630–790 ng⋅dm-3) were performed. The collected waste-water samples were taken after biological treatment from urban sewage treatment plant (STP) of Kloten (Switzerland). The detailed description of STP is presented in the refer-ences (e.g. [8]).
Analytical methodsThe detection of diclofenac in the biologically treated wastewater was performed by gas chromatography/mass spectrometry (GC/MS) after solid phase extraction (SPE) and deri-vatisation by a diazomethane/diethylether – solution. After the reaction time, the dia-zomethane was destroyed by adding the acidic acid/acetone solution (1:10, v/v). Prior to SPE the wastewater samples were filtered, acidified with sulphuric acid to pH 2 and a sur-rogate standard (Br-diclofenac) was added. PCB nr 30 as an internal standard was used. The analytical standards were purchased from Sigma-Aldrich. The GC/MS measurements were performed on a gas chromatograph HP 5890 (equipped with autosampler HP 7673), coupled with the mass spectrometer HP 5971. The Restek XTI – 5 (30 m x 0.25 mm x 0.25 µm) as GC – column was used. The limit of detection (LOD) of diclofenac in the treated wastewater samples was at the level of 0.02 µg⋅dm-3. All GC/MS analyses were performed in a single-ion monitoring (SIM) mode, according to the methods concerning acidic drugs determination proposed by Ternes [19] and Ternes et al. [21]. The diclofenac concentrations in the distilled water were confirmed by high performance liquid chroma-tography (HPLC) (HPLC-UVD 340u, Gynkotek). The LichroCard 250-4 (Lichrospher 100, Merck) as the HPLC – column was used. The acetonitrile and phosphate buffer (5 mmol K2HPO3, adjusted with H3PO4 to pH 3) in a ratio of 60:40 (v/v) was applied as a mobile phase. The acetonitrile used for the experiments was of the highest commercially available, grade and it was purchased from POCH – Gliwice (Poland). A flow rate of mobile phase was 1 cm3⋅min-1 and the detection wavelength was set at 220 nm. Under the conditions described, the retention time (RT) of diclofenac was equal 6.8 ± 0.1 min. An external standard method was used for diclofenac determination in distilled water. The limit of quantification (LOQ) was set at first at the lowest point of linear calibration while the ratio signal/noise (S/N) exceeded the value 10 (S/N > 10). The concentration of total organic carbon (TOC) during all experiments was controlled using total carbon analyzer TOC-VCSH (Shimadzu).
Experiments set upThe following advanced oxidation processes (AOPs) were used: Fenton’s reaction, pho-tolysis (UV) and photolysis accelerated with hydrogen peroxide (UV/H2O2) in oxida-tion of diclofenac. The Fenton’s reagent was applied only for oxidation of the diclofenac solution. The solution was prepared by dissolving 20 mg⋅dm-3 of diclofenac in distilled

18
water (HPLC grade). The oxidation by means of Fenton’s reagent was performed in the glass reactor (volume of 1 dm3). The solution in the reactor was slowly stirred during the experiment and sampled after definite times (1, 2, 5, 10, 15, 20, 30, 45 and 60 min). In the Fenton’s reagent different molar ratios of H2O2/Fe2+ (0.3/1; 0.6/1 and 1.2/1) were used. The pH of solution was adjusted with sulphuric acid to pH 3. The amount of H2O2 was estimated basing on the COD of diclofenac solution, according to the equation (1).
1 g COD = 1 g O2 = 0.03125 mol O2 = 0.0625 mol H2O2 = 2.125 g H2O2 (1)The photochemical investigations were carried out in the reactor UviLab P400 (Vi-
taTec, Germany). The biologically treated wastewater and distilled water spiked with diclofenac standard as experimental matrices were used. In the photochemical processes the system was operated as a plug-flow reactor (Fig. 1a) or as a circulation loop (Fig. 1b). A medium–pressure mercury lamp (P = 400 W) in quartz casing was immersed in the glass reactor (V = 0.350 dm3). All experiments were performed using half of the maxi-mal lamp power (P = 200 W). The average path length of light through the solution was equal 10 mm. In the UV/H2O2 experiments the overdosed concentrations of H2O2 were applied – 1 g H2O2⋅dm-3 in the case of distilled water spiked with diclofenac standard and 1 mg⋅dm-3 in the case of the treated wastewater. The pH of the experimental matrices was adjusted to 7. The photochemical investigation was performed at the ambient temperature (ranging from 23 to 25°C). Reported values were the average of 3 replicates.
Fig. 1. Schematic diagram of photocatalytic set-up: a) plug-flow reactor, b) circulation loop mode; 1 – photoreactor, 2 – UV-lamp, 3 – cooling (jacket) loop, 4 – refrigerated bath circulator, 5 – indirect (mix)
chamber, 6 – magnetic stirrers, 7 – wastewater influent, 8 – wastewater effluent
RESULTS AND DISCUSSION
Fenton’s reagentFor the diclofenac solution (20.0 mg⋅dm-3), the average concentration of TOC amounted to 11.4 mg C⋅dm-3 and COD was equal 35.0 mg O2⋅dm-3. After the pH correction with sulphuric acid to the value of 3, a considerable elimination of diclofenac concentration was observed. It ranged from 35.0 to 47.0% of the initial diclofenac concentration. The decrease of diclofenac concentration in the solution at pH = 3 could have been caused by the partial diclofenac precipitation. Diclofenac is weak acid (pKa = 4.15), soluble in its
EWA FELIS, JAROSŁAW WISZNIOWSKI, KORNELIUSZ MIKSCH
19
deprotonised form, but practically insoluble when it is protonised. As reported by Perez-Estrada et al. [15] the similar diclofenac behavior at acidic pH was observed. Prior to HPLC-analysis all samples were filtered and partially precipitated diclofenac (including the chemical sludge originated from Fenton’s process) remained on the glass fiber filter. The elimination of TOC from diclofenac solution as a consequence of pH decreasing varied from 18 to 32%.
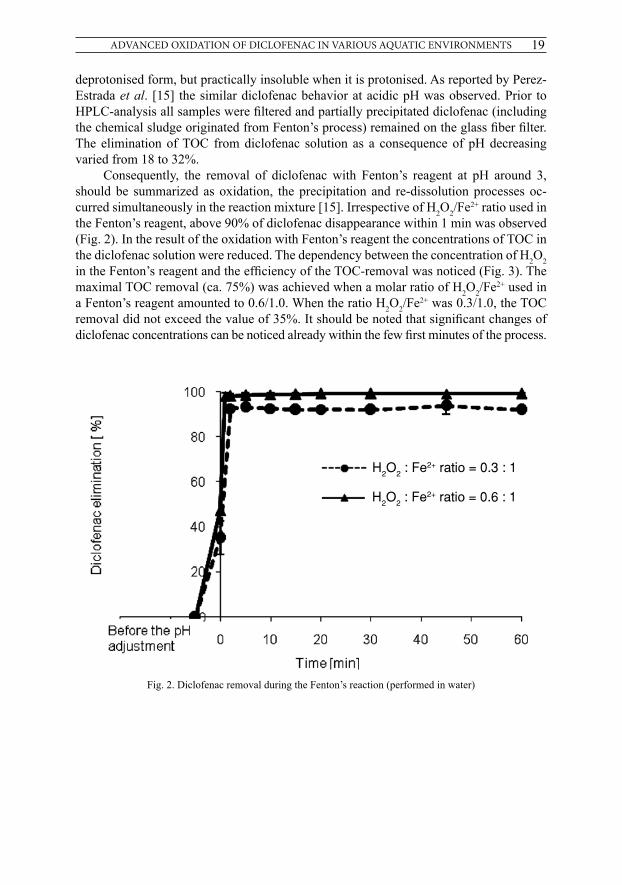
Consequently, the removal of diclofenac with Fenton’s reagent at pH around 3, should be summarized as oxidation, the precipitation and re-dissolution processes oc-curred simultaneously in the reaction mixture [15]. Irrespective of H2O2/Fe2+ ratio used in the Fenton’s reagent, above 90% of diclofenac disappearance within 1 min was observed (Fig. 2). In the result of the oxidation with Fenton’s reagent the concentrations of TOC in the diclofenac solution were reduced. The dependency between the concentration of H2O2 in the Fenton’s reagent and the efficiency of the TOC-removal was noticed (Fig. 3). The maximal TOC removal (ca. 75%) was achieved when a molar ratio of H2O2/Fe2+ used in a Fenton’s reagent amounted to 0.6/1.0. When the ratio H2O2/Fe2+ was 0.3/1.0, the TOC removal did not exceed the value of 35%. It should be noted that significant changes of diclofenac concentrations can be noticed already within the few first minutes of the process.
Fig. 2. Diclofenac removal during the Fenton’s reaction (performed in water)
H2O2 : Fe2+ ratio = 0.3 : 1
H2O2 : Fe2+ ratio = 0.6 : 1
ADVANCED OXIDATION OF DICLOFENAC IN VARIOUS AQUATIC ENVIRONMENTS

20
Diclofenac photodegradation in water (UV- and UV/H2O2-processes)Diclofenac has the maximum absorbance at 273 nm, but also can absorb irradiation from a broad UV-range and partly in the solar region (Fig. 4). The initial concentration of di-clofenac in the distilled water amounted to 20.0 mg⋅dm-3 (TOC = 11.4 mg⋅dm-3). The Fig-ure 5 depicts the removal percentages of diclofenac in water recorded in the experiments with the UV-radiation and in the UV/H2O2-process. The 45% of diclofenac removal with reference to its initial concentration after 1 min of the UV-process was observed. After 5 min of UV-process, the initially colorless diclofenac solution changed into red-brown color. A new peak with RT of 1.86 min appeared on the chromatogram (data not shown). The peak was not successfully identified. On the chromatogram the peak with RT = 1.86 min was still present to the end of the irradiation time (30 min). The diclofenac concentra-tion after 15 min of irradiation reached level below of LOQ. The coloration of diclofenac solution during the UV-process can be caused by the formation of the diclofenac photo-products. Petrovic and Barceló [16] identified by means of LC-TOF-MS the diclofenac photoproduct with quinone-imine structures. Other possibility is a formation of the prin-cipal products, carbazole derivatives, generated due to the diclofenac dechlorination and formation of an inter-ring carbon bond [13, 17]. The carbazole structure is an active chromophore absorbing visible light. The appearance of specific red-brown color under solar irradiation of diclofenac was reported by Perez-Estrada et al. [15].
In the case of UV/H2O2-process, the addition of H2O2 (1.0 g⋅dm-3) brought about the diclofenac decomposition by 9%. After 1 min of operation, the diclofenac removal exceeded 60%. The specific red-brown color of diclofenac solution appeared after 5 min of UV/H2O2-process. In the same time the peak with RT = 1.86 min was observed on the chromatogram. The diclofenac removal exceeded 97% and after another 5 min of the process (irradiation time = 10 min) its concentration was below LOQ. The decoloration of experimental solution after approximately 15 min of the UV/H2O2-process was observed.
Fig. 3. Removal of TOC during Fenton’s reaction (performed in water)
H2O2 : Fe2+ ratio = 0.3 : 1
H2O2 : Fe2+ ratio = 0.6 : 1
H2O2 : Fe2+ ratio = 1.2 : 1
EWA FELIS, JAROSŁAW WISZNIOWSKI, KORNELIUSZ MIKSCH

21
Fig. 4. Diclofenac absorbance spectrum in water (pH = 7) with reference to solar and medium pressure Hg-lamp emission spectra
Fig. 5. Diclofenac removal by means of the UV- and UV/H2O2-processes in water
In the same time, on the chromatogram, the peak at RT = 1.86 min was not present. It suggests that in the UV/H2O2-process not only the diclofenac molecules, but also the molecules of the diclofenac by-product were decomposed. The addition of H2O2 in the UV-process probably caused the cleavage of carbon ring in the diclofenac derivatives and leads to the carboxylic acid formation via the classic degradation pathways [22]. For diclofenac oxidation by means of UV-radiation and in the UV/H2O2-process the pseudo
ADVANCED OXIDATION OF DICLOFENAC IN VARIOUS AQUATIC ENVIRONMENTS

22
first order rate constants (k) were calculated (Tab. 2). The addition of H2O2 by diclofenac irradiation with UV caused 1.6-times acceleration of its decay with comparison to the decay in the absence of H2O2. After 5 min of diclofenac photolysis, the TOC-removal exceeded 13% and after next 5 min of the process the TOC-removal reached 23%. TOC removal after 30 min of irradiation was at the level of 30%. The TOC removal after 5 min of UV/H2O2-process was at the level of 17%. After 30 min of this process, near by 40% TOC removal was noticed (Fig. 6).
Fig. 6. TOC removal during diclofenac oxidation using the UV- and UV/H2O2-processes in water
Process k [min-1] R2
UV 0.449 0.984UV/H2O2 0.716 0.986
Table 2. Pseudo first order kinetic constants (k) of diclofenac photodegradation in water
Diclofenac photodegradation in wastewater (UV- and UV/H2O2-processes)The diclofenac concentration in the biologically treated wastewater varied from 630–790 ng⋅dm-3, while the average COD of wastewater during the whole experimental period was equal to 29.0 mg⋅dm-3. Considering the low diclofenac concentrations in the treated wastewater, the degradation of this compound by means of UV-radiation and in the UV/H2O2 proceeded very rapidly in the both cases.
After 1 min of diclofenac photolysis and in the UV/H2O2-process the diclofenac removals were at the level of 79% and 83%, respectively. Complete diclofenac decay (the concentration below of LOD) was obtained within 2 min of UV/H2O2-process and within 3 min of UV-irradiation (Fig. 7). Due to the specific color of wastewater matrix and a very low concentration of diclofenac, no apparent color variation (resulting from a generation of diclofenac by-products) could be distinguished. The pseudo first order rate constants (k) are presented in Table 3. The calculated kinetic constant for diclofenac decay in the
EWA FELIS, JAROSŁAW WISZNIOWSKI, KORNELIUSZ MIKSCH

23
UV/H2O2-process was equal to 1.78 min-1 and this value was only 1.05-folds higher than kinetic constant determined for UV-process (without H2O2 addition).
Fig. 7. Diclofenac removal by means of UV- and UV/H2O2-processes in wastewater
Process k [min-1] R2
UV 1.694 0.995UV/H2O2 1.780 0.910
Table 3. Pseudo first order kinetic constants (k) of diclofenac photodegradation in wastewater
In the wastewater the H2O2 addition accelerated the diclofenac decomposition rate, but the positive effect was not so obvious in comparison with the results of experiments performed in the distilled water (at higher concentration of diclofenac). This result can partly be explained by a composition of wastewater samples (solution matrix), which could strongly influence the performance of photochemical processes. It is widely ac-cepted that carbonate/bicarbonate anions act as the effective OH° radical scavengers. Consequently, the ions present in the wastewater, such as HCO3
-/CO32-, could deactivate
the reactive intermediates of oxygen generated during the H2O2 photolysis. This phenom-enon merits a closer examination using the diclofenac solution. On the other hand, matrix of wastewater did not affect direct photolysis of diclofenac molecules.
CONCLUSION
In the case of diclofenac oxidation with Fenton’s reagent irrespective of H2O2/Fe2+ ratio, above 90% of diclofenac disappearance within 1 min of the process was observed. The maximal TOC removal (75%) was achieved when a molar ratio of H2O2/Fe2+ used in a Fenton’s reagent was equal to 0.6/1.0. The decrease of diclofenac concentration (from
ADVANCED OXIDATION OF DICLOFENAC IN VARIOUS AQUATIC ENVIRONMENTS

24
35.0 to 47.0% of the initial concentration) after pH adjustment to 3 can be attributed to the partial precipitation of this compound. The removal of diclofenac by means of Fenton’s reagent (at pH = 3) should be perceived not only as advanced oxidation process but also as simultaneously occurred processes including oxidation, precipitation and re-dissolu-tion diclofenac in the reaction mixture.
The kinetic calculated on the basis of the results of photochemical experiments’ constants indicated that the addition of hydrogen peroxide accelerated the rate of di-clofenac disappearance. In the case of the investigation performed in water, the addition of hydrogen peroxide accelerated the diclofenac decay rate from the value k = 0.440 min-1 (without H2O2) to the value k = 0.716 min-1 (in the presence of H2O2).
The obtained results proved that advanced oxidation processes (AOPs) are effective in diclofenac removal from the aquatic samples and the UV/H2O2-process can play a sig-nificant role in diclofenac removal from the aquatic environment, for instance as tertiary treatment (polishing stage) after the biological wastewater treatment.
AcknowledgementsThe authors gratefully acknowledge the financial support provided by Polish research project 4 T09C05225 and EU project DEMETER (EVK1-CT62002-80009).
REFERENCES
[1] Andreozzi R., M. Raffaele, P. Nicklas: Pharmaceuticals in STP effluents and their solar photodegrada-tion in aquatic environment, Chemosphere, 50, 1319–1330 (2003).
[2] Bound P., N. Voulvoulis: Pharmaceuticals in the aquatic environment –– a comparison of risk assessment strategies, Applied Catalysis B: Environmental, 67, 197–205 (2006).
[3] Calza P., V.A. Sakkas, C. Medana, C. Baiocchi, A. Dimou, E. Pelizzetti, T. Albanis: Photocatalytic deg-radation study of diclofenac over aqueous TiO2 suspensions, Chemosphere, 45, 957–969 (2001).
[4] Clara M., B. Strenn, N. Kreuzinger: Carbamazepine as possible anthropogenic marker in the aquatic en-vironment: investigation on the behavior of Carbamazepine in wastewater treatment and during ground-water infiltration, Water Research, 38, 947–954 (2004).
[5] Clara M., B. Strenn, O. Gans, E. Martinez, N. Kreuzinger, H. Kroiss: Removal of selected pharma-ceuticals, fragrances and endocrine disrupting compounds in a membrane bioreactor and conventional wastewater treatment plants, Water Research 39, 4797–4807 (2005).
[6] Gebhardt W., H.F. Schroder: Liquid chromatography–(tandem) mass spectrometry for the follow-up of the elimination of persistent pharmaceuticals during wastewater treatment applying biological wastewater treatment and advanced oxidation, Journal of Chromatography A, 1160, 34–43 (2007).
[7] Heberer T.: Occurrence, fate, and removal of pharmaceutical residues in the aquatic environment: a review of recent research data, Toxicology Letters, 131, 5–17 (2002).
[8] Joss A., E. Keller, A. Alder, A. Goebel, C. McArdel, T.A. Ternes, H. Siegrist: Removal of pharmaceuticals and fragrances in biological wastewater treatment, Water Research, 39, 3139–3152 (2005).
[9] Joss A., S. Zabczynski, A. Göbel, B. Hoffmann, D. Löffler, C. McArdell, T.A. Ternes, A. Thomsen, H. Siegrist: Biological degradation of pharmaceuticals in municipal wastewater treatment: Proposing a classification scheme, Water Research, 40, 1686–1696 (2006).
[10] Kümmerer K.: Drugs in the environment: emission of drugs, diagnostic aids and disinfectants into waste-water by hospitals in relation to other sources – a review, Chemosphere, 56, 1143–1155 (2004).
[11] McArdell C., A. Alder, M. Clara, A. Goebel, A. Joss, E. Keller, N. Kreuzinger, H. Pluess, H. Siegrist, B. Strenn: Impact of treatment technologies on the elimination of selected pharmaceuticals from waste-water, [in:] SETAC Europe Meeting, Prague, Czech Republic 2004.
[12] Méndez-Arriaga F., S. Esplugas J. Giménez. Photocatalytic degradation of non-steroidal anti-inflamma-tory drugs with TiO2 and simulated solar irradiation, Water Research, 42, 585–594 (2008).
[13] Moore D.E., S. Roberts-Thomson, D. Zhen, C. Duke: Photochemical studies on the anti-inflammatory drug diclofenac, Photochemistry and Photobiology, 52, 685–690 (1990).
EWA FELIS, JAROSŁAW WISZNIOWSKI, KORNELIUSZ MIKSCH

25
[14] Packer J., J. Werner, D. Latch, K. McNeill, W. Arnold, Photochemical fate of pharmaceuticals in the environment: Naproxen, diclofenac, clofibric acid and ibuprofen, Aquatic Science, 65, 342–35 (2003).
[15] Perez-Estrada L., M. Maldonado, W. Gernjak, A. Aguera, A. Fernandez-Alba, M. Ballesteros, S. Malato: Decomposition of diclofenac by solar driven photocatalysis at pilot plant scale, Catalysis Today, 101, 219–226 (2005).
[16] Petrovic M., D. Barceló: LC-MS for identifying photodegradation products of pharmaceuticals in the environment, Trends in Analytical Chemistry, 26, 486–493 (2007).
[17] Poiger T., H. Buser, M. Muller: Photodegradation of the pharmaceutical drug diclofenac in a lake: pathway, field measurements and mathematical modeling, Environmental Science and Technology; 20, 256–63 (2001).
[18] Ravina M., L. Campanella, J. Kiwia: Accelerated mineralization of the drug Diclofenac via Fenton reac-tions in a concentric photo-reactor, Water Research, 36, 3553–3560 (2002).
[19] Ternes T.A.: Analytical methods for the determination of pharmaceuticals in aqueous environmental sam-ples, Trends in Analytical Chemistry, 20, 419–430 (2001).
[20] Ternes T.A.: Occurrence of drugs in German sewage treatment plants and rivers, Water Research, 32, 3245–3260 (1998).
[21] Ternes T.A., M. Bonerz, N. Herrmann, E. Keller, B. Bago, A. Alder: Determination of pharmaceuticals, iodinated contrast media and musk fragrances in sludge and water via LC tandem MS and GC/MS, Jour-nal of Chromatography, 1067, 213–223 (2005).
[22] Vogna D., R. Marotta, A. Napolitano, R. Andreozzi, M. d’Ischia: Advanced oxidation of the pharmaceuti-cal drug diclofenac with UV/H2O2 and ozone, Water Research, 38, 414–422 (2004).
Received: August 5, 2008; accepted: March 12, 2009.
ZAAWANSOWANY ROZKŁAD DIKLOFENAKU W ŚRODOWISKU WODNYM
Większość farmaceutyków stosowanych w medycynie nie ulega całkowitemu zmetabolizowaniu w ciele pacjenta i wraz z moczem i kałem trafia do systemu kanalizacyjnego. Ze względu na swe właściwości, nie są one całkowicie usuwane ze ścieków w konwencjonalnych procesach oczyszczania ścieków i wraz ze ściekami oczyszczonymi mogą przedostawać się do odbiorników. Diklofenak jest lekiem często identyfikowanym w wo-dach powierzchniowych. Prezentowane w niniejszej publikacji badania dotyczą problemu usuwania diklofenaku ze środowiska wodnego za pomocą zaawansowanych procesów utleniania (ang. advanced oxidation processes, AOPs). Badania prowadzono w roztworach wodnych diklofenaku (przygotowanego z wykorzystaniem wody destylowanej) oraz w ściekach po biologicznym procesie oczyszczania. W badaniach zastosowano następujące techniki AOPs: utlenianie odczynnikiem Fentona, utlenianie za pomocą promieniowania UV oraz proces UV/H2O2. Stężenie diklofenaku odpowiadało stężeniom, jakich można spodziewać się w moczu pacjenta podczas kuracji tym lekiem (20 mg⋅dm-3). Ścieki oczyszczone zawierały diklofenak na poziomie 630–790 ng⋅dm-3. Bada-nia z wykorzystaniem promieniowania UV prowadzono w fotoreaktorze wyposażonym w średniociśnieniową lampę rtęciową (400 W). Utlenianie za pomocą odczynnika Fentona prowadzono przy różnych stosunkach molowych H2O2/Fe2+. Mineralizacja diklofenaku (określana jako usunięcie OWO) bezpośrednio zależała od ilości H2O2 w odczynniku Fentona stosowanego podczas badań. Diklofenak ulegał szybkiemu rozkładowi za pomocą promieniowania UV i w procesie UV/H2O2, zarówno w roztworze wodnym tego leku jak i w próbkach ścieków. Wyniki przeprowadzonych badań wskazują, iż zastosowanie zaawansowanych procesów utleniania w znacznym stopniu zwiększa efektywność usuwania diklofenaku ze środowiska wodnego. W ramach niniej-szych badań obliczone zostały pseudo pierwszorzędowe stałe szybkości rozkładu diklofenaku przy zastosowa-niu metod fotochemicznych.
ADVANCED OXIDATION OF DICLOFENAC IN VARIOUS AQUATIC ENVIRONMENTS

26

27
PL ISSN 0324-8461
© Copyright by Institute of Envionmental Engineering of the Polish Academy of Sciences, Zabrze, Poland 2009
ARCHIVES OF ENVIRONMENTAL PROTECTIONvol. 35 no. 2 pp. 27 - 40 2009
INFLUENCE OF FISHERy MANAGEMENT AND ENVIRONMEN-TAL FACTORS ON OCCURRENCE OF HETEROTROPHIC,
HEMOLyTIC AND MESOPHILIC BACTERIA AND AeromonAs hydrophilA IN WATERS OF THE DRWĘCA RIVER, POLAND
IWONA GOŁAŚ1*, KAROL KORZEKWA1, MONIKA HARNISZ1, IZABELLA ZMYSŁOWSKA1, MARIUSZ TEODOROWICZ2, ELżBIETA TERECH-MAJEWSKA3,
WIESŁAWA RODZIEWICZ1, MARIOLA BIEńKOWSKA1
University of Warmia and Mazury in Olsztyn1 Department of Environmental Microbiology,
2 Department of Environment Protection Engineering3 Division of Epizootiology, Department of Infectious and Invasive Diseases
ul. R. Prawocheńskiego 1, 10-957 Olsztyn-Kortowo, Poland*Corresponding author e-mail: [email protected]
Keywords: Aeromonas hydrophila, hemolytic bacteria, psychrophilic, psychrotolerant and mesophilic hetero-trophic bacteria, water.
Abstract: The research covered the determination: of the numbers of heterotrophic bacteria: psychrophilic, psychrotolerant, mesophilic and percentage participation of hemolytic bacteria and Aeromonas hydrophila (with aerolysine and hemolysine genes) in the waters of the Drwęca River depending on environmental fac-tors and fishery management. The mean quantities of heterotrophic bacteria (HPC) at 4, 14 and 28°C ranged: 0.78–7.57⋅103, 1.40–6.65⋅103 and 1.93–16.23⋅103 cfu⋅cm-3, respectively. The percentage participation of hemo-lytic heterotrophic bacteria (HemPC) and A. hydrophila among psychrophilic, psychrotolerant, mesophilic microorganisms determined at 4, 14, 28°C, ranged: 7.9–10.4, 6.8–12.2, 8.6–22.0 and 1.1–6.4%, respectively. Statistically significant correlation between examined bacteria and temperature values, flows and O2 saturations confirm that the occurrence of those microorganisms depends on the degree of microbiological contamination of that ecosystem, resulting from the fishery management and environmental factors.
INTRODUCTION
A river is a system comprising both the main reach and the tributaries, carrying on one-way flow a significant load of matter in dissolved and particulate phases from both natural and anthropogenic sources [2]. Those water ecosystems are characterized by a variety of heterotrophic microflora. Its quantitative and qualitative composition changes depend-ing on climatic, morphometric and environmental conditions (temperature, pH, oxygen saturation) as well as anthropogenic factors (sewage inflow, recreation, fishery manage-ment) [16, 19, 26, 27, 40]. Climatic zones, the seasons of the year and inflow of various contaminants have an impact on periodic dominance of different types and species of bacteria belonging to psychrophilic, psychrotolerant or mesophilic microorganisms [7,

28
13, 29, 32, 45]. Due to their enzymatic properties, they perform the most important role, as by decomposing autochtonic and allochtonic organic matter [11, 16, 27], they take part in natural processes of self-purification of flowing waters [38]. However, an increase in the number of bacteria, especially mesophilic ones, in surface waters may pose a direct or indirect sanitary and epidemiological threats to aquatic organisms, people and animals [6, 30, 44]. This applies particularly to bacteria species with an ability to produce hemo-lysin which is considered one of the most important pathogenic factors [12, 34, 44]. It is especially adverse in the case of protected waters, one of which being the upper reach of the Drwęca River – since 1961 an aquatic and ichthyologic nature reserve. Previous research over the waters of the Drwęca River, conducted in the years 2001–2004, showed a quantitative and qualitative variety of heterotrophic microflora related to physicochemi-cal parameters of the water and human activity [18, 19] and dominance of mesophilic A. hydrophila [26] potentially pathogenic to people and fish [4, 25, 34]. Therefore, this study was aimed at establishing the changes in: quantitative occurrence of heterotrophic bacte-ria (psychrophilic, psychrotolerant and mesophilic ones), the number and percentage par-ticipation of hemolytic microorganisms and mesophilic strains of Aeromonas hydrophila (with aerolysine and hemolysine genes) in the waters of the Drwęca River depending on environmental and anthropogenic factors.
MATERIAL AND METHODS
Study areaThe Drwęca River, which is a right tributary of the Vistula River, flows through a lake district. The river is 207.2 km long and drains a catchment basin of 534 350 ha in surface area. The section of the river flowing within the boundaries of the Province of Warmia and Mazury is about 95 km long. In its upper reach the river flows through a small lake known as Ostrowin and a typical ribbon lake called Drwęckie [39] (Fig. 1). In 1961 the whole length of the Drwęca River was turned into a nature reserve. This aquatic nature reserve covers 1888.4 ha from the river sources to its outflow to the Vistula. The reserve, called the “River Drwęca Nature Reserve”, was established to protect the river’s water habitats as well as the fish living in the Drwęca such as trout, salmon, brown trout and vimba. The Drwęca River Nature Reserve is the longest ichthyological reserve in Poland, comprising 444.38 ha of protected area. Owing to large differences in elevation between the Drwęca and its tributaries, at several sections the river appears submontane in charac-ter. This favors the occurrence of rare fish and lamprey species, the species which prefer waters high in oxygen saturation [35–37].
In its upper reach, the valley of the Drwęca River forms a gorge 20–30 m deep and 8 km long. Known as Czarci Jar (Devil’s Gorge), the gorge comprises a Polish Angling As-sociation fish hatchery. The major sources of point pollution reaching the Drwęca include household and industrial sewage and wastewater as well as post-production water from three fish farms (in the villages of Czarci Jar and Rychnowska Wola) [39].
Sampling sitesThe microbiological assays covered a 15-km long section of the upper reach of the Drwęca. Water samples were collected at 8 sampling sites designated in certain charac-teristic places along the river from its sources to the inflow into Lake Ostrowin (Fig. 1):
IWONA GOŁAŚ I WSP.

29
Fig. 1. Location sketch of sampling sites (I, II…VIII) in the River Drwęca; map of Poland showing the studied River Drwęca
− site I – 2 km away from the river sources, as the control site (the least of all the sam-pling sites exposed to contamination);
− site II – the outflow from the ‘trout section’ of the fish farm no. 1 (which produced 6.5 Mg of trout fry in 2005 and 5 Mg in 2006) located in the village of Czarci Jar;
− site III – the outflow from the ground fish farming ponds at the fish farm no. 1 in Czarci Jar;
INFLUENCE OF FISHERy MANAGEMENT AND ENVIRONMENTAL FACTORS ON...

30
− site IV – 2 km away from the fish farm no. 1, in the village of Gibała;− site V – in the village of Rychnowska Wola, before the fish farms no. 2 and 3;− site VI – the outflow from the fish farm no. 2 (which produced 54 Mg of commercial
trout in 2005 and 55 Mg in 2006) located in Rychnowska Wola;− site VII – the outflow from the fish farm no. 3 (which produced 40 Mg of commercial
trout in 2005 and 42 Mg in 2006) located in Rychnowska Wola;− site VIII – 2.5 km from the fish farms no. 2 and 3 in Rychnowska Wola;
SamplingWater samples were collected from the Drwęca River at 0.3–0.5 m depth every 4–6 weeks from January 2005 to December 2006. Water was collected directly into sterile bottles according to the Standard Methods [20]. The time which elapsed between each sampling event and assays never exceeded 6 hours. In 2005–2006, 30 water samples were col-lected and analyzed per each site. Generally, the microbiological and physicochemical tests were performed on 240 water samples from the Drwęca River.
Microbiological studiesMicrobiological analyses of all water samples from the river were determined by spread plate procedure on tryptone soy agar (TSA) (Oxoid) containing 5% (v/v) of sheep blood [10]. The studies included:− the numbers of the psychrophilic heterotrophic bacteria as HPC 4°C and percentage
estimation of psychrophilic hemolytic heterotrophic bacteria as HemPC 4°C after 10 day incubation at 4°C [13] among HPC 4°C,
− the numbers of psychrotolerant heterotrophic bacteria as HPC 14°C and percentage estimation of the psychrotolerant hemolytic heterotrophic bacteria as HemPC 14°C after 7 day incubation at 14°C [45] among HPC 14°C,
− the numbers of mesophilic heterotrophic bacteria as HPC 28°C and percentage es-timation of the mesophilic hemolytic heterotrophic bacteria as HemPC 28°C and mesophilic A. hydrophila after 72 hour incubation at 28°C [38] among HPC 28°C.The microbiological analyses were run in three parallel repetitions following gen-
eral microbiological standards. The mean and range were calculated.The results obtained for HPC 4°C, HPC 14°C and HPC 28°C were assumed and
recalculated in colony forming units (cfu) per 1 cm3 of water according to the methodol-ogy described by Standard Methods [20]. To investigate HemPC 4°C, HemPC 14°C and HemPC 28°C the strains, producing the transparent circular zones around the colonies, on TSA containing 5% of sheep blood, were assumed and recalculated in colony forming units (cfu) per 1 cm3 of water. Next, percentage estimation of those hemolytic bacteria were calculated among HPC 4°C, HPC 14°C and HPC 28°C, respectively. For deter-mination of quantitative occurrence of the mesophilic strains of A. hydrophila, the total colonies HemPC 28°C were preliminarily screened using the following tests: gram stain, oxidase, susceptibility to O/129 vibriostatic disk (10 and 150 μg), motility, glucose and trehalose fermentation and nitrate reduction. Only the strains found to be gram negative, oxidase positive, negative for O/129 vibriostatic, motile, glucose and trehalose ferment-ing and nitrate reducing were identified with API 20 NE strips (bioMérieux).
IWONA GOŁAŚ I WSP.

31
Molecular analysisFrom the 152 strains preliminarily identified, with API 20 NE strips (bioMérieux), as belonging to A. hydrophila, nucleic acids were isolated by CTAB method [15] with own modifications (personal communications, Korzekwa, 2008). Quality and quantity of iso-lated DNA were determined photometrically at 260 nm (OD260) and adjusted to a final template PCR concentration of about 20 μg⋅cm-3 in TE buffer. Multiplex PCR was real-ized for 16S rDNA, hemolysin and aerolysin sequences present in A. hydrophila tested genomes. Primers A16S based on the A. hydrophila ATCC 7966 16S rRNA sequence (GenBank accession no. X74677) were applied to confirm presence of the 16S rRNA specific gene as an internal control [43]. The AHH1 primer set was designed to am-plify a 130-bp fragment of A. hydrophila extracellular hemolysin gene ahh1 [24]. The AH-aerA primer set amplified a 309-bp fra gment of the A. hydrophila aerolysin gene aerA (GenBank accession no. M16495) [43]. DNA samples (10 ng per reaction mixture) were amplified in a 20⋅10-6 dm3 reaction mixture consisting of 1.25 mM magnesium chlo-ride; 200 μM (dNTP), 2.0 μM AHH1 primers; 1.5 μM AH-aerA, 0.05 μM A16S primers (Integrated DNA Technologies, Coralville, USA), and 1.25 U of Tfl DNA polymerase (Epicentre Biotechnologies, Madison, USA). DNA templates were amplified by thermal-cycler model 2400 (Mastercycler gradient, Eppendorf, Germany) with thermal profile according to Wang et al. [43]. Amplification parameters for all primer sets included an initial denaturation at 95°C for 5 min, followed by 50 cycles of denaturation at 95°C for 0.5 min, annealing of the primers at 59°C for 0.5 min, and primer extension at 72°C for 0.5 min. A final extension at 72°C for 7 min was used. Amplicons were electrophoreti-cally separated in 1.5% ethidium bromide stained agarose at 5 V⋅cm-1, and then visualized with UV (Kucharczyk, TE, Poland). The obtained patterns (Fig. 2) were compared with superladder-MID1 mass molecular marker (GenSura Laboratories). Among the 152 stud-ied strains 83 were finally confirmed as A. hydrophila with aerolysine and hemolysine genes. Next, percentage estimation of A. hydrophila were calculated among HPC 28°C.
Fig. 2. Example of patterns obtained after multiplex-PCR of Aeromonas hydrophila realized for presence confirmation of: species-specific 16S rDNA (~ 356 bp; bottom band), aerolisine gene (~ 306 bp, middle band)
and hemolysine gene (~ 150 bp; upper band); MM – molecular marker, 1 – A. hydrophila LMG 7864, 3 – blind sample (PCR mixture plus DNA template without primers)
Physicochemical testsIn the experimental period, the river water was additionally subjected to physicochemi-cal determinations of the following parameters: temperature (°C), flow (dm3·s-1), pH and
INFLUENCE OF FISHERy MANAGEMENT AND ENVIRONMENTAL FACTORS ON...

32
oxygen saturation (mg O2·dm-3). All microbiological and physicochemical determinations were carried out on the same (common) water samples. The physicochemical determina-tions: temperature, flow, pH, oxygen saturation, were conducted by multimeasurement apparatus Hydrolab Multi 12 (Schott, Germany) with the precision of measurements.: ± 0.1°C, ± 1.0 dm3·s-1, ± 0.01 pH, ± 0.01 mg O2·dm-3 respectively.
Statistical evaluationThe results of microbiological and physicochemical examinations were subjected to sta-tistical evaluation by determining the correlation (estimation by Spearman’ correlation) between a given set of parameters with simple correlation coefficients [42]. The Spear-man’s correlation coefficient was calculated with the use of the STATISTICA PL 7.0 computer software.
RESULTS
Microbiological studiesThe numbers (means and ranges) of the HPC 4°C, HPC 14°C and HPC 28°C and percent-age participation of occurrence of the studied HemPC 4°C, HemPC 14°C, HemPC 28°C and A. hydrophila among HPC 4°C, HPC 14°C and HPC 28°C occurring in the waters of the Drwęca River over the years 2005–2006 are presented in Table 1. Their quantita-tive occurrence fluctuated within the range of a few orders of magnitude depending on the bacteria group assayed (psychrophilic, psychrotolerant, mesophilic) as well as the sampling site and period of study. Regardless of temperature requirements, the smallest mean quantities of HPC 4°C, HPC 14°C and HPC 28°C (respectively: 0.78⋅103, 1.40⋅103 and 1.93⋅103 cfu⋅cm-3) were found at site I (2 km away from the source of the river), while the largest quantities (respectively: 7.57⋅103, 6.65⋅103 and 16.23⋅103 cfu⋅cm-3) – at site VI (the outflow from fish farm no. 2 located in Rychnowska Wola). Similar regularities were also recorded for the minimum and maximum numbers thereof. Throughout the study period, the smallest quantitative occurrence of HPC 4°C and the highest numbers of HPC 14°C and HPC 28°C found in summer months, corresponded to the maximum values of water temperature (19.9–20.8°C) and the minimum concentrations of oxygen dissolved in the water (6.40–6.88 mg O2⋅dm-3). Regardless of the temperature preferences, the smallest mean percentage participation of HemPC 4°C, HemPC 14°C and HemPC 28°C was found at sites I and VIII. It amounted to, respectively: 7.9, 6.8 and 8.6% for the former, and 7.0, 8.9 and 10.1% for the latter, among HPC 4°C, HPC 14°C and HPC 28°C. The highest contamination with HemPC 4°C, HemPC 14°C and HemPC 28°C was characteristic of site VI, where on average the percentage participation of hemolytic bacteria among HPC 4°C, HPC 14°C and HPC 28°C, was recorded at: 10.4, 12.2 and 22.0%. Taking into account temperature requirements, the mean percentage participation of HemPC 4°C and HemPC 14°C fluctuated slightly in the water samples at most of the same sampling sites. It ranged from 6.8 to 12.2% depending on the place of sampling. In turn, the highest percentage participation of hemolytic bacteria at all the sampling sites was found for HemPC 28°C. It ranged from 8.6% at site I to 22.0% at site VI. The mesophilic hemolytic bacteria A. hydrophila (with aerolysine gene) constituted from 0 to 25.6% among HPC 28°C depending on the sampling site, the period of study and certain physicochemical parameters assayed (temperature, flows, pH and dissolved O2 satura-
IWONA GOŁAŚ I WSP.

33
Tabl
e 1.
The
occ
urre
nce
of H
PC 4
°C, H
PC 1
4°C
and
HPC
28°
C a
nd th
e pe
rcen
tage
par
ticip
atio
n of
Hem
PC 4
°C, H
emPC
14°
C, H
emPC
28°
C a
nd m
esop
hilic
stra
ins o
f A.
hydr
ophi
la (a
mon
g of
the
HPC
4°C
, HPC
14°
C a
nd H
PC 2
8°C
, res
pect
ivel
y) in
the
wat
er o
f the
Drw
ęca
Riv
er in
200
5–20
06
Gro
upof
bac
teria
Sam
plin
g si
tes
I (30)
II(3
0)II
I (30)
IV(3
0)V
(30)
VI (3
0)V
II(3
0)V
III (3
0)
HPC
4°C
[× 103 cfu cfu⋅cm-3]
0.78
1 0.
1–1.
9 2
1.91
0.
2–11
.15.
04
0.1–
36.5
3.92
0.
1–28
.43.
63
0.1–
24.4
7.57
0.
1– 4
5.3
3.59
0.
1–8.
21.
70
0.2–
4.7
HPC
14°
C1.
400.
3–3.
31.
660.
1–6.
02.
330.
1–7.
83.
180.
1–11
.31.
990.
2–6.
06.
650.
2–33
.14.
940.
2–13
.31.
99
0.2–
8.9
HPC
28°
C1.
930.
4–5.
93.
840.
1–12
.73.
70.
4–11
.63.
40.
5–10
.73.
30.
1–15
.716
.23
0.8–
63.6
4.03
0.6–
18.8
3.84
0.
1 –2
0.0
Hem
PC 4
°C
[%]
7.9
2.8–
18.7
7.6
1.3–
17.9
8.0
1.7–
14.3
9.7
1.6–
23.1
7.8
0.0–
22.2
10.4
3.
3–16
.49.
8 2.
7–15
.87.
0 1.
0–25
.6
Hem
PC 1
4°C
6.8
0.9–
11.5
9.3
3.6–
33.3
10.2
1.
1–27
.310
.5
0.5–
29.8
8.5
2.1–
16.7
12.2
1.
4–31
.310
.7
1.0–
38.1
8.9
0.0–
25.1
Hem
PC 2
8°C
8.6
1.3–
18.2
15.5
5.
3–36
.815
.0
0.9–
38.1
15.3
1.
6–29
.413
.2
0.7–
36.4
22.0
4.
8–95
.018
.1
6.8–
31.1
10.1
3.
7–18
.3
A. h
ydro
phila
1.1
0.0–
4.8
1.6
0.0–
6.5
2.1
0.0–
9.8
1.6
0.0–
8.0
2.4
0.5–
11.0
5.8
1.3–
18.9
6.4
2.5–
25.6
3.0
1.1–
16.8
1 – m
ean,
2 – ra
nge,
( ) –
num
ber o
f sam
ples
INFLUENCE OF FISHERy MANAGEMENT AND ENVIRONMENTAL FACTORS ON...

34
tion). On average, they were found to be the fewest at site I (1.1% among HPC 28°C), and the most numerous at sites VI and VII (5.8 and 6.4% respectively). Throughout the period of study, this species was not found to occur at sites I, II, III, and IV and only in winter months when the water temperature ranged from 0.2 to 1.0°C. In turn, the highest percentage participation of A. hydrophila (18.9 and 25.6% HPC 28°C) was recorded in July 2005 at sites VI and VII respectively, when the water temperature fluctuated within the range of 18.9 to 19.9°C.
Physicochemical studiesThe ranges of the physicochemical parameters (temperature, flow, pH and oxygen) mea-sured in the waters of the Drwęca River in 2005–2006 are presented in Table 2. Their val-ues changed within a few orders of magnitude, depending on the sampling site, period of study and kind of parameter. In the study period, the temperature of the water varied from 0.2°C (in January 2005) to 20.8°C (in July 2006). The smallest mean value of this param-eter (6.4°C) was noticed at site I, whereas the highest one (9.8°C) occurred at site III. The values of flows Drwęca River ranged from 82.0 to 832.0dm3·s-1
. The smallest mean flow of the river water (99.0 dm3·s-1) was detected at site I, and the highest one (688.0dm3·s-1) observed at site VIII. The value of water reaction (pH) measured for the water samples collected from the Drwęca River varied from 7.16 to 8.32. The smallest mean value of this parameter (7.47) was noticed at site VIII, whereas the highest one (7.96) occurred at site III. The concentrations of oxygen dissolved in water of the Drwęca River ranged from 6.40 to 12.96 mg O2⋅dm-3. The smallest mean concentration of this index was observed at site II (8.46 mg O2⋅dm-3), the highest ones were noticed at sites VI and VII (11.48 and 11.14 mg O2⋅dm-3, respectively).
Statistical evaluationThe results of the statistical analysis of the correlation between the numbers of the studied bacteria (HPC 4°C, HPC 14°C, HPC 28°C, HemPC 4°C, HemPC 14°C, HemPC 28°C, A. hydrophila) recovered from the water of Drwęca River during the whole time of the study and the values of some physicochemical compounds (temperature, flow, pH, O2) in the analyzed water samples are shown in Table 3. The Spearman’s test proved that there were both positive and negative statistically significant (p < 0.05) correlations:− the counts of all the assayed groups of microorganisms versus values of temperature
and oxygen saturation of the water samples collected from the Drwęca River;− the quantitative occurrence of HemPC 28°C and mesophilic strains A. hydrophila
versus water flow values;− the quantitative occurrence of HPC 4°C with HemPC 4°C, HPC 14°C and HPC
28°C;− HemPC 4°C with HemPC 14°C, HemPC 28°C and mesophilic A. hydrophila;− HPC 28°C with HemPC 28°C and mesophilic A. hydrophila;− HemPC 28°C with the quantitative occurrence of mesophilic A. hydrophila.
IWONA GOŁAŚ I WSP.

35
Tabl
e 2.
The
val
ues o
f som
e ph
ysic
oche
mic
al p
aram
eter
s of t
he w
ater
s of t
he D
rwęc
a R
iver
in 2
005–
2006
Sam
plin
gsi
tes
Num
ber
of sa
mpl
esPh
ysic
oche
mic
al p
aram
eter
s
Tem
pera
ture
[°C
]Fl
ow [d
m3 ·s
-1]
pHO
xyge
n [m
g O
2⋅dm
-3]
I30
6.4
199
.07.
758.
920.
2–11
.4 2
82.0
–121
.07.
50–8
.10
6.40
–10.
40
II30
8.5
118.
07.
758.
460.
5–18
.391
.0–1
45.0
7.37
–8.2
06.
88–1
0.56
III
309.
819
7.0
7.96
9.82
0.8–
20.8
180.
0–21
8.0
7.56
–8.3
27.
84–1
1.04
IV30
8.4
265.
07.
738.
881.
0–15
.222
7.0–
306.
07.
50–8
.10
6.40
–10.
56
V30
8.0
309.
07.
8010
.12
1.0–
14.9
250.
0–36
5.0
7.65
–8.1
08.
00–1
1.36
VI
308.
030
8.0
7.64
11.4
81.
0–18
.925
0.0–
365.
07.
20–8
.04
9.12
–12.
96
VII
308.
130
8.0
7.59
11.1
41.
0–19
.925
0.0–
365.
07.
34–7
.82
9.12
–12.
00
VII
I30
8.0
688.
07.
479.
480.
4–16
.152
9.0–
832.
07.
16–7
.80
8.16
–10.
721 –
mea
n, 2 –
rang
e
INFLUENCE OF FISHERy MANAGEMENT AND ENVIRONMENTAL FACTORS ON...

36
Tabl
e 3.
Sta
tistic
est
imat
ion
by S
pear
man
’s c
orre
latio
n (p
< 0
.05,
N =
240
) bet
wee
n th
e nu
mbe
rs [c
fu⋅c
m-3] o
f stu
died
gro
ups o
f mic
roor
gani
sms r
ecov
ered
from
the
wat
er
of th
e D
rwęc
a R
iver
dur
ing
who
le ti
me
of st
udy
and
som
e ph
ysic
oche
mic
al p
aram
eter
s in
wat
er; B
D e
limin
ated
in c
oupl
e
HPC
4°C
Hem
PC 4°C
HPC
14°
C
Hem
PC 1
4°C
HPC
28°
CH
emPC
28°
CA.
hyd
roph
ilaTe
mpe
ratu
re [º
C]
-0.0
6*-0
.26*
0.22
*0.
30*
0.27
*0.
17*
0.44
*Fl
ow [d
m3 ·s
-1]
0.08
0.12
-0.0
8-0
.041
-0.0
37-0
.16*
-0.1
7*R
eact
ion
[pH
]-0
.033
0.05
60.
01-0
.05
0.01
0.01
0.06
Oxy
gen
[mg
O2⋅d
m-3]
0.36
*0.
27*
-0.3
9*-0
.11*
-0.2
3*-0
.13*
-0.3
4*H
PC 4°C
1.00
0.87
*-0
.57*
-0.1
4-0
.27*
-0.0
5-0
.11
Hem
PC 4°C
0.87
*1.
000.
17-0
.59*
0.07
-0.2
6*-0
.18*
HPC
14°
C-0
.57*
0.17
1.00
0.17
0.21
0.01
-0.0
1H
emPC
14°
C-0
.14
-0.5
9*0.
171.
000.
060.
15-0
.05
HPC
28°
C-0
.27*
0.07
0.21
0.06
1.00
0.47
*0.
23*
Hem
PC 2
8°C
-0.0
5-0
.26*
0.01
0.15
0.47
*1.
000.
29*
A. h
ydro
phila
-0.1
1-0
.18*
-0.0
1-0
.05
0.23
*0.
29*
1.00
HPC
– he
tero
troph
ic p
late
cou
nt, H
emPC
– h
emol
ytic
pla
te c
ount
, * –
stat
istic
ally
impo
rtant
diff
eren
ces (
p <
0.05
)
IWONA GOŁAŚ I WSP.

37
DISCUSSION
The research results obtained, concerning the number of heterotrophic bacteria, the num-bers and percentage participation of the potentially pathogenic hemolytic and mesophilic bacteria A. hydrophila in the Drwęca water, demonstrated differences in their occurrence ranging from one to a few orders of magnitude, depending on the group of microorgan-isms assayed (HPC or HemPC), their temperature requirements, the sampling site and the time of sampling. Directly proportional relations between the water temperature and HPC 14 and 28°C as well as the minimum and maximum HPC 4°C corresponding to the highest and lowest values of that parameter in the samples of the water from the Drwęca River indicated dominance of the studied psychrotolerant bacteria (HPC 14°C) and/or the mesophilic ones (HPC 28°C) over the summer months, as well as the psychrophilic bacteria (HPC 4°C) in the winter periods. It was confirmed by statistical analysis, which demonstrated statistically significant (positive or negative) relations between the water temperature and oxygen saturation, respectively: HPC 14°C, HPC 28°C and HPC 4°C. In the waters of the Drwęca River, significant negative correlations between HPC 4°C on the one side and HPC 14°C and HPC 28°C on the other indicate a seasonal nature of the occurrence of particular groups of bacteria under examination, whose numbers are also conditioned by the content of oxygen dissolved in water, which changes depending on the water temperature [1]. It is confirmed by the maximum numbers of HPC 4°C recorded in the winter months at 10.40–12.96 mg O2⋅dm-3 as well as HPC 14 and 28°C in the sum-mer months at 6.40–6.88 mg O2⋅dm-3. Similar trends and relations between the water temperature and the content of oxygen dissolved in it on the one side and the numbers of heterotrophic bacteria on the other were found in the waters of two Canadian rivers: the Meduxnekeang and the Dunbar by Bell et al. [7] as well as in the samples of water from the Portrero de los Funes River in Argentina Almeida et al. [3]. The smallest and the larg-est mean ranges of the occurrence of all the HPC groups assayed, regardless of their tem-perature requirements, observed respectively at site I (control site) and sites VI and VII (constituting outflows from fish farms no. 2 and 3) indicate a local and/or periodic influ-ence of intensive fishery management on the microbiological quality of the Drwęca River waters. It results from the fact that organic substances supplied to the water in the form of unused fish feed and fish excrement create favorable conditions for the growth and de-velopment of heterotrophic microorganisms [9, 17, 31]. This is also confirmed by similar trends in the minimum and maximum numbers of heterotrophic bacteria (proteolytic, am-monifying and denitrifying ones) at appropriate sites recorded in previous research over the Drwęca River waters [18, 19]. In aquatic environments, the presences of hemolytic bacteria may pose an epidemiological threat to people and organisms inhabiting them [5, 12]. In the Drwęca River waters, the changing numbers of HemPC 4°C, 14°C and 28°C depending on the period of study, temperature and O2 saturation were confirmed by sta-tistical analysis. Their lowest percentage participation found at sites I and VIII confirms the fact that those microorganisms, represented by numerous bacteria species, belonging, among others, to the genera: Escherichia spp., Yersinia spp., Vibrio spp. or Aeromonas spp., commonly occur in aquatic environments where they often get from the catchment area [14, 33, 41]. In turn, the highest contamination with all the hemolytic microorgan-isms under examination recorded in the summer months at site VI suggests an adverse local and/or periodic impact of the fishery management. In the circumstances of intensive
INFLUENCE OF FISHERy MANAGEMENT AND ENVIRONMENTAL FACTORS ON...

38
fattening, fish excrete large numbers of bacteria belonging to various genera [8, 21, 22, 46, 47], which, despite their potential pathogenicity, constitute saprophytic microflora of the fish [10, 23]. In the studied samples of the Drwęca River waters, the determined percentage diversity of the identified mesophilic bacteria A. hydrophila among HPC 28°C and the statistically significant differences in their numbers depending on the time and place of sampling confirm the thesis that the occurrence of those strains changes under the influence of various environmental factors and depending on the level of contamina-tion of water reservoirs [4, 26, 28, 30]. It is also proved by the statistically significant correlations (p < 0.05) between the numbers of the bacteria of that species on the one side and HPC 28°C and HemPC 28°C on the other, as well as the values of physicochemical parameters (temperature, flow and O2).
CONCLUSION
In the waters of the Drwęca River, the quantitative diversification of the bacteria under examination, particularly between the periods of study, indicates a significant impact of environmental and/or fishery management. It was confirmed by the statistical analysis which demonstrated correlation between their quantitative occurrence and the tempera-ture values and O2 concentration in the water. The highest contamination with HPC 4°C, HPC 14°C and HPC 28°C as well as the highest percentage participation of all the studied HemPC and identified mesophilic strains of A. hydrophila (with aerolysine and hemoly-sine genes) found in water samples from sites VI and/or VII (constituting outflows from fish farms no. 2 and 3) in the summer months suggest a local and/or periodic adverse impact of fishery management. Statistically significant correlations (p < 0.05) between the quantitative occurrence of mesophilic bacteria A. hydrophila on the one side and HPC 28°C and HemPC 28°C on the other, as well as the values of physicochemical parameters (temperature, flow and O2) confirm the thesis that the occurrence of those microorganisms in the waters of the Drwęca River depends on the degree of microbiological contamina-tion and environmental factors. Along with the changes in physicochemical parameters of the Drwęca River waters, related to the seasons of the year and/or intensification of the fishery management, there occur a lot of reciprocal processes between particular physio-logical groups, genera or species of microorganisms, manifesting themselves in domi-nance of different groups of microorganisms [7], including also potentially pathogenic strains or pathogens [34].
AcknowledgementsThis study was partly supported by the grant No. N305 110 31/3667 from the Ministry of Science and Higher Education (Poland).
REFERENCES
[1] Addy K., L. Green: Dissolved oxygen and temperature, [in:] Natural resources Facts, University of Rhode Islands, College of Resource Development, Department of Natural Resources Science, Cooperative Ex-tension, Fact Sheet No. 96-3 (1997).
[2] Alef K., P. Nannipieri: Methods in applied soil microbiology and biochemistry, Academic Press, Hancourt Brace Company Publishers, London, San Diego, New York, Boston, Sydney, Tokyo, Toronto 1995.
[3] Almeida C.A., S. Quintar, P. González, M.A. Mallea: Influence of urbanization and tourist activities
IWONA GOŁAŚ I WSP.

39
on the water quality of Potrero de los Funes River (San Luis – Argentina), Environ Monit. Assess, 133, 459–465 (2007).
[4] Ashbolt N.J., A. Ball, M. Dorsch, C. Turner, P. Cox, A. Chapman, S.M. Kirov: The identification and hu-man health significance of environmental aeromonads, Wat. Sci. Tech., 31(5-6), 263–269 (1995).
[5] Atlas R., R. Bartha: Microbial Ecology Fundamentals and Applications, 4th ed., California, Benjamin/Cummings Science Publishing, 1998.
[6] Barcina I., P. Lebaron, J. Vives-Rego: Survival of allochtonous bacteria in aquatic systems: a biological approach, FEMS Microbiology Ecology, 23, 1–9 (1997).
[7] Bell C.R., M.A. Holder-Franklin, M. Franklin: Correlations between predominant heterotrophic bacteria and physicochemical water quality parameters in two Canadian rivers, Appl. Environ. Microbiol., 43(2), 269–283 (1982).
[8] Beveridge M.C.M., M. Begum, G.N. Frerisch, S. Millar: The ingestion of bacteria in suspension by the tilapia Oreochromis niloticus, Aquaculture, 81, 373–378 (1989).
[9] Boaventura R., A.M. Pedro, J. Coimbra, E. Lencastre: Trout farm effluents: characterization and impact on the receiving streams, Environmental Pollution, 95(3), 379–387 (1997).
[10] Bomo A-M., A. Husby, T.K. Stevik, J.F. Hanssen: Removal of fish pathogenic bacteria in biological sand filters, Water Research, 37, 2618–2626 (2003).
[11] Bracken C.L., C.W. Hendricks, A.K. Harding: Apparent bias in river water inoculum following centrifu-gation, Journal of Microbiological Methods, 67, 304–309 (2006).
[12] Chang C-I., W-Y. Liu, C-Z. Shyu: Use of prawn blond agar hemolysis to screen for bacteria pathogenic to cultured tiger prawns Penaeus monodon, Dis. Aquat. Org., 43, 153–157 (2000).
[13] Deming W.J.: Psychrophiles and Polar Regions, Ecology and industrial microbiology, 5, 301–309 (2002).
[14] Derlet R.W., J.R. Carlson, M.N. Naponen: Coli form and pathologic bacteria in Sierra Nevada Na-tional Forest Wilderness Area Lakes and Streams, Wilderness and Environmental Medicine, 15, 245–249 (2004).
[15] Doyle J.J., J.L. Doyle: A rapid DNA isolation procedure for small quantities of fresh leaf tissue, Phyto-chem. Bull., 19, 11–15 (1987).
[16] Dzyuban A.N.: The environmental conditions of the Sheksna Reservoir: assessment based on microbio-logical investigations, Water Resources, 32(1), 62–72 (2005).
[17] Enell M.: Environmental impact of nutrients from Nordic fish farming, Wat. Sci. Tech., 31(10), 61–71 (1995).
[18] Gołaś I., I. Zmysłowska, M. Harnisz, K. Korzekwa, A. Skowrońska, M. Teodorowicz, D. Górniak, E. Dudziec: Anthropogenic impact on quantitative differentiation of nitrogen cycling bacteria in waters of the Drwęca River, Pol. J. Natur. Sci., 23(3), 667–680 (2008).
[19] Gołaś I., I. Zmysłowska, M. Harnisz, K. Korzekwa, A. Skowrońska, M. Teodorowicz, D. Górniak, M. Gros, S. Brzozowa: Nitrogen cycle bacteria in the waters of the Drwęca River, Pol. J. Environ. Stud., 17(2), 215–225 (2008).
[20] Greenberg A.E., L.S. Clesceri, A.D. Eaton (Eds.): American Public Health Association Standard methods for the examination of water and wastewater, 18th edition, Washington 1992.
[21] Harnisz M., I. Zmysłowska, I. Gołaś, J. Krause: Bakteriologiczna jakość wód pochłodniczych podczas prowadzenia intensywnego chowu ryb, [in:] Ochrona zdrowia ryb – aktualne problemy, A.K. Siwicki, J. Antychowicz, W. Szweda (eds), Inland Fisheries Institute, Olsztyn 2004, pp. 191–196.
[22] Harnisz M., I. Zmysłowska, I. Gołaś, E. Terech-Majewska: Występowanie gram-ujemnych pałeczek w wodzie i rybach podczas intensywnego tuczu, [in:] Ochrona zdrowia ryb – aktualne problemy, A.K. Si-wicki, J. Antychowicz, W. Szweda (eds), Inland Fisheries Institute, Olsztyn 2004, pp. 131–136.
[23] Hänninen M-L., P. Oivanen, V. Hirvelä-Koski: Aeromonas species in fish, fish-eggs, shrimp and freshwa-ter, Int. J. Food Microbiology, 34, 17–26 (1997).
[24] Hirono I., T. Aoki: Nucleotide sequence and expression of an extracellular hemolysin gene of Aeromonas hydrophila, Microb. Pathog., 11, 189–197 (1991).
[25] Janda M.J.: Recent advances in the study of the taxonomy, pathogenicity, and infectious syndromes with the genus Aeromonas, Clin. Microbiol. Rev., 4(4), 397–410 (1991).
[26] Lewandowska D., I. Gołaś, M. Harnisz, E. Terech-Majewska, D. Górniak, M. Teodorowicz: Jakość mikrobiologiczna wód rzeki Drwęcy a intensywna gospodarka rybacka, [in:] Ochrona zdrowia ryb – aktualne problemy, A.K. Siwicki, J. Antychowicz, W. Szweda (eds), Inland Fisheries Institute, Olsztyn 2004, pp. 251–256.
[27] Lubova T.I., L.V. Listova, L.Yu. Popova: Distribution of heterotrophic bacteria in Lake Shira, Microbio-logy, 73(1), 89–93 (2004).
INFLUENCE OF FISHERy MANAGEMENT AND ENVIRONMENTAL FACTORS ON...

40
[28] Maalej S., A. Mahjoubi, C. Elazari, S. Dukan: Simultaneous effects of environmental factors on motile Aeromonas dynamics in an urban effluent and in the natural seawater, Water Research, 37, 2865–2874 (2003).
[29] Margesin R., G. Feller, C. Gerday, N.J. Russell: Cold-adapted microorganisms: adaptation strategies and biotechnological potential, [in:] G. Bitton (ed.), The encyclopedia of environmental microbiology, Wiley, New York 2002, pp. 871–885.
[30] Mary P., G. Buchet, C. Defives, J-P. Hornez: Growth and survival of clinical vs. environmental species of Aeromonas in tap water, International Journal of Food Microbiology, 69, 191–198 (2001).
[31] Moriarty D.J.W.: The role of microorganisms in aquaculture ponds, Aquaculture, 15, 333–349 (1997).[32] Morita R.Y.: Psychrophilic bacteria, Bacteriol. Rev., 39, 144–167 (1975).[33] Nishibuchi M., J.B. Kaper: Thermostable direct hemolysin gene of Vibrio parahaemoliticus: a virulence
gene acquired by marine bacterium, Infect. Immun., 63(6), 2093–2099 (1995).[34] Ørmen Ø., M.Q. Regue, J.M. Tomás, P.E. Granum: Studies of aerolysin promoters from different Aeromo-
nas spp, Microbial Pathogenesis, 35, 189–196 (2003).[35] Peter T.: Dni Drwęcy po raz dziewiętnasty, Aura, 8, 26–27 (2003).[36] Peter T.: Miasta nad Drwęcą, Aura, 10, 18–19 (1997).[37] Peter T.: To już piętnaste dni Drwęcy, Aura, 9, 20 (1999).[38] Pianetti A., W. Baffone, F. Bruscolini, E. Barbieri, M.R. Biffi, L. Salvaggio, A. Albano: Presence of
several pathogenic bacteria in the Metauro and Foglia Rivers (Pesaro-Urbino, Italy), Water Resources, 32(5), 1515–1521 (1998).
[39] Raport o stanie środowiska Województwa Warmińsko-Mazurskiego w 2002 roku, Biblioteka Monitoringu Środowiska, Olsztyn 2003.
[40] Serrano E., B. Moreno, M. Solaun, J.J. Aurrekoetxea, J. Ibarluzea: The influence of environmental factors on microbiological indicators of coastal water pollution, Wat. Sci. Tech., 38(12), 195–199 (1998).
[41] Sharma A., N. Dubey, B. Sharan: Characterization of aeromonads isolated from the river Narmada, India, Int. J. Hyg. Environ-Health., 208, 425–433 (2005).
[42] Stanisz A.: Przystępny kurs statystyki z zastosowaniem STATISTICA PL na przykładach z medycyny, tom 1, Statystyki podstawowe, StatSoft Poland, Kraków 2006.
[43] Wang G., C.G. Clark, C. Liu, C. Pucknell, C.K. Munro, T.M.A.C. Kruk, R. Caldeira, D.L. Woodward, F.G. Rodgers: Detection and characterization of the hemolysin genes in Aeromonas hydrophila and Aero-monas sobria by Multiplex PCR, J. Clin. Microbiol., 41(3), 1048–1054 (2003).
[44] Williams M.L., M.L. Lawrence: Identification and characterization of two-component hemolysin from Edwardsiella ictaluri, Veterinary Microbiology, 108, 281–289 (2005).
[45] Zhang G., X. Ma, F. Niu, M. Dong, H. Feng, L. An, G. Cheng: Diversity and distribution of alkaliphilic psychrotolerant bacteria in the Qinghai-Tibet Plateau permafrost region, Extremophiles, 11, 415–424 (2007).
[46] Zmysłowska I., D. Lewandowska, J. Guziur: Microbiological study of ide (Leuciscus idus L.) from ponds of different trophy, Arch. Pol. Fish., 8, 259–269 (2000).
[47] Zmysłowska I., D. Lewandowska, E. Pimpicka: Microbiological evaluation of water and gastric contents of tench (Tinca tinca L.) during tank rearing, Arch. Pol. Fish., 8, 95–105 (2000).
Received: October 20, 2008; accepted: March 17, 2009.
WPŁYW GOSPODARKI RYBACKIEJ I CZYNNIKóW ŚRODOWISKOWYCH NA WYSTęPOWANIE BAKTERII HETEROTROFICZNYCH, HEMOLIZUJąCYCH I MEZOFILNYCH ORAZ AEROMONAS
HYDROPHILA W WODACH RZEKI DRWęCY, POLSKA
Badania obejmowały oznaczenia liczebności bakterii heterotroficznych: psychrofilnych, psychrotolerancyjnych i mezofilnych oraz procentowego udziału bakterii hemolizujących i Aeromonas hydrophila (posiadających geny aerolizyny i hemolizyny) w wodach rzeki Drwęcy w zależności od czynników środowiskowych i gospodarki rybackiej. Średnie liczebności bakterii heterotroficznych (HPC) oznaczanych w 4, 14 i 28°C były odpowiednio w zakresach: 0,78–7,57⋅103, 1,40–6,65⋅103, 1,93–16,23⋅103 jtk⋅cm-3. Procentowy udział bakterii hemolizujących (HemPC) i A. hydrophila wśród drobnoustrojów heterotroficznych: psychrofilnych, psychrotolerancyjnych i mezofilnych oznaczanych w 4, 14, 28°C wynosił odpowiednio: 7,9–10,4, 6,8–12,2, 8,6–22,0 i 1,1–6,4%. Statystycznie istotne zależności pomiędzy liczebnością badanych grup bakterii a wartościami temperatury, przepływu i stężeniami rozpuszczonego w wodzie tlenu wskazują, że występowanie tych drobnoustrojów jest związane ze stopniem mikrobiologicznego zanieczyszczenia tego ekosystemu, wynikającym z gospodarki ry-backiej i czynników środowiskowych.
IWONA GOŁAŚ I WSP.

41
PL ISSN 0324-8461
© Copyright by Institute of Envionmental Engineering of the Polish Academy of Sciences, Zabrze, Poland 2009
ARCHIVES OF ENVIRONMENTAL PROTECTIONvol. 35 no. 2 pp. 41 - 52 2009
CHARACTERISTIC OF GRANULATED ACTIVATED SLUDGE FED WITH GLyCERIN FRACTION FROM BIODIESEL PRODUCTION
AGNIESZKA CYDZIK-KWIATKOWSKA1*, ANDRZEJ BIAŁOWIEC1, IRENA WOJNOWSKA-BARYŁA1, LECH SMOCZYńSKI2
1 University of Warmia and Mazury in Olsztyn, Department of Environmental Biotechnologyul. Słoneczna 45G, 10-957 Olsztyn-Kortowo, Poland
2 University of Warmia and Mazury in Olsztyn, Department of Chemistrypl. Łódzki 4 10-957 Olsztyn-Kortowo, Poland
*Corresponding author e-mail: [email protected]
Keywords: Glycerin fraction from biodiesel production, granulated activated sludge, free settling test, waste treatment.
Abstract: In the presented research glycerin fraction from biodiesel industry was used for granulated aerobic activated sludge production in a typical sequencing batch reactor (h/d equal 2.1). After 7 weeks of operation, granulated activated sludge with SVI at the level of 40–50 cm3·g-1 was obtained. At organic compounds load of 1.43 ± 0.1 mg COD·mg VSS-1·d-1, the efficiency of carbon removal was 94.14 ± 2.7% and most of the introduced COD was removed during the first 2–3 hours of aeration. The sieve analysis revealed that 60% (w/w) of biomass consisted of particles with a diameter in the range of 4–8 mm. A free settling test procedure proved that granules with a diameter between 2–4 mm were numerically most abundant in biomass (32.3%) and that the settling volume, mass and Reynolds number values significantly (p < 0.05) increased parallel with increasing granule diameter. Adverse tendency was observed for the mean effective, buoyant density of a granule in a liquid.
INTRODUCTION
Systems with immobilized biomass are widely used for treating wastewater because of a resistance to environmental factors and high concentration of pollutants. In recent years, attention was focused on a new form of immobilization that is biogranulation. This proc-ess involves cell-to-cell interactions resulting in formation of dense microbial consortia – granules. The main advantages of granulated activated sludge are very good settling abil-ity, long biomass retention time and biomass concentration as well as ability to withstand high organic loading rate [15]. From engineering perspective employing technologies based on granulated activated sludge results in smaller dimensions of clarifiers, shorter standstill for settling and more time for biological removal of pollutants.
Most of the research on biogranulation is carried out in reactors with h/d ratio of 10 or more [5, 27, 28]. The literature data indicate that in order to obtain aerobic granules different organic substrates, like glucose, acetate [18], phenol [11], dairy effluents [22] or wastewater, were used as the carbon source [3, 9]. It seems especially advantageous to use organic wastes form different branches of economy for granulated activated sludge production.

42
Present trends in fuel market encourage the production of biodiesel. Biodiesel is the name of a clean burning alternative fuel, produced from domestic, renewable resources [8]. Its production can be carried out in both large factories and small installations for a farmer own use. It is made through a chemical process called transesterification whereby the glycerin is separated from the fat or vegetable oil. Unfortunately, the process leaves behind other byproducts than methyl esters (the chemical name for biodiesel) that is so called glycerin fraction. Glycerin fraction consists of glycerin (about 30–75%), methanol (5–20%), mono- and diglycerides, free fatty acids, phospholipids, water, soaps etc. – their percentage participation depends on the substrate and parameters of transesterification process [17].
In large factories a glycerin fraction is purified and can be further processed, in the case of production for farmers own use, however, chemical purification of contaminated glycerin is unprofitable and there is a risk that the glycerin fraction will be treated as waste. Because of a high load of organic compounds, contaminated glycerin may cause environmental pollution or disturb wastewater treatment plant functioning. To partially resolve this problem the glycerin fraction can be used as a carbon source for granulated activated sludge production. Granulated activated sludge is a promising technology for decentralized wastewater treatment [14] and can be used, for example, in household sew-age treatment plants.
The aim of the presented research was to investigate possibilities of forming of aerobic granulated activated sludge in the reactor with h/d of 2.1 fed with glycerin frac-tion from biodiesel production. This research, according to our knowledge, is the first time when granulated activated sludge was obtained on the base of this substrate. In order to characterize the obtained biomass, free settling tests and wet sieving analysis were employed. Employment of a typical SBR reactor and easily available organic substrate enhances a utilitarian potential of presented technology of granulated activated sludge production.
MATERIALS AND METHODS
SBR operationThe experiment was carried out for 130 days. In the experiment a 8.0 dm3 sequencing batch reactor with a height of 36 cm and 17 cm diameter was employed (h/d = 2.1). Seed sludge was collected from a conventional municipal wastewater treatment plant in Olsztyn (Poland). The glycerin fraction (423 g COD·dm-3, oil and grease 77 g·dm-3, total nitrogen 0.98 g N·dm-3) were obtained from a farmer biodiesel installation in Lubomi-no (Poland). The temperature in the experiment room was ambient (varying from 18 to 21°C) and pH in reactor was kept between 7 and 8. The reactor was supplied with a con-stant air velocity of 8 dm3·min-1, and wastewater exchange ratio of 75% was employed. The SBR operated in 12-hour cycle, with the following operating strategy: aeration (705 min), settling (5 min) decantation (5 min) and filling (5 min). During the filling period 4 dm3 of artificial wastewater and 2 dm3 of mixture of glycerin fraction and tap water were added to the reactor to make the final working volume of 8 dm3. The artificial waste-water was composed of NH4Cl (76.1 mg·dm-3), Na2HPO4⋅12H2O (46.0 mg·dm-3), NaCl (10.1 mg·dm-3), KCl (4.7 mg·dm-3), CaCl2 (3.5 mg·dm-3), MgSO4⋅7H2O (16.7 mg·dm-3), NaHCO3 (243.2 mg·dm-3), Na2CO3 (162.2 mg·dm-3), FeCl3⋅6H2O, MnSO4⋅H2O, ZnSO4,
A. CYDZIK-KWIATKOWSKA, A. BIAŁOWIEC, I. WOJNOWSKA-BARYŁA, L. SMOCZYńSKI

43
CuSO4·5H2O (0.2 mg·dm-3) [modified 7]. The glycerin fraction was added in amount that led to mean COD concentration in the reactor at the beginning of aeration phase of 0.522 ± 0.11 g COD·dm-3.
Analytical measurementsSampling was made at the influent and effluent of the reactor. All samples were filtered using 0.2 µm micro-pore filter before being assayed. Oil and grease in glycerin fraction were measured using Soxhlet extractor and total nitrogen was measured by distillation method. Chemical oxygen demand, total suspended solids, volatile suspended solids and sludge volume index were measured according to Standard Methods [2]. On the 114 and 120 day of the experiment, samples were taken every hour during SBR cycle to describe COD and TSS concentration changes in the reactor.
Activated sludge characteristicRespirometric measurements were performed in duplicate using OxiTop System (WTW, Germany). Samples of granulated activated sludge were taken after 120 days of reactor operation at the end of SBR cycle. The biomass was washed in duplicate with phosphate buffer then with distilled water, and the TSS was measured. The procedure was conducted as previously described [4].
The particle size selection of granulated activated sludge was done according to commonly used particle size analysis of soil [21]. A wet sieving technique using Retsch AS 200 Sieve Machine was employed with the following sieve size classes: 0.25, 0.5, 1, 2, 4, and 8 mm. For sieving, 750 cm3 of granulated activated sludge was taken. The siev-ing process was supported by tap water (temperature 12°C) from the spray nozzle which was located above the uppermost sieve. The water left the sieve stack together with the last fraction through the outlet in the collector. Rinsing was carried out until the liquid leaving the sieve stack outlet was no longer turbid with solid particles. In this experiment sieving lasted for 5 minutes and an amplitude of vibration was 1.5 mm.
In order to examine physical properties of granulated activated sludge and separated granule classes the free settling test procedure described by [23] was used. Granulated activated sludge sample of 2 cm3 was taken from the reactor and placed in a column filled with tap water (temperature 12°C). A floc settling was photographed in the dark room. The settling flocs were illuminated with photo-flash-lamp controlled by an electronic sys-tem ensuring flashes every 3 seconds. The digital camera (Canon G5, resolution 5 Mpic.) shutter was kept open for 5 flashes for every photo. Four photos were taken during 15 to 20 min of settling, before the next sludge sample was introduced. In the experimental run 24 photos were taken. During the experiment 573 granules were examined. The equiva-lent diameter, granule radius and settling velocity of granules were measured using the software UTHSCSA Image Tool version 3.0. According to the Stoke’s law the following physical parameters were determined: density of granules, effective, buoyant density of aggregate in liquid, granule volume, granule mass, Reynolds number, and fractal dimen-sion of granule. For calculations it was provided that the granules were impermeable and spherical. Water density and viscosity values were presumed for 12°C and made 0.9995 g·cm-3 and 1.230·10-3 kg·m-1·s-1 respectively.
According to Stoke’s law the granules density may be expressed as:
CHARACTERISTIC OF GRANULATED ACTIVATED SLUDGE FED WITH ...

44
(1)
This is the real density of a granule containing aggregated microorganisms and wa-ter. The effective, buoyant density of an aggregate in liquid (excluding water) may be expressed as:
(2)
The granule volume was calculated on the basis of the equation for the volume of the sphere. The granule mass was calculated as:
(3)
The Reynolds number of granules settling was determined on the basis of the fol-lowing equation:
(4)
An important parameter that characterizes a fractal object is the fractal dimension, which corresponds to the space-filling capacity of an object. The mass of a fractal object with fractal dimension ranging 1 ≤ D ≤ 3 can be considered to be proportional to its size [29]. With known granule density, granule mass, and with known dependence for fractal objects:
(5)
provided that the granule is spherical, (m) may be expressed as:
(6)
so
(7)
hence
(8)and
(9)
(D-3) means the slope of the log-log line; therefore the fractal dimension may be obtained as:
(10)
Statistical analysesThe analysis of variance between mean values of estimated parameters of granules was carried out with the use of ANOVA test at the significance level of p < 0.05.
The normality of the distribution was confirmed by Szapiro-Wilk’s test, whereas the hypothesis of the homogeneity of variances across the groups was verified on the basis of Levene’s test. In the text after symbol ± standard deviation was given.
RESULTS
In the presented experiment SVI value of the seed sludge was 103 cm3·g-1. After a startup of the experiment this value gradually decreased parallel with the growth of granules
A. CYDZIK-KWIATKOWSKA, A. BIAŁOWIEC, I. WOJNOWSKA-BARYŁA, L. SMOCZYńSKI

45
and after about 80 cycles (40 days) of reactor operation it stabilized at the level of 40–50 cm3·g-1 (Fig. 1A). Small granules with a diameter of about 2 mm were observed for the first time after 70 cycles, after 80 cycles of reactor operation a well shaped granulated activated sludge was obtained in the reactor (Fig. 1B).
Fig. 1. Granulated activated sludge fed with glycerin fraction A) sludge volume index changes during the experiment, B) mature granules after 7 weeks of reactor operation
Chemical analyses were started from cycle 50. During investigation period the mean cellular residence time (sludge age) averaged 2.2 ± 0.4 day. At mean organic compounds load of 1.43 ± 0.1 mg COD·mg VSS-1·d-1, the removal of COD during the experiment averaged 94.14 ± 2.7% (Fig. 2A) and chemical oxygen demand in the effluent did not ex-ceed 124 mg COD·dm-3. COD concentration changes during the SBR cycle (mean values from cycles 114 and 120) are presented in Figure 2B. After wastewater addition, COD concentration in the reactor was 450 ± 19 mg O2·dm-3, during the first 3 hours it rapidly decreased to about 40 mg COD·dm-3 and remained at this level to the end of SBR cycle. Biomass increased according to 0-order reaction (data not shown) and the mean growth
Fig. 2. COD concentration changes A) in the reactor from day 50 to the end of the experiment, B) during the SBR cycle (mean values are given with standard deviation bars)
CHARACTERISTIC OF GRANULATED ACTIVATED SLUDGE FED WITH ...
120

46
yield of microorganisms was 0.41 ± 0.23 mg TSS·mg-1 COD. Respirometric measure-ments showed that oxygen uptake for endogenous respiration was at the level of 11.4 ± 5.8 mg O2·g VSS-1·h-1 and no oxygen depletion for nitrification was observed. The oxygen depletion for substrates oxidation was, however, high and averaged 69.5 ± 6.5 mg O2·g VSS-1·h-1.
In order to characterize the obtained biomass, the sieve analysis and free settling tests were employed. The sieve analysis showed that more than 60% (w/w) of biomass consisted of particles with the diameter in the range of 4–8 mm. Granules with diameters 2–4 mm and > 8 mm had also significant contribution in total biomass – 10.7 and 18.4% (w/w), respectively (Fig. 3). On the basis of the cumulative curve of granules size distri-bution it was calculated that 80% (w/w) of all granules had diameter in the range from 2.1 to 9.8 mm.
Fig. 3. The granule size distribution in granulated activated sludge
The analysis of granulated activated sludge digital photos allowed for detailed char-acterization of granulated activated sludge as a whole and granules in particular size classes (Tab. 1). The granulated activated sludge was characterized by a mean settling velocity of 3.26 ± 2.19 mm·s-1, effective, buoyant density of 3.86 ± 5.64 mg·cm-3 and granule equivalent diameter of 2.71 ± 2.14 mm. In general, the settling of granulated activated sludge had laminar character because Reynolds number value was below 2300. The ratio of settling velocity to granule diameter (V/R) equaled 1.79 and confirmed the good settling properties of granulated activated sludge. The mean real density of granules containing aggregated microorganisms and water was on the level of 1.0034 ± 0.0056 g·cm-3, and was higher than the density of water in the same temperature (12°C). The fractal dimension calculated for granulated activated sludge was 1.459, with r2 of log(ρe) - log(r) equal 0.768 (Tab. 1.).
A. CYDZIK-KWIATKOWSKA, A. BIAŁOWIEC, I. WOJNOWSKA-BARYŁA, L. SMOCZYńSKI

47
Wet sieving procedure categorized granules in 6 size classes. Statistical analysis proved significant (p < 0.05) differences of all measured parameters between the classes. Granules with the diameter between 2–4 mm were numerically most abundant in biomass and consisted in 32.3% of all granules (Tab. 1). It was observed that V, Vf, m and Re values significantly (p < 0.05) increased parallel with increasing granules diameter. The granules with diameter below 2 mm, weighted less than 0.058 ± 0.037 mg while larger granules with diameter exceeding 2 mm had mass in the range from 0.078 ± 0.047 to 0.508 ± 0.183 mg. Adverse tendency was observed for the mean effective, buoyant densi-ty of an aggregate in a liquid (ρe) (Tab. 1). For small granules (0.25 < R < 2 mm) it was in range between 5.01 ± 3.23 and 13.66 ± 10.63 mg·cm-3, but larger granules with R higher than 2 mm had relatively small ρe ranging from 0.13 ± 0.1 to 0.88 ± 0.08 mg·cm-3.
An additional experiment proved that a twofold increase in glycerin fraction load resulted in disintegration of the granules in the reactor in given technological conditions. The obtained biomass was also stored for 4 weeks at 4°C in the effluent wastewater without oxygen and substrate supply. After 4 weeks most of the granules preserved their structural integrity.
DISCUSSION
The major selection pressures responsible for aerobic granulation are settling time and wastewater exchange ratio. On the basis of literature data in the presented experiment settling time of 5 minutes and wastewater exchange ratio of 75% were employed [16, 20]. The transition from flocculated sludge to sludge with low SVI (40–50 cm3·g-1) typical
Parameters of granulated
activated sludge
Diameter range of granules [mm] Total in reactor
0.25–0.5 0.5–1.0 1.0–2.0 2.0–4.0 4.0–8.0 > 8.0
R [mm] 0.37± 0.05
0.69± 0.15
1.45± 0.30
2.90± 0.50
5.47± 0.99
9.66± 2.48
2.71± 2.14
V [mm·s-1] 0.75± 0.38
1.99± 1.41
4.17± 2.42
2.86± 1.79
4.13± 1.90
5.47± 1.23
3.26± 2.19
V/R [s-1] 2.08± 1.27
2.75± 1.63
2.97± 1.73
1.03± 0.74
0.78± 0.40
0.61± 0.22
1.79± 1.53
Re – 0.44± 0.21
2.41± 2.14
9.72± 6.18
13.05± 7.87
35.92± 18.08
84.68± 30.47
16.12± 19.48
ρe [mg·cm-3] 13.66± 10.63
9.08± 5.21
5.01± 3.23
0.88± 075.
0.35± 0.22
0.16± 0.10
3.86± 5.64
ρf [g·cm-3] 1.0132± 0.0106
1.0086± 0.0052
1.0045± 0.0032
1.0004± 0.0018
0.9998± 0.0002
0.9997± 0.0001
1.0034± 0.0056
Vf [cm3] 0.0002± 0.0001
0.0016± 0.0011
0.0144± 0.0085
0.1109± 0.0551
0.7560± 0.4327
4.4971± 3.4726
0.3080± 0.9917
m [mg] 0.003± 0.001
0.014± 0.013
0.058± 0.037
0.078± 0.047
0.216± 0.109
0.508± 0.183
0.097± 0.117
N – 47 63 159 185 102 17 573%N [%] 8.2 11.0 27.7 32.3 17.8 3.0 100
Tab. 1. The physical parameters of examined activated sludge (after symbol ± standard deviation is given, ANOVA test proved significant (p < 0.05) differences between granules classes for all measured parameters)
CHARACTERISTIC OF GRANULATED ACTIVATED SLUDGE FED WITH ...

48
for granulated activated sludge [27, 28] proved that the chosen strategy was successful. Moreover, only granules with diameter between 0.25–0.5 mm had Re below 1, character-istic for activated sludge flocs [12]. Remaining granules classes had Re value higher than 1 and this fact additionally confirmed granulation of activated sludge.
In the presented research wet sieving technique and free settling tests were em-ployed for granules characteristics. Because of their simplicity and low testing cost, the free-settling tests are the most widely described method in literature for measuring the flocs basic physical properties [6]. From practical point of view, free settling tests may be useful for technological description of granulated activated sludge properties. Providing that highly compacted flocs (granules) are impermeable, this method allows for determin-ing settling velocity, mass, volume and fractal dimension of granules.
Reynolds number values pointed out that the sludge settling in the reactor had lami-nar character and SVI changes in time showed that settle ability improved as the granula-tion progressed. Presuming that granules are characterized by Re > 1 [12], 2.5% (w/w) of biomass in the reactor (a sum of masses of particles with diameter below 0.5) were flocs. Free settling tests results indicate that granules with Re > 1 had equivalent diame-ter higher than 0.5 mm and minimal settling velocity of about 2 mm·s-1. On the basis of these results it can be concluded that in order to separate the small fraction of flocs from granules in employed reactor, sedimentation period should be shortened to about 1–1.5 minute, so that only particles with settling velocity equal or higher than 2 mm·s-1 would be separated.
Settling velocity of microbiological aggregates depends on the geometric param-eters of these particles as well as their density and porosity. Fractal dimension of an object is a quantitative measure of how the primary particles occupy the floc interior space. Li and Ganczarczyk [13] proved that aggregates generated in water and wastewater treat-ment processes exhibit a fractal dimension between 1.4 and 2.8. The values close to 1.4 are representative for flocs with smooth surface, while 2.8 is typical for very wrinkled and porous flocs [12]. The low value of fractal dimension indicates that granules obtained in the experiment were compact and relatively smooth in comparison with typical flocs. Our experimental data also point to a very important consequence of the fractal, self-similar nature of the aggregates, i.e., their density noticeable decrease with an increasing size.
A wet sieving technique can be used for activated sludge characteristic of both aero-bic [26] and anaerobic granulated activated sludge [19]. Presuming that the smallest floc is made of two microcolonies (125 µm) [25], we decided to use the smallest sieve with the holes of 250 µm diameter. Usually microbial flocs formed in a conventional wastewater biological treatment are loose aggregates with undefined shape and a size from 0.05 to 0.2 mm [10]. The average diameter of aerobic granules varies in the range from 0.2 to 5 mm and is mainly due to a balance between growth and abrasive detachment due to strong hydrodynamic shear force in aerobic reactors [15]. In our experiment wet sieving proved that granules with diameter in the range 2–4 mm were numerically most abundant while 60% (w/w) of granulated activated sludge mass posed particles with a diameter in the range of 4–8 mm. Similar results were obtained by Wang et al. [28]. In research conducted in SBR fed with glucose as a carbon source at organic loading rate of 4.8 kg COD·m-3·d-1 granules were dominant sludge forms with most of diameters about 6–9 mm. Authors explain that for a given organic loading rate and shearing force, the dynamic growth-decay equilibrium was maintained in the reactor. As a result, the granules existing in the reactor were matured ones with a larger size.
A. CYDZIK-KWIATKOWSKA, A. BIAŁOWIEC, I. WOJNOWSKA-BARYŁA, L. SMOCZYńSKI

49
Despite the high organic compounds load the efficiency of carbon removal in the presented technology was high (94.14 ± 2.7%) and most of the introduced COD was rap-idly removed during the first 2–3 hours of aeration. It can be assumed that the length of the cycle could have been shortened without decrease in carbon removal efficiency. The respirometric measurements indicated that the rate of substrate oxidation by investigated granulated activated sludge was relatively high. For example, in research conducted by [1] in a plant treating mainly domestic wastewater, oxygen uptake rate varied between 26.3–38.9 mg O2·g VSS-1·h-1 and was about two times lower in comparison with values obtained in the presented research. The observed high activity of microorganisms con-firms a very good potential of granulated activated sludge in organic pollutants removal. The mean growth yield of microorganisms of 0.41 ± 0.23 mg TSS·mg-1 COD was similar to values obtained by [26]. Authors reported that growth yield of microorganism in reac-tors differing in superficial air velocity changed from 0.48 to 0.33 MLSS·mg-1 COD for an air velocity of 0.5 to 4 dm3·min-1, respectively.
Literature data reveal that nearly 100% of aerobic and anaerobic granules are pro-duced in column-type air or liquid up flow reactors, since a high ratio of reactor height to diameter seems to favor the formation of granular sludge [15]. It improves selection of granules by the difference in settling velocity [5] and ensures a longer circular flow trajectory which provides a more effective hydraulic attrition to microbial aggregates. The high shearing force can induce microorganisms to secrete more exopolysaccharides, which mediate cohesion and adhesion of cells and play a crucial role in maintaining the structural integrity of aerobic granules [26]. In the presented experiment granulated activated sludge was obtained in a traditional, not a column-type, SBR with h/d ratio of 2.1. This fact confirms that SBRs presently used in wastewater treatment plants can be adapted to granulated activated sludge technology. It is, however, necessary to stress that the drawback of this solution is a larger supply of air to the reactor (8 dm3·min-1) in comparison with column reactors in which air supply at the level of 2.4–6 dm3·min-1 is employed [11, 25, 26].
The fact that granules maintained their structural integrity despite the long storage implies that the obtained granulated activated sludge can be used when substrate avail-ability changes with time, as it happens during biodiesel production. The fact that a 2-fold increase in glycerin fraction load resulted in disintegration of the granules can be ex-plained by results obtained by Moy et al. [18]. Authors proved that after reaching organic loading rate of 9 g COD·dm-3·d-1 (acetate addition) granules in the reactor disintegrated, and they concluded that for a given organic substrate granules formation can be success-ful only in a defined range of concentrations. It can be also assumed that collapsing of the granulation process after 2-fold increase in organic carbon load could have been caused by the fact that glycerin fraction has toxic influence on microorganisms caused by metha-nol and soaps presence.
CONCLUSIONS
It is possible to obtain aerobic granulated activated sludge feeding the traditional SBR reactor (h/d equal 2.1) with glycerin fraction from biodiesel production as a sole organic carbon source. The obtained granulated activated sludge was characterized by low SVI (40–50 cm3·g-1), 60% (w/w) of granulated activated sludge constituted spherical aggre-
CHARACTERISTIC OF GRANULATED ACTIVATED SLUDGE FED WITH ...

50
gates with diameter in the range of 4–8 mm. The effectiveness of COD removal averaged 94.14 ± 2.7% and most of the introduced COD was rapidly removed during the first 2–3 hours of aeration. On the basis of free settling test results it can be concluded that, for given technological parameters and reactor configuration in order to remove flocs from the granulated biomass, the time of settling should be adjusted so that only granules with settling velocity of 2 mm·s-1 or higher are separated.
LIST OF ABBREVIATIONS
COD – chemical oxygen demand [mg COD·dm-3],D – fractal dimension,d – reactor diameter [cm],g – the standard gravity [m·s-2],h – reactor height [cm],m – mass of granule [mg],N – number of analyzed granules,% N – share of each granule fractions in total number of analyzed granules [%],p – significance level,R – equivalent diameter of granule [mm],r2 – determination coefficient,Re – Reynolds number,SBR – sequencing batch reactor,SVI – sludge volume index [cm3·g-1],TSS – total suspended solids [mg·dm-3],V – settling velocity [mm·s-1],Vf – granule volume [cm3],VSS – volatile suspended solids [mg·dm-3],η – liquid viscosity [kg·m-1·s-1],ρe – effective, buoyant density of an aggregate in liquid [mg·cm-3],ρf – density of granule [g·cm-3],ρw – density of the liquid [g·cm-3].
REFERENCES
[1] Andreottola G., L. Baldassarre, C. Collivignarelli, R. Pedrazzani, P. Principi, C. Sorini, G. Ziglio: A comparison among different methods for evaluating the biomass activity in activated sludge systems: preliminary results, Water Sci. Tech., 46, 413–417 (2002).
[2] APHA: Standard methods for the examination of water and wastewater, 18th edition APHA, AWWA and WEF, Washington DC, USA 1992.
[3] Arrojo B., A. Mosquera-Corral, J.M. Garrido, R.R. Méndez: Aerobic granulation with industrial waste-water in sequencing batch reactors, Water Res., 38, 3389–3399 (2004).
[4] Bernat K., I. Wojnowska-Baryła: Influecne of VFA/TKN ratio in wastewater on the effectiveness of nitri-fication, Pol. J. Nat. Sci., 21, 741–753 (2006).
[5] Beun J.J., A. Hendriks, M.C.M. van Loosdrecht, E. Morgenroth, P.A. Wilderer, J.J. Heijnen: Aerobic granulation in a sequencing batch reactor, Water Res., 10, 2283–2290 (1999).
[6] Chu C.P., D.J. Lee: Multiscale structures of biological flocs, Chem. Eng. Sci., 59, 1875–1883 (2004).[7] Coehlo M.A.Z., C. Russo, O.Q.F. Araujo: Optimization of sequencing batch reactor for biological nitro-
gen removal, Water Res., 34, 2809–2817 (2000).[8] European Standard EN 14214:2003/AC:2007: Automotive fuels – Fatty acid methyl esters (FAME) for
A. CYDZIK-KWIATKOWSKA, A. BIAŁOWIEC, I. WOJNOWSKA-BARYŁA, L. SMOCZYńSKI

51
diesel engines – Requirements and test methods.[9] Hailei W., Y. Guangli, L. Guosheng, P. Feng: A new way to cultivate aerobic granules in the process of
papermaking wastewater treatment, Bioch. Eng. J., 28, 99–103 (2006).[10] Ivanov V., X.-H. Wang, S.T.-L. Tay, J.-H. Tay: Bioaugmentation and enhanced formation of microbiologi-
cal granules used in aerobic wastewater treatment, Appl. Microbiol. Biotechnol., 70, 374–381 (2006).[11] Jiang H.L., J.H. Tay, S.T.L. Tay: Aggregation of immobilized activated sludge cells into aerobically
grown microbial granules for the aerobic biodegradation of phenol, Lett. Appl. Microbiol., 35, 439–445 (2002).
[12] Lee D.J., G.W. Chen, Y.C Liao, C.C. Hsieh: On the free-settling test for estimating activated sludge floc density, Water Res., 30, 541–550 (1996).
[13] Li D.H., J.J. Ganczarczyk: Fractal geometry of particle aggregates generated in water and wastewater treatment processes, Environ. Sci. Tech., 23, 1385–1389 (1989).
[14] Li Z.H., T. Kuba, T. Ksuda: Aerobic granular sludge: a promising technology for decentralized wastewa-ter treatment, Water Sci. Tech., 53, 79–85 (2006).
[15] Liu Y., J.-H. Tay: State of the art of biogranulation technology for wastewater treatment, Biotechnol. Adv., 22, 533–563 (2004).
[16] Liu Y., Z.-W. Wang, L. Qin, Y.-Q. Liu, J.-H. Tay: Selection pressure-driven aerobic granulation in se-quencing batch reactor, Appl. Microbiol. Biotechnol., 67, 26–32 (2005).
[17] Meher L.C., D. Vidya Sagar , S.N. Naik : Technical aspects of biodiesel production by transesterification – a review, Renew. Sust. Energ. Rev. Renew. Sust. Energ. Rev., 10, 248–268 (2006).
[18] Moy B.Y.-P., J.-H. Tay, S.-K. Toh, Y. Liu, S.T.-L. Tay: High organic loading influences the physical char-acteristics of aerobic sludge granules, Lett. Appl. Microbiol., 34, 407–412 (2002).
[19] Pereboom J.H.F.: Size distribution model for methanogenic granules from full scale UASB and IC reac-tors, Water Sci. Tech., 30, 211–221 (1994).
[20] Qin L., Y. Liu, J.-H. Tay: Effect of settling time on aerobic granulation in sequencing batch reactor, Bioch. Eng. J., 21, 47–52 (2004).
[21] Reeuwijk van L.P.: Procedures for soil analysis, 6th edn., International Soil Reference and Information Centre, FAO, Wageningen 2002.
[22] Schwarzenbeck N., J.M. Borges, P.A. Wilderer: Treatment of diary effluents in an aerobic granular sludge sequencing batch reactor, Appl. Microbiol. Biotechnol., 66, 711–718 (2005).
[23] Smoczyński L., R. Wardzyńska: Study on macroscopic aggregation of silica suspensions and sewage, J. Colloid Interfac. Sci., 183, 309–314 (1996).
[24] Snidaro D., F. Zartarian, F. Jorand, J.-Y. Bottero, J.-C. Block, J. Manem: Characterization of activated sludge flocs structure, Water Sci. Tech., 36, 313–320 (1997).
[25] Tay J.-H., Q.S. Liu, Y. Liu: Microscopic observation of aerobic granulation in sequential aerobic sludge blanket reactor, J. Appl. Microbiol., 91, 168–175 (2001).
[26] Tay J-H., Q.-S. Liu, Y. Liu: The effects of shear force on the formation, structure and metabolism of aero-bic granules, Appl. Microbiol. Biotechnol., 57, 227–233 (2001).
[27] Toh S.K., J.H. Tay, B.Y.P. Moy, V. Ivanov, S.T.L. Tay: Size-effect on the physical characteristics of the aerobic granule in a SBR, Appl. Microbiol. Biotechnol., 60, 687–695 (2003).
[28] Wang Q., D. Guocheng, J. Chen: Aerobic granular sludge cultivated under the selective pressure as a driving force, Process Biochem., 39, 557–563 (2004).
[29] Wu R.M., D.J. Lee, T.D. Waite, J. Guan: Multilevel structure of sludge flocs, J. Colloid Interfac. Sci., 252, 383–392 (2002).
Received: April 4, 2008; accepted: March 5, 2009.
CHARAKTERYSTYKA OSADU CZYNNEGO GRANULOWANEGO HODOWANEGO NA FRAKCJI GLICERYNOWEJ Z PRODUKCJI BIODIESLA
Osad czynny granulowany hodowano z wykorzystaniem frakcji glicerynowej powstałej przy produkcji bio-diesla. Po 7 tygodniach hodowli w warunkach tlenowych w reaktorze SBR (h/d = 2,1) uzyskano granulowany osad czynny charakteryzujący się indeksem osadu na poziomie 40–50 cm3·g-1. W warunkach hodowli przy obciążeniu osadu czynnego ładunkiem zanieczyszczeń na poziomie 1,43 ± 0,1 g ChZT·g sm·d-1, efektywność usuwania związków węglowych wyniosła 94,14 ± 2,7%. Analiza sitowa wykazała, że około 60% masy osadu czynnego stanowiły granule o średnicy 4–8 mm. Równolegle na podstawie testu swobodnego opadania wyz-naczono ilościowy udział granul o różnych średnicach w osadzie czynnym granulowanym. Stwierdzono, że
CHARACTERISTIC OF GRANULATED ACTIVATED SLUDGE FED WITH ...

52
granule o średnicy 2–5 mm stanowiły najliczniejszą frakcję tj. około 32% wszystkich granul osadu czynnego. Prędkości opadania, masy oraz wartości liczby Reynoldsa dla granul znacząco wzrastały (p < 0.05) wraz ze wzrostem ich średnicy. Obserwowano, że wraz ze spadkiem średnicy granul następował wzrost ich średniej gęstości w cieczy.
A. CYDZIK-KWIATKOWSKA, A. BIAŁOWIEC, I. WOJNOWSKA-BARYŁA, L. SMOCZYńSKI

53
PL ISSN 0324-8461
© Copyright by Institute of Envionmental Engineering of the Polish Academy of Sciences, Zabrze, Poland 2009
ARCHIVES OF ENVIRONMENTAL PROTECTIONvol. 35 no. 2 pp. 53 - 66 2009
FORMATION OF THE ACTIVATED SLUDGE BIOCENOSIS DURING LANDFILL LEACHATE PRE-TREATMENT IN SBR
MIROSŁAW SZYŁAK-SZYDŁOWSKI*, ANNA GRABIńSKA-ŁONIEWSKA
Warsaw University of Technology, Faculty of Environmental Engineering, ul. Nowowiejska 20, 00-653 Warszawa, Poland*Corresponding author e-mail: [email protected]
Keywords: Landfill leachates, SBR, activated sludge, biocenosis, Zoogloea ramigera, filamentous bacteria, Opercularia sp.
Abstract: It has been proved that at the established SBR technological regime, 74–71% effectiveness of the removal of impurities expressed as COD (in the influent 955–1059 mg O2·dm-3, respectively) can be obtained at Bx 0.40–0.45 mg COD·mg-1·d-1. Ammonium nitrogen, in the concentration of up to 292 mg NH4-N·dm-3 was removed in 93% at Bx 0.40–0.96 mg COD·mg-1·d-1. The simultaneous denitrification described by 93% ef-fectiveness of total nitrogen removal occurred, too. Activated sludge had the attributes of an inengaged sludge in leachates pretreatment at Bx between 0.40–0.45 mg COD·mg-1·d-1. Its biocenosis consisted of zoogleal and filamentous bacteria, protozoa Mastigota nd., Difflugia nd., Aspidisca sp., Lionotus sp., Oxytricha sp., Opercu-laria sp., Tokophrya sp. and rotifera. At the critical values of Bx (0.96–1.64 mg COD·mg-1·d-1), when leachates pretreatment effectiveness sharply dropped, biocenosis of activated sludge consisted only of zoogleal and fila-mentous bacteria, hyphae fungi, Mastigota nd. and Opercularia sp.
INTRODUCTION
Landfilling is an important waste management technology aimed at protecting the bio-sphere from harmful influences. A total of 566 municipal landfill sites with organized lea-chate management are in operation in Poland [21]. Both a high content of toxic substances and the presence of numerous chemical and microbiological impurities make them a con-siderable threat to the environment as well as health and epidemiological hazard. Studies conducted at the Institute of Environmental Engineering Systems, Warsaw University of Technology, since 2003 showed that psychrophilic heterotrophic bacteria dominate quan-titatively in leachates while spore forming bacteria and potentially pathogenic species of microscopic fungi occur in smaller numbers. The total number of mesophilic bacteria and thermotolerant coli form bacteria, the bacteria Clostridium perfringens and Listeria monocytogenes, are indicators of sanitary contamination of leachates [5]. As demonstrated by the U.S. Environmental Protection Agency, faecal coliform bacteria and Streptococ-cus faecalis occur in leachates from municipal landfills [21]. Thus, reliable methods of preventing the air and the ground-water environment in the vicinity of landfills from chemical and microbiological impurities must be developed to protect the environment. To achieve this, the degree of chemical and microbiological leachate contamination must be assessed and the efficiency of contaminant removal at individual unit treatment proc-

54
ess must be evaluated. Treatment methods of the landfill leachates may be divided into physicochemical and biological or a combination of both. Main physicochemical methods used in landfill leachate treatment include adsorption on active carbon, coagulation/floc-culation, membrane processes and advanced oxidation (O3, O3/H2O2, Fenton’s reaction, O3/UV, O3/H2O2/UV, UV/TiO2). The molecular weight of complex organic compounds decreases in these processes, which enhances their susceptibility to biodegradation; how-ever, full mineralization of organic substances occurring in leachates is not obtained. A greater efficiency is achieved with combined biological and physicochemical meth-ods such as nitrification/denitrification/O3/UV, nitrification/denitrification/precipitation/O3, precipitation/membrane reactor/reversed osmosis, biological pre-treatment/TiO2/UV/biological oxidation, activated sludge/electron-beam radiation [3, 18, 20, 21, 24].
The efficiency of biological methods is dependent mostly on the chemical composi-tion of leachates, including the content of organic compounds and their susceptibility to degradation defined by the COD/BOD5 ratio, the content of nitrogen, phosphorus and heavy metals. This is in turn influenced by the landfill age. Therefore, biological methods are mostly suitable for treatment of leachates from young landfills in which organic com-pounds occur as easily biodegradable compounds. As conventional technologies of the activated sludge and biological filters do not guarantee a full elimination of chemical and biological contaminants even in the case of leachates from young landfills, much atten-tion has lately been paid to the use of the activated sludge method in SBRs. This technol-ogy is based on a long-term supply of leachate to reactor under alternating aerobic and anoxic conditions in the fill phase. It provides a high efficiency of the removal of carbon, nitrogen and phosphorus compounds while sludge bulking is eliminated. The advantages of this method are the small size of SBRs which can be then located near landfills and the possibility of the installation of a cover protecting the soil and the air from contamination by pathogenic microorganisms occurring in leachates. Studies on the practical application of this technology to treat leachates were conducted by, for instance, Dimadopoulus et al. [4], Surmacz-Górska et al. [19], Loukidou and Zouboulis [13], Klimiuk and Koc-Jurczyk [7], Klimiuk and Kuligowska [8, 9], Neczaj et al. [15], Kuligowska et al. [11, 12], and Zhou et al. [27].
The aim of this study was to determine the influence of an SBR load of chemical contaminants defined by COD on the formation of the activated sludge biocenosis. The results will be used to assess the SBR technology for the sustainable development of the activated sludge biocenosis that guarantees a high efficiency of the removal of leachate contaminants.
SCOPE OF THE STUDY
The technological parameters optimized in preliminary studies conducted within M. Szyłak-Szydłowski’s PhD project [22] were used in leachate pre-treatment. The follow-ing were determined during the process control:− sludge concentration (d.m.) in the reactor during the mixing and aeration phases,− sludge volume index,− in the leachates entering to and flowing out from the reactor: pH, CODCr, ammonia
nitrogen (NH4-N), nitrite nitrogen (NO2-N), nitrate nitrogen (NO3-N), total Kjeldahl nitrogen and total phosphate phosphorus,
− number of microorganism groups constituting the biocenosis of the activated sludge.
MIROSŁAW SZYŁAK-SZYDŁOWSKI, ANNA GRABIńSKA-ŁONIEWSKA

55
MATERIALS AND METHODS
SamplingLeachates delivered to the collection well located near the landfill site designed for waste other than inert and hazardous waste, so-called municipal waste, in the south-eastern part of the town of Otwock via a drainage system were examined. The site has been in use since 1998, and its operation will be discontinued in 2012. Municipal wastes containing a high amount of biodegradable organic matter exceeding 20 Mg·d-1 are deposited in the site. The estimated site capacity is 12·105 Mg; only 2.7·105 Mg has been used so far. The landfill is lined with a 2 mm PEHD geomembrane. Wastes are stored in districts on plots, whose thickness is 1.5–2 m, and the lining thickness is 0.15 m. Leachate waters and land-fill gas quantities in the landfill as well as surface and underground waters near the landfill are monitored. The leachates were characterized by COD 3080 mg O2·dm-3, total organic carbon 1.254 mg C·dm-3, BOD5/COD – 0.181, SO4
2- – 160 mg SO42-·dm-3, SO4
2-·Cl- – 0.074, 0.163 mg Cu·dm-3, 2.065 mg Zn·dm-3, 0.207 mg Pb·dm-3, 0.017 mg Cd·dm-3, 0.216 mg Cr·dm-3, 0.003 mg Hg·dm-3, electrolytic conductivity 19.5 mS·cm-1 and pH 7.5 [5].
Leachate pre-treatment was conducted in an SBR with the working volume 6.9 dm3, equipped with a mixer and the fine bubble aeration system that supplies oxygen concen-tration of 2 mg O2·dm-3. The activated sludge from the municipal waste treatment plant in Piaseczno near Warsaw was used as the seed of the reactor. The sludge concentration in the reactor remained in the range of 3–4 g·dm-3, and the sludge age (θx) at 12.5 d. The hydraulic retention time (HRT) was 16 hours, and the sludge load (Bx) ranged from 0.40 to 1.64 mg COD·mg-1·d-1, obtained by an increase in the percentage participation of leachates (5, 10, 15, 20 and 30%) in the mixture with synthetic wastewaters prepared according to the recipe given by Klimiuk and Wojnowska-Baryła [10].
The system worked in three 8-hour cycles per day. Each cycle consisted of a 45-minute fill phase, 30-minute mixing phase, 2.10 hour aeration phase, 45 minute mix-ing phase, 1.50 hour aeration phase, 1.30 hour settling phase and 30 minute decanting phase (including 25 minutes of decanting and 5 minute idling).
These parameters were “optimized” in so-called monitoring examinations (first stage of experiments), where the efficiency of impurities removal from the mixture of leachates and sewage at different duration time of each cycle phases was determined. These experiments are wider described in Szyłak-Szydłowski doctoral thesis.
Control examinations of the process in the ranges given above were conducted after two-weeks when Bx changed.
Chemical determinationsChemical oxygen demand (COD) was determined with the dichromate method as given in the standard PN-74/C-04578.03. Mineral nitrogen forms were determined with spec-trophotometric methods, ammonia nitrogen (NH4-N) (direct nesslerisation) as given in PN-C-04576-4:1994, nitrite nitrogen (NO2-N) as given in PN-EN 26777:1999, and ni-trate nitrogen (NO3-N) as given in PN-82/C-04576.08. Total Kjeldahl nitrogen was de-termined with the titration method as given in PN-73/C-04576.12. Phosphate phosphorus was determined with the spectrophotometric method (molybdenum method) as given in PN-91/C-04537/09. The sludge dry mass was determined with the weight method as given in PN-EN827.
FORMATION OF THE ACTIVATED SLUDGE BIOCENOSIS DURING LANDFILL ...

56
Biological determinationsMicroscopic observations of the activated sludge biocenosis were conducted with an Op-ton contrast-phase microscope. The determinations are given as the frequency of indi-vidual group of microorganism per cm3 of the sludge.
RESULTS AND DISCUSSION
Examinations were conducted in two stages. The first stage, recognized as preliminary, so-called monitoring, was purposed of determination of duration time and arrangement of particular cycle phases in SBR, providing effectiveness of contaminations removal, with set sludge load value, expressed by COD (see materials and methods). The second stage, whose results are presented below, constituted so-called proper examinations, heading for defining influence of sludge load (Bx) on effectiveness of impurities removal, with arrangement and duration of particular stages of cycle in SBR, set in the first stage of examinations.
The studies showed that COD equal 955 mg O2·dm-3 on average in the influent was removed in 74%, and ammonia nitrogen characterized by the initial concentration 61 mg NH4-N·dm-3 in 99% at Bx 0.40 mg COD·mg-1·d-1 obtained at the 5% leachate content in the mixture containing synthetic wastewaters. Rapid nitrification with the production of nitrates also occurred as the concentration of these compounds in the effluent wastewaters increased to 26.7 mg NO3-N·dm-3. A significant reduction in the total nitrogen concentra-tion from 106 to 33 mg Ntot·dm-3 indicated the occurrence of simultaneous denitrification. A low efficiency of phosphorus removal (only 26%, at the initial P-PO4 concentration of 14.3 mg P-PO4·dm-3) observed at this sludge load should be noticed (Tab. 1).
A Bx increase to 0.45 mg COD·mg-1·d-1 obtained by a 10% addition of leachates to synthetic wastewaters resulted in a COD increase in the influent to 1059 mg O2·dm-3, am-monia nitrogen to 104 mg NH4-N·dm-3 and nitrite nitrogen to 0.590 mg NO2-N·dm-3. Con-sequently, total nitrogen in the influent reached 145 mg Ntot·dm-3. Concentrations of the other contaminants in wastewaters did not change significantly. Under these conditions, the removal efficiency of contamination defined by COD and ammonia nitrogen was still high (71 and 97%, respectively), and nitrification (NO3-N was 15.8 mg NO3-N·dm-3 in the effluent) and simultaneous denitrification (a decrease in total nitrogen concentration from 145 to 23 mg Ntot·dm-3) also occurred. The efficiency of phosphorus removal fell down was 27%.
A significant decrease in the removal efficiency of contamination defined by COD to only 45% was observed when Bx increased to 0.69 mg COD·mg-1·d-1 at the 15% addition of leachates to the mixture containing synthetic wastewaters. Influent COD was 1613 mg O2·dm-3, and the concentrations of individual nitrogen forms were: 202 mg NH4-N·dm-3, 0.270 mg NO2-N·dm-3 and 0.20 mg NO3-N·dm-3. The efficiency of ammonia nitrogen removal was still high (95%) due to nitrification. Simultaneous denitrification of nitrates also occurred as indicated by the 82% removal of total nitrogen; a drop in the phosphorus content was slight (16%) (Tab. 1).
An increase in Bx to 0.96 mg COD·mg-1·d-1 following an increase in the percentage participation of leachates (20%) in the mixture containing synthetic wastewaters resulted in an increase in the influent COD to 2069 mg O2·dm-3 and nitrogen forms to 292 mg NH4-N·dm-3, 1.07 mg NO3-N·dm-3. Nitrite nitrogen concentration was 0.100 mg NO2-N·dm-3.
MIROSŁAW SZYŁAK-SZYDŁOWSKI, ANNA GRABIńSKA-ŁONIEWSKA

57
Tabl
e 1.
Effe
ctiv
enes
s of t
he la
ndfil
l lea
chat
es p
retre
atm
ent i
n SB
R d
epen
ding
on
impu
ritie
s slu
dge
load
ing
(mea
n va
lues
)
Parti
cipa
tion
of le
acha
tes
in th
e m
ixtu
re
with
synt
hetic
w
aste
wat
ers [
%]
Slud
ge lo
adin
g,
[mg
CO
D·m
g-1·d
-1]
Sam
ple
Para
met
er
CO
D[m
g O
2·dm
-3]
N-N
H4
[mg·
dm-3]
N-N
O2
[mg·
dm-3]
N-N
O3
[mg·
dm-3]
Nor
g[m
g·dm
-3]
NK
jeld
ahl
[mg·
dm-3]
Nto
t[m
g·dm
-3]
P-PO
4[m
g·dm
-3]
50.
40in
fluen
t95
561
0.03
00.
6944
106
106
14.3
efflu
ent
249
0.69
0.03
026
.78
9.2
3310
.7%
rem
oval
7499
––
8191
6925
100.
45in
fluen
t10
5910
40.
590
0.57
4114
514
513
.3ef
fluen
t30
53.
500.
290
15.8
48
239.
7%
rem
oval
7197
––
9094
8427
150.
69in
fluen
t16
1320
20.
270
0.20
3622
422
311
.3ef
fluen
t87
110
.71.
400
15.9
1121
399.
4%
rem
oval
4695
––
6991
8216
200.
96in
fluen
t20
6929
20.
100
1.07
4333
533
617
.8ef
fluen
t12
469.
600.
050
7.80
515
2314
.5%
rem
oval
4097
––
8896
9318
301.
64in
fluen
t34
0635
11.
040
4.67
3838
939
520
.3ef
fluen
t28
7952
.10.
070
1.90
1568
7014
.8%
rem
oval
1585
––
6082
8226
FORMATION OF THE ACTIVATED SLUDGE BIOCENOSIS DURING LANDFILL ...

58
The removal efficiency of contamination expressed in COD was low (40%) at the high efficiency of ammonia nitrogen removal (97%). A significantly smaller increase in the amount of nitrates (to 7.80 mg NO3-N·dm-3) indicated an occurrence of nitrification and denitrification processes, proceeded with high intensity. A high decrease of total nitrogen (93%) indicated an intensive process of simultaneous denitrification. Phosphorus removal was still not very efficient (17%).
A sudden drop in the efficiency of pre-treatment of leachates constituting 30% in the mixture with synthetic wastewaters (influent COD 3406 mg O2·dm-3, 351 mg NH4-N·dm-3, 1.040 mg NO2-N·dm-3 and 4.67 mg NO3-N·dm-3) occurred at Bx of 1.64 mg COD·mg-1·d-1. Under these conditions, the efficiency of COD removal was 15% and the process of nitrification was inhibited, as indicated by high concentration of NH4-N in the effluent. However, an 85% removal of ammonia nitrogen took place and the process of simultane-ous denitrification occurred (total nitrogen elimination in 82%). A significant phosphorus removal from the wastewaters delivered to the reactor no longer occurred (26%).
In conclusion, the technological examinations showed that leachate pre-treatment may be conducted with a highly efficient removal of carbon compounds expressed as COD only at Bx of 0.40 to 0.45 mg COD·mg-1·d-1 obtained by adding 5–10% leachates to synthetic wastewaters imitating municipal wastewaters. For this range of Bx, the influent COD was between 955 and 1059 mg O2·dm-3, and the elimination of the contamination described by it was 74–71%, respectively. Thus it significantly exceeded the efficiency obtained by Kuligowska et al. [11] equal 87.7; 79.3 and 70.9% for the influent COD equal 570, 580 and 612 mg O2·dm-3, respectively. A similar removal efficiency of contamina-tion expressed as COD (85.5–79.3%, at the concentration in the influent equal 1090 mg O2·dm-3) was also obtained by Diamadopoulos et al. [4] in the process conducted for the aeration phase of 20–14 hours, respectively, and also by Kuligowska et al. [12] (83–77% – concentration in the influent 1380 mg O2·dm-3) at the sludge age 33–11 d, HRT 12–2 hours and an 18 hour aeration phase, respectively. According to Zhou et al. [27], the high sludge age (25 d) and the long aeration phase in the cycle (18 hours) encourage a high efficiency of the treatment process. Under these conditions, these authors obtained a 94% elimination of COD with the concentration of 5077 mg O2·dm-3 and a 99% elimination of ammonia nitrogen with the concentration of 728 mg NH4-N·dm-3.
In the present examinations, a significant degree of ammonia nitrogen removal from the wastewaters was observed up to 20% leachate content in the mixture with synthetic wastewaters (mean concentration in the influent 292 mg NH4-N·dm-3, mean removal ef-ficiency 97%). Therefore, a greater removal efficiency of this form of mineral nitrogen was obtained than in the wastewater treatment process conducted by Diamadopoulos et al. [4] and Kuligowska et al. [11]. The former obtained a 49–35% efficiency of NH4-N removal (concentration in the influent 107 mg NH4-N·dm-3) for the aeration stage 20–14 hours, respectively, and the latter a 99.8–99.9% elimination of NH4-N whose concentra-tion equaled 60–130 mg NH4-N·dm-3.
The present studies show that the process of simultaneous denitrification indicated by a simultaneous considerable drop in the concentration of total nitrogen in the effluent (mean 93%) also occurred in the SBR up to 292 mg N-NH4·dm-3 in the delivered waste-waters. The nitrification process of phase I and II occurred with significant intensity in the aeration phase up to Bx = 0.69 mg COD·mg-1·d-1, at which the influent COD was 1613 mg O2·dm-3. This is consistent with previous studies by Surmacz-Górska et al. [20], who
MIROSŁAW SZYŁAK-SZYDŁOWSKI, ANNA GRABIńSKA-ŁONIEWSKA
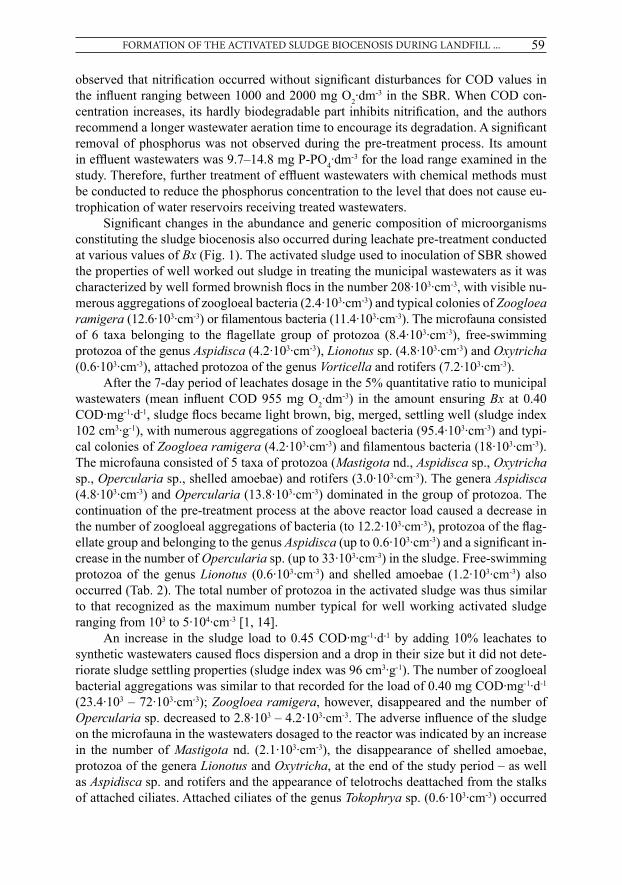
59
observed that nitrification occurred without significant disturbances for COD values in the influent ranging between 1000 and 2000 mg O2·dm-3 in the SBR. When COD con-centration increases, its hardly biodegradable part inhibits nitrification, and the authors recommend a longer wastewater aeration time to encourage its degradation. A significant removal of phosphorus was not observed during the pre-treatment process. Its amount in effluent wastewaters was 9.7–14.8 mg P-PO4·dm-3 for the load range examined in the study. Therefore, further treatment of effluent wastewaters with chemical methods must be conducted to reduce the phosphorus concentration to the level that does not cause eu-trophication of water reservoirs receiving treated wastewaters.
Significant changes in the abundance and generic composition of microorganisms constituting the sludge biocenosis also occurred during leachate pre-treatment conducted at various values of Bx (Fig. 1). The activated sludge used to inoculation of SBR showed the properties of well worked out sludge in treating the municipal wastewaters as it was characterized by well formed brownish flocs in the number 208·103·cm-3, with visible nu-merous aggregations of zoogloeal bacteria (2.4·103·cm-3) and typical colonies of Zoogloea ramigera (12.6·103·cm-3) or filamentous bacteria (11.4·103·cm-3). The microfauna consisted of 6 taxa belonging to the flagellate group of protozoa (8.4·103·cm-3), free-swimming protozoa of the genus Aspidisca (4.2·103·cm-3), Lionotus sp. (4.8·103·cm-3) and Oxytricha (0.6·103·cm-3), attached protozoa of the genus Vorticella and rotifers (7.2·103·cm-3).
After the 7-day period of leachates dosage in the 5% quantitative ratio to municipal wastewaters (mean influent COD 955 mg O2·dm-3) in the amount ensuring Bx at 0.40 COD·mg-1·d-1, sludge flocs became light brown, big, merged, settling well (sludge index 102 cm3·g-1), with numerous aggregations of zoogloeal bacteria (95.4·103·cm-3) and typi-cal colonies of Zoogloea ramigera (4.2·103·cm-3) and filamentous bacteria (18·103·cm-3). The microfauna consisted of 5 taxa of protozoa (Mastigota nd., Aspidisca sp., Oxytricha sp., Opercularia sp., shelled amoebae) and rotifers (3.0·103·cm-3). The genera Aspidisca (4.8·103·cm-3) and Opercularia (13.8·103·cm-3) dominated in the group of protozoa. The continuation of the pre-treatment process at the above reactor load caused a decrease in the number of zoogloeal aggregations of bacteria (to 12.2·103·cm-3), protozoa of the flag-ellate group and belonging to the genus Aspidisca (up to 0.6·103·cm-3) and a significant in-crease in the number of Opercularia sp. (up to 33·103·cm-3) in the sludge. Free-swimming protozoa of the genus Lionotus (0.6·103·cm-3) and shelled amoebae (1.2·103·cm-3) also occurred (Tab. 2). The total number of protozoa in the activated sludge was thus similar to that recognized as the maximum number typical for well working activated sludge ranging from 103 to 5·104·cm-3 [1, 14].
An increase in the sludge load to 0.45 COD·mg-1·d-1 by adding 10% leachates to synthetic wastewaters caused flocs dispersion and a drop in their size but it did not dete-riorate sludge settling properties (sludge index was 96 cm3·g-1). The number of zoogloeal bacterial aggregations was similar to that recorded for the load of 0.40 mg COD·mg-1·d-1 (23.4·103 – 72·103·cm-3); Zoogloea ramigera, however, disappeared and the number of Opercularia sp. decreased to 2.8·103 – 4.2·103·cm-3. The adverse influence of the sludge on the microfauna in the wastewaters dosaged to the reactor was indicated by an increase in the number of Mastigota nd. (2.1·103·cm-3), the disappearance of shelled amoebae, protozoa of the genera Lionotus and Oxytricha, at the end of the study period – as well as Aspidisca sp. and rotifers and the appearance of telotrochs deattached from the stalks of attached ciliates. Attached ciliates of the genus Tokophrya sp. (0.6·103·cm-3) occurred
FORMATION OF THE ACTIVATED SLUDGE BIOCENOSIS DURING LANDFILL ...

60
Fig.
1. R
esul
ts o
f bio
logi
cal e
xam
inat
ions
of a
ctiv
ated
slud
ge in
Seq
uenc
ing
Bat
ch R
eact
or a
t slu
dge
load
ing
valu
es o
f Bx
= 0.
40–1
.64
mg
ChZ
T·m
g-1·d
-1
Bx
= 0.
40 m
g C
hZT·
mg-1
·d-1
Bx
= 0.
45 m
g C
hZT·
mg-1
·d-1
Bx
= 0.
96 m
g C
hZT·
mg-1
·d-1
Bx
= 1.
64 m
g C
hZT·
mg-1
·d-1
MIROSŁAW SZYŁAK-SZYDŁOWSKI, ANNA GRABIńSKA-ŁONIEWSKA

61
Tabl
e 2.
Res
ults
of b
iolo
gica
l exa
min
atio
ns o
f act
ivat
ed sl
udge
in S
eque
ncin
g B
atch
Rea
ctor
Parti
cipa
tion
of le
acha
tes i
n th
e m
ixtu
re w
ith
synt
hetic
was
tew
ater
s [%
]5
1020
30
Slud
ge lo
adin
g [m
g C
OD
·mg-1
·d-1]
0.40
0.45
0.96
1.64
Slud
ge in
dex
[cm
3 ·g-1]
102
9680
72D
ate
of e
xam
inat
ion
12.0
5.05
24.0
5.05
20.0
6.05
12.0
7.05
29.0
9.05
25.1
1.05
Gen
eral
cha
ract
eris
tic o
f the
slud
ge
large, mergred flocs (not countable), light brown, well settling, lack of free-swimming bacteria
well formed, dark beige flocs, very large, which make their counting impossible, lack of free-swimming bacteria
brown, tiny, lightly detached flocs, well formed and settling, lack of free-swimming bacteria
lots of tiny, detached flocs, so counting is impossible, only clean colonies of zoogloeal bacteria were counted, lack of free-swimming bacteria
brown, fairly merged, beset flocs, lack of free-swimming bacteria
brown, rather merged, beset flocs, lack of free-swimming bacteria, hyphae fungi are present (3·103·cm-3)
Quantity of microorganisms in 1 cm3 of sludge
(– not recorded)
slud
ge fl
ocs
––
––
93·1
0385
.2·1
03
aggr
egat
ions
of z
oogl
oeal
bac
teria
95.4
·103
12.2
·103
23.4
·103
72·1
033·
103
1.2·
103
Zoog
loea
ram
iger
a (I
tzig
sohn
, 186
8)4.
2·10
3–
––
––
filam
ento
us b
acte
ria18
·103
16.8
·103
32.4
·103
14·1
0352
.2·1
0343
.8·1
03
Mas
tigot
a nd
.1.
8·10
30.
6·10
3–
2.1·
103
–3.
6·10
3
Aspi
disc
a sp
.4.
8·10
30.
6·10
30.
6·10
3–
––
Gla
ucom
a sp
.–
––
–1.
2·10
3–
Lion
otus
sp.
–0.
6·10
3–
––
–O
xytr
icha
sp.
0.6·
103
––
––
–O
perc
ular
ia sp
.13
.8·1
0333
·103
4.2·
103
2.8·
103
22.2
·103
3.5·
103
Toko
phry
a sp
.–
–0.
6·10
3–
––
shel
led
amoe
bae
(Diffl
ugia
nd.
)–
1.2·
103
––
––
telo
troch
––
–1.
4·10
3–
–Ro
tato
ria
nd.
3.0·
103
1.8·
103
1.8·
103
–0.
6·10
3 (de
ad)
–
FORMATION OF THE ACTIVATED SLUDGE BIOCENOSIS DURING LANDFILL ...

62
periodically in the sludge. Four taxa of microorganisms constituted the microfauna at the above sludge load.
A sudden deterioration of the quality of the activated sludge caused an increase in its load to 0.96 mg COD·mg-1·d-1 by dosage 20% leachates in the mixture with synthetic wastewaters. Further flocs fragmentation and encystation, accompanied by a drastic de-crease in the number of bacteria forming zoogloeal aggregations (down to 3·103·cm-3) in them, a reduction in the number of the microfauna to two taxa (Glaucoma sp. – 1.2·103·cm-3 and Opercularia sp. – 22.2·103·cm-3) and the death of rotifers, occurred. At the same time, the number of filamentous bacteria increased significantly in the sludge (to 52.2·103·cm-3), which may indicate a high resistance of these bacteria to toxic compounds occurring in leachates.
The sludge load of 1.64 mg COD·mg-1·d-1 at the 30% addition of leachates to synthetic wastewaters enhanced the phenomena described above. The number of aggregations of zoogloeal bacteria fell down to 1.2·103·cm-3, while that of filamentous bacteria was still very high (43.8·103·cm-3). Moulds (3000·cm-3) occurred in the sludge. These organisms did not influence adversely sludge settling properties and the volume index was still low and equaled 72 cm3·g-1. Flagellates (3.6·103·cm-3) and Opercularia sp. (3.5·103·cm-3) were the only animal organisms in the sludge.
In conclusion, the studies showed that the activated sludge in the SBR had proper-ties of a well working sludge when 5–10% of leachates were dosaged in the mixture with synthetic wastewaters at which the influent COD was 955–1059 mg O2·dm-3, 61–104 mg N-NH4·dm-3, 0.030–0.590 mg NO2-N·dm-3, 0.57–0,69 mg NO3-N·dm-3 and 13.3–14.3 mg P-PO4·dm-3, and Bx 0.40–0.45 mg COD·mg-1·d-1. Besides zoogloeal and filamentous bacteria forming the flocs body, the microfauna of the sludge was composed of 5 and 4 taxa, respectively. Similar abundance of taxa in the activated sludge was recorded by Kuligowska et al. [11] during the treatment of wastewaters characterized by COD of 612 mg O2·dm-3. Flagellates and attached protozoa of the genera Opercularia and Vorticella were the most important representatives of the microfauna. Filamentous bacteria were not recorded. These authors showed an even greater diversity of the microfauna (15–22 taxa) in the activated sludge adapted for the treatment of wastewaters characterized by COD raging from 570 to 580 mg O2·dm-3. Shelled amoebae of the genus Centropyxis sp., attached ciliates Acineta uncinata, Epistilis plicatilis, Opercularia coarctata and free-swimming ciliates Aspidisca cicada dominated in the microfauna then.
An increase in the leachate participation in the wastewaters dosaged to the reac-tor to 20 and 30% and by this Bx values to 0.96 and 1.64 mg COD·mg-1·d-1 caused a considerable decrease in the abundance of zoogloeal bacteria in the sludge, a sudden disappearance of the majority of protozoa and rotifers. At the same time, this encouraged the growth of filamentous bacteria. Apart from zoogloeal bacteria and attached protozoa of the genus Opecularia, this group of bacteria may be considered to be a characteristic component of the activated sludge biocenosis adapted for the pre-treatment of the study leachates (Fig. 2).
The disappearance of the microfauna in the activated sludge at Bx of 0.96 to 1.64 mg COD·mg-1·d-1 should be attributed to the presence of carbon compounds that are dif-ficult to biodegrade or toxic in the study leachates. This is indicated by the high COD value in the treated wastewaters of 1246 and 2879 mg O2·dm-3, respectively. The influ-ence of the concentrations of mineral nitrogen forms was smaller as they did not exceed
MIROSŁAW SZYŁAK-SZYDŁOWSKI, ANNA GRABIńSKA-ŁONIEWSKA

63
the values characteristic of toxic activity or inhibiting microfauna growth in the activated sludge (Tab. 3). The content of heavy metals in the pre-treated wastewaters did not inhibit the growth of protozoa and rotifers in the sludge, too. According to Abraham et al. [1], protozoa belonging to Aspidisca cicada, Chilodonella uncinata, Vorticella convallaria and Vorticella microstoma species tolerate concentrations of Fe > 2 mg·dm-3, Zn > 0.5 mg·dm-3, Cu > 0.06 mg·dm-3 and Cr = 0.10 mg·dm-3, that is significantly exceeding the concentrations of these metals in the pre-treated wastewaters.
The present studies are sufficient to suggest that the efficiency of leachate pre-treat-ment may be enhanced by increasing the number of microorganisms adapted to degrading the contaminations occurring in them. These are zoogloeal and filamentous bacteria as well as protozoa of the genus Opercularia in the case of the study leachates. The stud-ies by żubrowska-Sudoł [28] and Podedworna and żubrowska-Sudoł [16] showed that moving-bed sequencing batch biofilm type reactors (MBSBBR) in which the growth of microorganisms occurs as activated sludge and biofilm on the surface of movable plastic carriers with a large specific surface create conditions conducive to an intensive multi-plication of microorganisms. This technology allows a large load of contaminations to be taken in without changing the reactor volume, guarantees nitrification regardless of the wastewater retention time and activated sludge age, as well as makes the process of integrated denitrification and biological phosphorus removal possible under conditions of
Fig. 2. The main groups of activated sludge biocenosis taking part in landfill leachates pretreatment in SBR
FORMATION OF THE ACTIVATED SLUDGE BIOCENOSIS DURING LANDFILL ...

64
Table 3. Comparison of the concentrations of different forms of mineral nitrogen in pretreated wastes at the critical sludge load values with toxic concentrations for activated sludge microfauna
Concentration of different forms of mineral nitrogen at
the critical sludge load values (Bx) Inhibition or toxic treatment (activity) on
activated sludge microfauna Author, year
Bx
[mg·dm-3]
N-N
H4
N-N
O2
N-N
O3
0.96
mg
C
OD
·mg-1
·d-1
influent Rotatoria – Brachionus plicatilis. Inhibition of glucosidase activity, at 2.4 ppm deionized ammonium
Araujo et al.(2000) [2]
292 0.100 1.07
effluent Protozoa – Euplotes vannus LC50 after 2 hours 7870 mg N-NH4·dm-3, threshold concentration inhibiting growth 100 mg N-NH4·dm-3
Xu Henglong et al.(2004) [25]
9.60 0.050 7.80
1.64
mg
CO
D·m
g-1·d
-1
influent Protozoa – Paramecium bursaria LC50 after 2 hours 95.94 mg N-NH4·dm-3
27.3 mg N-NO2·dm-3
Xu Henglong et al.(2005) [26]
351 1.040 4.67
effluent Inhibition of protozoa and rotifers growth at ammonium nitrogen concentration above 30 mg·dm-3
Puigagut et al.(2005) [17]
52.1 0.070 1.90
a decreased load of organic compounds. The biomass development on carriers also limits the need for sludge recirculation and settling in secondary settling tanks, and thus it also eliminates sludge bulking. It is of great importance in the case of the study leachates as filamentous bacteria, dominated in the activated sludge biocenosis adapted for their pre-treatment, as well as moulds at Bx = 1.64 mg COD·mg-1·d-1, also. Earlier on, conventional reactors with an immobilized biomass were used for wastewater treatment by Imai et al. [6] and Welander et al. [23], and SBR systems with microorganism carriers by Loukidou and Zouboulis [13].
The study was conducted within Mirosław Szyłak-Szydłowski’s doctoral project financed by supervision grant no 2 P04G 008 28.
REFERENCES
[1] Abraham J.V., R.D. Butler, D.C. Sigee: Seasonal Changes in Whole-Cell Metal Levels in Protozoa of Activated Sludge, Water Res., 31, 1103–111 (1997).
[2] Araujo A.B., T.W. Snell, A. Hagiwara: Effect of unionized ammonia, viscosity and protozoan contami-nation on the enzyme activity of the rotifer Brachionus plicatilis, Aquaculture Research, 31, 359–365 (2000).
[3] Bae B-U., E-S. Jung, Y-R. Kim, H-S. Shin: Treatment of landfill leachate using activated sludge process and electron-beam radiation, Water Res., 11, 2669–2673 (1999).
[4] Diamadopoulos E., P. Samaras, X. Dabou, G.P. Sakellaropoulos: Combined treatment of leachate and sewage in a Sequencing Batch Reactor, Wat. Sci. Tech., 36, 61–68 (1997).
[5] Grabińska-Łoniewska A., A. Kulig, E. Pajor, A. Skalmowski, W. Rzemek, Szyłak-Szydłowski M.: Phys-ico-chemical and microbiological characteristics of leachates from Polish municipal landfills, [in:] En-
MIROSŁAW SZYŁAK-SZYDŁOWSKI, ANNA GRABIńSKA-ŁONIEWSKA

65
vironmental Engineering, L. Pawłowski, M.R. Dudzińska, A. Pawłowski (eds), Taylor & Francis Group, London 2007, pp. 327–337.
[6] Imai A., N. Iwami, K. Matsushige, Y. Inamori, R. Sudo: Removal of refractory organics and nitrogen from landfill leachate by the microorganism-attached activated carbon fluidized bed process, Water Res., 27, 143–145 (1993).
[7] Klimiuk E., J. Koc-Jurczyk: Efektywność usuwania związków organicznych i azotu z odcieków pochodzących z ustabilizowanych składowisk odpadów komunalnych w reaktorach SBR, [in:] Materiały Konferencji Naukowo-Technicznej nt. Badania, projektowanie i eksploatacja reaktorów o działaniu sekwencyjnym, Instytut Zaopatrzenia w Wodę i Budownictwa Wodnego, Politechnika Warszawska, 17.06.2004, pp. 113–126.
[8] Klimiuk E., D. Kuligowska: Wpływ sposobu dozowania odcieków do reaktorów SBR na efektywność usuwania związków organicznych i przyrost osadu czynnego, [in:] Materiały Konferencji Naukowo-Technicznej nt. Badania, projektowanie i eksploatacja reaktorów o działaniu sekwencyjnym, Instytut Zaopatrzenia w Wodę i Budownictwa Wodnego, Politechnika Warszawska, 17.06.2004, pp. 105–112.
[9] Klimiuk E., D. Kuligowska: Organics removal from landfill leachate and activated sludge production in SBR reactors, Waste Management, 26, 1140–1147 (2006).
[10] Klimiuk E., I. Wojnowska-Baryła: The influence of hydraulic retention time on the effectiveness of phos-phate compound removal in the Phoredox System, Zeszyty Naukowe Akademii Rolniczo-Technicznej w Olsztynie, 21, 21–40 (1996).
[11] Kuligowska D., E. Klimiuk, A. Drzewicki: The leachate influence on nutrients and organics removal ef-ficiency, structure and composition of the microfauna in activated sludge treating municipal wastewater, Archives of Environmental Protection, 31, 43–60 (2005).
[12] Kuligowska D., E. Klimiuk, A. Drzewicki: BOD5 and COD removal and sludge production in SBR work-ing with or without anoxic phase, Bioresource Technology, 1–7 (2006).
[13] Loukidou M.X., A.I. Zouboulis: Comparison of two biological treatment processes using attached-growth biomass for sanitary landfill leachate treatment, Environ. Pollution, 273–281 (2001).
[14] Madoni P.: Role of protozoans and their indicator value in the activated sludge process, [in:] Biological Approach to Sewage Treatment Process: Current Status and Perspectives, Centro Bazzucchi, Perugia, Italy, pp. 21–27.
[15] Neczaj E., E. Okoniewska, M. Kacprzak: Treatment of landfill leachate by sequencing batch reactor, Desalination, 185, 357–362 (2005).
[16] Podedworna J., M. żubrowska-Sudoł: Oczyszczanie ścieków w reaktorach ze złożem ruchomym – możliwości technologiczne, [in:] Materiały VIII Konferencji Naukowo-Technicznej nt. Woda – ścieki – odpady w środowisku, oczyszczanie ścieków i przeróbka osadów ściekowych, Zielona Góra 2005, pp. 10–21.
[17] Puigagut I., H. Salvado, J. Garcia: Short-term harmful effects of ammonia nitrogen on activated sludge microfauna, Water Res., 39, 4397–4404 (2005).
[18] Stępniak S.: Metody oczyszczania odcieków z naziemnych składowisk odpadów, Gaz, Woda i Technika Sanitarna, 8, 326–329 (2000).
[19] Surmacz-Górska J.: Degradacja związków organicznych zawartych w odciekach z wysypisk, Monografie Komitetu Inżynierii Środowiska PAN, vol. 5, Lublin 2001.
[20] Surmacz-Górska J., K. Miksch, T. Kita: Możliwości podczyszczania odcieków z wysypisk metodami bio-logicznymi, Archives of Environmental Protection – Archiwum Ochrony Środowiska, 26, 43–54 (2000)
[21] Szyc J.: Odcieki ze składowisk odpadów komunalnych, Instytut Ochrony Środowiska, Warszawa 2003.[22] Szyłak-Szydłowski M.: Efektywność usuwania wybranych grup mikroorganizmów potencjalnie choro-
botwórczych w procesie oczyszczania odcieków ze składowiska odpadów, rozprawa doktorska, Politech-nika Warszawska, Wydział Inżynierii Środowiska, Warszawa 2008.
[23] Welander U., T. Henrysson, T. Welander: Nitrification of landfill leachate using suspended-carrier biofilm technology, Water Res., 31, 2351–2355 (1997).
[24] Wiszniowski J., D. Robert, J. Surmacz-Górska, K. Miksh, J.V. Weber: Landfill leachate treatment meth-ods: A review, Environ. Chem. Lett, 4, 51–61 (2006).
[25] Xu Henglong, Song Weibo, A. Warren: An investigation of the tolerance to ammonia of the marine ciliate Euplotes vannus (Protozoa, Ciliophora), Hydrobiologia, 519, 189–195 (2004).
[26] Xu Henglong, Song Weibo, A. Warren: Tolerance of ciliated protozoan Paramecium bursaria (Protozoa,Ciliophora) to ammonia and nitrites, Chinese Journal of Oceanology and Limnology, 23, 349–353 (2005).
FORMATION OF THE ACTIVATED SLUDGE BIOCENOSIS DURING LANDFILL ...

66
[27] Zhou Sh., H. Zhang, Y. Shi: Combined treatment of landfill leachate with faecal supernatant in sequenc-ing batch reactor, J. Zhejiang University Science B., 7, 397–403 (2004).
[28] żubrowska-Sudoł M.: Zastosowanie złoża ruchomego (moving bed) w technologii oczyszczania ścieków, Gaz, Woda i Technika Sanitarna, 7-8, 266–269 (2004).
Received: May 29, 2007; accepted: January 15, 2009.
KSZTAŁTOWANIE SIę BIOCENOZY OSADU CZYNNEGO W PROCESIE PODCZYSZCZANIA ODCIEKóW ZE SKŁADOWISK ODPADóW W REAKTORZE SBR
W pracy wykazano, że przy przyjętym reżimie technologicznym pracy SBR uzyskać można 74–71% efektywności usuwania zanieczyszczeń wyrażonych w ChZT (stężenie w dopływie 955–1059 mg O2·dm-3) przy Bx w zakresie 0,40–0,45 mg ChZT·mg-1·d-1. Azot amonowy w stężeniu do 292 mg NH4-N·dm-3 usuwany był w 97% przy Bx w zakresie 0,40–0,96 mg ChZT·mg-1·d-1. Jednocześnie zachodził proces symultanicznej denitry-fikacji obrazowany 93% efektywnością usuwania Ncałk. Osad czynny wykazywał cechy osadu wpracowanego do podczyszczania odcieków przy Bx w zakresie 0,40–0,45 mg ChZT·mg-1·d-1. Jego biocenozę stanowiły bak-terie zooglealne i nitkowate, pierwotniaki Mastigota nd., Difflugia nd., Aspidisca sp., Lionotus sp., Oxytricha sp., Opercularia sp., Tokophrya sp. i wrotki. Przy wartościach krytycznych Bx (0,96–1,64 mg ChZT·mg-1·d-1), przy których gwałtownie spadła efektywność podczyszczania odcieków, biocenozę osadu stanowiły jedynie bakterie zooglealne i nitkowate, grzyby strzępkowe oraz Mastigota nd. i Opercularia sp.
MIROSŁAW SZYŁAK-SZYDŁOWSKI, ANNA GRABIńSKA-ŁONIEWSKA

67
PL ISSN 0324-8461
© Copyright by Institute of Envionmental Engineering of the Polish Academy of Sciences, Zabrze, Poland 2009
ARCHIVES OF ENVIRONMENTAL PROTECTIONvol. 35 no. 2 pp. 67 - 73 2009
PHOSPHORUS RELEASE FROM LAKE BOTTOM SEDIMENTS AFFECTED By ABIOTIC FACTORS
TADEUSZ SOBCZYńSKI
Adam Mickiewicz University, Faculty of Chemistry, Department of Water and Soils Analysisul. Drzymały 24, 60-613 Poznań, Poland
e-mail: [email protected]
Keywords: Lake, bottom sediments, abiotic factors, phosphorus release, sequential extraction.
Abstract: The likelihood of phosphorus release from lake bottom sediments into bulk water as a result of changes in the physicochemical conditions in the lake has been analyzed by the method of sequential extraction proposed by Tessier et al. The procedure developed for estimation of the threat to water ecosystems posed by heavy metals accumulated in the bottom sediments, can be successfully applied in estimation of the release of other substances, including biogenic ones, as the subsequent states of extraction simulate the abiotic conditions and processes that can naturally take place in the near-bottom water layer and in the bottom sediment.
INTRODUCTION
In lake water phosphorus occurs in relatively low amounts, however, the effect of its presence can be profound. In natural conditions this element is usually a factor limiting primary production [16, 17]. In the bulk phosphorus occurs in the form of suspension as an abioseston (mineral trypton), bioseston (plankton) and organic trypton and in the dissolved form – mainly as orthophosphates. The above phosphorus species occur in water at a dynamic equilibrium. The phosphates are absorbed by phytoplankton and in the periods of its abundant development the concentration of phosphates in bulk water practically decreases to zero. The possible excess of phosphates is bound by the ions of iron, aluminium and calcium or is adsorbed on the surface of the suspension [2]. The phytoplankton and organic trypton are consumed by the zooplankton and as products of metabolism phosphates are released back to bulk water. Phosphorus can be also released from organic matter by biochemical reactions with phosphatases. However, the greatest amounts of phosphorus are accumulated in the bottom sediments fed with sedimenting suspensions. It is the main process eliminating phosphorus from bulk water, especially in deep lakes in which its migration back to epilimnion is difficult [6, 8, 18]. The reverse process, i.e. the release of phosphorus from the bottom sediments is often the main source of phosphates in lake water and it is referred to as the “inner source” of phosphorus in lakes [4, 17]. From the surface layers of the bottom sediment phosphorus is released into the bulk by the biotic path (enzymes, bacteria and benthonic organisms) and as a result of abiotic physical and chemical factors such as pH, redox potential, temperature, etc.

68
[1, 4, 7, 9, 16, 17]. There are many methods of phosphorus fractionation in bottom sedi-ments addressed to different forms of its binding to the matrix [1, 4, 7]. This study was undertaken to estimate the likelihood of phosphorus release from the bottom sediments as a result of changes in the abiotic conditions that can happen in near-bottom water layer in the lake.
MATERIALS AND METHODS
The analyses were made of 16 samples of lake bottom sediments collected from Lake Góreckie in the area of the Wielkopolski National Park. It is a typical dimictic channel lake surrounded mainly by forests. The lake area is 104.1 ha, its maximum depth is 17.2 m and its mean depth is 8.9 m. Analysis of the lake trophy showed an increase in its fertil-ity up to hypertrophy [14].
The concentration of total phosphorus in the samples studied varied from 0.004% to 0.117% of dry mass of the sediment. Depending on the sample collection site and on the depth of sample collection the sediment contained (for dry mass) 2.6% to 23.4% of organic matter, 0.19% to 1.50% of iron, 0.008% to 0.069% of manganese and 3.4% to 15.6% of calcium. The samples collected in deeper sites of the lakes contained greater amounts of organic matter, iron, manganese, calcium and phosphorus. The samples collected at shal-low sites were characterized by a greater amount of silica. These results indicate that the main mechanisms of sediment formation are precipitation and sedimentation.
Estimation of the likelihood of phosphorus release from the bottom sediments as a result of changes in abiotic factors was performed by the way of sequential extraction, simulating at particular stages different conditions that can happen in a near-bottom layer of the lake. The well-known scheme of metal extraction proposed by Tessier et al. [15, 19] was used. The method is based on distinction of the five main fractions:
I the exchangeable fraction – the most mobile one;II the fraction released under acidification of the environment up to pH 5.0, bound
to carbonates;III the fraction released in the reducing conditions, bound to hydrated iron and
manganese oxides;IV the fraction released on mineralization, bound to organic matter;V the residual fraction permanently immobilized in the natural conditions.The same division can be applied not only to the release of metals but also other com-
ponents of bottom sediments, including phosphates. In particular fractions the phosphates were determined by the spectrophotometric method based on the use of molybdenum and ascorbic acid as a reducing agent [5]. Absorbancy was measured at the wavelength of 700 nm on a UV-1601 spectrophotometer made by Shimadzu.
RESULTS AND DISCUSSION
Distribution of phosphorus among the particular fractions is presented in Figure 1. At pH 7, at the liquid-solid state equilibrium only a small part (3.5% on average) of the phosphorus accumulated in the sediment was released to the bulk water. Acidification of the water to pH 5, usually characterizing the near-bottom layer, resulted in the release of further 11.4% of phosphorus, on average. The strongest release of phosphorus from the
TADEUSZ SOBCZYńSKI
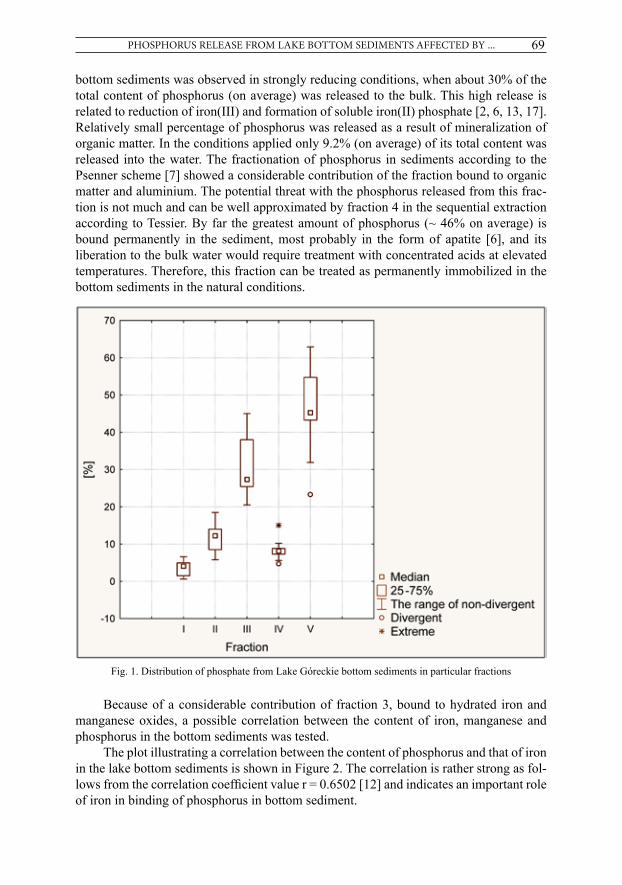
69
bottom sediments was observed in strongly reducing conditions, when about 30% of the total content of phosphorus (on average) was released to the bulk. This high release is related to reduction of iron(III) and formation of soluble iron(II) phosphate [2, 6, 13, 17]. Relatively small percentage of phosphorus was released as a result of mineralization of organic matter. In the conditions applied only 9.2% (on average) of its total content was released into the water. The fractionation of phosphorus in sediments according to the Psenner scheme [7] showed a considerable contribution of the fraction bound to organic matter and aluminium. The potential threat with the phosphorus released from this frac-tion is not much and can be well approximated by fraction 4 in the sequential extraction according to Tessier. By far the greatest amount of phosphorus (~ 46% on average) is bound permanently in the sediment, most probably in the form of apatite [6], and its liberation to the bulk water would require treatment with concentrated acids at elevated temperatures. Therefore, this fraction can be treated as permanently immobilized in the bottom sediments in the natural conditions.
Fig. 1. Distribution of phosphate from Lake Góreckie bottom sediments in particular fractions
Because of a considerable contribution of fraction 3, bound to hydrated iron and manganese oxides, a possible correlation between the content of iron, manganese and phosphorus in the bottom sediments was tested.
The plot illustrating a correlation between the content of phosphorus and that of iron in the lake bottom sediments is shown in Figure 2. The correlation is rather strong as fol-lows from the correlation coefficient value r = 0.6502 [12] and indicates an important role of iron in binding of phosphorus in bottom sediment.
PHOSPHORUS RELEASE FROM LAKE BOTTOM SEDIMENTS AFFECTED By ...

70
The correlation between the content of phosphorus and that of manganese in the Lake Góreckie bottom sediment is shown in Figure 3. The correlation is characterized by the much lower coefficient than that obtained for the correlation between the content of phosphorus and iron, of 0.3775, indicating weak correlation [12]. Also the correlation between the content of phosphorus and that of calcium characterized by the coefficient r = 0.2555 was very weak [12]. The relatively low correlation coefficients describing the correlations between the content of phosphorus and that of iron, manganese and calcium are a consequence of a diversity of the mechanisms of phosphorus binding with these elements. Phosphorus can make with them the insoluble phosphates and can be adsorbed on the precipitating hydrated oxides. The poorest correlation with the content of calcium additionally follows from the fact that in the sediment samples studied calcium occurred in considerable amounts many times greater than the stoichiometric equivalents of the bound phosphorus.
Fractionation of phosphorus in the bottom sediments by the sequential extraction proposed by Tessier [15, 19] does not allow for a differentiation of the phosphorus frac-tion bound to aluminium. The acidification at stage 3 of the extraction leads to its partial release and incorrect classification as the phosphorus bound to iron and manganese. The main pool of phosphorus bound to aluminium is released in the last (the fifth) stage of extraction and adds to the residual fraction assumed as biologically unavailable. This distribution of the phosphorus bound to aluminium among the fractions distinguished is indicated by the results of aluminium fractionation in the lake bottom sediment samples
Fig. 2. The content of total phosphorus versus the content of iron in the samples of bottom sediments from Lake Góreckie
TADEUSZ SOBCZYńSKI

71
performed according to the Tessier scheme [10]. The above problem does not have a sig-nificant effect on the evaluation of the threat to the lake ecosystem related to the phospho-rus bound with aluminium as this fraction is relatively low mobile. However, in shallow polymictic lakes in which the epilimnion is in direct contact with bottom sediments, the significance of this fraction can increase. A strong alkalization of the lake water caused by intense photosynthesis can results in pH increase even up to 10, which may induce a significant release of orthophosphates bound to aluminium [11].
CONCLUSION
The release of phosphate from the lake bottom sediments to the bulk water significantly depends on the red-ox conditions in the near bottom layer and in the sediment. This dependence is a consequence of the profound role of iron in the bonding of phosphates. In the reducing conditions the insoluble iron(III) salts convert into well-soluble iron(II) salts, which is accompanied by the release of orthophosphates whose presence exerts negative effect on the lake ecosystem. Unfortunately, such conditions occur usually in the strongly eutrophic water and additionally decrease their quality.
The research has been financially supported by the Ministry of Science and Education within the project no. N305 022 32/1103.
Fig. 3. The content of total phosphorus versus that of manganese in Góreckie Lake bottom sediment samples studied
PHOSPHORUS RELEASE FROM LAKE BOTTOM SEDIMENTS AFFECTED By ...

72
REFERENCES
[1] Bartoszek L.: Wydzielanie fosforu z osadów dennych, Zeszyty Naukowe Politechniki Rzeszowskiej, Bu-downictwo i Inżynieria Środowiska, 240 (42), 5–18 (2007).
[2] Brzozowska R., J. Dunalska., B. Zdanowski: Preliminary characteristics of the chemical composition of the toplayer bottom deposits in lake Dejguny (Mazurskie Lake District), Limnological Review, 5, 11–16 (2005).
[3] Dojlido J.R.: Chemia wód powierzchniowych, Wydawnictwo Ekonomia i Środowisko, Białystok 1995.[4] Gao L., J.M. Zhou, H. Yang, J. Chen: Phosphorus fractions in sediment profiles and their potential con-
tributions to eutrophication in Dianchi Lake, Environ. Geol., 48, 835 (2005).[5] Hermanowicz W., J. Dojlido, W. Dożańska, B. Koziorowski, J. Zerbe: Fizyczno-chemiczne badanie wody
i ścieków, Arkady, Warszawa 1999.[6] Kajak Z.: Hydrobiologia – Limnologia, Ekosystemy wód śródlądowych, Wydawnictwo Naukowe PWN,
Warszawa 1998.[7] Kentzer A: Fosfor i jego biologicznie dostępne frakcje w osadach jezior różnej trofii, rozprawa habilita-
cyjna, Wydawnictwo UMK, Toruń 2001.[8] Lampert W., U. Sommer: Ekologia wód śródlądowych, Wydawnictwo Naukowe PWN, Warszawa 1996.[9] Perkins R.G., G.J.C. Underwood: The potential for phosphorus release across the sediment-water inter-
face in an eutrophic reservoir dosed with ferric sulphate, Wat. Res., 35(6), 1399–1406 (2001).[10] Sobczyński T., M. Szwak, A. Zioła, J. Siepak: Fractionation of aluminium from alluvial sediments, Envi-
ronment Protection Engineering, 30(4), 177–182 (2004).[11] Sobczyński T., T. Joniak: Środowiskowe uwarunkowania inaktywacji fosforu w wodach Jeziora Witobel-
skiego, [in:] Diagnozowanie stanu środowiska, metody badawcze – prognozy (red. J. Garbacz), Prace Komisji Ekologii i Ochrony Środowiska Bydgoskiego Towarzystwa Naukowego, Bydgoszcz 2008, pp. 95–101.
[12] Stanisz A.: Przystępny kurs statystyki w oparciu o program STATISTICA PL. na przykładach medycznych, StatSoft Polska Sp. z o.o., Kraków 1998.
[13] Starmach K., S. Wróbel, K. Pastrnak: Hydrobiologia – Limnologia, Państwowe Wydawnictwo Naukowe, Warszawa 1976.
[14] Szyper H., W. Romanowicz, R. Gołdyn: Zagrożenia jezior Wielkopolskiego Parku Narodowego przez czynniki zewnętrzne, [in:] Ekosystemy wodne Wielkopolskiego Parku Narodowego (red. L. Burchardt), Wydawnictwo Naukowe UAM, Poznań 2001, pp. 427–472.
[15] Tessier A., P.G. Campbell, M. Bisson: Sequential Extraction Procedure for the Speciation of Particulate Trace Metals, Anal. Chem., 51(7), 844–851 (1979).
[16] Wiśniewski R.: Inaktywacja fosforanów w osadach dennych jako metoda redukcji symptomów eutrofiza-cji, [in:] Procesy biologiczne w ochronie i rekultywacji nizinnych zbiorników zaporowych (red. M. Za-lewski), Materiały z Konferencji Grupy Roboczej Narodowego Komitetu UNESCO, MAB-5 Ekosys-temy wodne, Biblioteka Monitoringu Środowiska, Łódź 1995, pp. 189–201.
[17] Wiśniewski R.J.: Rola zasilania wewnętrznego w eutrofizacji zbiorników zaporowych, [in:] Procesy bio-logiczne w ochronie i rekultywacji nizinnych zbiorników zaporowych (red. M. Zalewski), Materiały z Konferencji Grupy Roboczej Narodowego Komitetu UNESCO, MAB-5 Ekosystemy wodne, Biblioteka Monitoringu Środowiska, Łódź 1995, pp. 61–70.
[18] Zdanowski B., A. Świątecki, W. Białokoz: Dynamika uwalniania fosforu i azotu z osadów dennych i fekaliów tołpygi w różnych warunkach środowiskowych, [in:] Materiały Konferencyjne XV Zjazd Hydro-biologów Polskich, Gdańsk 1992, pp. 80.
[19] Zerbe J., T. Sobczyński, J. Siepak: Metale ciężkie w osadach dennych, ich specjacja na drodze ekstrakcji sekwencyjnej, Ekologia i Technika, 3(15), 7–12 (1995).
Received: September 4, 2008; accepted: February 18, 2009.
BADANIA NAD UWALNIANIEM FOSFORU Z JEZIORNYCH OSADóW DENNYCH POD WPŁYWEM CZYNNIKóW ABIOTYCZNYCH
W pracy przedstawiono wyniki badań nad potencjalną możliwością uwalniania fosforu z osadów dennych do wody w wyniku zmian warunków fizyko-chemicznych panujących w jeziorze. W badaniach posłużono się ekstrakcją sekwencyjną, zaproponowaną przez Tessiera i współpracowników. Procedura ta, opracowana do
TADEUSZ SOBCZYńSKI

73
oceny zagrożenia ekosystemu wodnego ze strony skumulowanych w osadach dennych metali ciężkich, może być zastosowana również do oceny podatności na uwalnianie innych składników osadów, w tym i substancji biogennych. Poszczególne etapy ekstrakcji symulują bowiem warunki abiotyczne, jakie mogą zaistnieć w stre-fie naddennej i w samym osadzie w warunkach naturalnych.
PHOSPHORUS RELEASE FROM LAKE BOTTOM SEDIMENTS AFFECTED By ...

74

75
PL ISSN 0324-8461
© Copyright by Institute of Envionmental Engineering of the Polish Academy of Sciences, Zabrze, Poland 2009
ARCHIVES OF ENVIRONMENTAL PROTECTIONvol. 35 no. 2 pp. 75 - 85 2009
EFFECTS OF GNEISS MINING ON WATER QUALITy
MLADEN ZELENIKA1, BOŽO SOLDO2, DAMIR ŠTUHEC2
1 University of Mostar, Faculty of Civil EngineeringUlica kralja Zvonimira 14, Mostar, Bosnia and Herzegovina
e-mail: [email protected] University of Zagreb, Faculty of Geotechnical Engineering
Hallerova aleja 7, 42000 Varaždin, Croatiae-mail: [email protected]
Keywords: Sedimentation sump, benefication plant, effluent, gneiss, sediment, pollution.
Abstract: 70 Mg/day of fine grained waste gneiss in slurry condition, together with 700 m3/day of water from the wet benefication plant flow from the Mikleuška gneiss quarry (Croatia) into the Kamenjača stream. The stream flows between two gneiss quarries, originating in the northern catchment area of which approximately 15 km2 is predominantly covered by forest. The quality of water in the Kamenjača permanent stream should be protected from any contamination due to the activities in the Mikleuška quarry. The paper describes the aspects of sustainable technical, environmental and economical protection of the water quality in Kamenjača regarding gneiss mining.
INTRODUCTION
The gneiss quarry (gneiss being a structural engineering stone) is on the south slopes of Moslavačka gora at the village of Mikleuška, 19 km north of Kutina along the Popovača – Podgarić road and following the Kamenjača mountain stream. The owners of the quarry have built a 2 m high concrete dam across the stream at the 155 m level, near the plateau of the Mikleuška quarry, to secure water supply for the quarry. Since 1998, the quarry has produced and sold about 100 000 m3 of gneiss per annum.
Gneiss is classified into the following fractions by means of screens and a wet sepa-ration classifier: less than 4 mm, 4–8 mm, 8–30 mm and 30–60 mm. The three larger fractions are transported by an open conveyor belt to the disposal sites in the open. It is estimated that some 700 m3 of suspended gneiss particles daily passes from the sedimen-tation sump into Kamenjača waters. The quantity of water required for wet suspension of 20 dm3/s is secured by a pump installed at the water retention of the stream (Fig. 1).
Sericitized and condensed rough useful suspension can be classified by wet and not dry separation only. The process lets out about 130 g/dm3 of murky waste water with con-centrated suspended matter. The matter so drawn from the wet separation, and floating on top, enters the stream every 8 to 10 hours each working day.
Gneiss excavation does not endanger seriously the quality of the stream water for gneiss mineral particles do not dissolve in water. Dissolved contaminants have not been found in the Kamenjača stream (the drainage basin of which is made of gneiss mainly),

76
nor downstream from the location of the murky waste water drain used in the wet separa-tion.
The paper shows the results of testing the properties of waste water in the stream and the procedure for dimensioning the rectangular horizontal sedimentation sumps, used as the cheapest procedure for elimination of suspended matter from waste water. In order to improve present conditions and to secure better exploitation of quarry resources, a study showing the effects of the Mikleuška quarry on its environment has been done [8]. It rec-ommends excavation of useful substances at the levels of 162 to 155 m and from the 175 to 160 m in the Mikleuška I and the Mikleuška II quarries, respectively. Excavation of the area below the present working plateau in the Mikleuška I quarry may free up space for the sedimentation sump, and a lagoon must be arranged for additional sedimentation of finer particles at the lowest levels in the quarry (151.2 to 153.5 m). Following extraction, the sedimentation sumps will be reshaped into sports or recreation pools. The lagoon may be used for fish breeding.
GEOLOGICAL CONDITIONS
The sedimentation basin is similar to a lake and lies upon a transgressively folded base of crystalline foundation. The end of the Helvetic period marked the beginning of the influ-ence of marine sedimentation. The Helvetic sediments contain transgressively torton con-glomerates, infirmly bound coarse grained sandstones and locally developed limestone inside them. The Pliocene rhomboidea sediments consist mainly of sands and marls, less frequently of sandstone and clay. Quaternary sediments of heterogeneous grain size dis-tribution often occur on the hillsides of Moslavačka gora, especially in the stream valleys [10].
The exploitable part of the Mikleuška I and II quarry beds is found in the crystalline massif at the south-eastern border of Moslavačka gora. Magmatic, biotitic and double-micaceous gneissic rocks are predominant in the area.
Fig. 1. Water circulation in wet separation
MLADEN ZELENIKA, BOŽO SOLDO, DAMIR ŠTUHEC

77
Large portion of gneiss in the open bed is sericitized. Therefore, the site contains sodium-calcium clay-stones with large quantities of lamellar sericite (H2, KAl3, SiO3, O3). The claystones like those are prone to intensive crumbling during excavation and transportation. For this reason, the rock must be washed in wet separation [3]. The cover of the useful suspension is made of humus, yellow-brown sandy clays and crumbling, condensed gneiss.
The intrusion of the Moslavina granite into the older metamorphic complex caused its metasomatic alteration with partial or complete re-melting. This formed a waist of het-erogeneous and homogeneous magmatic rock of hectometers to kilometers sizes. Gneiss has a similar chemical composition to that of granite, consisting of about 45% flint, 40 to 45% claystone, 10 to 15% mica and some other silicates in smaller amounts. Gneiss components are mainly water non-soluble and do not endanger the quality of water.
POTENTIAL POLLUTION OF THE WATER FLOW IN THE QUARRY
The quarry in the process of wet separation of rock now uses 20 dm3/s of the water from the Kamenjača stream during each 8–10 hour per workday. Approximately, the same quantity of 700 m3/day of water flows back to the stream carrying suspended gneiss par-ticles. The quarry owner estimates that some 10 000 m3/year of market-valued stone frac-tions is lost in this way.
Potential risks which may have a bad effect on the water quality in the Kamenjača stream [11] are: stationary gas oil tank, small stock of machine oil, in situ septic pit for quarry personnel, occasional washing of equipment, constant washing of stone, vari-ous waste materials from the office, and equipment maintenance shop. Intensive mine erosion due to the effects of precipitation has not been observed. Also, there is no increase of suspended particles in the Kamenjača stream caused by removal and excavation of gneiss in relation to the drain of precipitation water from forest paths and ploughland.
No dissolved detrimental matter has been found in precipitation water samples fal- ling, draining and/or being collected in the open pits of the Mikleuška gneiss quarries and in useful suspension and waste accumulation sites. Silicate, insignificantly soluable rock-gneiss, showing no significant effect on the quality of the stream, with the exception of solid particles in water at the wet separation draining location have been found and excavated [3].
The Kamenjača stream is properly protected against small supplies of fuel and lubri-cants, excrements in solid waste and other pollutants in the water system. However, the consequences of gneiss beneficiation in wet separation are not acceptable for the quality of the stream water. Larger quantities of suspended stone particles are present in the water used for occasional washing of equipment and regular washing of fine stone fractions in wet separation. It comprises a washing cylinder, 3 screens with the openings of 30 mm, 8 mm and 4 mm, continuous conveyors and a spiral classifier. Some 40 m3/hour of 0–60 mm stone in approximately 8 dm3/s water is washed in the cylinder. The same quantity of stone is washed on three screens, using approximately 12 dm3/s water.
WATER ANALYSIS AND REMOVAL OF SOLID PARTICLES
The water quality at the separation drains and downstream the quarry was not investi-gated in the past. On this occasion, samples of water were taken for quality tests in the
EFFECTS OF GNEISS MINING ON WATER QUALITy

78
laboratory of the Faculty of Geotechnical Engineering in Varaždin, the Faculty of Mining, Geological and Petroleum Engineering in Zagreb, and “Petrokemija” d.d. in Kutina.
Figure 2 shows the grain size distribution of the matter suspended in the water sam-ples taken at the waste water drain site (following wet separation), and 50 m downstream the drain. Its data are determined by aerometric tests and by sieving the sediment sepa-rated from the water sample. Curve 1 refers to the waste water drain in the stream in December 1998. Curve 2 refers to the drain of the water from the wet separation during January 1999. Values of 33.26% of sand, 55.80 silt and 10.94% of sediment clay are noted on the sample 1 curve (Fig. 2). The total amount of dry matter in suspension measured is 133 g/dm3.
Fig. 2. Grain size distribution curves of particle sedimentation from the sample of waste and saturated waters1 – sample from the drain, December 1998; 2 – sample from the drain, January 1999; 3 – sample 50 m
downstream the drain, January 1999
Investigations carried out in the laboratory of Petrokemija, d.d. in Kutina [2, 5] de-termined the necessity of purification of waste water used in the process of wet separation due to a high drift content. These investigations have shown that the quality of water in the sample taken 50 m downstream the waste water drain does not meet standard water quality values due to increased content of SiO2 and pollution/murkiness values too high for maximum permissible concentrations.
Table 1 shows the values determined in the laboratory of the Faculty of Geotech-nical Engineering in Varaždin [6]. The possibilities of relatively fast sedimentation of gneiss particles suspended during the quiescence of the water sample or the laminar flow
MLADEN ZELENIKA, BOŽO SOLDO, DAMIR ŠTUHEC

79
of water should be pointed out. The fastest clearing of water was observed in the quicker-transported water sample taken in January 1999 at the wet separation drain site, then in the fresh water sample taken 50 m downstream the drain site, while the longest time of sample clearing belongs to the longer-transported water sample taken in December 1998 at the waste water drain site. The differences found are probably the results of additional crumbling of coarse grained gneiss particles of colloidal size settling very slowly without the application of flocculants (rich in non-sericitized clay stones), when transported in a vessel or in the stream. For this reason, it is recommended to build the sedimentation sump as close to the wet separation plant as possible.
Table 1. Sedimentation velocity of coarse particles in 1000 cm3 of water used in wet separation
Sampling dateDecanter components
Turbid and clear water volumes [cm3]1 hour 3 hours 24 hours 48 hours
OutletDecember 1998
coarse residue 100 120 120 120total residue 915 640 500 440clear water 85* 360* 500* 510
OutletJanuary 1998
coarse residue 80 80 80 80total residue 870 680 430 380clear water 130 390 570 620
50 m downstream January 1999
coarse residue 15 15 15 15total residue 15 150 85 64,5clear water 985* 850* 915 865
* water above sediment in graduated glass was not completely clear
Table 1 shows the background for the explanation of regulating the sedimentation sumps with adequate dimensions for removal of suspended matter from water before be-ing drained into the stream. In the sedimentation sumps adequately designed, built and maintained it is possible to decrease the suspended matter content to the value of 25 mg/dm3, as observed in the water samples upstream the quarry.
DESIGNING SEDIMENTATION SUMPS
Draining murky water from the wet separation into the Kamenjača stream is a fundamen-tal threat to water quality. Clarity of water has been a long-standing water quality criterion [4]. The quarry owner must remove solid matter suspended in the waste water used in the operation process. The sale prices of the quarry products are relatively low. The same applies to investments and maintenance of equipment for removal of waste matter from the water: descender, desilter, centrifuges and tools for using the flocculator (alumina, ferrochloride, lime and similar chemicals), a device used for acceleration of settling. The quarry has enough space for sedimentation sumps. It is necessary to see the possibilities for clearing the murky water by using the sedimentation sumps mentioned.
In addition to dimensions of the particles suspended, an important effect on the sedimentation velocity of solid particles belongs to the density difference existing between suspended particles/fluid and fluid viscosity [7]. This is further proved by the Stockes formula for laminar streaming of liquids with suspended matters.
EFFECTS OF GNEISS MINING ON WATER QUALITy

80
(1)
where:vt – sedimentation velocity of individual particles in given conditions [m/s],g – gravity acceleration [m/s2],rc – density of suspended particles [kg/m3],r – fluid density [kg/m3],dc – particle diameter [m],m – dynamical viscosity of suspension [Pa s].Figure 3 shows idealized rectangular sedimentation sump that will serve for com-
putation of relevant basin dimensions securing laminar streaming and necessary deten-tion of water in the basin. The entrance zone in which a mass of water with suspended particles is distributed and forming a laminar flow is marked 1. Sedimentation of particles occurs in Zone 2, through which the water flows to the exit/drain Zone 3, where the clari-fied water converges. Separated sediments accumulate in Zone 4. From there, sediments are removed by cleaning the basin bottom in accordance with the regime of work of the separation, i.e. sedimentation basins.
Fig. 3. Rectangular horizontal sedimentation sump
Decisive particle for dimensioning the sedimentation sump is the one entering at point a, settling along the entire length of the sump and reaching the point b after a certain period of time. Trajectory of sedimentation of such a particle represents the resultant of the streaming velocity vector vo and vector of the sedimentation velocity vt [4]. Thus, all particles sinking with velocity vt > vo settle in the sedimentation basin (Zone 4) and do not reach the draining Zone 3 (Fig. 3).
For the given inflow of waste water from wet separation Q = 0.020 m3/s, height of sedimentation sump ho = 0.5 m and minimal time of retention in the sump to = 10 800 seconds, it is possible to calculate the surface of the sedimentation sump A, the volume of
MLADEN ZELENIKA, BOŽO SOLDO, DAMIR ŠTUHEC

81
the sump V and the velocity of the particle flow through the sedimentation sump vo (Fig. 3) using the following formulae:
ooo thv = (2)
QVto = (3)
ohVA = (4)
AQvo = (5)On the basis of the above parameter values, i.e. the rectangular horizontal sump, the
values of all other parameters are calculated using the above formulae as follows:3m21610800020.0 =⋅=⋅= otQV (6)
3m4325.0216 === ohVA (7)
CONSTRUCTION OF SEDIMENTATION SUMPS AND POSSIBILITY OF CHANGING THEIR FUNCTION
Excavation of sedimentation sump gneiss using the existing equipment, in engineering and financial view, is always favorable for the quarry owner. However, securing a perma-nent use of correctly dimensioned structures for removal of suspended matter after a rela-tively short period of quarry life is of particular economic importance. According to Sport Encyclopaedia published by Miroslav Krleža Lexicographic Institute [9], the size of sport basins is most often 25×18×2.2 m or 33.33×20×(2.20 to 0.90 m) or 50×25×2.20 m. For this reason, architects are advised to apply the sizes above for sedimentation sumps as well as to provide the sizes for future sports/recreation facilities.
The terrain configuration and the surface area owned by the quarry between the Kamenjača stream and the wet separation plant are suitable for laminar flow without the use of additional pumps. Therefore, an average content of solid particles in the water cleared by sedimentation, desired frequency of cleaning the sediment from the sumps to sediment gathering places for additional drying (Fig. 4) and standard sizes of sports pools have a decisive influence on designing sedimentation sumps.
Available useful substance surface is sufficient for one future sports pool hav-ing standard dimensions of 50×25×2.20 m and two smaller pools covering an area of 25×18×2.20 m. A part of the alluvial lagoon sediment area can later be used for fish breeding. If two necessary sumps, and a likely third one similar in size, are situated in a future large basin instead of the sediment collection site with fine grains (using existing equipment in the useful substance), an excavation approximately 55 m long, 3.5 m deep and 30 m wide will be rationally performed, then divided into two equal parts 13 m wide (w) with a dividing 4 m wall of natural gneiss rock. Drain pipes will be installed at the bottom of the sumps to drain water through the settled sediment, particularly the coarser one, at the entrance closer to the second part of the sump (up to 10 m). Following is the verification of the length and width of sumps:
; (8)
, or 55 m respectively. (9)
EFFECTS OF GNEISS MINING ON WATER QUALITy

82
In this way, the useful volume of each sump equals 55.13×3.30 m = 2360 m3. If 0.020 m3/s of murky water flows through for a maximum of 10 hours a day, the total comes to 720 m3/day. The same volume of water can flow out 24 hours/day, i.e. Q1 = 0.0083 m3/s. In this case the average velocity of water vo on the spillway into the Zone 3 (Fig. 2) at the level of the spillway top (adjusted according to requirement) with 0.20 m water in the sump is determined as follows:
(10)
The space available in the sump for settling of sediment is:
(11)
The height of the sediment:
(12)where:
H – total depth of excavation [m],hc – decrease of sump depth due to drain pipes [m],ho – height of spillway in the sump that will be adjusted according to requirements [m],w – width of sump.
It is necessary to verify the laminar flow in the sumps of given dimensions and ve-locity of flow, because only the flow along constant streamlines secures effective settling of suspended particles.
The equation for calculating the Reynolds number is used here. For a rectangular sump, this number must be less than 580, which is the critical value characterizing the transition from turbulent to laminar flow regime [1].
Fig. 4. Layout of sumps, sediment collecting sites and the lagoon
MLADEN ZELENIKA, BOŽO SOLDO, DAMIR ŠTUHEC

83
(13)where:
vp – average velocity in the sump, 0.00319 m/s;R – hydraulic radius – ratio between surface of flow and circumference of flow in the
sump, R – A/O = w (ho/w + 2ho), as ho < w, R = ho = 0.2 m;m – value of water viscosity with suspended fine particles, 0.002 Pa s;r – water density with suspended fine particles, 1800 kg/m3.
The above calculation confirms the laminar flow, because the value of the Reynolds number is 344 only. For this reason, the planning consists of a standard-sized pool meas-uring 50×25×2.20 m for two sumps, and two sports pools measuring 25×18×2.20 m for drying the sediment.
Based on laboratory-determined average inflow water drift content of 0.133 m3 per 1 m3 of water, 720×0.133 = 95.76 m3/day is being settled. Filling of the sedimentation sump with such dimensions by the sediment from water with known content would last 2216.5/95.76 = 23.15 days.
Interruption in using one sedimentation sump after a period of 23 days and its emp-tying from sediment into two supporting basins until next use after the following 23 days (until the second sump is filled), necessitates a moderate frequency of cleaning out the sumps.
If the spillway (i.e. spill-over point) of the sump is adjusted to the height of 3.10 m in relation to the top of the drain pipe on the bottom of the sump, the sump can receive the following amount of murky water in its space V2 (up to the spillway):
V2 = 55×13×3.10 = 2216.5; thus, the filling of this space would last t2 as follows:
110825 s or 30.78 hours. (14)
The value t2 is longer than 3 days of wet separation work (10 hours a day). This secures a several times more complete settling of the sediment with respect to the condi-tions of earlier assumed value of t0 = 10800 s, because:
; (t2 >> t0) (15)
During the time of original filling of the sump lasting t2 = 110.825 seconds, the sedi-ment volume is expected to be V3 = V2×pn = 2216.5×0.085 = 188.40 m3, corresponding to the following height of sediment in the sump:
m (16)
This is also the time it takes to open the valve on the drain pipe and for gradual drain-ing of water. Due to the water being filtered into drain pipe through the sediment (which is an effective filter), clearer water is expected in the drain pipe than on the spillway.
ADDITIONAL PROTECTION OF THE WATER FLOW
In order to protect the Kamenjača water flow from the finest solid matter in a more com-plete manner, a shallow lake (lagoon) with a surface of about 10 000 square meters is also
EFFECTS OF GNEISS MINING ON WATER QUALITy

84
planned downstream the sumps (Fig. 4). The surface of the future lagoon is covered with humus that will be removed with existing equipment and transported to the final surfaces of excavation to be used as green areas. Following the removal of humus from the bottom of the lagoon, significant infiltration of water into the water bearing alluvium is expected, as well as an increase of underground water level in the downstream wells in Mikleuška housing estates, which is an additional positive effect of the lagoon.
If ecologists have justified objections to the quality of water tested at the drainage point from the lagoon into the stream, it is recommended to reuse the lagoon water in wet separation.
SEDIMENT DISPOSAL
Figure 4 shows the layout of sedimentation sumps, the future lagoon contours and con-tours of locations for disposal of sediments. Two sediment disposal locations are planned, since a segregation of suspended particles in sedimentation sumps according to grain size is expected. Sedimentation of coarser grains that have value on construction materials market (for civil engineering purposes) is expected to be found at the first 10 to 15 m of the sump. Sediment predominately containing the finest particles is expected in the remaining part of the sump. Therefore, as shown in Figure 4, two collecting places for sediments drying on the sun are planned; one for the sediment with coarser grains to be sold on the market, and another for the finest particles used in forming the water flow in the lagoon, filling the quarry pits and for leveling final excavation surfaces before being covered with humus and plants.
The coarser fraction from the sedimentation sumps will be additionally dried in a specially arranged gathering place before being supplied to customers, while the drained water will be taken to the active sedimentation sump. Sediments of finest particles (mud) will be additionally dried in the basins, where an additional drain similar to the above described is recommended.
The lagoon water will be directed towards the spillway into the stream by a longer channel that will gradually form by the mentioned mud of finest particles settling in the sedimentation sumps. To achieve a more effective settling method for the finest particles in the lagoon and to remove the remainder of colloidal matter in the water after the flow through the sedimentation sump in the layout, a canal for laminar flow of water will be designed and built. The study [8] envisions a concept of facilitating the basin for gather-ing sediments for standard size swimming pools, and the lagoon for fish spawning, both advantageous in view of economic effects.
CONCLUSION
A public utilities company from Kutina regularly takes away fecal matter and solid waste from the quarry. No cases of uncontrolled effusion of lavatory content, gas or machine oil into the stream were recorded. Equally so, no amounts of settled matter in the precipita-tion water flowing into the stream from open surfaces of the quarry and poor rock heaps higher than those in the water flowing from ploughland and forest paths were observed. Additional measures securing the surroundings from these and other dangers have been successfully implemented. The process of purifying water used for washing equipment and stone in the wet separation has not yet been planned and implemented in the quarry.
MLADEN ZELENIKA, BOŽO SOLDO, DAMIR ŠTUHEC

85
Guidelines for construction of sedimentation sumps and the lagoon for removal of suspended matter are given in the study [8]. The prescribed clearness of water at the drain into the stream has to be adhered to. Further investigation of properties of particles suspended in water, systematic monitoring of the efficiency of sedimentation of particles with different coarseness in the sedimentation sumps and in the lagoon, leading to im-proved process during construction and use of these facilities are also recommended. We can also recommend the facilitation of a third sump, at the point of the northern sediment-gathering location, as well as special forming of the lagoon shape in order to secure a more effective settling.
If ecologists make justified objections relating to the quality of water tested at the draining point from the lagoon into the stream, it is then recommended to reuse the lagoon water in the wet separation.
In spite of the fact that no dissolved harmful matter has been found in the water samples used in wet separation or in the precipitation water falling and flowing over exca-vations, useful substances and waste heaps, special care in excavation is recommended in order to avoid erosion and drawn sediments during precipitation. Regular tests in chemi-cal laboratories are strongly recommended. Any stronger clouded waters in the quarry should be directed to the lake (lagoon) downstream the sumps for sedimentation of col-loidal particles and systematic control of water quality.
REFERENCES
[1] Agroskin I.I., G.T. Dmitrijev, F.I. Pikalov: Hidraulika, Tehnička knjiga, Croatian translation, Faculty of Civil Engineering, Zagreb 1969.
[2] Baglama I., A. Hanžec, B. Zrinščak: Izvješće o rezultatima analize uzoraka vode iz potoka Kamenjača, Petrokemija, Kutina 1999.
[3] Braun K.: Eleborat o rudnim rezervama kamenoloma Mikleuška II. kraj Kutine, Geotechnical Faculty, Varaždin 1998.
[4] Broz R.: Kondicioniranje voda – odabrana poglavnja sanitarne tehnike, Script, Faculty of Civil Engi-neering Zagreb, Zagreb 1972.
[5] Džajo M.: Izvješće o rezultatima analize uzoraka vode iz potoka Kamenjača, Petrokemija, Kutina 1999.[6] Levačić E., D. Štuhec: Izvješće o rezultatima analize uzoraka vode iz potoka Kamenjača, Geotechnical
Faculty, Varaždin 1999.[7] Linsley R.K., D.L. Francini et al.: Water-Resources Engineering, McGraw-Hill Int., Singapore 1992.[8] Nuić J., M. Zelenika et al.: Studija utjecaja na okoliš kamenoloma Mikleuška, Geotechnical Faculty,
Varaždin, 1999.[9] Sports Encyclopaedia, Miroslav Krleža Lexicographic Institute, 2nd tome, pp. 82–83, Zagreb 1993.[10] Tomašić I.: Rezerve tehničkog građevinskog kamena gnajsa u ležištu Mikleuška II, Klentch d.o.o., Kutina
1996.[11] Zelenika M.: Hidrološke prospekcije okoliša kamenoloma Mikleuška, Geotechnical Faculty, Varaždin
1998.
Received: April 14, 2008; accepted: March 2, 2009.
EFFECTS OF GNEISS MINING ON WATER QUALITy

86

87
PL ISSN 0324-8461
© Copyright by Institute of Envionmental Engineering of the Polish Academy of Sciences, Zabrze, Poland 2009
ARCHIVES OF ENVIRONMENTAL PROTECTIONvol. 35 no. 2 pp. 87 - 95 2009
TECHNOGENIC AND GEOGENIC MAGNETIC SUSCEPTIBILITy OF MOUNTAIN FOREST SOILS ON EXAMPLE
OF FOREST DIVISION KAMIENNA GÓRA
ADAM ŁUKASIK*, ZYGMUNT STRZYSZCZ
Institute of Environmental Engineering of the Polish Academy of Sciencesul. M. Skłodowskiej-Curie 34, 41-819 Zabrze, Poland
* Corresponding author e-mail: [email protected]
Keywords: Heavy metal content, magnetic susceptibility, parent rock, Sudety Mountains.
Abstract: The Sudety Mountains are located close to industrial areas of Germany, Poland and the Czech Re-public and are the most polluted Polish mountains. Among air pollutants such as SO2, NOx, fly ashes from local and transboundary power plants emission have a significant input. In determination of soil pollutants, magnetic susceptibility measurements find application. The use of magnetic measurements as a proxy for chemical meth-ods is possible because air pollutants and magnetic particles are interrelated. The major sources of air pollution in the Sudety Mountains are fly ashes from burning process of fossil fuels. This paper presents content and distribution of heavy metals in soil profiles, depending on their natural or industrial origin and the results of magnetic susceptibility measurements.
INTRODUCTION
The area of Forest Division Kamienna Góra covers 15526 ha and belongs to Region (VIII) of the Sudety Mountains, which are among the oldest mountain ranges in Europe. In morphological structure a distinguishing diversity of landscapes as an effect of rich ge-ological history of this area is found. The soils of that region have weathering origin from shallow profile in higher part of mountains to middle and deep profile in subsidence.
The most of forest soils of that region contain considerable amounts of heavy met-als such as lead, zinc and cadmium, the highest concentrations of which are observed in upper horizons. The magnetic susceptibility (MS) measurements found application in monitoring and assessment of the level of contamination of soils, especially by airborne pollutants. Magnetic iron particles are associated with hazardous pollutants such as heavy metals and as component of the industrial dust, are finally deposited on soil surface. Re-search of soil magnetic susceptibility of Poland shows diversity. Higher values of mag-netic susceptibility (MS) are noted in soils of Southern Poland along the border with Slo-vakia, the Czech Republic and Germany, from Krakow through Upper Silesia to Lower Silesia. The reason for such spatial distribution of MS is emission of iron compounds related to burning processes of hard and brown coal. Metallurgy as well as coke plants and cement industry (Opole region) have significant influence on high values of MS, es-

88
pecially on areas of Krakow and Upper Silesia. In the Sudety Mountains region, techno-genic influence on MS values is lower, particularly under organic horizons of soil profile. Diversification of parent rocks such as basalts, amphibolites, serpentines and phyllites, rich in ferrimagnetics affect magnetic susceptibility enhancement. Distribution of MS in soil profiles changes regardless of the soil type, but the fly ashes chemical content and level of deposition [8]. The aim of this work is to find relation between influence of parent rock and fly ash pollution on magnetic susceptibility of forest soils.
OBJECTS AND METHODS
Six profiles of soils localized in Forest Division Kamienna Góra were examined. Each evolved on different parent rock, under different forest stand and in different terrain con-figuration (height above sea level, slope gradient and orientation). The diagnosis of the soil profiles was done according to Polish Forest Soil Classification 2000 [2] and World Reference Base for Soil Resources 1998 [12].
Profile No. 1 (Skeleti-Protoalbic Cambisol). Located in the West Sudety Mountains at 1000 m a.s.l, northern orientation, slope gradient 6–8°, parent rock – phyllite shale. Type of humus: mor. Forest stand: die-back spruce stand after ecological disaster.
Profile No. 2 (Skeleti-Dystric Cambisol) Located in the West Sudety Mountains at 800 m a.s.l., western orientation, slope gradient 20°, parent rock – amphibolite. Type of humus: moder. Forest stand: beech timber forest.
Profile No. 3 (Skeleti-Haplic Podzol (Rustic)) Located in the Middle Sudety Moun-tains at 720 m a.s.l., southern orientation, slope gradient 25°, parent rock – porphyry. Type of humus: mor. Forest stand: spruce stand with a single admixture of beech.
Profile No. 4 (Dystric Cambisol) Located in the Middle Sudety Mountains at 520 m a.s.l., south-western orientation, slope gradient 12°, parent rock – “kwadrowe” sandstone. Type of humus: moder. Forest stand: spruce stand with a single admixture of beech, larch, and pine.
Profile No. 5 (Skeleti-Dystric Cambisol) Located in Middle Sudety Mountains at 550 m a.s.l., north-western orientation, slope gradient 15°, parent rock – conglomerate of alkali magma rocks. Type of humus: moder. Forest stand: beech stand.
Profile No. 6 (Rendzic Leptosol (Cambic)) Located in the West Sudety Mountains at 700 m a.s.l., south-western orientation, slope gradient 10°, parent rock – dolomite cov-ered by magma rock – mantle. Type of humus: moder. Forest stand: spruce stand with a single admixture of beech and sycamore seed trees.
The six soil profiles were examined for physic-chemical parameters and magnetic susceptibility measurements (mass specific susceptibility [χ]) for each horizon. Soil sam-ples were air dried and sieved through 1 mm screen in the laboratory to separate the soil skeleton. Particle size analysis was determined by sieve and aerometer methods by Casagrande’a in Prószynski modification (Tab. 1). Coarse fragment content in soils was determined in the field. Grain size and granulometry were determined according to clas-sification of Polish Society of Soil Science. Soil pH in distilled water and 1 M KCl were determined by potentiometric method. Organic carbon was determined by modified Tiu-rin method (Tab. 2). Heavy metal content was determined by AAS method after the min-eralization in mixture of 70% HClO4 and concentrated HNO3. Elements such as Ni and Cr were determined by ICP technique. All detail parameters regarding physic-chemical
ADAM ŁUKASIK, ZYGMUNT STRZYSZCZ

89
properties of the presented profiles and wide description of forest habitats are published in Atlas of Forest Soils in Poland [1].
Magnetic susceptibility is defined as a ratio of the material magnetization to the external magnetic field. Paramagnetic materials reach positive values of magnetic sus- ceptibility whilst diamagnetic negative values [10]. The magnetic susceptibility (MS) was measured using the MS2 Bartington sensor in laboratory. It was expressed as the mass specific susceptibility (SI units of χ⋅10-8 [m3⋅kg-1]) (Tab. 3), which is the volume susceptibility divided by density of the material. The content of heavy metals in different horizons of soil profiles expressed in mg⋅kg-1 is strongly modified by density of horizons. To determine the correlation coefficient between magnetic susceptibility and heavy metals content in whole profile, factor D was applied. The volume density (D) expressed in g·cm-3
was worked out in the Department of Forest Soil Science of the Agricultural University of Cracow [1]. For calculation D = 1.3773⋅e-0.0547⋅x was assumed, where x – organic carbon content in %, which include samples with Corg. content below 0.29% (Tab. 2).
Dust fall data were obtained from Forest Research Institute in Warsaw for three summer seasons (1988, 1989, and 1992) and winter season (1989). For comparison, dust fall results from neighbouring Forest Divisions (Śnieżka, Wałbrzych) are enclosed (Tab. 5) [3].
RESULTS AND DISCUSSION
Diversity of parent rock of examined soils is related with geological structure of the Su-dety Mountains and present as follow: phyllite shale, amphibolite, porphyry, sandstone, conglomerate of alkali magma rocks and dolomite. The mechanical analyses were com-pleted in laboratory and the soil horizons present textural classes from sand (S) (25–50 cm in profile No. 6) to silt loam (SiL) (7–26 cm and 26–76 cm in profile No. 5) according to USDA classification.
All soil profiles have low pH in uppermost horizons (below 4.5 in H2O). Besides parent rock, climate and form of the organic matter, industrial pollutions have influence on low pH reaction. High amounts of anthropogenic Pb in organic horizons (O), (Tab. 3), significantly decrease activity of microrganisms, and decomposition of organic matter, what reflects the high content of organic carbon in uppermost horizons.
The magnetic susceptibility varies depending on horizon and parent rock. Compari-son of coefficients of correlation between (MS) and heavy metals content expressed in mg·kg-1 and mg·dm-3 shows that expression of Cd, Pb, Fe and Mn in mg·dm-3 does not affect the tendency (correlation coefficient are positive) (Tab.2).
In the profiles No. 1 and No. 2 both technogenic and geogenic influence on magnetic susceptibility are observed. As opposed to the rest of soil profiles, magnetic susceptibility has the lowest values in upper horizons (Tab. 3).
Profile No. 1 (Skeleti-Protoalbic Cambisol) formed on phyllite shale, is rich in mag-netic minerals. The highest content of iron, zinc and manganese accompanies the highest values of magnetic susceptibility in soil profile. Distribution of (MS) in soil profile sug-gests geogenic character. Correlation coefficients for Pb and Cd have negative values but for Fe, Zn, Mn, Ni, positive (Tab. 2).
Profile No. 2 (Skeleti-Dystric Cambisol) formed on amphibolite, rich in magnetic minerals, presents lithogenic character of magnetic susceptibility. High content of iron in
TECHNOGENIC AND GEOGENIC MAGNETIC SUSCEPTIBILITy OF MOUNTAIN FOREST ...

90
Table 1. Grain size distribution and chemical properties of soils
No. profileparent rock
Depth[cm] Level
% fraction [mm] Corg.[%]
pH(H2O)
pH(KCl)> 1 1.0–0.1 0.1–0.02 < 0.02
1phyllite shale
1–88–2121–5656–110
OfOh/EesBbrBfeBbrC
0408090
3940
2523
3637
31.7613.29
3.43.43.53.5
2.52.74.04.1
2amphibolite
1–88–2525–7070–120
O/AhA
BbrBbrC
20404090
253338
363027
393735
14.992.84
3.84.35.25.3
3.13.74.14.1
3porphyry
1–1717–3838–4949–7070–120
OfhEesBhBfeBC
060707090
50483458
21343519
29183123
25.142.275.84
3.53.94.14.24.3
2.73.33.74.03.9
4“kwadrowe”sandstone
1–66–1111–64
64–140
OfhABbrBbr
BbrC
01130
673841
183134
153125
23.521.19
3.73.84.14.8
2.93.13.83.6
5conglomerate alkali magma rocks
2–77–2626–7676–120
Oh/AABbrBbr
BbrC
30404090
211943
282819
515338
16.31.12
3.74.24.14.1
3.03.53.83.8
6dolomite covered magma rock-mantle
0–1010–2525–50
AhABbrIICca
202090
2992
305
443
10.371.33
4.45.77.9
3.74.77.9
Table 2. Correlation coefficients (r) between magnetic susceptibility and heavy metals content in soil profiles expressed in [mg·kg-1]/[mg·dm-3]
No. profile Fe Pb Cd Zn Mn Cr Ni1phyllite shale 0.53/0.50 -0.65/-0.56 -0.64/-0.71 0.45/0.63 0.62/0.61 -0.06/0.30 0.71/0.72
2amphibolite 0.85/0.63 -0.58/-0.40 0.36/0.80 -0.58/0.60 0.74/0.63 -0.45/0.34 0.72/0.83
3porphyry -0.55/-0.90 0.99/0.99 0.99/0.92 0.96/-0.81 -0.22/-0.57 0.45/-0.70 0.84/-0.48
4“kwadrowe”sandstone
-0.19/-0.50 0.99/0.99 0.99/0.99 0.94/-0.20 -0.08/-0.50 0.90/-0.53 0.62/-0.37
5conglomerate alkali magma rocks
-0.69/-0.90 0.99/0.99 0.99/0.99 0.83/-0.97 -0.91/-0.96 0.53/-0.91 -0.43/-0.92
6dolomite covered magma rock-mantle
0.63/0.30 0.99/0.99 -0.49/-0.60 0.44/0.14 -0.62/-0.77 0.87/0.56 0.58/0.25
ADAM ŁUKASIK, ZYGMUNT STRZYSZCZ

91
the profile have stronger influence on (MS) than high content of lead in organic horizon. Correlation coefficients in this profile are positive for iron, cadmium and nickel and nega-tive for lead. (Tab. 2).
Profile No. 3 (Skeleti-Haplic Podzol (Rustic)) shows enhancement of magnetic sus-ceptibility in the upper horizon (69.6·10-8 m3·kg-1) (Tab. 3). Parent rock (porphyry) is not rich in magnetic minerals; measurements in lower horizons gave results in range from 26 to 32·10-8 m3·kg-1. Lead content is highest in the surface horizon, correlation coefficient between content of this element in all horizons and magnetic susceptibility is equal to 0.99, which suggests technogenic origin of Pb in this profile.
In the profile No. 4 (Dystric Cambisol), the highest magnetic susceptibility (130.9·10-8 m3·kg-1), (Tab. 3) has the organic horizon (Ofh). Parent rock (“kwadrowe” sandstone) is poor in magnetic minerals. Slope orientation (SW), which is in main direction of pollu-tion influx and high Pb and Cd contents in upper horizon, suggests technogenic origin of these elements in soil profile. Correlation coefficient for magnetic susceptibility and lead and cadmium content equals 0.9 and confirms technogenic character of magnetic susceptibility.
Table 3. Magnetic susceptibility (χ), volume density (D) and heavy metals content in soil profiles
Profile Depth [cm] Level χ⋅10-8
[m3·kg-1]D
[g·cm-3]Heavy metals x D [mg·dm-3]
Fe Pb Cd Zn Mn Cr Ni
1
1–8 Of 105.4 0.24 2036.2 39.8 0.17 14.4 46.3 4.6 3.48–21 Oh/Ees 138.8 0.67 13986.6 41.0 0.07 19.4 212.2 11.3 7.321–56 BbrBfe 119.4 1.38 57021.6 20.1 0.07 111.4 4501.6 45.8 34.856–110 BbrC 181.0 1.38 52164.0 16.4 0.06 136.8 5575.2 32.3 50.6
2
1–8 O/Ah 224.6 0.61 17044.1 28.2 0.09 36.7 619.3 32.2 17.28–25 A 445.4 1.18 43008.8 15.0 0.25 57.7 2455.8 36.1 49.425–70 Bbr 357.7 1.38 50011.2 4.0 0.07 66.1 2365.3 24.7 36.470–120 BbrC 289.6 1.38 47720.4 3.3 0.07 62.5 2805.5 22.6 42.8
3
1–17 Ofh 69.6 0.35 3713.8 44.0 0.16 16.9 107.2 4.5 4.517–38 Ees 26.2 1.22 13645.3 12.8 0.06 30.6 347.8 10.0 4.738–49 Bh 28.7 1.00 15528.8 12.7 0.05 30.2 269.0 12.9 8.349–70 Bfe 31.5 1.38 17470.8 14.1 0.07 41.3 552.0 18.5 12.870–120 BC 29.2 1.38 18285.0 12.1 0.10 31.9 874.9 11.2 9.8
4
1–6 Ofh 130.9 0.38 2157.3 44.9 0.15 16.0 132.3 7.3 4.86–11 ABbr 3.3 1.29 2697.2 11.2 0.09 11.4 85.2 7.5 3.5
11–64 Bbr 7.7 1.38 9894.6 12.0 0.07 17.5 567.2 11.9 7.064–140 BbrC 3.1 1.38 17829.6 8.1 0.07 27.9 955.0 16.4 16.0
5
2–7 Oh/A 115.1 0.56 10491.8 95.2 0.08 44.6 684.4 15.0 11.97–26 ABbr 28.4 1.29 26825.4 15.5 0.06 79.9 3669.1 30.4 27.226–76 Bbr 33.6 1.38 30470.4 13.1 0.07 81.7 2953.2 38.0 29.876–120 BbrC 23.5 1.38 37784.4 14.9 0.07 95.5 4353.9 31.7 39.3
60–10 Ah 108.0 0.78 21553.6 181.2 0.29 145.0 3996.0 33.4 16.910–25 ABbr 40.9 1.28 43887.3 88.2 1.70 383.9 15718.8 46.6 37.525–50 IICca 1.3 1.38 6927.6 6.8 0.99 45.4 12033.6 3.7 3.5
TECHNOGENIC AND GEOGENIC MAGNETIC SUSCEPTIBILITy OF MOUNTAIN FOREST ...

92
In the profile No. 5 (Skeleti-Dystric Cambisol), highest magnetic susceptibility (115.1·10-8 m3·kg-1) (Tab. 3) is in horizon Oh/A. Parent rock (conglomerate of alkali mag-ma rocks) is poor in the magnetic minerals. Slope orientation (NW), highest Pb content in the upper horizon and high correlation coefficient (0.9) between content of this element and magnetic susceptibility suggests technogenic origin of lead in this profile.
In the profile No. 6 (Rendzic Leptosol (Cambic)), the highest magnetic suscepti-bility (108·10-8 m3·kg-1) (Tab. 3) is in the horizon Ah and decreases with depth. Parent rock (dolomite covered by magma rock – mantle) is poor in magnetic minerals. Slope orientation (SW) is compliant with direction of long-range pollution influx from industry regions. The highest Pb content in upper horizon and correlation coefficient between con-tent of this element in the profile and magnetic susceptibility suggest technogenic origin of lead in this profile (Tab. 2).
Research conducted in South of Poland on 42 forest soil profiles shows comparable results regarding distribution of heavy metals (Pb, Zn, Cd) in O/A horizons and their technogenic origin [6]. Correlation coefficients for Pb content and magnetic susceptibil-ity are high in profiles developed on parent rocks poor in magnetic minerals (dolomites, sandstones, porphyries). In profiles developed on parent rock rich in magnetic minerals, they have negative values (Tab. 2). However, lead content in uppermost organic horizons is highest in all profiles, which suggests anthropogenic origin of this element, in profiles rich in magnetic minerals (Profile 1, 2), does not affect significantly magnetic susceptibil-ity values.
Technogenic character of magnetic susceptibility in uppermost organic horizons is result of fly ashes deposition (Profiles 1, 2, 3, 4, 5, 6; Tab. 4). Geogenic character of magnetic susceptibility in examined soil profiles is confirmed by higher values in parent rocks compared to the uppermost organic horizons (Profiles 1, 2; Tab. 4). Pedogenic proc-esses also affect (MS) in researched soils, it concerns accumulation horizons (B) of soils, formed on poor in ferromagnetics parent rocks (Profiles No. 3, 4, 5, 6; Tab. 4). Relocation and transformation of iron compounds and then other elements may significantly affect magnetic susceptibility of a soil profile.
Table 4. Magnetic susceptibility in soil profiles
Magnetic susceptibility
character
Profile No. and parent rock1
phyllite shale
2amphibolite
3porphyry
4“kwadrowe” sandstone
5conglomerate alkali magma
rocks
6dolomite
covered magma rock-mantle
Technogenic X X X X X XGeogenic X XPedogenic X X X X
The magnetic properties of soils change due to the industrial and urban dust deposi-tion. Most of industrial dusts contain significant fraction of ferrimagnetic particles that are produced during various high temperature technological processes or combustion of fossil fuels [8]. High magnetic susceptibility in uppermost horizons of forest soil profiles are related to species composition of forest stands. Norway spruce is the dominant species in the Forest Division Kamienna Góra and has the highest ability to retain air pollution compared to other tree species [11].
ADAM ŁUKASIK, ZYGMUNT STRZYSZCZ

93
Lead, in spite of other emitted heavy metals, has the highest enrichment coeffi-cient which is connected with physic-chemical properties and specific surface of ash from power station chimneys. Specific surface for chimney ash from the power station “Turów” is 3.96 m2·g-1 and is higher than fly ash 2.28 m2·g-1 [4]. These factors have influ-ence on higher Pb content (compared to Zn content) in uppermost horizon of soil profiles and bogs of southern Poland, where the majority of power plants is located.
Table 5. Montly dust fall over Forest Division Kmienna Góra area [g·m-2·month-1], based on Forest Research Institute data [3]
Years Śnieżka Kamienna Góra Wałbrzychmean max month mean max month mean max month
1988 2.006 5.340 VIII 2.272 6.367 VII 2.355 6.877 IX1989 1.431 16.025 VIII 1.536 5.962 V 2.051 7.072 V1989/90 2.010 3.890 XII 1.733 9.781 X 1.792 4.886 II1992 2.152 9.546 VII 1.763 4.845 VIII 3.022 11.318 VIII
Mean natural content of Pb in Polish soils is 18 mg·kg-1. In all profiles the content of Pb is highest in the uppermost organic horizons. Because of low migrations of this element, its natural distribution in soil profile reflects its content in parent rock. A reason of high values of Pb in soil profiles of the Sudety Mountains area is transboundary pol-lution influx from Germany and the Czech Republic, which was shown by Zwoździak [13]. Low households emission significantly contributes to air pollution in winter. The main directions of pollution influx in the Sudety Mountains are SW and W. The flow of air pollution from Germany is confirmed by data of magnetic susceptibility of soils along the Polish-German border. On the Southern part of the border, along the Sieniawa – Gubin line, magnetic susceptibility values range from 277–500·10-8 m3·kg-1 and along the Słubice – Woliński National Park line from 50–200·10-8 m3·kg-1 [9]. Higher Pb content over Zn in uppermost horizons of mountain soils is confirmed by Skiba for the Karko-nosze Mountains [5]. Study of peat bog localized in Izerska Mountain Pasture showed in 0–5 cm layer: Zn content from 17.6 mg·kg-1 to 58.6 mg·kg-1 and Pb content from 72.4 mg·kg-1 to 201 mg·kg-1 and confirming relation between these elements [7]. Zinc is one of the most mobile metals in soil, due to its exchangeable forms and relations (compounds) with organic matter. The highest content of this element as well as of cadmium was found in ABbr horizon of Profile No. 6 (Tab. 3). Research conducted on Izerska Mountain Pas-ture showed high fluctuations of Zn content in the period from 800 to 2000 A.D. Signifi-cant increase of Pb and Cd content after 1800 A.D. was related to industrial development period [7].
Cadmium is an element strongly dispersed in rocks (higher concentrations are in al-kali magma rocks and slates) and its average content is in the range of 0.03–0.22 mg·kg-1. In soils with pH range of 4.5–5.5, cadmium is very mobile whereas in higher pH values are immobilized. Natural content of this element in soil depends on its presence in the parent rock, but high anthropogenic influence causes its increase in soils. The highest content of Cd is in horizon ABbr (10–25 cm) profile No. 7 (Rendzic Leptosol Cambic). For the rest of soils, the highest content is noticed in surface organic horizons which sug-gest the anthropogenic origin of this element.
TECHNOGENIC AND GEOGENIC MAGNETIC SUSCEPTIBILITy OF MOUNTAIN FOREST ...

94
CONCLUSIONS
Magnetic properties of investigated soils reflect various influence of parent rock on the magnetic susceptibility values. In the examined profiles, the elements are of both litho-genic and anthropogenic origin. Sedimentary rocks, such as dolomite and “kwadrowe” sandstone (profile No. 4 and 6), have low concentration of magnetic minerals compared to metamorphic rocks such as amphibolite and phyllite shale (profile No. 1 and 2). Mag-netic susceptibility of the examined forest soils has geogenic character in profiles No. 1 and No. 2, where anomalies of MS distribution are observed. Distinguishing between technogenic and geogenic magnetic susceptibility is possible because of the content and spatial distribution of heavy metals in soil profiles. In organic horizons, especially sub-horizons Of and Oh, on the whole researched area, magnetic susceptibility had techno-genic character and heavy metals (especially lead) occurred in relatively high amounts. Content of lead in upper horizons is higher than zinc content, which is characteristic for soils in the Sudety Mountains – region which is under influence of the fly ashes deposi-tion. Ecological hazard for studied soils results from high Pb content and low pH reaction in organic horizons.
REFERENCES
[1] Brożek S., M. Zwydak: Atlas gleb leśnych Polski, CILP, Warszawa 2003.[2] Klasyfikacja gleb leśnych Polski, Praca zbiorowa, Polskie Towarzystwo Gleboznawcze, Warszawa
2000.[3] Liwińska A., J. Wawrzoniak: Air pollution in forests, Forest Research Institute, Warsaw (1989, 1990,
1993, 1994).[4] Pacyna J.M: Elektrownie węglowe jako źródło skażenia środowiska metalami i radionuklidami, Prace
Naukowe Instytutu Inżynierii Ochrony Środowiska Politechniki Wrocławskiej, Wrocław 1980.[5] Skiba S.: Ocena wpływu imisji przemysłowych na gleby Karkonoszy. Problemy ekologiczne wysokogór-
skiej części Karkonoszy, Oficyna Wydawnicza Instytutu Ekologii PAN, 97–111 (1995).[6] Strzyszcz Z., S. Brożek, M. Zwydak, T. Magiera: Magnetic susceptibility of some mountain forest soils
in relation to the industrial dust deposition, [in:] Problemy zagospodarowania ziem górskich, Komitet Zagospodarowania Ziem Górskich, PAN, zeszyt 52 (2005).
[7] Strzyszcz Z., L. Chróst: Określenie depozycji niektórych metali ciężkich na przykładzie torfowiska wysokiego na Hali Izerskiej, Problemy ekologiczne wysokogórskiej części Karkonoszy, projekt badaw-czy Karkonosze, Oficyna Wydawnicza Instytutu Ekologii PAN, 123–129, Dziekanów Leśny 1995.
[8] Strzyszcz Z., T. Magiera, Z. Bzowski: Magnetic susceptibility as an indicator of soils contamination in some regions of Poland, Soil Science Annual, XLIV, 85–93, Warszawa 1994.
[9] Strzyszcz Z., T. Magiera: Magnetic Susceptibility of Forest Soil in Poland – Germany Border Area, Mit-teilungen der Deutschen Bodenkundlichen Gesellschaft, 103, 67–120 (2004).
[10] Thompson R., F. Oldfield: Environmental magnetism, Allen and Unwin, London 1986.[11] Ulrich B., R. Mayer, P.K. Khanna: Deposition von Luftverunreinigungen und ihre Auswirkungen in Val-
dokösystemen des Sollings, Sauerländer Verlag 291, Frankfurt 1979.[12] World Reference Base for Soil Resources, FAO, ISSS, ISRIC, Rome 1998.[13] Zwoździak J., G. Kmieć, A. Zwoździak, K. Kacperczak: Presja zanieczyszczeń przemysłowych w os-
tatnim wieloleciu a stan obecny, Problemy ekologiczne wysokogórskiej części Karkonoszy, Oficyna Wydawnicza Instytutu Ekologii PAN, 79–96, Dziekanów Leśny 1995.
Received: October 2, 2008; accepted: February 27, 2009.
ADAM ŁUKASIK, ZYGMUNT STRZYSZCZ

95
TECHNOGENNA I GEOGENNA PODATNOŚĆ MAGNETYCZNA GóRSKICH GLEB LEŚNYCH NA PRZYKŁADZIE NADLEŚNICTWA KAMIENNA GóRA
Sudety są położone w pobliżu centrów przemysłowych Niemiec, Polski i Czech i są najbardziej zanieczysz-czonymi polskimi górami. Pośród takich zanieczyszczeń jak SO2 i NOx istotną rolę odgrywają emisje pyłów lotnych pochodzących z lokalnych i przygranicznych elektrowni. W oznaczaniu stopnia zanieczyszczeń gleb znajdują zastosowanie pomiary podatności magnetycznej. Zastosowanie tego rodzaju pomiarów jako wsparcie metod chemicznych jest możliwe dzięki wspólnym relacjom między cząstkami magnetycznymi i samymi zanie-czyszczeniami. Głównym źródłem zanieczyszczeń powietrza w rejonie Sudetów są popioły lotne pochodzące z procesu spalania paliw kopalnych. Praca przedstawia skład i rozmieszczenie w profilach glebowych metali ciężkich, w zależności od ich naturalnego bądź przemysłowego źródła pochodzenia oraz wyniki pomiarów podatności magnetycznej.
TECHNOGENIC AND GEOGENIC MAGNETIC SUSCEPTIBILITy OF MOUNTAIN FOREST ...

96

97
PL ISSN 0324-8461
© Copyright by Institute of Envionmental Engineering of the Polish Academy of Sciences, Zabrze, Poland 2009
ARCHIVES OF ENVIRONMENTAL PROTECTIONvol. 35 no. 2 pp. 97 - 104 2009
HEAVy METALS AND SELECTED PHySICOCHEMICAL PROPERTIES OF RENDZIC LEPTOSOLS OF THE PONIDZIE
REGION (SOUTHERN POLAND)
ANNA ŚWIERCZ
Jan Kochanowski University, Department of Management and Protection Environmentul. Świętokrzyska 15, 25-406 Kielce, Poland
e-mail: [email protected]
Keywords: Rendzic Leptosol, chemical properties, heavy metals, Nida Basin.
Abstract: The aim of the study was to characterize and compare physicochemical properties of Rendzic Lep-tosols formed in the Nida Basin. The highest heavy metal contents were observed in surface horizons. Average heavy metal contents were (mg⋅kg-1): Zn – 59.9, Cu – 24.9, Pb – 23.4, Cr – 15.4. These values are typical of Rendzic Leptosols and moderate to heavy soils. The soils under study were characterized by high pH values, large content of organic matter, CaCO3, high saturation of sorption complex with basic cations. The soils did not show greater differences in chemical properties.
INTRODUCTION
The vast, sloping south-westwards Nida Basin is a part of the Śląsko-Małopolska Upland and is characterized by an exceptional diversity of physicogeographical conditions. The formation of Limestone-Rendzic Leptosols was facilitated by transgression and regres-sion of Cretaceous seas leading to the sedimentation of several hundred-meter deep series of limestones, chalk rocks and marls [10, 13]. Recurrent short-term return of a shallow sea to the area of the present Nida Basin in Tertiary period left a series of lithotamnic limestones, marls, glauconite sands and gypsum in the changing sedimentation condition zone [3, 8]. Gypsum accumulation and weathering processes promoted the formation of Sulfate-Rendzic Leptosols [4, 11]. The gypsum series occurring in the Ponidzie Region are characterized by a marked regularity and cover a large compact area. They are built mainly of three types of gypsum: selenite, compressed coarse-crystalline gypsum and shaley gypsum [13, 18].
The goal of the present study was to characterize and compare physicochemical properties of Cretaceous, Tertiary and Sulfate-Rendzic Leptosols formed in this area.
MATERIAL AND METHODS
This study investigated in detail 5 profiles of Rendzic Leptosols occurring in the Nida Ba-sin. The profiles of Rendzic Leptosols (Fig. 1, Tab. 1) were sampled in 2004 in the follow-

98
ing mesoregions: the Wodzisław Hummock (profile no. 1 near the town of Tomaszów), the Solec Basin (profile no. 2, near the town of Łatanice), the Pińczów Hummock (profile no. 3 near the town of Zakamień), the Połaniec Basin (profile no. 4 near the town of Kije and profile no. 5 near the town of Śladków Mały).
Fig. 1. Localization of soil profiles on the background of physicogeographical units1 – no profile, 2 – forest area, 4 – grounds area 5 – physicogeographical units 6 – roat
Soil pits were dug to bedrock and 4–6 samples were collected from defined soil horizons for laboratory analyses. Air-dried samples were analyzed for particle-size dis-tribution in the skeletal and gravel sands fraction by sieve analysis, and in the dust and floating fraction by aerometric method of Casagrande modified by Prószyński, pH in H2O and in 1 M KCl was determined by a potentiometric method, CaCO3 content by Sheibler calcimeter method, organic carbon content in mineral horizons by Tiurin method and in organic horizons by Alten method, total nitrogen content after sample mineralization by Kjeldhal method using a Kjeltec Auto 1030 autoanalyzer, hydrolytic acidity by Kappen method in 0.5 M Ca(CH3COO)2 solution, sum of basic exchangeable cations S was as-sayed in 0.5 M NH4Cl, pH 8.2. Based on the sum of basic cations (S) and hydrolytic acid-ity (Hh), sorption capacity T and soil saturation with alkali V were calculated. Trophic index of forest soils ITGL was calculated based on weighed sum (Isuma) of the following
ANNA ŚWIERCZ

99
indices: dust fraction (Idust), floating fraction (Iczs), pH (IpH), basic exchangeable cations (Icat) calculated per a volume unit, stage of organic matter decomposition (IC:N) in relation to genetic mineral horizons of the soil under study, determined according to procedures proposed by Brożek [2]. Total contents of microelements and heavy metals in selected soil samples were determined by ICP-AES method using a Jobin-Yvon spectrometer, model JY 70 PLUS. Samples were dissolved in aqua regia solution: HCl-HNO3, after prior incineration of organic substance at 480°C. 4 samples of the water collected in the vicinity of the profile 2 and 3 (Łatanice and Zakamień) were analyzed of the content for ions SO4
2- and S2- using photometer IF 205 SLANDI.
STUDY AREA
The Solec Basin is a spacious depression filled with Miocene sea deposits (mostly litho-tamnic limestones and Thorton gypsums) formed on Cretaceous marls. The Solec Ba-sin formations are complex and the basin is characterized by large fluctuations of rela-tive altitude (to 50 m). Interesting gypsum series in the western part of the basin form a structural escarpment 35 m deep. Floor parts are formed by coarse-crystalline gypsums, middle part by coarse-crystalline transforming into cryptocrystalline gypsum with blade cleavage while approaching the surface [18]. Karst processes and phenomena developing in gypsums (sinks, ravines, and small caves) are an example of the most beautiful gypsum karst in Poland.
The Połaniec Basin is a flat-bottomed tectonic subsidence. The basin is filled by Mio- cene gypsums (interesting karst phenomena), silt and sands partially covered with Qua-ternary Sarmatian sediments encountered near the villages of Borkowo and Chrabkowo.
Table 1. Profile structure and general characteristic of soils
Profile No Profile structure Type and subtype Kind Species Trophic index
Profile 1Tomaszów Ol-Ah-CcaA-Cca Rendzic
LeptosolCretaceous limestones
Normal dust on medium skeletal
clay
ITGL 38.2Hypertrophic
Profile 2Łatanice Ah-CcsA-Ccs Gypsiri-Rendzic
Leptosol GypsumMedium clay on heavy skeletal
clay
ITGL 40.5Hypertrophic
Profile 3Zakamień Ol-Ah-ACcs-Ccs Gypsiri-Rendzic
Leptosol Gypsum
Medium clay developed on dusty-skeletal
formation
ITGL 40.2Hypertrophic
Profile 4Kije Ah-CcaA-Cca Rendzic
LeptosolCretaceous limestones
Medium clay developed on
clayey-skeletal formation
ITGL 36.1Eutrophic
Profile 5Śladków Mały
Ol-Ah-CcaA-Cca Rendzic Leptosol
Tertiary limestones
Strong clayey sand
on dusty-skeletal formation
ITGL 37.1Eutrophic
HEAVy METALS AND SELECTED PHySICOCHEMICAL PROPERTIES OF RENDZIC ...

100
The Pińczów Hummock (Wójczańsko-Pińczowski) is a horst uplifted in Tertiary Period rising to an altitude of 293 m a.s.l. The hummock prominently dominates over the Nida Valley. It is covered by lithotamnic limestones (“Pińczów stone” – produced in Pinczów), marls and upper Cretaceous gaize, the same as in the adjacent basins, while the substratum contains marl and upper Cretaceous gaize. A middle part of the Pinczów Hummock is visibly lowered, and large areas are covered by glacial sands and moraine clays forming an accumulation plain.
The Wodzisław Hummock is a flat anticline of Cretaceous chalk rocks in the eastern part covered by loess. Loess covers the surface of the hummock but does not form a con-tinuous cover. The loessial terrains are diverse owning to features of older substratum and Pleistocene and Holocene erosion processes.
RESULTS AND DISCUSSION
Soils occurring in the Nida Basin closely reflect litho logy of the parent rock, with prevail-ing lithogenic Limestone-Rendzic Leptosols, autogenic Cambisols, Chernozems, Haplic Podzols, and Fluvisols [11, 16].
The Rendzic Leptosols under study differed in the underlying parent rock and land use on its surface (arable land: profile 2 and 4, and land used for forest crops: profiles 1, 3, 5). They belonged to Cretaceous-Rendzic Leptosols (profile 1, 4), Tertiary-Rendzic Leptosols (profile 5) and Gypsiri-Rendzic Leptosols (profile 3 and 2), characteristic of this terrain [4, 6] (Tab. 1). Depth of these soils ranged from 35 to 68 cm. Mineral horizon Cca or Cce was usually strongly skeletal and contained weathered rock debris (12–76% of fraction > 1 mm), often transforming in the lower part into a massive rock (Tab. 2). Depth of humic horizon was much greater in Sulfate-Rendzic Leptosols and ranged be-tween 30 and 50 cm. Granulometric composition of the fine fractions of soils under study comprised normal dust, medium clay, heavy clay and sporadically strong clayey sand (profile 5). They contained 20–68% of sand fraction, 13–44% of dust and 19–58% of floating particles.
The pH values of soils were in the range of 6.0–8.5. Horizons located directly above the parent rock had a slightly basic pH due to its influence (Tab. 3). The pH value de-creased towards the surface, what can be attributed to the formation of organic acids able to chelate basic ions and to migrate towards the bottom of the profile. The pH value of organic horizon (pH in KCl) ranged from 6.2 to 7.4 and depended, among other things, on plant communities overgrowing the surface.
The soils contained different amounts of calcium carbonate which is another fac-tor, apart from grain size distribution and parent rock, distinguishing the soils. Calcium carbonate content in surface horizons ranged between 1.6 to 13.8% and increased down-wards in the profile to 67.2%.
The chemical analysis of waters collected in the nearness of profiles Gypsiri Rendzic Leptosols (the profile No. 2 and 3), a kind of fertile soil, showed the content of S2- crossing 0.05 mg⋅dm-3. The content of ions SO4
2- was very high and fluctuated from 390 mg⋅dm-3 (Łatanice) to 420 mg dm-3 (Zakamień), considerably exceeding the average content for natural waters which is situated within the range 10–80 mg dm-3 [7].
Waters about the high content of ions SO42- are characterized by low pH values.
However, pH analyzed samples of the water showed the insensible reaction with values in the section 7.40–7.92.
ANNA ŚWIERCZ

101
It’s the result of the dissolution reaction of the gypsum and the reduction of the solv-able sulphate under of the organic matter:
CaSO4·2H2O → Ca2- +SO42- +2H2O and
SO42- + 2Corg. + 2H2O → H2S +2HCO3
-.These soils contained marked amounts of organic matter almost independently of
the type of land use. The highest contents of organic carbon were observed in mollic horizon of Gypsiri-Rendzic Leptosols (3.96–5.32%), and the lowest in Ah horizon of Tre-tiary-Rendzic Leptosols (profile 5). The content of organic carbon in all profiles quickly decreased with depth.
The Rendzic Leptosols under study contained humus of calcimorphic type (kalci-mull). C:N ratio in mineral horizons ranged from 3.3 to 13 and decreased with depth. Nitrogen content NTOT was the highest in humic horizon of Rendzic Leptosols used for growing forest crops and fluctuated between 0.95–1.10. Hydrolytic acidity was low and amounted to from 6.5 cmol(+)⋅kg-1 in O horizon to 0.1 cmol(+)⋅kg-1 in Cca horizon. Sorp-tion capacity was high, the sum of exchangeable cations was in the range of 23.9–104.8 cmol(+)⋅kg-1. Sorption complex was saturated mainly by Ca2+. These values are slightly higher than those reported by Ciarkowska [4, 5] for Gypsum Brown and Red-Rendzic Leptosols [15]. The highest values were characteristic of Gypsiri-Rendzic Leptosols in profile 3. Saturation of sorption complex of these soils was very high exceeding 87.1% (to 99.8%). Based on the features of soils expressed by trophic index ITGL, it can be inferred that these soils are hypertrophic and eutrophic (ITGL > 36.1, Tab. 1). Current richness of this habitat suggests a highland forest Lwyż-N with a potential vegetation represented by subcontinental dry-ground forest Tilio-Carpinetum (Tracz. 1962).
The highest contents of heavy metals in soils were observed in the surface horizons, which is in line with literature data [1, 5, 11, 15, 17]. Total contents of zinc in the study
Table 2. Granulometric composition of investigated soils
ProfileNo
Horizons Depth[cm]
% fraction with diameter [mm]> 1.0 1.0–0.1 0.1–0.05 0.05–
0.020.02–0.005
0.005–0.002
< 0.002
1 Ah 1–15 3.0 21.0 17.0 28.0 10.0 7.0 17.0CcaA 15–29 12.0 23.0 20.0 17.0 12.0 7.0 21.0Cca 29–55 38.0 25.0 21.0 13.0 13.0 8.0 20.0
2 Ah 0–31 2.0 41.0 4.0 3.0 10.0 9.0 33.0ACcs 31–49 5.0 32.0 6.0 5.0 7.0 12.0 38.0Ccs 49–52 12.0 31.0 8.0 7.0 9.0 13.0 32.0
3 Ah 2–49 3.0 32.0 5.0 15.0 10.0 12.0 26.0ACcs 49–60 22.0 20.0 10.0 14.0 46.0 5.0 5.0Ccs 60–68 76.0 38.0 8.0 36.0 9.0 5.0 4.0
4 Ah 0–20 25.0 39.0 6.0 13.0 14.0 15.0 13.0CcaA 20–30 31.0 30.0 15.0 12.0 9.0 10.0 24.0Cca 30–35 70.0 34.0 11.0 9.0 12.0 11.0 23
5 Ah 1–19 23.0 59.0 8.0 11.0 3.0 7.0 12.0CcaA 19–41 32.0 61.0 7.0 9.0 7.0 3.0 13.0Cca 41–50 57.0 68.0 5.0 8.0 4.0 9.0 6.0
HEAVy METALS AND SELECTED PHySICOCHEMICAL PROPERTIES OF RENDZIC ...

102
Tabl
e 3.
Som
e ch
emic
al p
rope
rties
of t
he in
vest
igat
ed so
ils
Profi
leN
oH
oriz
ons
Dep
th[c
m]
pH H2O
pH KC
lC
aCO
3C
TOT
NTO
TC
:NH
hS
TV
ZnC
uPb
Cr
[%]
[cm
ol(+
)⋅kg-1
][%
][m
g⋅kg
-1]
1O
l0–
16.
86.
72.
339
.91.
2731
.42
1.9
55.2
57.1
096
.67
119.
920
.132
.120
.1A
h1–
157.
16.
913
.13.
770.
2913
.00
1.1
56.1
57.2
098
.08
90.2
15.8
26.2
18.9
Cca
A15
–29
7.6
7.2
33.2
0.71
0.08
8.88
0.6
42.5
43.1
098
.61
37.4
10.9
5.1
11.9
Cca
29–5
57.
87.
544
.20.
246
.847
.00
99.5
722
.89.
74.
98.
62
Ah
0–31
6.1
6.0
2.2
3.96
0.95
4.17
4.9
32.9
37.8
087
.04
89.1
17.3
50.2
19.6
AC
cs31
–49
6.4
6.3
3.1
1.02
0.21
4.86
3.9
52.2
56.1
093
.05
36.2
12.6
8.6
10.5
Ccs
49–5
26.
46.
32.
90.
787
.187
.80
99.2
019
.68.
96.
89.
23
Ol
0–2
6.6
6.3
3.2
42.7
1.31
32.6
06.
451
.357
.70
88.9
113
4.9
89.9
55.6
30.7
Ah
2–49
7.0
6.5
7.1
5.32
1.01
5.27
4.3
41.9
46.2
090
.69
109.
580
.949
.125
.8A
Ccs
49–6
07.
57.
211
.81.
120.
323.
500.
610
4.8
105.
4099
.43
88.9
60.4
26.4
20.1
Ccs
60–6
87.
77.
35.
2
0.2
123.
612
3.80
99.8
430
.220
.110
.37.
24
Ah
0–20
7.1
7.0
13.8
4.20
1.19
3.53
1.1
43.9
45.0
097
.56
49.4
15.9
20.1
10.1
Cca
A20
–30
7.3
7.1
25.8
0.76
0.09
8.44
0.5
47.9
48.4
098
.97
28.8
11.8
4.9
6.8
Cca
30–3
57.
57.
133
.10.
147
.147
.20
99.7
922
.110
.15.
26.
95
Ol
0–1
7.1
6.8
1.6
40.2
0.89
45.1
73.
145
.548
.60
93.6
291
.126
.849
.326
.2A
h1–
197.
86.
912
.91.
550.
236.
741.
841
.343
.10
95.8
271
.221
.745
.221
.4C
caA
19–4
18.
27.
241
.80.
880.
0811
.00
0.5
35.9
36.4
098
.63
67.1
17.5
21.8
14.8
Cca
41–5
08.
58.
167
.20.
223
.924
.10
99.1
710
.25.
94.
85.
7
ANNA ŚWIERCZ

103
soils ranged from 10.2 to 134.8 mg⋅kg-1 (mean 59.9), of copper from 5.9 to 89.9 mg⋅kg-1 (mean 24.9), lead from 4.8 do 55.6 mg⋅kg-1 (mean 23.4), chromium from 5.7 to 30.7 mg⋅kg-1 (mean 15.4). These values are typical of Rendzic Leptosls and for heavy and medium-heavy soils [2, 4, 12, 17] Heavy metal contents in Rendzic Leptosols under study did not exceed permissible levels [9, 12]. Slight enrichment in copper (60–81 mg⋅kg-1) was observed only in the mineral horizon of Gypsiri-Rendzic Leptosols, thus, this soil can be included into class I, i.e. soils with elevated Cu content for medium-heavy soils (where permissible content is 100 mg⋅kg-1).
Information about the heavy metal content in the soils of Pińczów district [14] in-dicates that the concentration of these elements in the soils is relatively small. Values in soils to 10 cm are shaped as follows: Zn (14.8–178.8, mean 64.1 mg⋅kg-1), Cu (1.8–23, mean 10.1 mg⋅kg-1), Pb (5.1–93.3, mean 17.2 mg⋅kg-1), Cr (0.13–1.5, mean 0.47 mg⋅kg-1). The slight enrichment of superficial soil levels in heavy metals has an industrial charac-ter (The Pińczów Building Stone Works Joint Stock Company, Gypsum Industrial Plant “Dolina Nidy” S.A.) [11, 14].
CONCLUSIONS
1. The soils under study belong to the following subtypes: Cretaceous-Rendzic Lep-tosols, Tertiary-Rendzic Leptosols and Gypsiri-Rendzic Leptosols. They are skeletal soils of medium depth.
2. The soils are distinguished by high pH values, marked content of organic matter and CaCO3, and high saturation of sorption complex with basic cations. They do not show much diversity in terms of the studied chemical properties.
3. Average contents of heavy metals in the Rendzic Leptosols were estimated (at mg⋅kg1): Zn – 59.9, Cu – 24.9, Pb – 23.4, Cr – 15.4). These values are reported to characterize unpolluted soils.
REFERENCES
[1] Angelone M., C. Bini: Trace Element Concentrations in Soils and Plants of Western Europe, [in:] D.C. Adriano (ed.), Biogeochemistry of Trace Metals, Lewis Publishers, London, Tokyo 1992, pp. 19–61.
[2] Brożek S., M. Zwydak: Atlas gleb leśnych Polski, Centrum Informacyjne Lasów Państwowych, Warszawa 2002.
[3] Cabaj W., W.A. Nowak: Rzeźba Niecki Nidziańskiej, Studia Ośrodka Dokumentacji Fizjograficznej, 14, 119–209 (1986).
[4] Ciarkowska K.: Charakterystyka gipsowych rędzin brunatnych, Rocz. Glebozn., 51, 100–111 (2000).[5] Czarnowska K.: Ogólna zawartość metali ciężkich w skałach macierzystych jako tło geochemiczne gleb,
Rocz. Glebozn., Suplement, 47, 43–50 (1996).[6] Dobrzański B., K. Konecka-Betley, F. Kuźnicki, R. Turski: Rędziny Polski, Rocz. Nauk Roln., Monografie
208, Seria D, 1987.[7] Dojlido J. (red.): Fizyczno-chemicze badanie wody i ścieków, Wydawnictwo Arkady, Warszawa 1999.[8] Flis J.: Szkic fizyczno-geograficzny Niecki Nidziańskiej, Czasop. Geogr., 27, 2, 123–159 (1956).[9] Kabata-Pendias A., T. Motowicka-Terelak, H. Piotrowska, T. Witek: Ocena stopnia zanieczyszczenia gleb i roślin
metalami ciężkimi i siarką, Ramowe wytyczne dla rolnictwa, Instytut Uprawy i Nawożenia, Puławy 1993.[10] Kostrowicki A., J. Solon (red.): Studium geobotaniczno-krajobrazowe okolic Pińczowa, Dokumentacja
Geograficzna, PAN IGiPZ, z. 1-2, 1994.[11] Lenartowicz L.: Zawartość pierwiastków śladowych w rędzinach czarnoziemnych rozwiniętych na wy-
chodniach gipsów w okolicach Pińczowa, Buska Zdroju, Wiślicy i Działoszyc, Pos. Nauk Państ. Inst. Geolog., nr 53, (1997).
HEAVy METALS AND SELECTED PHySICOCHEMICAL PROPERTIES OF RENDZIC ...

104
[12] Rozporządzenie Ministra Środowiska w sprawie standardów jakości gleby oraz standardów jakości ziem (Dz. U. nr 165, poz. 1359, 2002).
[13] Rutkowski J.: Budowa geologiczna Niecki Nidziańskiej, Studia Ośrodka Dokumentacji Fizjograficznej, 14, 35–62, (1986).
[14] Stan środowiska w województwie świętokrzyskim w roku 2006, Raport Biblioteki Monitoringu Środowiska, Kielce 2007.
[15] Świercz A.: Przyczynek do charakterystyki rędzin i zespołu Tilio-Carpinetum Tracz. 1962 na terenie Stacji Geoekologicznej Monitoringu Zintegrowanego Góra Malik, Zintegrowany Monitoring Środowiska Przyrodniczego, PIOŚ, Warszawa. 47–56, (1995).
[16] Tsermegas I., P. Szwarczewski, B. Woronko, K. Recielski, E. Rojan: Ewolucja i dynamika rzeźby okolic Pińczowa, Prace i Studia Geogr., 27, 11–41 (2000).
[17] Uziak S., J. Melke, Z. Klimowicz: Content and distribution of heavy metals in soils of East Poland, Polish J. Soil Sci., 34 (2), 3–18 (2001).
[18] Wicik B.: Krajobrazy Gipsowe Ponidzia Pińczowskiego, Prace i Studia Geogr., 27, 91–98, (2000).
Received: August 25, 2008; accepted: February 2, 2009.
METALE CIężKIE ORAZ WYBRANE WŁAŚCIWOŚCI FIZYCZNE I CHEMICZNE RęDZIN PONIDZIA (POŁUDNIOWA POLSKA)
Celem prezentowanej pracy jest charakterystyka i porównanie właściwości chemicznych oraz zawartości metali ciężkich w rędzinach kredowych, trzeciorzędowych, siarczanowych wykształconych w obrębie Niecki Nidziań-skiej. Najwyższe zawartości metali ciężkich stwierdzono w poziomach powierzchniowych. Przeciętna zawar-tość metali ciężkich wynosi (w mg⋅kg-1): Zn – 59,9; Cu – 24,9; Pb – 23,4; Cr 15,4) i są to wartości typowe dla rędzin i gleb średnio ciężkich i ciężkich. Badane gleby odznaczają się wysokimi wartościami pH, znaczną za-wartością materii organicznej, CaCO3, wysokim wysyceniem kompleksu sorpcyjnego kationami o charakterze zasadowym i nie wykazują większego zróżnicowania w obrębie badanych właściwości chemicznych.
ANNA ŚWIERCZ

105
THE INFLUENCE OF THE METHOD OF RECLAMATION AND SELECTION OF TREE SPECIES FOR AFFORESTATION
ON CHANGES IN LANDSCAPE DEGRADED By FIRE
ELżBIETA JOLANTA BIELIńSKA1*, AGNIESZKA MOCEK-PŁóCINIAK2
1 University of Life Sciences, Institute of Soil Science and Environmental Developmentul. Leszczyńskiego 7, 20-069 Lublin, Poland
2 University of Life Sciences, Department of Agricultural Microbiologyul. Szydłowska 50, 60-656 Poznań, Poland
* Corresponding author e-mail: [email protected]
Keywords: Landscape, fire-site, forest soils, enzymatic activity, reclamation.
Abstract: The paper analyses the influence of the method of reclamation on changes in the landscape degraded by fire. The analyses involved experimental areas (I, II, III) in which various ways of preparing the soil were used (soil excluded from mechanical cultivation; full mechanical cultivation; ploughing furrows) in cultiva-tions of the Scots pine (Pinus sylvestris L.) and the Grey alder (Alnus incana (L.) MOENCH). The analyses also included a natural succession (NS) area and a control area (L) marked out in a natural forest complex di-rectly bordering the burned area. The analyses showed that after 12 years of recultivation, the burned landscape was regaining the state of structural and functional biological balance. Cultivation of grey alder substantially stimulated the enzymatic activity of the analyzed soil, thus showing its beneficial influence on the landscape potential and justifying the use of this species as a preceding crop when rehabilitating the burned area. Various ways of preparing the soil had no substantial influence on noticeable, long-term changes in the functioning of the analyzed landscape.
INTRODUCTION
Disturbances in the functioning of landscape resulting from complete forest fires are rapid and frequently irrevocable [9]. One of the main landscape elements which undergoes degradation is the soil [7, 8]. Positive restoration effects of after-fire landscapes can be achieved by soil revitalization and by the application of plantings with species suitable for specific site [12, 15].
The basis of the functioning of the landscape is the continuity of matter circulation and energy flow between individual elements of the landscape [6]. Soil microorganisms belong to the most active landscape components which determine its quality and the activity of enzymes secreted into the soil environment provides a good indicator of their metabolic potentials. Enzymatic processes reflect disturbances in the matter circulation and energy flow by landscape elements caused by environmental stress factors [5].
The objective of the performed experiments was to assess the influence of the method of restoration and tree species selection for afforestation on the transformations of the
PL ISSN 0324-8461
© Copyright by Institute of Envionmental Engineering of the Polish Academy of Sciences, Zabrze, Poland 2009
ARCHIVES OF ENVIRONMENTAL PROTECTIONvol. 35 no. 2 pp. 105 - 113 2009

106
landscape degraded by a forest fire on the basis of selected soil parameters determining processes of energy flow and matter circulation in a landscape system.
OBJECT AND METHODOLOGY
The performed investigations were carried out on a fire site situated in the north-cen-tral part of the Noteć Primeval Forest, in the region of the Potrzebowice Forest District (52°53’N, 16°10’E) on podzolic soils (Podzols) under different types of reclamation pro-grams. The reclamation operations were performed by the Department of Soil Sivicul-ture of the Poznań Agricultural University [4]. The experimental surface of 7.5 ha was established in 1994, two years after a Scots pine stand approximately 60 years of age was completely burned down. The dimensions of plots, henceforth referred to as ‘experimen-tal plots’, were as follows: 25 x 20 m (50 m2). The investigations comprised the surface of natural succession (NS) as well as surfaces on which three extremely different methods of soil preparation (I, II and III) were employed in plantations with Scots pine – Pinus sylvestris L. (S) and Grey alder – Alnus incana (L.) MOENCH – (O). The plantings were carried out using two-year old seedlings [4]. The soil on the experimental plot I was excluded from mechanical cultivation and its preparation was limited to digging a hole with a spade in which the seedling was placed. This method enabled leaving the organic-mineral horizon intact. In the case of the experimental plot II, full mechanical tillage was performed carrying out shallow ploughing to the depth of 30 cm using a disk plough. Consequently, the residues of the soil organic horizon were removed completely and they were uniformly mixed with the mineral layer. On the experimental plot III, furrows were ploughed every 1.5 m with of a forest LPZ-75 plough equipped with 2 mouldboards and their bottoms were additionally loosened to the depth of 40 cm using a subsoiler. Seed-lings were planted in the belts prepared in the above-described way. The organic horizon was completely removed from the area of furrows and, following the turning over of the ploughed furrow-slice, it was left between rows earthed up with part of the mineral soil. The succession plot (NS) and control area (L) were established on an un-cleaned clear-cut area situated at the distance of approximately 70 m from the forest fragment which sur-vived the forest fire. The residues which were left after clear cutting were neither removed nor cut. No artificial regeneration was carried out on this plot so that all plants growing there were the result of spontaneous plant succession in the region of the forest fire.
The investigations on selected plots were conducted in 2004–2006. The presented paper discusses research results obtained following 12 years of reclamation operations on the forest fire site.
In June 2006, soil samples were collected from the depth of 0–10 cm and 10–20 cm from five points on each of the selected experimental plots and selected physical, chemi-cal and biochemical properties were determined in each of them in five replications. Iden-tical soil samples were collected from the natural forest complex unaffected by the forest fire situated in direct neighborhood of the forest fire site and which acted as the control plot (L). The following parameters were determined in soil samples with disturbed and intact structure: texture composition using Bouyoucos method in Prószyński’s modifica-tion, specific density by pycnometric method [17], bulk density using Nitzsch’s vessels of 100 cm3 volume, soil porosity calculated on the basis of density assays, soil moisture content by drier-gravimetric method, pH in 1 mol⋅dm-3 KCl, organic carbon and total ni-
ELżBIETA JOLANTA BIELIńSKA, AGNIESZKA MOCEK-PŁóCINIAK

107
trogen using Vario Max analyzer as well as ammonium nitrogen and nitrate nitrogen [ISO 14255]. The biochemical analyses comprised the following determinations: the activity of dehydrogenases with a TTC (triphenyl tetrasolium chloride) substrate [20], acid phos-phatase (Pac) and alkaline phosphatase (Pal) [19], urease [21] and protease [11]. The ac-tivity of dehydrogenases was given in cm3 H2 necessary to reduce TTC to TFP (triphenyl phormosan); of phosphatases – in mmols of p-nitrophenol (PNP) produced from sodium 4-nitrophenylphosphate; urease – in mg N-NH4
+ formed from hydrolyzed urea; protease – in mg tyrosine developed from sodium caseinate.
Statistical analysis was carried out using the Statistica 6.0 PL program.
RESULTS AND DISCUSSION
Different methods of soil preparation, after 12 years of their application on the forest fire site, failed to exhibit an unambiguous effect on the analyzed soil physical properties (Tab. 1). Soils on the examined experimental plots showed almost identical texture (the content of clay fraction ranged from 1–3%) and specific density (2.64–2.65 Mg⋅m-3). Soil moisture content on the majority of the plots ranged from 0.03–0.04 m3⋅m-3 to 0.05 m3⋅m-3 on O II, O III and NS experimental surfaces.
Table 1. Basic physical properties of investigated soils
Plots /* Depth[cm]
Moisture[m3⋅m-3]
Specific density[Mg⋅m-3]
Bulk density[Mg⋅m-3]
Porosity[m3⋅m-3]
S I 0–10 0.0392 2.64 1.42 0.4610–20 0.0376 2.65 1.47 0.44
S II 0–10 0.0331 2.65 1.35 0.4910–20 0.0434 2.65 1.45 0.45
S III 0–10 0.0406 2.65 1.14 0.5710–20 0.0411 2.65 1.41 0.46
O I 0–10 0.0395 2.65 1.28 0.5110–20 0.0354 2.65 1.47 0.44
O II 0–10 0.0359 2.65 1.31 0.5010–20 0.0522 2.65 1.37 0.48
O III 0–10 0.0439 2.65 1.32 0.5010–20 0.0572 2.65 1.47 0.44
NS 0–10 0.0510 2.64 1.35 0.4910–20 0.0575 2.65 1.47 0.44
L 0–10 0.0391 2.64 1.36 0.4810–20 0.0311 2.65 1.48 0.44
/*S – Pinus silvestris, O – Alnus incana,NS – natural succession, L – control area
Distinct differences were observed only in porosity and, closely connected with it, soil bulk density. In the soil top layer (0–10 cm), porosity and bulk density values ranged from 0.46 m3⋅m-3 and 1.42 Mg⋅m-3 (S I) to 0.57 m3⋅m-3 and 1.14 Mg⋅m-3 (S III), respec-tively. In the subsurface layer (10–20 cm), the values of the parameters were lower and comparable. Plot O II (grey alder plantings) constituted an exception where, following
THE INFLUENCE OF THE METHOD OF RECLAMATION AND ...

108
complete mechanical tillage, residues from the organic layer were totally mixed thor-oughly with the mineral layer, causing significant homogenization of the 0–20 cm layer and, consequently, leading to high porosity (0.48 m3⋅m-3), at 1.37 Mg⋅m-3 density. Such an effect failed to occur on plot S II (Scots pine plantings), though.
The obtained results indicate that a tree species used for plantings was a factor modi-fying porosity and bulk density. It could have been associated with the individual impact of a tree species on the composition of a microbiological complex settling tree roots and decomposing the plant material. A tree species significantly influences soil soluble C concentration and, as a result, affects soil porosity and bulk density [8, 14]. In alder plant-ings (O I – O III), the values of soil porosity in the 0–10 cm layer were higher (0.50–0.51 m3⋅m-3) than in pine plantings (S I and S II) (0.46–0.49 m3⋅m-3). In comparison to leaf fall, needle fall contains less N and more lignin. The coniferous substrate, rich in waxes, resins and lignin, is more resistant to decomposition due to its high initial lignocellulosic index which plays a decisive role in the rate of its microbiological transformation [10]. As to the 0–10 cm layer, the porosity bearing the closest similarity to that of an intact forest habitat (0.46 m3⋅m-3), was found in the soils of plot S II and the NS (natural succession) plot, which were totally different with regard to the extent of interference in the soil cover.
A surprisingly low bulk density (1.14 Mg⋅m-3) and the highest porosity were ob-served in the soil from plot S III (Tab. 1). As regards the pine crops, the soil from plot S III had the highest organic carbon content. However, it was noticeably lower than in the soil in the forest habitat not disturbed by fire (L) (Tab. 2). A positive impact of the reclama-tion system on transformations in the landscape destroyed by fire can be observed, among others, in soil humus formation. The method of soil preparation is a factor influencing soil biological activity contributing to the improvement and stability of soil colloidal-mineral complex, which, in turn, guarantees a long-term effect of favorable changes in the soil physical condition. Malicki [13] points out that mechanical interference in a soil environ-ment exerts only a slight influence on the development of soil physical properties. This claim is corroborated by numerous reports found in the literature on the subject. Among others, Biskupski and Sienkiewicz [3] showed that methods of soil preparation for sowing highly diverse as to their intensity changed soil density and moisture content only to a limited extent. On the other hand, experiments carried out by Olejarski [15] revealed that the method of soil preparation on fire sites had a significant impact on the development of the physical state, in particular, on the water properties. However, it should be empha-sized that Olejarski [15] also presented results of other investigations which showed that, in certain conditions, the method of soil preparation fails to cause tangible, long-term changes in soil physical conditions.
Soils on the fire site were characterized by lower acidity than the soil on the forest site unaffected by the fire (experimental plot L). The above mentioned differences ranged from 0.20 to 0.70 pH unit in 1 mol⋅dm-3 KCl (Tab. 2). On all the examined plots, pHKCl values were lower in the top soil layer (0–10 cm) than in the layer extending from 10 to 20 cm. Differently decomposed forest litter, usually occurring in the form of surface or-ganic layer, favors acidification because it contains non-neutralized humus substances as well as soluble fractions of humic acids. Moreover, nitrification, which is the outcome of enhanced mineralization, is one of the factors which increase the acid load in the surface layers of forest soils. The applied methods of reclamation of the forest fire site failed to exert any practical influence on changes in the reaction of those soils (Tab. 2).
ELżBIETA JOLANTA BIELIńSKA, AGNIESZKA MOCEK-PŁóCINIAK

109
Following 12 years of reclamation, the content of organic carbon and total nitrogen in soils of the plots affected by the fire was statistically significantly lower by about 20–60% in comparison with the soil from the control plot (Tab. 2). Our earlier investigations [14] carried out after 10 years of reclamation showed that levels of the above-mentioned constituents in soils damaged by the fire were by 50–80% lower than in the unaffected soil in the site directly neighboring with the fire site. The observed increases in levels of organic carbon and total nitrogen in consecutive years of the experiments confirm grow-ing self-regulating capabilities of the landscape damaged by the fire and show that the applied methods of reclamation were effective. The new active humus found in the sterile soils acts as a stimulator of the continuity of processes of matter circulation and energy flow which take place between individual elements of the landscape [2, 6].
In the case of soils situated in the area affected by the fire on plots with the Scots pine plantings, the Corg. and total N resources were significantly lower than in the cultiva-tions with Grey alder and on the NS plot (natural succession). Statistically confirmed dif-ferences were observed primarily in the top soil layer (Tab. 2). Different methods of soil preparation after 12 years of their application on the fire site failed to show an unequivo-cal impact on organic carbon and total nitrogen contents in soils. In Scots pine plantings, the highest quantities of Corg. and total N were recorded in the soil from the experimental plot III on which furrows were ploughed up, while in the alder plantings – in the soil from plot I (the soil where no mechanical tillage was used).
The quantities of organic carbon and total nitrogen determined in the top layer of the examined soils were several times higher than those found in the 10–20 cm layer (Tab. 2).
The values of the C:N ratio observed in the soils from the plots S III, O II and NS were significantly higher in the 0–10 cm layer than in the 10–20 cm layer. The differences
Table 2. pH, content of organic carbon and nitrogen (total N, N-NH4+, N-NO3
-) in soils
Plots Depth pH C N C:N N-NH4+ N-NO3
-
[cm] KCl [g⋅kg-1] [mg⋅kg-1]S I 0–10 3.92 12.54c 0.58b 21.6c 30.27b 6.56b
10–20 4.46 4.67a 0.23a 20.3c 23.94a 4.35aS II 0–10 3.88 11.70c 0.55b 21.2c 32.83b 5.78b
10–20 4.44 5.16a 0.25a 20.6c 24.05a 3.49aS III 0–10 3.82 21.42e 0.90c 23.8d 30.28b 5.12b
10–20 4.45 6.67b 0.31a 21.5c 23.78a 3.25aO I 0–10 3.63 23.11f 1.12c 20.6c 47.09c 19.73c
10–20 4.38 5.87a 0.31a 18.9c 32.86b 8.96bO II 0–10 3.59 14.29d 1.08c 13.2b 48.72c 20.19c
10–20 4.41 3.98a 0.40a 9.9a 35.54b 8.89bO III 0–10 3.73 14.86d 0.82c 19.3c 47.85c 18.92c
10–20 4.47 5.17a 0.28a 18.4c 32.46b 11.08bNS 0–10 3.76 19.72e 0.68b 29.0e 35.20b 9.15b
10–20 4.65 6.31 b 0.28a 22.5d 24.18a 5.45aL 0–10 3.22 28.83g 1.48d 19.4c 52.35c 20.49c
10–20 4.03 9.96c 0.54b 18.4 c 36.09b 8.79bvalues in the column followed by the same letter are not significant at p < 0.05, “t” – test
THE INFLUENCE OF THE METHOD OF RECLAMATION AND ...

110
noted on the other plots (S I, S II, O I and O III) were statistically non-significant (Tab. 2). The highest values of the C:N ratio were registered in the soil of the NS plot: 29.0 in the 0–10 cm layer and 22.5 in the 10–20 cm layer while the lowest ones were found in the soil from plot O II: 13.2 in the 0–10 cm layer and 9.9 in the 10–20 cm layer. On the other plots, the values of this parameter reached the same level as those in the soil of the control plot (L) (Tab. 2). Greater fluctuations in the metabolic rate were observed in the alder plantings (C:N ranging from 9.9 to 20.6) than in the pine crops (C:N from 20.3 to 23.8).
The contents of N-NH4+ and N-NO3
- in soils on plots where Grey alder was culti-vated were similar to those determined in the control soil (experimental plot L), whereas in soils from the plots with Scots pine planting as well as on the NS (natural succession) plot, they were significantly lower, by approximately 30–40%, than in the control soil (Tab. 2). In alder cultivating, the symbiosis between the tree roots and nitrogen-fixing Actinomycetales contributes to soil enrichment with the available forms of this element and enables nitrogen uptake by a plant.
The above mentioned results indicate that alder plantings exerted a positive impact on the resource-functional (material, storage, transport) potentials of the landscape after the fire which increase the system capability for biotic productivity and realization of abiotic processes [1, 18]. On the other hand, in Scots pine cultivations as well as on the NS plot, the soil still remains an accumulative ecosystem which immobilizes nitrogen, hence in the process of biomass production it will continue to exhibit increased demand for nitrogen. It should further be emphasized that the investigations carried out two years earlier, after 10 years of reclamation operations of the degraded landscape [14], revealed that within the forest fire site, irrespective of the employed regeneration species, quanti-ties of mineral nitrogen (N-NH4
+ and N-NO3-) in soils were by about 70–80% smaller
than in the soil of the forest environment unaffected by the fire. In addition, it is worth stressing that the content of these constituents on plots with Grey alder plantings was significantly higher in comparison with Scots pine stands. The above data prove that the destroyed cultural landscape, i.e. the forest fire site before the reclamation process, with the passage of time managed to regain its capacity to counteract changes in its structure and character of functioning of its elements caused by the fire and transformed into a harmonious cultural landscape [16]. Methods of soil preparations employed in the proc-ess of the reclamation of the fire site did not influence in a significant manner the content of N-NH4
+ and N-NO3- in the soil. The content of the ammonia form of nitrogen in the
examined soils was several times higher than that of the nitrate form (Tab. 2), which was related to the low soil pH limiting nitrification (Tab. 1).
The activity of dehydrogenases, acid phosphatase, alkaline phosphatase and pro-tease in the soils on experimental plots with Grey alder was similar to the level of the activity of these enzymes determined in the soil on the control plot (L), whereas on plots where Scots pine was growing as well as on the NS (natural succession) plot, it was sig-nificantly lower, approximately 1.5 to 3.0 times than in the control soil (Tab. 3). In the case of urease, it was found that the activity of this enzyme in soils on all plots affected by the forest fire was identical with that in the control soil which is in keeping with the results reported by Januszek et al. [7] and corroborate once more that urease is resistant to external factors and the only factor limiting its activity is substrate (urea) availability. The above data confirms that following 12 years of after-fire reclamation operations of the affected landscape, especially on the experimental plots with alder plantings, it was
ELżBIETA JOLANTA BIELIńSKA, AGNIESZKA MOCEK-PŁóCINIAK

111
possible to achieve the condition of relative dynamic biological equilibrium which is essential if the landscape system is to function properly [6]. The observed high relative soil enzymatic activity on plots with alder plantings was accompanied by a significantly higher content of organic carbon and total nitrogen (Tab. 2). These results indicate that al-der plantings enhance the reclamation potentials of landscape area, including such partial potentials as: self-regulation and resistance, buffering, environment-forming as well as resource and functional procedures as expressed in the form of, among others, the capac-ity of the landscape to produce and store energy in the form of organic matter [18].
Table 3. Enzymatic activity of soils (Dh – dehydrogenases in cm3 H2⋅kg-1⋅d-1, Pac – acid phosphatase and Pal – alkaline phosphatases in mmol PNP·kg-1⋅h-1, U – urease in mg N-NH4
+⋅kg-1·h-1, P – protease in mg tyrosine·kg-1⋅h-1)
Plots Depth[cm]
Dh Pac Pal U P
S I 0–10 2.21c 14.63c 5.42d 2.35b 6.21b10–20 1.23a 8.63b 2.95a 0.79a 3.68a
S II 0–10 1.98b 9.56b 4.34c 2.28b 7.53b10–20 1.09a 4.47a 2.59a 0.76a 4.08a
S III 0–10 1.22a 9.32b 4.75c 2.72b 8.05b10–20 0.89a 6.42a 2.12a 0.84a 5.16a
O I 0–10 3.06d 28.98d 8.39e 2.41b 10.98d10–20 1.25a 11.75c 3.78b 0.64a 6.94b
O II 0–10 3.34d 30.12d 8.16e 2.48b 11.27d10–20 1.78b 10.88c 3.21b 0.72a 6.36b
O III 0–10 3.12d 29.94d 8.02e 2.54b 11.40d10–20 1.64b 12.85c 3.28b 0.78a 6.98b
NS 0–10 2.47c 10.93c 4.98d 2.69b 8.30c10–20 1.08a 8.92b 2.72a 0.73a 5.24a
L 0–10 3.29d 29.92d 8.27e 2.52b 11.93d10–20 1.95b 12.79c 3.65b 0.79a 6.15b
values in the column followed by the same letter are not significant at p < 0.05, “t” – test
No significant effect of the method of soil preparation on its enzymatic activity was noted.
The activity of the examined enzymes in top layers of soils was several times higher than in the 10–20 cm layer (Tab. 3) which is associated with profile humus distribution and declining quantities of the carbon substrates in the soil available for microorganisms and enzymes.
Summing up the obtained results, it can be said that following 12 years of reclama-tion the examined after-fire landscape is reaching the condition of biological structural and functional equilibrium. At the same time, it should be emphasized that landscape, as an energetically open system where boundary exchange of energy and matter takes place continually, is permanently exposed to the action of natural and anthropogenic fac-tors. What is important from the ecological point of view is the stability and durability of the capability for self-regulation developed in the result of the performed reclamation procedures which characterizes harmonized cultural landscapes. This indicates that it is
THE INFLUENCE OF THE METHOD OF RECLAMATION AND ...

112
necessary to continue research on changes of biochemical parameters stimulating proc-esses of matter circulation and energy flows between landscape elements from the point of view of estimation of the long-term effect of reclamation operations on functioning of the examined landscape.
CONCLUSIONS
1. The increasing contents of organic carbon and total nitrogen in the examined soils in consecutive years of investigations confirm the growing self-regulating capability of the landscape damaged by the fire and the effectiveness of the performed reclama-tion program.
2. The distinct positive impact of the reclamation program on experimental plots with alder plantings justifies the use of this species as the pioneer crop for fire site regen-eration.
3. The determined significant increase in the organic carbon content in the soil on ex-perimental plots with Grey alder stimulated favorable changes in the activity of en-zymes catalyzing the most important transformations of soil organic matter. This confirms that alder plantings increased the self-regulating, resistance, buffering as well as resource-functional potentials of the examined landscape.
4. Plantings with Grey alder exerted a significant influence on the increase of mineral forms of nitrogen in the soil corroborating their positive impact on the resource-functional potentials of the landscape subjected to the reclamation program.
5. It is evident from the performed investigations that the applied enzymatic tests also signal changes taking place in the landscape system under the influence of the ap-plied tree species which makes complex recognition of the course of the regenera-tion processes of forest ecosystems damaged by fires possible and can be utilized to develop optimal programs of management of large-area fire sites.
6. Different methods of soil preparation 12 years after their application on the exam-ined fire site failed to exhibit a significant influence on the determined soil proper-ties. This means that the employed methods of soil preparation did not cause tangi-ble, long-term changes in the functioning of the examined landscape.
REFERENCES
[1] Bender J., M. Gilewska: Rekultywacja w konfrontacji z aktami prawnymi, badaniami naukowymi i prak-tyką gospodarczą, Rocz. AR Poznań, 317, Roln., 56, 343–356 (2000).
[2] Bielińska E.J., A. Słowińska-Jurkiewicz: Aktywność enzymatyczna jako wskaźnik rekultywacji gleby na terenie po otworowej eksploatacji siarki, Archives of Environmental Protection – Archiwum Ochrony Środowiska, 30, 3, 163–172 (2004).
[3] Biskupski A., J. Sienkiewicz: Efficiency of different after harvest and presowing cultivation manner for winter wheat and winter rape, Fragmenta Agronomica, 1, 72–81 (1994).
[4] Ceitel J., S. Szymański, W. Badrzajn, J. Zientarski: Badanie różnych sposobów wprowadzania lasu na obszary drzewostanów zniszczonych przez pożar w Nadleśnictwie Potrzebowice, Sprawozdanie końcowe, Katedra Hodowli Lasu AR w Poznaniu. 11, 1–119 (1997).
[5] Domżał H., E.J. Bielińska (red.): Ocena przeobrażeń środowiska glebowego i stabilności ekosystemów leśnych w obszarze oddziaływania Zakładów Azotowych „Puławy” S.A., Acta Agrophysica, 145, Rozpra-wy i Monografie (2) (2007).
[6] Fischer Z., M. Magomedow: Ekologia – krajobraz – energia, [w:] Towarzystwo Naukowe Katolickiego Uniwersytetu Lubelskiego, 9–195 (2004).
ELżBIETA JOLANTA BIELIńSKA, AGNIESZKA MOCEK-PŁóCINIAK

113
[7] Januszek K., J. Lasota, P. Gruba, D. Domicz: Właściwości fizyczno-chemiczne i biochemiczne gleb bieli-cowych sześć lat po pożarze całkowitym lasu, Acta Agr. Silv. Ser. Silv., 39, 47–61 (2001).
[8] Kaczmarek Z., J. Michalik, W. Spychalski: Wybrane właściwości chemiczne i zawartość rozpuszczalnych w wodzie składników w glebach leśnych pożarzyska Potrzebowice w zależności od sposobu rekultywacji, Rocz. Glebozn., 55, 201–209 (2004).
[9] Kowalkowski A.: Funkcje gleb w ekosystemach leśnych i czynniki ich ewolucji, [w:] A. Kowalkowski (red.), Funkcjonowanie gleb leśnych na terenach zagrożonych i trendy jego zmian, KNL PAN, Warsztaty Naukowe Puławy, 3–10 (1999).
[10] Kurek E.: Związki przyczynowo-skutkowe aktywności mikrobiologicznej i zakwaszenia gleb, Zesz. Prob. Post. Nauk Roln., 482, 307–316 (2002).
[11] Ladd N., J.H.A. Butler: Short-term assays of soil proteolytic enzyme activities using proteins and dipep-tide derivatives as substrates, Soil Biol. Biochem., 4, 19–30 (1972).
[12] Łukaszewicz J.: Aspekty hodowlane odbudowy ekosystemu leśnego na dużych powierzchniach popożaro-wych, Post. Tech. Leś., 68, 38–45 (1998).
[13] Malicki L.: Opracowanie zmodyfikowanego w stosunku do tradycyjnego (płużnego) praco- i energoosz-czędnego, ekologicznie uzasadnionego systemu uprawy roli, Sprawozdanie końcowe, Katedra Ekologii Rolniczej AR w Lublinie, 1–251 (1997).
[14] Mocek A., E.J. Bielińska, Z. Kaczmarek, J. Michalik: Enzymatic Activity of forest soils after 10-year period of reclamation of forest area totally damaged by fire, [in:] Proceedings of the International Confer-ence on Bioremediation of Soil and Groundwater, Krakow, Poland, 2004, pp. 121–132.
[15] Olejarski J.: Wpływ zabiegów agrotechnicznych na niektóre właściwości gleb oraz stan upraw sosnowych na pożarzyskach wielkoobszarowych, Pr. Bad. Leś. A, 2(954), 44–77 (2003).
[16] Słowińska-Jurkiewicz A., B. Kołodziej, M. Jońca: Zmiany krajobrazu na obszarze po kopalni siarki Je-ziórko, [w:] Ogólnopolska Konferencja Naukowa Rekultywacja środowisk zdegradowanych, Lublin – Janów Lubelski – Jeziorko – Machów – Piaseczno 2005, pp. 82–83.
[17] Soil Conservation Service: Soil Survey laboratory methods manual, Soil Survey. Invest. Report No. 42, U.S. Dept. Agric., Washington, DC (1992).
[18] Solon J.: Zastosowanie koncepcji potencjałów krajobrazowych dla oceny stopnia spójności krajobrazu, [w:] A. Ciszewska (red.), Problemy Ekologii Krajobrazu, 14, 29–41 (2004), Wydawnictwo SGGW.
[19] Tabatabai M.A., J.M. Bremner: Use of p-nitrophenyl phosphate for assay of soil phosphatase activity, Soil Biol. Biochem., 1, 301–307 (1969).
[20] Thalmann A.: Zur Methodik der Bestimmung der Dehydrogenase Aktivität in Boden mittels Triphenylte-trazoliumchlorid (TTC), Landwirtsch. Forsch., 21, 249–258 (1968).
[21] Zantua M.I., J.M. Bremner: Comparison of methods of assaying urease activity in soils, Soil Biol. Bio-chem., 7, 291–295 (1975).
Received: May 19, 2008; accepted: March 5, 2009.
WPŁYW METODY REKULTYWACJI I WYBRANYCH GATUNKóW DRZEW DO ZALESIEń NA ZMIANY KRAJOBRAZU ZDEGRADOWANEGO PRZEZ POżAR
W pracy analizowano wpływ sposobu rekultywacji na przekształcenia krajobrazu zdegradowanego przez pożar. Badaniami objęto powierzchnie doświadczalne, na których zastosowano odmienne sposoby przygotowania gleby (gleba wyłączona z uprawy mechanicznej, pełna uprawa mechaniczna, wyoranie bruzd) w uprawach sosny zwyczajnej (Pinus silvestris L.) i olszy szarej (Alnus incana (L.) MOENCH) oraz powierzchnię sukcesji naturalnej i powierzchnię kontrolną wytypowaną w naturalnym kompleksie leśnym bezpośrednio sąsiadującym z pożarzyskiem. Badania wykazały, że po 12 latach rekultywacji krajobraz popożarowy uzyskuje stan struktural-nej i funkcjonalnej równowagi biologicznej. Nasadzenia olszą szarą w istotny sposób stymulowały aktywność enzymatyczną badanych gleb, co wskazuje na ich korzystny wpływ na potencjał krajobrazu i uzasadnia stosowa-nie tego gatunku jako przedplonu przy odnawianiu pożarzyska. Odmienne sposoby przygotowania gleby nie miały istotnego wpływu na uchwytne, długofalowe zmiany funkcjonowania badanego krajobrazu.
THE INFLUENCE OF THE METHOD OF RECLAMATION AND ...

114

115
PL ISSN 0324-8461
© Copyright by Institute of Envionmental Engineering of the Polish Academy of Sciences, Zabrze, Poland 2009
ARCHIVES OF ENVIRONMENTAL PROTECTIONvol. 35 no. 2 pp. 115 - 123 2009
THE REMOVAL OF Cr(VI) FROM THE AQUEOUS SOLUTION By GRANULAR FERRIC HyDROXIDE (GFH)
BAI YUAN, BRONISŁAW BARTKIEWICZ*
Warsaw University of Technology, Department of Environment Engineeringul. Nowowiejska 20, 00-660 Warsaw, Poland
*Corresponding author e-mail: [email protected]
COMMUNICATION
Keywords: Granular ferric hydroxide (GFH), adsorption isotherms, batch tests, column tests, chromium.
Abstract: In this work, sorption of chromium on granular ferric hydroxide (GFH) has been investigated using batch and column techniques. The adsorption behavior of Cr on GFH, depending on pH, contact time and sor-bent amount were studied. The equilibrium adsorption capacity of GFH for Cr was measured and extrapolated using Freundlich isotherms. Metal ions bounded to the GFH could be recovered by alkaline solution, and the GFH can be recycled. The sorption capacity of GFH was 25.0 mg/g. The ion exchange of chromium on GFH follows pseudo-first-order kinetics. The intraparticle diffusion of chromium on GFH presents the limiting rate. The results indicated practical value of this method for industry and also provide strong evidence to support the proposed thesis about the adsorption mechanism.
INTRODUCTION
Chromium(VI) is released into the environment through a large number of industrial op-erations, including metal finishing industry, leather, tanning, textile and pulp processing factories [9].
Removal of Cr(VI) from wastewater is essential due to their toxicity. Two possible oxidation states for chromium are: Cr(III) and Cr(VI). Cr(VI) is a strong oxidant and po-tential carcinogen. It has toxic influence on plants, animals, humans and microorganisms and is associated with the development of various chronic health disorders, including organ damage, dermatitis and respiratory impairment [10].
Many previous works have attempted to find reasonable methods to remove heavy met-als from wastewater, such as: electrochemical [6], chemical precipitation [1], adsorption [7]
As one of the most promising techniques for removal of chromium from industrial wastewater, adsorption technology has been employed for many years and effectiveness of various adsorbents has been demonstrated [8]. Jing Hu using maghemite nanoparticles to remove Cr(VI) reached the maximum adsorption at pH 2.5 [5]. A number of investigators have studied the removal of inorganic metal ions in particular chromium from aqueous solution using different adsorbents. Adsorption not only removes heavy metals from liquid phase but also allows regenerating and recycling them back into the industrial process.

116
A previous study [1–3] has shown that GFH is a promising material for the removal of arsenic and phosphorus from the natural water by adsorption. Badruzzaman showed that arsenate adsorption isotherm data were fitted with the Freundlich model [1]. Result-ing KF values were 3.60 and 4.55 µg As/mg dry GFH. At pH 7.0 Driehaus [2] obtained an adsorption density 17 mg As/g dry GFH at an equilibrium liquid phase concentration of 10 µg/dm3. The difference in adsorption capacity between Badruzzaman and Driehaus could be due to differences in initial concentration of As(V) or background water com-position [1, 2]. Driehaus does not mention a pH buffer, but bicarbonate was used in his study [2].
Genz [3] investigated the advanced phosphorus removal by adsorption on activated aluminum oxide (AA) and GFH in water treatment, GFH showed a higher maximum capacity for phosphate and a higher affinity at low P concentrations compared to AA. The achieved loadings from 0.1 and 0.3 mg/dm3 equilibrium of phosphorus concentrations at pH 8.2 amount to 7.9 and 12.3 mg/g for GFH and to 4.6 and 7.9 mg/g for activated alumi-num. For reloading of phosphorus the regeneration of GFH by 0.6 M NaOH seems most effective by the volume ratio of NaOH to the bed volume 100:1. Since, typically between two and four bed volumes of regenerate are used in adsorption filters a much higher con-sumption of NaOH is used. It was also found that the adsorption process was influenced by the matrix pH, the contact time and the capacity of the GFH material.
In this study, GFH as a sorbent was investigated for the removal of Cr(VI) from wastewater, recovery of GFH, and presentation of Cr(VI) adsorption mechanism onto GFH. Another goal was to obtain significant data for the application of this technique on industrial scale and make comparisons of low-cost adsorbents for treating wastewaters with chromium(VI).
MATERIAL AND METHODS
Adsorbent mediaGFH was obtained from Wasserchemie GmbH & Co. KG, Germany, applied in batch and fixed-bed column tests. The characteristic of GFH:
− water contents 36.5–42%,− grain size 0.32–2 mm,− grain density 1.5 kg/dm3,− Fe(OH)2 contents 52–57%,− flow rate 5–20 m/h,− pH range 3,5–9,0,− concentration of Fe in water < 0,2 mg/dm3.The results are presented on a dry GFH mass.
InstrumentationA Unicam 919 atomic adsorption spectrometer (AAS Unicam, England) was used for chromium(VI) analysis. The primary wavelength was 357.9 nm. The gas used in burner was acetylene. Sensitivity of the method was 0.05 mg/dm3. The possible negative ef-fect of other metals presence was overcome by addition of a buffer. A pH meter CI-316 (ELMETRON, Poland) was used for pH measurement. Peristaltic pump (pp1B-05A ZALiMP, Poland) for column tests.
BAI YUAN, BRONISŁAW BARTKIEWICZ

117
ChemicalspH adjustment was done by 0.1 M NaOH or HCl.
Distilled water was used throughout the work. Stock solutions of 1000 mg/dm3 chromium(VI) was prepared by dissolving 2.8292 g of potassium dichromate (K2Cr2O7) in distilled water. No other salts were added to adjust the ionic strength.
The pH-meter was calibrated using standard buffer solutions of known pH.
Batch experimentsWorking solutions with chromium(VI) concentration of 5 mg/dm3 were prepared from the standard solution of potassium dichromate diluted to 250 cm3 with distilled water. To develop adsorption isotherms, the method of adding different quantities of adsorbent (0.1 g, 0.15 g, 0.2 g, 0.25 g, 0.3 g, 0.35 g, 0.4 g, 0.45 g, 0.5 g dry matter) to a constant solu-tion volume at the same initial concentration of chromium was used. Experiments were repeated with different pH value (3.5, 4.0, 5.0, 6.95). pH value was corrected by 0.1 M HCl.
After adjusting pH and adding GFH, the contents of flasks were stirred for 7 h. This equilibration time was determined in a corresponding kinetic experiment. After stirring the sample was filtered, and only then the final concentration of chromium was meas-ured.
Fixed bed column experimentsA glass column with a diameter 1.4 cm was filled with GFH on glass wool support to the high of 16.7 cm. Column was supplied with chromium wastewater for a period of 4 days continuously as fixed-bed down-flow reactors. Before starting to exploit the column, the solubility of filtering material was checked and in the range of pH accepted by Manu-facturer very low solubility was observed (max. conc. of Fe < 0.03 mg/dm3). Chromium contained wastewater was pumped through the GFH column with a peristaltic pump, at the rate of 10 m/h. (This flow rate is the average between minimum and maximum given by Manufacturer). The contact time was 1 minute. The homogeneous surface diffusion model was used to describe the column batch data [5].
Regeneration studiesThe loaded column was regenerated after the first loading with 0.6 M NaOH solution with the 100 cm3 portions of reagent. For reconditioning the column was rinsed with distilled water and pH was readjusted before reloading.
FUNDAMENTAL PRINCIPLE
The metal concentration on the sorbent increases until equilibrium is reached between the solid and liquid phases in the system. The concentration of metal on the medium is calculated as the difference between the original concentration of the solution and the measured concentration in the liquid phase after contact. The mass balance may be ex-pressed as:
m (Ne-No) = V (Co-Ce) (1)where N = 0, let x = V (Co-Ce) so
Ne = x/m (2)
THE REMOVAL OF Cr(VI) FROM THE AQUEOUS SOLUTION By GRANULAR ...

118
The Ne value means the mass ratio of metal to sorbent. The most frequently used isotherm for the mathematical representation of this type of data is the Freundlich equa-tion (3):
Ne = KFCe1/n (3)
Equation (3) can be linearized as logarithm:log Ne = log KF + (1/n) log Ce (4)
where: V – volume of solution [dm3], x – mass of metal captured by media [mg], Co – initial liquid phase metal concentration [mg/dm3], Ce – equilibrium liquid phase metal concentration [mg/dm3], Ne – equilibrium metal concentration on media [mg/g], m – mass of the media [g], KF – Freundlich isotherm constant [l/g].
RESULTS AND DISCUSSION
Equilibrium adsorption isothermsThe results obtained during the batch scale experiments are shown in Figure 1 for GFH at pH = 3.5, 4.0, 5, 6.95. Initial concentration of Cr(VI) Co was 5 mg/dm3. The pH-value was lowered using 0.1 M HCl.
Fig. 1. Correlation between final concentration of Cr(VI) and x/m ratio on GFH at various pH
BAI YUAN, BRONISŁAW BARTKIEWICZ
Effect of pH on adsorptionThe effect of pH on the removal of chromium by its adsorption on GFH (0.15 g), is shown in Figure 2. It can be seen that pH of the solution plays a very important role in the adsorp-tion of chromium. At pH = 6.95, GFH adsorption capacity was 2.59 mg/g, and at pH = 3.5 the capacity increased to 7.46 mg/g. A decrease in pH from 6.95 to 3.5 led to higher load-ing for adsorbents due to the more positively charged adsorbent surface at acidic pH.

119
Fig. 2. Effect of pH on sorption capacity of GFH
Effect of GFH dosage on adsorptionFigure 3 shows the degree of removal of chromium from the solution at different doses of GFH and with different pH values. The GFH doses varied from 0.15 to 0.4 g. The ex-periment shows that for the maximum removal of 5 mg/dm3 of chromium from 250 cm3 sample requires a minimum GFH dosage of 0.4 g. The experimental results reveal that the chromium removal efficiency increases up to an optimum dosage beyond which the re-moval efficiency does not change. It is clear that the equilibrium concentration decreases with increasing adsorbent doses for a given initial chromium concentration, because by constant initial metal concentration, increasing adsorbent doses provides a greater surface area or adsorption sites [5].
Fig. 3. Cr(VI) removal depending on GFH masses
THE REMOVAL OF Cr(VI) FROM THE AQUEOUS SOLUTION By GRANULAR ...

120
Chromium removal behaviorsThe chromium removal kinetic was established using in each case 36.30 g GFH. Experi-ments were repeated at different pH value in order to find out the equilibrium time. The reaction mixture consisted of 1 dm3 of wastewater with initial concentration of 1400 mg Cr(VI)/dm3 (this concentration was calculated proportional to the amount of GFH used in previous experiment). At fixed time interval a sample was withdrawn and analyzed. The result is shown in Figure 4 at pH = 5.68 and 3.5. The highest efficiency of chromium removal took place in 360 min, after which approximately 65% Cr was removed.
From the reported data it can be seen that the initial adsorption kinetics is very high (the trend is almost vertical) for all values of pH and that it rapidly decreases with time. Since the initial kinetics is mainly related to the external mass transfer resistance, the external diffusion is very rapid. Furthermore, we observed that adsorption capability be-comes very low after 360 min, which means that GFH adsorption is close to saturation.
Table 1. The rate constant for reaction values on different dosage GFH
pH The rate constant for reaction, k [1/h] R2
5.86 0.39 0.973.5 0.31 0.95
Fig. 4. Cr(VI) removal kinetic curve in flow condition
Kinetic model of adsorptionExperiments were performed in order to understand the kinetics of chromium removal on GFH. It is shown in Figure 5. The rate constant k, shown in Table 1 can be evaluated by the following pseudo-first-order expression:
dq/dt = kad (qe-q) (5)Integrating equation (5) for boundary from time t = 0, and if at the time t the con-
centration falls to q, it gives:lg (qe-q) = lg qe-(kad/2.303)t (6)
BAI YUAN, BRONISŁAW BARTKIEWICZ

121
Intraparticle diffusion modelThe rate constant for intraparticle diffusion kid can be evaluated by the following:
q = kid t1/2 (7)
It is shown in Figure 6 and Table 2.Table 2. The rate constant for reaction values on different dosage GFH
pH The rate constant for intraparticle diffusion, kid R2
5.86 4.08 0.963.5 6.30 0.98
Fig. 5. Kinetic of Cr(VI) removal on ion-exchange resin Amberjet 4200 Cl
Fig. 6. Linear isotherm plot for the ion exchange of Cr(VI)
Adsorption capacity and desorptionTo measure the adsorption capacity for GFH the adsorption column was operated until the column capacity was exhausted (i.e. concentration in the influent Ce was similar to the concentration in the inflow). It is shown in Figure 7. The GFH sorption capacity is 25 mg Cr/g of GFH.
THE REMOVAL OF Cr(VI) FROM THE AQUEOUS SOLUTION By GRANULAR ...

122
CONCLUSION
GFH is an effective adsorbent for Cr(VI) removal, with relatively high adsorption capac-ity.
Lower pH values would be advantageous for adsorbent in terms of the possible loading. Small specific amount of residuals can be easily disposed of without additional treatment.
During long-term operation contamination growth and clogging of adsorption filters might occur. At this point a regeneration procedure might replace backwashing.
REFERENCES
[1] Badruzzaman M., P. Westerhoff, D. Knappe: Intraparticle diffusion and adsorption of arsenate onto granular ferric hydroxide (GFH), Water Research, 38, 4002–4012 (2004).
[2] Driehaus W., M. Jekel, U. Hildebrand: Granular ferric hydroxide, a new adsorbent for the removal of arsenic from natural water, J. Water SRT-Aqua, 47, 30–35 (1998).
[3] Genz A., A. Kornmueller, M. Jekel: Advanced phosphorus removal from membrane filtrates by adsorption on activated aluminium oxide and granular ferric hydroxide, Water Research, 39, 3523–2530 (2004).
[4] Ho Y.S., J.D. Wase, C.F. Forster: Batch Nickel Removal from Aqueous Solutions, Water Research, 29, 5, 1327–1334 (1995).
[5] Hu J., G. Chen, I. Lo: Removal and recovery of Cr(VI) from wastewater by maghemite nanoparticles, Water Research, 39, 4528–4536 (2005).
[6] Hunsom M., K. Pruksathorn, S. Damronglerd, H. Vergens, P. Duvernueil: Electrochemical treatment of heavy metals (Cu2+, Cr6+, Ni2+) from industrial effluent and modeling of copper reduction, Water Re-search, 39, 610–616 (2005)
[7] Lo W.H, H. Chua, K.H. Lam, S.P. Bi: A comparative investigation on the biosorption of lead by filamen-tous fungal biomass, Chemosphere, 39, 2723–2736 (1999).
[8] Shuddhodan M.P., E. Singh, K. Vinod, D. Tiwari: Applied radiation and isotopes (incorporating Nuclear
Fig. 7. Final concentration of Cr(VI) after sorption on GFH column
BAI YUAN, BRONISŁAW BARTKIEWICZ

123
Geophysics), An Efficient Removal of Cadmium Ions by sodium Titanate from Aqueous Solutions, Journal of Hazardous Materials, 48, 4, 435–440 (1997).
[9] Stasinakis A., S. Thomaidis, D. Mamais: Investigation of Cr(VI) reduction in continuous-flow activated sludge system, Chemosphere, 57, 1069–1077 (2004).
[10] Xiang-Rong Xu., B. Li, Y. Li, D. Gu: Reduction of hexavalent chromium by ascorbic acid in aqueous solutions, Chemosphere, 57, 609–613 (2004).
Received: September 25, 2008; accepted: March 24, 2009.
USUWANIE Cr(VI) Z ROZTWORóW WODNYCH PRZEZ SORPCJę NA GRANULOWANYM WODOROTLENKU żELAZA (GFH)
W pracy przebadano efektywność sorpcji chromu(VI) na granulowanym wodorotlenku żelaza (GFH) w warunkach objętościowych i przepływowych. Badano skuteczność sorpcji zależnie od pH, czasu kontaktu i dawki adsorbentu. Pojemność sorpcyjną GFH zmierzoną w badaniach ekstrapolowano wykorzystując rów-nanie izotermy Freundlicha. Pojemność ta wynosiła 25 mg/g. Jony metali zaadsorbowane na GHF mogą być z niego wymyte roztworem alkalicznym, co umożliwiałoby recyrkulację adsorbentu. Kinetyka wymiany jonów chromu na GFH może być opisana równaniem pierwszego rzędu. Kryterium limitującym wymianę jest dyfuzja międzycząsteczkowa. Wyniki wykazały praktyczną przydatność tej metody w przemyśle i stanowiły dowód na poparcie tezy wyjaśniającej mechanizm adsorpcji.
THE REMOVAL OF Cr(VI) FROM THE AQUEOUS SOLUTION By GRANULAR ...

124

125
PL ISSN 0324-8461
© Copyright by Institute of Envionmental Engineering of the Polish Academy of Sciences, Zabrze, Poland 2009
ARCHIVES OF ENVIRONMENTAL PROTECTIONvol. 35 no. 2 pp. 125 - 132 2009
POLyCHLORINATED DIBENZO-P-DIOXINS (PCDDS) AND POLyCHLORINATED DIBENZOFURANS (PCDFS) COMPOUNDS
IN SEDIMENTS OF TWO SHALLOW RESERVOIRS IN CENTRAL POLAND
MAGDALENA URBANIAK1, 2*, MAREK ZIELIńSKI3, WIKTOR WESOŁOWSKI3, MACIEJ ZALEWSKI1, 2
1 University of Łódź, Department of Applied Ecologyul. Banacha 12/16, 90-237 Łódź, Poland
2 International Institute of Polish Academy of Sciences, European Regional Centre for Ecohydrology under the auspices of UNESCOul. Tylna 3, 90-364 Łódź, Poland
3 Nofer Institute of Occupational Medicineul. Teresy 8, 91-348 Łódź, Poland
*Corresponding author e-mail: [email protected]
COMMUNICATION
Keywords: PCDDs/PCDFs, sediments, reservoirs.
Abstract: The objectives of this research were to 1) measure the concentrations of PCDDs/PCDFs in sediments from two reservoirs located in Central Poland, 2) illustrate the pollution level, and 3) identify sources affecting these contaminations. Sediment samples were collected during spring period of 2007 from Barycz Reservoir situated on the Grabia River and Lower Pond located on the Sokołówka River. Almost all of analyzed homo-logues were identified, except for two the most toxic congeners: 2,3,7,8-TCDD and 1,2,3,7,8-PeCDD, which were not observed. The total concentrations of PCDDs/PCDFs were 213.727 pg⋅g-1 d.w. for Barycz Reservoir and 536.266 pg⋅g-1 d.w. for Lower Pond, with dominant OCDD congener. WHO-TEQ concentrations based on TEF values ranged from 2.323 to 7.984 pg⋅g-1 for Barycz Reservoir and Lower Pond, respectively.
INTRODUCTION
Every year in Europe more than 30 000 chemicals in quantities of 1 Mg are produced and handled. Many of them are formed due to combustion processes or as manufacturing by-products. Some are highly reactive and toxic for living organisms in very low concentra-tions but posses relatively short lifetime; others, like polychlorinated dibenzo-p-dioxins (PCDDs) and polychlorinated dibenzofurans (PCDFs), have been shown to be persistent in environment, bioaccumulative and hazardous for biota for several years [13].
PCDD/DFs form a group of synthetic organic chemicals that contain 210 structur-ally related individual congeners widely distributed in the environment. They have been detected in soil, surface water, sediments, plants, and animal tissue in all regions of the earth [6, 7, 9]. Because of their low volatility and low solubility in water they can be

126
strongly associated with particulates and thus most of them are contained in soil and sedi-ments that serve as environmental reservoirs from which PCDD/DF may be released over a long period of time. They can also enter the aquatic environment by atmospheric trans-port and deposition, direct and indirect discharges and as a riverine input [13, 14, 16].
MATERIALS AND METHODS
Study areasIn this study we determined the concentrations of 17 PCDD/PCDF congeners in sedi-ments collected from two shallow reservoirs: Barycz Reservoir and Lower Pond (Fig. 1). Sites were selected to represent the major land uses: agricultural – Barycz Reservoir, and urban (residential and commercial-industrial) – Lower Pond, based on dominant mapped land-use and personal observation of the surrounding area.
Fig. 1. Location of the sediment samples taken for the analysis
Barycz Reservoir (51°35’N; 19°12’E) is located in the middle course of the Grabia River (river basin 813 000 m2) between Barycz and Ldzań villages [12]. The total capac-ity of this reservoir is 2800 m2 and mean depth 1.78 m. The reservoir was built for water retention and irrigation of agriculture.
Lower Pond is situated on the Sokołówka River (river basin 45 400 m2) which repre-sent highly urbanized and industrialized catchment contaminated with heavy metals and organic compounds due to sewage and storm water disposal. The main channel was chan-nelised by concrete slabs, to straighten the course and deepen the bed for the purpose of detention of storm waters. The total capacity of Lower Pond is 1080 m2 and mean depth is 1.0 m [1, 17].
M. URBANIAK, M. ZIELIńSKI, W. WESOŁOWSKI, M. ZALEWSKI

127
SamplingSediment samples were collected using sediment core sampler during the spring period of 2007 (06.04.2007). Samples were filled into amber containers and transported at 4°C to the laboratory. After wards the samples were freeze dried at -40°C, and put trough 2000 μm mesh sieve.
PCDDs/DFs analysisThe dried sediments were extracted by ASE (Automatic System Extraction) 200 Dionex. The 2 g of sediment were spiked with 13C-labelled PCDDs/DFs standard of known quan-tity to monitor extraction efficiency. Extraction was performed at 150 atm (11 Mpa) at 175°C. Extracts were treated with a multilayer column packed with neutral silica and silica modified with 44% (w/w) and 22% sulphuric acid (SiO2 – H2SO4), 3% KOH and 10% AgNO3, prewashing by 150 cm3 of hexane. Elution was performed with 200 cm3 of hexane. The extracts were then reduced to approximately 100⋅10-6 dm3 and n-hexane was replaced by n-nonane and the internal standard was added [5].
For identification and quantification of 17 2,3,7,8-substituted PCDD/DF, HRGC/HRMS (HP6890, Hewlett Packard/Autospec Ultima, Micromass) fitted with DB-5MS columns (60 m x 0.25 mm i.d., film thickness 0.25 µm) was used. As an internal standard the perfluorokerosene (PFK) was used. The column oven temperature was programmed as follows: 150°C for 2 min, 20°C/min to 200°C (0 min), 1°C/min to 220°C for 16 min and 3°C/min to 320°C for 3 min. The injector temperature was 270°C. The MS was oper-ated with a mass resolution of 10 000, and the electron impact ionization energy was 34.8 eV with an ion source temperature of 250°C. Helium was used as carrier gas at a flow rate 1.6 cm3/min. Samples were quantified with an isotope dilution method [5].
Quality assurance/Quality controlThe analytical method used was properly validated on the basis of internal reference materials and the analytical laboratory involved successfully passed the accreditation pro-cedure in 2005.
Quantification was done by the external standard method using certified calibration standards. Each analytical batch contained a method blank, a matrix spike, and replicate samples. A reagent blank was used to assess artifacts, precision was verified by duplicate analyses and recoveries were estimated using samples spiked with PCDD/PCDF. Sam-ples spikes were used also as an additional check of accuracy. Recoveries of 13C-labeled PCDD and PCDF congeners through the analytical procedure ranged from 74 to 146%.
RESULTS AND DISCUSSION
Results showed that almost all tetra- to octachlorinated PCDDs/PCDFs were identified, except for two the most toxic congeners: 2,3,7,8-TCDD and 1,2,3,7,8-PeCDD, which were not observed (Tab. 1 and Fig. 2). The maximum concentration was observed for octachlorinated PCDD congeners: 162.483 and 409.636 pg⋅g-1 d.w. for Barycz Reservoir and Lower Pond, respectively (Tab. 1 and Fig. 2).
POLyCHLORINATED DIBENZO-P-DIOXINS (PCDDS) AND POLyCHLORINATED ...

128
Table 1. Concentration of analyzed PCDDs/PCDFs in sediment samples collected from Barycz Reservoir and Lower Pond during spring period of 2007 [pg⋅g-1 d.w.]
Congener Barycz Reservoir Lower PondBarycz Reservoir Lower Pond
WHO-TEQ concentration2378-TCDD 0.000 0.000 0.000 0.00012378-PeCDD 0.000 0.000 0.000 0.000123478-HxCDD 0.325 0.597 0.033 0.060123678-HxCDD 1.254 1.266 0.125 0.127123789-HxCDD 4.083 6.207 0.408 0.6211234678-HpCDD 4.496 29.185 0.145 0.292OCDD 162.483 409.636 0.049 0.1232378-TCDF 0.000 10.028 0.000 1.00312378-PeCDF 0.639 4.738 0.019 0.14223478-PeCDF 1.047 8.242 0.314 2.472123478-HxCDF 3.158 7.143 0.316 0.714123678-HxCDF 3.068 7.517 0.307 0.751123789-HxCDF 2.228 2.472 0.223 0.247234678-HxCDF 2.718 11.487 0.272 1.1491234678-HpCDF 7.198 22.790 0.072 0.2281234789-HpCDF 3.818 5.228 0.038 0.052OCDF 7.211 9.732 0.002 0.003Total 213.727 536.266 2.323 7.984
Fig. 2. Percentage content of analyzed homologues in sediment samples collected from Barycz Reservoir and Lower Pond during spring period of 2007
The total concentrations of PCDD/DF were 213.727 and 536.266 pg⋅g-1 d.w. for Barycz Reservoir and Lower Pond , respectively, with the predominance of PCDD (182.641 and 446.891 pg⋅g-1 d.w. for Barycz Reservoir and Lower Pond, respectively)
M. URBANIAK, M. ZIELIńSKI, W. WESOŁOWSKI, M. ZALEWSKI

129
(Tab. 1 and Fig. 2). The total PCDD/DF TEQs concentrations were 2.323 and 7.984 pg TEQ⋅g-1 dry weight for Barycz Reservoir and Lower Pond, respectively (Tab. 1 and Fig 4). The PCDF congeners were responsible for higher contributions to 2,3,7,8-tetrachlo-rodibenzo-p-dioxin equivalents (WHO-TEQ) values (2.06 and 5.53 times higher than PCDDs for Barycz Reservoir and Lower Pond, respectively).
Fig. 4. Total PCDD/DF TEQ concentration in sediment samples collected from Barycz Reservoir and Lower Pond during spring period of 2007 [pg TEQ⋅g-1 d.w.]
Fig. 3. Total PCDD/DF concentration in sediment samples collected from Barycz Reservoir and Lower Pond during spring period of 2007 [pg⋅g-1 d.w.]
POLyCHLORINATED DIBENZO-P-DIOXINS (PCDDS) AND POLyCHLORINATED ...

130
The composition of 7 PCDD congeners in sediments collected from Barycz Reser-voir was in order: OCDD (76.02%), 1,2,3,4,6,7,8-HpCDD (6.78%), 1,2,3,7,8,9-HxCDD (1.91%), 1,2,3,6,7,8-HxCDD (0.59%), 1,2,3,4,7,8-HxCDD (0.15%), 1,2,3,7,8-PeCDD and 2,3,7,8-TCDD (0.00%). Similar pattern was observed for Lower Pond sample: OCDD (76.39%), 1,2,3,4,6,7,8-HpCDD (5.44%), 1,2,3,7,8,9-HxCDD (1.16%), 1,2,3,6,7,8-Hx-CDD (0.24%), 1,2,3,4,7,8-HxCDD (0.11%), 1,2,3,7,8-PeCDD and 2,3,7,8-TCDD (0.00%). The PCDFs composition was more diverse and ranged from 3.37% to 0.00% for the Barycz Reservoir sample and from 4.25% to 0.46% for the Lower Pond sample.
It could be stated that no previous measurements of PCDD/PCDF concentrations were undertaken in analyzed reservoirs, thus there are not available data for comparison. Nevertheless, the obtained concentrations of PCDDs/PCDFs in the studied area were more or less comparable to the values observed in other reservoirs worldwide. Chi et al. [2] reported that concentration of PCDDs in northern Taiwan reservoir ranged between 0.95 to 14.40 pg TEQ⋅g-1. In a study of Rose and McKay [15] the concentrations ranged from 1 to 100 pg TEQ⋅g-1. Research of Koh et al [11] showed the PCDD/PCDF concentra-tion values in sediment from the Hyeongsan River were between 190 to 290 pg⋅g-1 d.w. El-Kady et al. [4] reported that total sum of PCDD/PCDFs in sediments of the River Nile was in the range from 239.67 to 755.09 pg⋅g-1 d.w. A study of Kannan et al. [10] showed values from 68.7 to 1420 pg⋅g-1 d.w. with TEQ concentration ranged from 3.00 to 62.1 pg⋅g-1 d.w. Hilscherova et al. [8] reported concentration from 59 to 120 and from 2400 for PCDDs to 53600 pg⋅g-1 d.w. for PCDFs for upstream and downstream of the Tittabawse River, respectively.
From the study obtained by Polish researchers carried out on soils in Poland total PCDD concentrations ranged from 6.8 to 41 pg⋅g-1 d.w. and concentration of PCDFs was in range 3.9 to 19 pg⋅g-1 d.w. and in all samples highly chlorinated PCDDs/DFs dominated (OCDD, 1,2,3,4,6,7,8-HpCDD, OCDF, 1,2,3,4,7,8,9-HpCDF, 1,2,3,4,6,7,8-HpCDF were found in all investigated soils). Total toxic equivalency was in the range of 0.023–5.9 pg TEQ⋅g-1 d.w. [18].
Presented by authors values were several times lover that obtained in our study, nev-ertheless it could be stated that sediment samples are matrices that accumulate liphoplilic substances and can receive inputs via various pathways including atmospheric deposi-tion, industrial and domestic effluents, storm water, spills, and other. Thus they are the ultimate sink for micropollutants and it is estimated that about 97% of released POPs in a water column are retained in sediment [3].
The main sources of PCDDs/DFs in the analyzed samples include thermal processes such as grass and trash burning as well as heating of houses by small stoves fired with hard coal with added household wastes, and former use of agrochemical formulations consist-ing of impurities of PCDD/DF. Thus, this kind of pollution may play an important role at agricultural site (Barycz Reservoir). In comparison, as the main sources of PCDD/PCDF in the urban region (Lower Pond), energy and fossil fuel production, co-fired power boil-ers, and chemical industry can be considered. Moreover, congeners 1,2,3,6,7,8-HxCDD and 1,2,3,7,8,9-HxCDD are reported as closely related to incineration sources, and there-fore can be linked to these processes. Congeners 1,2,3,4,6,7,8-HpCDD, 1,2,3,6,7,8-Hx-CDD, in turn, showed similarities with the PCDD/DF homologues in pentachlorophenol (PCP), and thus their presence in the environment is explained as PCP-related contami-nation. The higher concentrations of OCDD/OCDF might be connected to the former
M. URBANIAK, M. ZIELIńSKI, W. WESOŁOWSKI, M. ZALEWSKI

131
production and use of highly chlorinated polychlorinated biphenyl formulation – such as chlorofen [18].
The obtained results suggest that sediments from Barycz Reservoir and Lower Pond are contaminated with PCDD/PCDFs in a considerable rate. Industrial and urban char-acteristic of Lower Pond basin with combined overflows located along the Sokołówka River have influenced its higher sediment concentration.
AcknowledgementsThis study was supported by grant GOCE 018530 SWITCH: Sustainable Water
Management Improves Tomorrow’s Cities Health (UE FP) and project no. 2 PO4 G 088 30 founded by Ministry of Science and Higher Education.
REFERENCES
[1] Bieżanowski W.: Łódka i inne rzeki łódzkie, Wydawnictwo Towarzystwa Opieki nad Zabytkami w Łodzi, Zora, wyd. II, Łódź 2003.
[2] Chi K.H., M.B. Chang, S.J. Kao: Historical trends of PCDD/Fs and dioxin-like PCBs in sediments buried in a reservoir in Northern Taiwan, Chemosphere, 68, 1733–1740 (2007).
[3] DiPinto L.M., B.C. Coull, G.T. Chandler: Lethal and sublethal effects of a sediment-associated PCB Aroclor 1254 on a meiobenthic copepod, Environ. Toxicol. Chem., 12, 1909–1918 (1993).
[4] El-Kady A.A., A.M. Abdel-Wahhab, B. Henkelmann, M.H. Belal, M. Khairy, S. Morsi, S.M. Galal, K.W. Schramm: Polychlorinated biphenyl, polychlorinated dibenzo-p-dioxin and polychlorinated dibenzo-furan residues in sediments and fish of the River Nile in the Cairo region, Chemosphere, 68, 1660–1668 (2007).
[5] EPA Method 1613: Revision B, Tetra- trough Octa-chlorinated dioxins and Furans by Isotope Dilution HRGC/HRMS, US EPA (1994).
[6] Falandysz J.: Polichlorowane dibenzo-p-dioksyny w środowisku naturalnym, Farmakologia Polska, 44, 577–581 (1988).
[7] Grochowalski A.: Dioksyny a środowisko. Historia, dzień dzisiejszy i perspektywy, II Ogólnopolskie Sympozjum Dioksyny – Człowiek – Środowisko, Politechnika Krakowska, Kraków, 19–20.09.1996.
[8] Hilscherova K., K. Kannan, H. Nakata, N. Yamashita, P. Bradley, J.M. Maccabe, A.B. Taylor, J.P. Giesy: Polichlorinated dibenzo-p-dioxin and dibenzofuran concentration profiles in sediments and flood-plain soils of the Tittabawssee River, Michigan, Environ. Sci. Technol., 37, 468–474 (2003).
[9] Im S.H., K. Kannan, M. Matsuda, J.P. Giesy, T. Wakimoto: Sources and distribution of polychlorinated dibenzo-p-dioxins and dibenzofurans in sediment from Masay Bay, Korea, Environmental Toxicology and Chemistry, 21, 245–252 (2002).
[10] Kannan K., J.L. Kober, Y.S. Kang, S. Masunaga, J. Nakanishi, A. Ostaszewski, J. Giesy: Polichloronated naphtalens, biphenyls, dibenzo-p-dioxins, and dibenzofurans as well as polycyclic aromatic hydrocar-bons and alkylphenols in sediment from the Detriot and Rouge rivers, Michigan, USA, Environmental Toxicology and Chemistry, 20, 1878–1889 (2001).
[11] Koh C.H., J.S. Khim, K. Kannan, D.L.Villeneuve, K. Senthilkumar, J.P. Giesy: Polichlorinated dibenzo-p-dioxins (PCDDs), dibenzofurans (PCDFs), biphenyls (PCBs), and polycyclic aromatic hydrocarbons (PAHs) and 2,3,7,8-TCDD equivalents (TEQs) in sediments from the Hyeongsan River, Korea, Environ-mental Pollution, 123, 489–501 (2004).
[12] Kondracki J.: Geografia fizyczna Polski, PWN, Warszawa 1978.[13] Makles Z., A. Swiatkowski, S. Grybowska: Niebezpieczne dioksyny, Arkady Sp. z o.o, Warszawa 2001.[14] Moore M.R., W. Vetter, C.Gaus, G.R. Shaw, J.F. Muller: Trace organic compounds in the marine environ-
ment, Marine Pollution Bulletin, 45, 62–68 (2002).[15] Rose C.L., W.A. McKay: PCDDs (dioxins) and PCDFs (furans) in selected UK lake and reservoir sites
– concentrations and TEQs in sediment and fish sample, Science of Total Environment, 177, 43–56 (1996).
[16] Stronkhost J., P. Leonards, A. Murk: Rusing the dioxin receptor-calux in vitro bioassay to screen ma-rine harbor sediments for compounds with a dioxin-like mode of action, Environmental Toxicology and Chemistry, 21, 2552–2561 (2002).
POLyCHLORINATED DIBENZO-P-DIOXINS (PCDDS) AND POLyCHLORINATED ...

132
[17] Wagner I., K. Izydorczyk, A. Drobniewska, W. Fratczak, M. Zalewski: Inclusion of ecohydrology concept as integral component of systemic in urban water resources management. The City of Lodz, case study, Poland, Scientific Conference SWITCH in Birmingham and New directions in IURWM, Paris 2007.
[18] Wyrzykowska B., J. Falandysz, N. Hanari, N. Yamashita: Dioxins in agricultural soil of Poland, Roczniki Państwowego Zakładu Higieny, 57, 361–70 (2006) (in polish).
Received: July 31, 2008; accepted: February 24, 2009.
POLICHLOROWANE DIBENZO-P-DIOKSYNY I POLICHLOROWANE DIBENZOFURANY W OSADACH DENNYCH DWóCH PŁYTKICH ZBIORNIKóW POLSKI CENTRALNEJ
Celem niniejszych badań było: 1) zmierzenie stężeń PCDD/DF w osadach dennych dwóch zbiorników za-porowych zlokalizowanych w Polsce Centralnej, 2) zilustrowanie poziomu zanieczyszczenia powyższymi związkami oraz 3) identyfikacja źródeł wpływających na istniejący stan. Osady denne pobrano w sezonie wiosennym 2007 r. ze Zbiornika Barycz usytuowanego na rzece Grabi i Stawu Dolnego zlokalizowanego na rzece Sokołówce. Niemal wszystkie spośród 17 analizowanych kongenerów PCDD/DF zidentyfikowano w badanych próbach, wyjątkiem były dwa najbardziej toksyczne związki: 2,3,7,8-TCDD i 1,2,3,7,8-PeCDD, których nie wykryto. Całkowite stężenie PCDD/DF w Zbiorniku Barycz wynosiło 213,727 pg⋅g-1 s.m. oraz 536,266 pg⋅g-1 s.m. w Stawie Dolnym, z dominującym stężeniem kongeneru OCDD. Stężenie mierzone jako WHO-TEQ wynosiło 2,323 i 7,984 pg⋅g-1 s.m., odpowiednio dla Zbiornika Barycz i Stawu Dolnego.
M. URBANIAK, M. ZIELIńSKI, W. WESOŁOWSKI, M. ZALEWSKI


