Page 1
1
Politecnico di Milano
School of Industrial and Information Engineering
Master of Science Management Engineering
Performance implications of Sino-Foreign Joint Ventures vs.
Wholly Foreign Owned Enterprises in Chinese
Pharmaceutical industry
Supervisor: Prof. Stefano Elia Student: Salman Tahir Mirza (852547)
Student: Sarah Zafar (852654)
Academic year 2017/18
Page 2
2
Abstract
The Economy of China went through a revolutionary change when it entered into the
World Trade Organization in 2001, reducing the barriers on FDI and making the infrastructure
more favourable for Wholly Foreign Owned Enterprises (WFOE) due to which majority of the
foreign firms which existed as Joint Ventures converted to Wholly Foreign Owned Enterprises
(WFOE) while many remained as Joint Ventures.
China has the second largest pharmaceutical market in the world and this research is
done to understand whether foreign pharmaceutical companies in China perform better as
WFOE or Joint Venture.
We review established theories including Transaction Cost Economics, Eclectic
Paradigm, Resource Based View and the Institutional Theory which explain the operation
mode choice for foreign companies in China focusing our attention on the choice between
Joint Ventures and Wholly Foreign Owned Enterprises. In light of these theories we analyse
the financial performance of Joint Ventures and WFOE using extensive Oriana & Orbis
database of Bureau Van Dijk and conduct an empirical analysis using ANOVA statistics to
determine whether significant differences exist between the two groups. Our results indicate
significant differences do exists between the financial performances while it also indicates
that Sino-Foreign Joint Ventures perform considerably better than WFOE in the Chinese
pharmaceutical industry.
Page 3
3
Abstract
L’economia della Cina si addentrò in un cambiamento rivoluzionario quando nel 2001
entrò nella World Trade Organization, riducendo le barrier su FDI e creando infrastrutture
migliori per WFOE che hanno portato la maggioranza delle imprese che esistevano come Joint
Venture a convertirsi in WFOE mentre molte rimasero come Join Venture.
La Cina ha il secondo più grande mercato farmaceutico del mondo e questa ricerca è
stata fatta per capire se le imprese farmaceutiche straniere in Cina hanno performance
migliori come WFOE o come JV.
Rivediamo teorie conclamate che includono TCE, EP, RBV and IT che spiegano la
modalità di scelta dell’operazione per le compagnie straniere in Cina focalizzando la nostra
attenzione sulla scelta tra la performance finanziaria della JV e della WFOE utilizzando un
esteso database dall’Oriana database del BVD e conducendo un’empirica analisi utilizzando
statistiche ANOVA per determinare importanti differenze che esistono tra i due gruppi. I
nostri risultati indicano che Sino Foreign Joint Ventures rende considerevolmente meglio che
WFOE nell’industria farmaceutica cinese.
Page 4
4
1 Contents Abstract ................................................................................................................................................... 2
Abstract ................................................................................................................................................... 3
1. Executive summary ......................................................................................................................... 9
2. Theoretical framework ................................................................................................................. 12
2.1. Sources .................................................................................................................................. 12
2.2. Motives for FDI ...................................................................................................................... 12
2.2.1. Market Seeking ............................................................................................................. 13
2.2.2. Efficiency seeking .......................................................................................................... 13
2.2.3. Resource seeking .......................................................................................................... 14
2.2.4. Strategic Asset Seeking ................................................................................................. 14
2.3. Theories related to entry modes .......................................................................................... 14
2.3.1. Transaction Cost Economics ......................................................................................... 14
2.3.2. Transaction cost economics in case of Foreign Expansion ........................................... 16
a. Asset Specificity .................................................................................................................... 17
b. External Uncertainty ............................................................................................................. 18
c. Internal Uncertainty .............................................................................................................. 19
2.3.3. Eclectic Theory .................................................................................................................. 19
2.3.3.1. Ownership Advantages ............................................................................................. 20
• Firm Size ................................................................................................................................ 20
• Firm’s international experience ............................................................................................ 21
2.3.3.2. Location Advantages ................................................................................................. 21
• Market Size ........................................................................................................................... 22
• Host country risk ................................................................................................................... 22
• Cultural distance ................................................................................................................... 22
2.3.3.3. Internalization Advantages ....................................................................................... 23
• Contractual Risk .................................................................................................................... 23
2.3.4. Resource Based Theory ..................................................................................................... 23
2.3.5. Institutional Theory ........................................................................................................... 25
• Regulatory Institutions .......................................................................................................... 26
• Normative Institutions .......................................................................................................... 26
• Cognitive Institutions ............................................................................................................ 27
a) External Mimicry ................................................................................................................... 28
b) Internal Mimicry .................................................................................................................... 28
Page 5
5
2.4. Literature related to the performance measurement due to ownership structure and
control
3. Introduction to China .................................................................................................................... 31
3.1. Main modes of operation for companies in China ............................................................... 33
a) Representative Office ........................................................................................................... 33
b) Branch Office ......................................................................................................................... 34
c) State Owned Enterprises ...................................................................................................... 34
d) Foreign Invested Partnership Enterprise .............................................................................. 34
e) Joint Ventures ....................................................................................................................... 35
f) Wholly Owned Foreign Enterprise ........................................................................................ 36
3.2. Reforms in China ................................................................................................................... 36
3.3. Pharmaceutical Market in China ........................................................................................... 40
3.3.1. Market Breakdown ....................................................................................................... 41
a) Generics ................................................................................................................................ 41
b) Patented Drugs ..................................................................................................................... 42
c) OTC ........................................................................................................................................ 42
3.4. Research & development in China Pharma .......................................................................... 43
4. Data Analysis ................................................................................................................................. 44
4.1. Data description .................................................................................................................... 44
4.2. Data sampling and sorting .................................................................................................... 45
4.3. Methodology ......................................................................................................................... 46
4.4. ANOVA .................................................................................................................................. 46
4.4.1. Model hypothesis & assumptions ................................................................................. 47
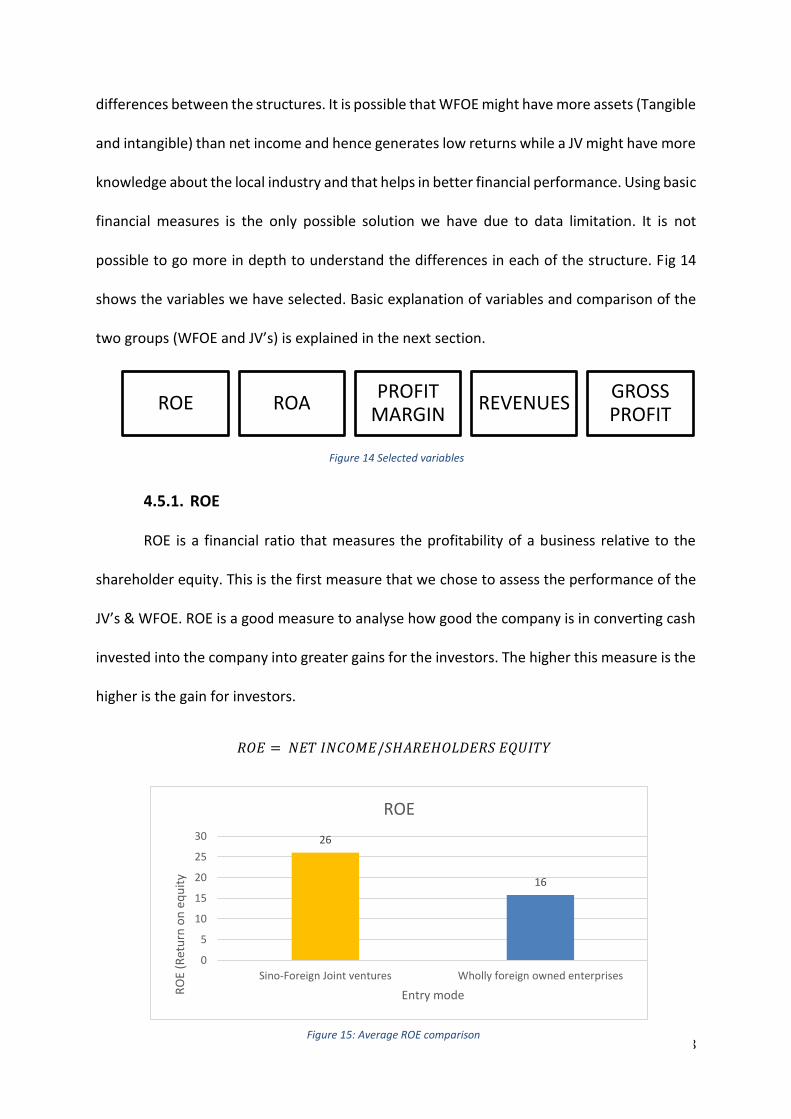
4.5. Selection of Variables ............................................................................................................ 47
4.5.1. ROE ................................................................................................................................ 48
4.5.2. ROA ............................................................................................................................... 49
4.5.3. Profit margin ................................................................................................................. 49
4.5.4. Operating Revenue/Turnover ....................................................................................... 50
4.5.5. Gross Profit ................................................................................................................... 51
4.6. Summary of the above .......................................................................................................... 51
5. Results ....................................................................................................................................... 53
5.1. ROE .................................................................................................................................... 53
5.2. ROA ................................................................................................................................... 54
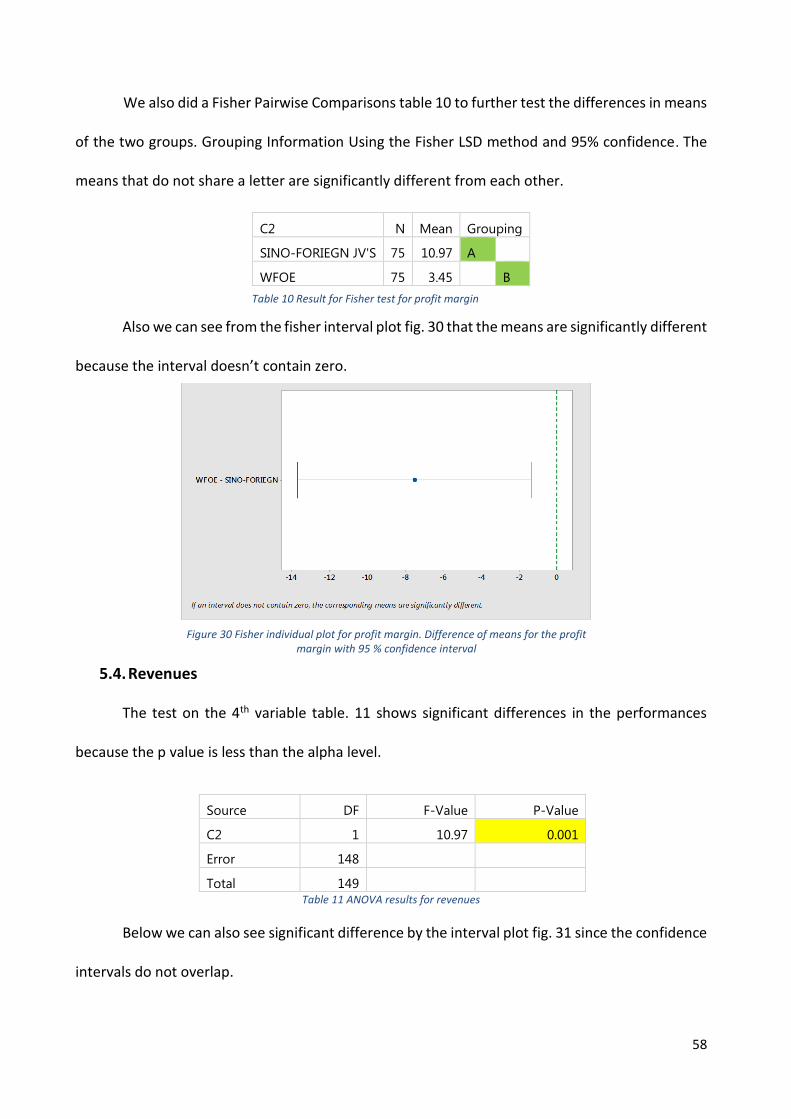
5.3. Profit Margin ..................................................................................................................... 56
Page 6
6
5.4. Revenues ........................................................................................................................... 58
5.5. Gross Profit ....................................................................................................................... 60
6. DISCUSSION AND CONCLUSIONS .............................................................................................. 63
APPENDIX .............................................................................................................................................. 66
REFERENCES .......................................................................................................................................... 69
Page 7
7
Table of Figures Figure 1 Dunning, 1993: Dunning & Lundan, 2008 ............................................................................... 12
Figure 2 Anderson & Gatigon (1986)'s transaction cost propositions .................................................. 16
Figure 3 Exposure of modes of entry to different types of risk ............................................................ 18
Figure 4 Resource based theory model of SCA. .................................................................................... 23
Figure 5 Identification of resources and capabilities. ........................................................................... 25
Figure 6: China FDI’s .............................................................................................................................. 32
Figure 7: China R&D expenditure %age ................................................................................................ 33
Figure 8 Contracted FDI inflows to China by registration type, 1992-1999 (in 100 million USD) ........ 37
Figure 9 Utilized FDI inflows to China by registration type, 1997-2006 (in 100 million USD) .............. 37
Figure 10 Market Value & Forecast for Chinese pharmaceutical industry overall ............................... 40
Figure 11 Sales of generics drugs in China ............................................................................................ 41
Figure 12: Sales of Patented drugs in China ......................................................................................... 42
Figure 13: R&D expenditures in pharma ............................................................................................... 43
Figure 14 Selected variables ................................................................................................................. 48
Figure 15: Average ROE comparison ..................................................................................................... 48
Figure 16 Average ROA comparison ..................................................................................................... 49
Figure 17 Average Profit Margin Comparison ...................................................................................... 50
Figure 18 Average Operating Revenues Comparison ........................................................................... 50
Figure 19 Average Gross Profit Comparison ......................................................................................... 51
Figure 20 Interval plot for ROE ............................................................................................................. 53
Figure 21 Box plot of ROE values ......................................................................................................... 53
Figure 22 Interval plot for ROA ............................................................................................................. 54
Figure 23 Boxplot for ROA .................................................................................................................... 55
Figure 24 Normal probability plot for ROA ........................................................................................... 55
Figure 25 Test for equal variance for ROA: Factors vs Dependent variable. Multiple comparison
interval for the std. Deviation, Alpha = 0.05 ......................................................................................... 56
Figure 26 Interval plot for Profit Margin ............................................................................................... 56
Figure 27 Box plot for Profit Margin ..................................................................................................... 56
Figure 28 Normal probability plot for Profit Margin ............................................................................. 57
Figure 29 Test for equal variances for profit margin: Factors vs Dependent variable. Multiple
comparison interval for the std. Deviation, Alpha = 0.05 ..................................................................... 57
Figure 30 Fisher individual plot for profit margin. Difference of means for the profit margin with 95 %
confidence interval ............................................................................................................................... 58
Figure 31 Interval Plot for revenues ..................................................................................................... 59
Figure 32 Normal probability plot for Revenues .................................................................................. 59
Figure 33 Test for equal variances for Revenues: Factors vs Dependent variable. Multiple comparison
interval for the std. Deviation, Alpha = 0.05 ......................................................................................... 59
Figure 34 Fisher individual plot for Revenues. Difference of means for the profit margin with 95 %
confidence interval ............................................................................................................................... 60
Figure 35 Interval Plot for gross profit .................................................................................................. 60
Figure 36 Test for equal variances for gross profit: Factors vs Dependent variable. Multiple
comparison interval for the std. Deviation, Alpha = 0.05 ..................................................................... 61
Figure 37 Fisher individual plot for Revenues. Difference of means for the gross profit with 95 %
confidence interval ............................................................................................................................... 61
Page 8
8
List of Tables
Table 1 Summary of data sorting .......................................................................................................... 45
Table 2: ANOVA results for ROE ........................................................................................................... 53
Table 3 ANOVA results for ROE ............................................................................................................. 54
Table 4 Comparison of means for ROA. Pooled StDev = 12.6233 ........................................................ 54
Table 5 Comparison of Std. Dev for ROA .............................................................................................. 56
Table 6 Results for Levene test for ROA ............................................................................................... 56
Table 7 ANOVA results for profit margin .............................................................................................. 56
Table 8 Comparison of mean for profit margin .................................................................................... 57
Table 9 Results for Levenes test for profit margin ................................................................................ 57
Table 10 Result for Fisher test for profit margin .................................................................................. 58
Table 11 ANOVA results for revenues................................................................................................... 58
Table 12 Comparison of Means for revenues ....................................................................................... 59
Table 13 Results for Levenes test for revenues .................................................................................... 59
Table 14 Results for fishers test for revenues ...................................................................................... 60
Table 15 ANOVA results for Gross profit .............................................................................................. 60
Table 16 Results for Levenes test for Gross Profit ................................................................................ 61
Table 17 Comparison of Means ............................................................................................................ 61
Table 18 Results for fisher test for gross profit .................................................................................... 61
Table 19 Summary of the results .......................................................................................................... 62
Table 20 Stata Results for Operating Revenues .................................................................................... 66
Table 21 Stata ANOVA Results for Operating Revenues ....................................................................... 66
Table 22 Stata Results for ROE .............................................................................................................. 66
Table 23 Stata ANOVA Results for ROE ................................................................................................. 66
Table 24 Stata results for ROA .............................................................................................................. 66
Table 25 Stata ANOVA Results for ROA ................................................................................................ 67
Table 26 Stata results for Profit Margin ................................................................................................ 67
Table 27 Stata ANOVA Results for Profit Margin .................................................................................. 67
Table 28 Stata results for Gross Profit .................................................................................................. 67
Table 29 Stata ANOVA Results for Gross Profit .................................................................................... 67
Table 30 Summary of stata results ....................................................................................................... 68
Page 9
9
1. Executive summary
China is the world's second largest pharmaceutical market after the US and also is the
largest exporter of Pharmaceutical ingredients and preparations. Since it is also the most
populated country in the world and it has a high rate of ageing population, the healthcare
industry is one of the most important in China. This is also the key focus of the Chinese
government, which has launched several reforms in this sector over the years. Due to the
importance of this industry, many multinational firms have been looking to gain access to the
vast pharmaceutical market of China and for this reason they have to face many economic
decisions in order to enter the market. The question that needs to be answered is: what are
the factors that make Chinese pharmaceuticals so much competitive in the world? It is
important to trace back to 1980’s when China started to open its economy and allowed
foreign firms to enter the market but with forced joint ventures. However, later in 2001, China
entered the WTO and allowed firms to enter with wholly foreign owned subsidiaries. Is the
strategy of forced joint ventures adopted by China during the early stage of opening its
economy, the main reason why Chinese market has been so successful in becoming the
largest producer of pharmaceuticals in the world? In order to answer this question we have
focused on the data for 2013 for several firms in China and see the effects of ownership on
the performance of pharmaceutical companies, in order to understand whether significant
differences exist.
We begin our work by reviewing Dunning’s theory on the reasons why companies
chose to invest abroad. The primary reasons can be classified into four groups. Firstly,
companies invest abroad in search of markets to increase their sales or competitive position
known as “Market Seeking FDI”. Secondly, we have “Efficiency Seeking” FDI where companies
Page 10
10
invest abroad to exploit economies of scale & scope as well as risk diversification. “Resource
Seeking” FDI is undertaken to access resources in a locations which can generate better
profitability for the companies. Lastly, “Strategic Asset Seeking” FDI is undertaken to attain a
long term competitive advantage.
After that, we focus our attention on theories that describe the firm’s choice of
operation mode beginning with Transaction Cost Economics (TCE). According to TCE, firms
incur transaction costs when they operate using market mechanisms due to market
imperfections such as incomplete contracts, bounded reliability, and opportunism.
Eventually, the firm’s decision on where to define the organizational boundaries in order to
reduction the transaction costs would depend on internal and external uncertainty
surrounding the transactions, on the asset specificity of the transactions and their frequency.
The Eclectic theory suggests that firms invest abroad when they believe they are going
to exploit their ownership advantages, which refer to asset advantages and minimization of
transaction costs, location advantages, referring to resource availability, and finally
internalization advantages, referring to reduction of transaction & co-ordination costs. When
a firm’s Ownership advantage refers to a large firm size, companies can afford more easily to
choose to operate as a WFOE whereas; when it refers to the firm’s international experience,
firms chose Joint Ventures when it is low and vice versa. As regards the Location advantages,
firms tend to prefer WFOE when the host country market size is big enough to exploit
economies of scale, while when the host country is risky or culturally distant, firms prefer
Joint Venture. Internalization advantages may refer to contractual risk, which, when high,
may lead to firms operating as a WFOE.
Page 11
11
The Resource Based Theory views firms as a bundle of resources which are either
valuable, rare, inimitable or non-substitutable. When a firm expands its operations abroad it
does so only in a location where the value attained from these resources remains intact thus
enabling the firm to retain its competitive advantage and will also chose between market
transactions or a higher control mode for its operation likewise.
Finally, the institutional theory says that in order to attain legitimacy, organizations
adopt structures that are isomorphic to other organization and divides isomorphic pressures
into normative, cognitive & regulative pressures. When the regulatory conditions in a host
country are not welcoming, firms prefer Joint Ventures. Similarly, as per normative pressures
if the host country is very different in terms of culture and values, firms would prefer to
operate as Joint Ventures. As per cognitive pressures, firms would most likely chose a mode
of operation similar to the one chosen already in the past by other competitor firms.
Therefore, considering the theories mentioned above we conduct an empirical
analysis to determine whether foreign companies financially perform better as Joint Venture
with a local partner or as WFOE in the pharmaceutical industry in China. Our empirical analysis
shows significant difference in the performance of Sino-foreign JVS’ and WFOE’s and also
shows that JV’s are performing considerably better than the WFOE when tested with different
financial variables. Our thesis thus develops a firm conclusion that future foreign firms trying
to enter the pharmaceutical market in China must look for a Sino-Foreign joint venture in
order to guarantee optimum financial performance and also concludes the fact that the
forced joint venture strategy of China has had no negative impact on the performance of
foreign firm in this specific sector, instead it has been favourable for the foreign firms.
Page 12
12
2. Theoretical framework
In this section we present a detailed overview of the work already done on the topic
related to foreign direct investments, firm’s behaviour related to the choice of entry mode
and the theories that focus on economics of multinational enterprises.
2.1. Sources
We performed a thorough and thoughtful research by reading different academic
papers involving past studies on the topic, published in journals and key insights, taken from
them, are used to develop better conclusion of our research work. Articles published in
journals have also been considered mainly due to the need of information regarding Chinese
pharmaceutical market and Chinese market in general. There have also been some
complexities in doing the research, which involves the study of entry modes in China and
understanding the basic market dynamics due to the lack of information available about entry
modes.
The key words that we employed for our research were: Sino-Foreign Joint ventures, Wholly
foreign owned enterprises, Entry modes and performance, control and performance of
multinational firms.
2.2. Motives for FDI
There are several reasons why companies chose to invest abroad. Their motives can
be classified as the following:
Market Seeking
Resource Seeking
Efficiency Seeking
Strategic asset
Seeking
Figure 1 Dunning, 1993: Dunning & Lundan, 2008
Page 13
13
2.2.1. Market Seeking
This approach is used by firms when they want to provide goods and services in a
foreign market by being locally present there instead of exporting (Nachum & Zaheer, 2005;
Brouthers, Gao & McNicol, 2008). It enables a firm to increase its sales in a target market
(MacCarthy & Atthirawong, 2003) and protect its competitive position (Dunning, 1993). When
a firm’s customers or suppliers relocate to a foreign market, the firm follows them by market
seeking FDI.
On the other hand, they may also make market seeking FDI in markets or locations
which are unique and the firm has an opportunity to adapt to the local needs (Dunning &
Lundan, 2008). Market seeking FDI is also justified by lower production and transaction costs,
which allows firms to stay competitive (Dunning and Lundan, 2008). Further factors include
the GDP growth, GDP per capita and the market size of the target market (Kudina and
Jakubiak, 2008)
2.2.2. Efficiency seeking
The main benefits of efficiency seeking FDI is to attain economies of scale and
economies of scope along with risk diversification (Robson, 1993 and Dunning and Lundan,
2008). Another aspect relates to attaining efficiency by assigning labour intensive activities to
developing countries and assigning value added activities to developed countries with more
relevant resources (Kim, et al., 1993; Dunning & Lundan, 2008).
Page 14
14
2.2.3. Resource seeking
Firms mainly seek two types of resources in the target country. They may seek physical
resources like precious minerals or metals available at a lower cost whereas the other reason
may be to seek cheap labour. Therefore the main objective of resource seeking FDI is to incur
lower costs and increase profits (Dunning & Lundan, 2008).
2.2.4. Strategic Asset Seeking
Strategic asset seeking FDI is carried out by firms to achieve long term competitive
advantage over its competitors (Dunning and Lundan, 2008). Firms may specifically seek
technology, marketing and management expertise in the foreign market (Makino, 2002).
These not only ensure that the firms gain competitiveness and ownership advantages but also
ensures that they do so before their competitors (Dunning and Lundan, 2008 and Dunning,
1993)
Following are the theories that discuss the choice of entry mode and operation for foreign
companies:
2.3. Theories related to entry modes
2.3.1. Transaction Cost Economics
Transaction cost economics is the most widely used theoretical framework to
understand the choice between various organizational forms as it discusses the way firms
organize their transactions with other firms and so eventually at what point do they draw
organizational boundaries.
Transaction costs are costs that occur when goods and services are provided through
the market rather than through a firm and are a result of market imperfections. They can be
Page 15
15
direct or indirect costs. The direct costs would refer to the ‘costs of negotiating and concluding
a separate contract for each transaction’ and ‘discovering what the relevant prices are’
(Coase, 1937). Indirect costs refers to the opportunity costs of a suboptimal factor allocation.
In addition it was argued that transaction costs occur also due to opportunistic
behaviours by the market participants and due to “bounded rationality” (Oliver Williamson
1975, 1985; Simon, 1956). Business partners may be expected to behave opportunistically,
which is why comprehensive contracts should be enforced but this is not possible to
implement as “bounded rationality” limits the completeness of the contracts resulting in
market inefficiencies.
According to Williamson transaction costs are especially relevant to transactions
which involve uncertainty, low frequency and asset specificity. Uncertainty occurs when it is
difficult to predict the performance of a business partner or when the events involving an
exchange cannot be predicted to be included in the contract. Transaction frequency refers to
how frequently the exchanges occur whereas asset specificity relates to the investments
made which are particular to a transaction and cannot be deployed elsewhere in the future
(Klein, Crawford and Alchian, 1978).
The internalization theory is based on the same logic as Transaction cost economics
and explains that multinational enterprises prefer to have their own subsidiaries in foreign
countries due to the costs and benefits arising from it. Along with other factors, it also focuses
on information asymmetries as a market imperfection. According to this, non-specificity of
knowledge transfer cause market inefficiency as the other party may use knowledge, which
is not protected by property rights for its own benefit (Buckley and Casson, 1976)
Page 16
16
Another recent advancement to the theory argues that “bounded reliability” is more
appropriate than opportunism in Williamson’s framework as opportunistic behaviour only
occurs ex post (Alain Verbeke and Nathan Greidanus’, 2009) and therefore cannot be a
determinant of entry choice and instead it is the anticipation of such behaviours along with a
lack of trust (Casson, 1995).
2.3.2. Transaction cost economics in case of Foreign Expansion
Transaction costs become even more relevant when firms expand their business
abroad incurring large cultural, geographic, economic and administrative differences. In
order to apply this theory to joint ventures, Anderson and Gatignon (1986) use Williamson’s
framework to explain the determinants of a firm’s high control (wholly owned subsidiary) vs
a low control (non-exclusive, non-restrictive contracts) vs intermediate control (joint
ventures) entry mode preference. These are summarized in the table below:
Figure 2 Anderson & Gatigon (1986)'s transaction cost propositions
Page 17
17
Several empirical studies have been done based on Transaction Cost Economics
constructs including asset specificity, internal uncertainty and external uncertainty to
demonstrate which mode of entry or organizational form is suitable under what conditions.
a. Asset Specificity
The most common proxy to this is the ratio of R&D to total sales or advertising
expenditure to total sales. (Hennart and Larimo, 1998). The results however have been
varying. Some studies suggest a high level of R&D investment to be related to Wholly Owned
subsidiary as a preferred organizational form. (Gatignon and Anderson, 1988; Padmanabhan
and Cho, 1996; Delios and Beamish, 1999; Makino and Neupert, 2000; Hennart and Larimo,
1998; Chen and Hu, 2002; Dikova and Witteloostuijn, 2007). Some studies find insignificant
relationships (Gomes-Casseres 1989, 1990, Hennart ,1991, Taylor et al. 1998, Meyer 2001,
Brouthers, 2002 and Chen and Hennart, 2002) and one of the studies suggests that high level
of R&D is positively associated with Joint Ventures (Palenzuela and Bobillo , 1999). As for a
high advertising intensity, some studies suggest positive relationship to WFOE (Gatignon and
Anderson 1988, and Gomes-Casseres; 1989, 1990) whereas some find no relation (Kogut and
Singh 1988, Hennart 1991 and Chen and Hu, 2002)
a. Several other studies used survey-based measure and found better conclusions. One
study suggests that when the level of tacit knowledge is high, firms prefer WFOE (Kim
and Hwang 1992). Another study finds that asset specificity is correlated to the choice
of WFOE especially in the manufacturing and service firms (Brouthers et al. 2003 and
Brouthers and Brouthers, 2003).
Page 18
18
b. External Uncertainty
The majority of studies that focused on this aspect have considered the relation
between country risk and the entry mode choice. Country risk includes risk associated with
social, political, economic stability, risk associated with nationalization policy of governments
or the risk of converting profits (Brouthers and Brouthers, 2003). It may also be associated
with perceived volatility and diversity of a transaction (Klein et al., 1990). According to a few
studies, a high country risk leads to preference of WFOE (Gatignon and Anderson 1988 and
Agarwal 1994) whereas the majority of other studies conclude the opposite (Klein et al. 1990,
Brouthers 2002, Brouthers and Brouthers 2003, Quer et al. 2007). Some studies also found
no co-relation between the two (Erramilli and Rao, 1993).
Figure 3 Exposure of modes of entry to different types of risk
Page 19
19
c. Internal Uncertainty
Internal uncertainty is caused by opportunistic behaviour and limitations due to
bounded reliability. The most commonly used measures to determine entry choices are
international experience and cultural differences (Hennart, 1991). Few studies suggest a
positive relationship between a high cultural distance and Joint Ventures as an entry mode.
(Gatignon and Anderson, 1988; Erramilli and Rao, 1993; Agarwal, 1994; Hennart and Larimo,
1998; Quer et al., 2007) whereas some suggest the opposite (Chang, Kao, Kuo and Chiu, 2012
and Lopez-Duarte and Vidal-Suarez, 2013).
As for the international experience, some studies suggest positive relationship
between a high level of international experience and WFOE (Agarwal and Ramaswami 1992,
Chu and Anderson 1992, Contractor and Kundu 1998 and Kuo et al., 2012) whereas a few
suggest the opposite (Erramilli, 1991 & Chiao et al., 2010) and some do not find any relation
(Kogut and Singh 1988, Agarwal 1994 & Padmanabhan and Cho, 1996)
2.3.3. Eclectic Theory
The Eclectic Theory was developed by a British Economist Dunning (1977, 1979, and
1988) where he not only built upon the Transaction Cost Economics theory but also added
Location and Ownership advantages to it. The theory addresses the gaps left by other works
on the same topic and defines a solid framework which can explain well the FDI related
decisions of various firms (Zhao & Decker, 2004; Goodnow, 1985). In Dunning’s own word,
the objective was to “offer a holistic framework by which it was possible to identify and
evaluate the significant factors influencing both the initial act of foreign production by
enterprises and the growth of such production” (Dunning, 1988). The theory suggests that a
firm would engage in FDI if it has at least three advantages that includes the ownership (asset
Page 20
20
advantage and minimization of transaction costs), location (resource availability in a specific
location) and internalization (reduction of transaction & co-ordination costs) advantages.
Below we highlight what each of these advantages mean and then we illustrate how they
would relate to the operation mode choice (WFOE or JV) of foreign firms.
2.3.3.1. Ownership Advantages
This suggests that firms must possess some kind of comparative advantage in their
target market in order to expand their operations to a foreign country (Dunning, 1981;
Tolentino, 2001). They can be described as “any kind of income generating assets, which make
it possible for firms to engage in foreign production” (Dunning, 1991). These ownership
advantages can be divided into two types: asset advantages and transaction cost minimizing
advantages. Asset advantages include technology specific to the firm, manpower, knowledge,
patents, product differentiation achieved through branding etc (Tan & Vertinsky, 1996;
Dunning, 1980). On the other hand transaction cost minimizing advantages relate to product
diversity, firm size, learning experience & synergies in production, purchasing, marketing,
R&D, finance etc. (Dunning, 2000). The following ownership specific advantages can explain
firms’ operation mode choice:
• Firm Size
In order to expand operations in a foreign country, a firm needs a large amount of
capital and resources to pay for the high fixed and variable costs in the foreign country (Talay
and Cavusgil 2008). A large firm size is therefore necessary to absorb that cost (Buckley and
Casson 1998). Empirical studies show that a large firm size is positively related to selecting
WFOE as the operation mode choice (e.g., Talay & Cavusgil, 2008; Dadzie, 2012). However it
Page 21
21
can be predicted that some firms might not be able to do so due to restrictive nature of the
market.
• Firm’s international experience
A firm can incur several risks and uncertainties translating into high costs when
expanding its operations abroad. This can be a real threat for some of the firms (Agarwal and
Ramaswami, 1992). However, for firms that already have experience, these might be less
significant (Buckley and Casson, 1985). Therefore, for such firms, the requirement for having
a local partner reduces, meaning they will be less likely to choose Joint venture or other
alliances as an operation mode (Erramilli, 1991). Studies also show that firms with high level
of international experience are inclined towards Wholly Foreign Owned Subsidiaries as their
mode of operation (e.g., Dikova & Willeloosuijn, 2007; Lee & Sukoco, 2010; Dadzie, 2012).
2.3.3.2. Location Advantages
Location specific advantages relate to the advantages a firm may have in carrying out
its operations in one particular location over another. When firms go abroad, they should
chose attractive markets where they can gain better profits. These advantages can be related
to the economic, legal, political, cultural environment resulting in lesser costs and higher
revenues for a firm in that location (Dunning, 1988). The advantages specifically include the
market potential in terms of size and growth, endowment factors, supply sources, logistics
costs, physical distance, trade barriers etc. (Caves 1996; Caves & Pugel, 1982). The following
ownership specific advantages can explain firms’ operation mode choice:
Page 22
22
• Market Size
A large market size means a firm has more potential for obtaining economies of scale
and earning higher profits (Wheeler and Moody, 1992). Studies show that firm prefer to
operate as a WFOE in large markets since they are able to establish market presence as well
as exploit economies of scale (e.g., Chung & Enderwick, 2001; Nakos & Brouthers, 2002).
• Host country risk
This refers to risk related directly to the economic and political environment in a country
(Agarwal and Ramaswami, 1992 and Dadzie, 2012). A host country with a risky economic and
political environment may not offer stable conditions for continued profit generation of a
foreign company due to which foreign companies may hesitate to operate solely without a
local partner (Kim and Hwag 1992). Studies subsequently show low level of commitment by
firms in countries with high risks (e.g., Brouthers & Brouthers, 2000; Tahir & Larimo, 2006).
• Cultural distance
This refers to variations in values and belief system of the host country and the home
country of the firm (Chen and Hu, 2002). High cultural distance relates directly to increased
transaction costs for the firm (Puck, Holtbrügge and Mohr, 2009) as well as difficulties in
managing operations abroad (Jung, 2004). Studies therefore show that firms do not prefer to
operate as WFOE in case of a high cultural difference (Yiu & Makino, 2002). In contrast to this,
some studies reveal that in fact firms prefer to operate as WFOE in case of a high cultural
difference (Padmanabhan & Cho, 1996)
Page 23
23
2.3.3.3. Internalization Advantages
In order to exploit the ownership advantages in a foreign country whenever the costs
of using markets are more than the costs of producing internally, firms would prefer to
internalize their operations within the firm (Dunning & Kundu, 1995). Therefore
internalization advantages suggest that whenever there are risks or uncertainty related to
buyers, suppliers, government policies, the production quality & standards need to be
protected, high level of control needs to be exercised then it is preferable for firms carry out
all activities within the firm hierarchy rather than involving other modes of operation
(Dunning, 1993 & Dadzie, 2012) .The following ownership specific advantages can explain
firms’ operation mode choice:
• Contractual Risk
This refers to the costs incurred in writing and enforcing contracts, lack of licensed
protection, patents, risks of transferring specific knowledge etc. (Dadzie, 2012). Therefore in
order to avoid contractual risk, firms internalize their operations incurring no transaction
costs, preventing unwanted spread of knowledge, avoiding costs of ensuring property rights
and controlling quality (Dunning, 1993). It is crucial for firms investing abroad to protect their
knowledge (Hill, Hwang & Kim, 1990). However, in case it is costly to protect knowledge, a
lack of doing so may cause a firm to prefer WFOE as a mode of operation (Dadzie, 2012)
2.3.4. Resource Based Theory
Figure 4 Resource based theory model of SCA.
Source: Barney & Clark (2007, p. 69)
Page 24
24
This theory looks at the firm as a bundle of resources (Kor & Mahoney, 2004). The
resource based view offers an “inside-out” view on reasons why firms are successful or
unsuccessful without considering the external market conditions (Dicksen, 1996). It illustrates
how a firm’s resources are linked to attaining a sustainable competitive advantage over its
competitors and can be considered as an alternative to Transaction Cost Economics to explain
firm integration (Kogut & Zander, 1993). According to resource based view, a firm’s
performance and growth is determined by the kind of resources it has (Kogut & Zander, 1993).
Resources may be classified into organizational, human and physical resources
(Barney, 1991; Amit and Shoemaker, 1993). According to the theory, in order to establish and
maintain competitive advantage, a firm must possess resources which are either valuable,
rare, inimitable or non-substitutable (Barney, 1991). Valuable resources are those which
enable a firm to exploit opportunities in the market or reduce threats thereby adding strategic
value to the firm. Rare resources are the resources that the competitors cannot easily find.
Inimitable means that the resource cannot be copied easily by any competitor. Non-
substitutable refers to resources that cannot be substituted so a competitor cannot use a
substitute and attain the same advantage.
The resource based view examines firms’ choice of operation mode using the main
aspects surrounding the transfer of competitive advantage to the foreign market (Sharma and
Erramilli, 2004). It considers the probability that the firm will be able to establish its
competitive advantages and transfer it to production and marketing operations in the host
country. The framework focuses on transferring of resources to the foreign market while
keeping their value intact (Sharma and Erramilli, 2004) and therefore firms will chose
locations where this is attainable. If the firm cannot do so effectively and efficiently, then it
Page 25
25
will chose modes of operation with higher control whereas in the other case it will prefer the
use of market transactions.
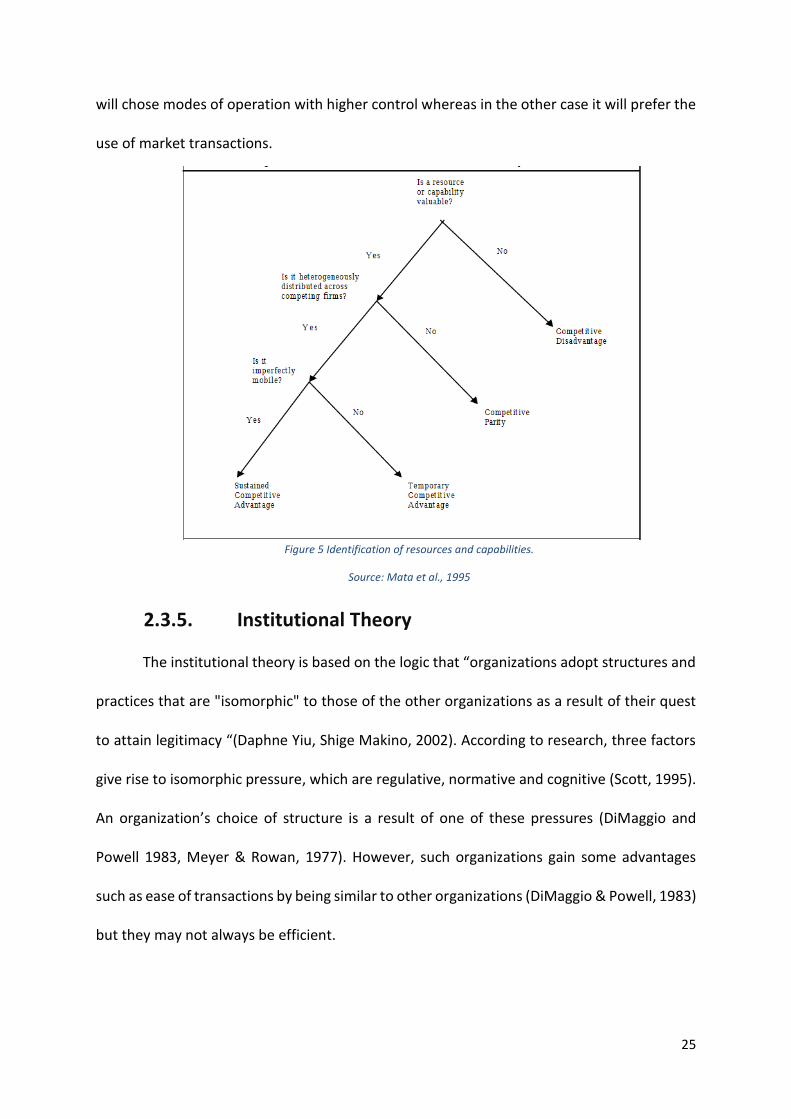
2.3.5. Institutional Theory
The institutional theory is based on the logic that “organizations adopt structures and
practices that are "isomorphic" to those of the other organizations as a result of their quest
to attain legitimacy “(Daphne Yiu, Shige Makino, 2002). According to research, three factors
give rise to isomorphic pressure, which are regulative, normative and cognitive (Scott, 1995).
An organization’s choice of structure is a result of one of these pressures (DiMaggio and
Powell 1983, Meyer & Rowan, 1977). However, such organizations gain some advantages
such as ease of transactions by being similar to other organizations (DiMaggio & Powell, 1983)
but they may not always be efficient.
Figure 5 Identification of resources and capabilities.
Source: Mata et al., 1995
Page 26
26
We highlight below each of the factors that lead to isomorphic pressure and examine
how they affect an organization’s mode of operation.
• Regulatory Institutions
Regulative elements refer to rules and laws in a particular society that determine
stability and lay the foundations for organization and industry action (North 1990, Scott and
Meyer 1994; Williamson 1975, 1991). Often times, foreign countries experience more
institutional pressure from the governments in the host country (Poynter, 1985). Therefore
gaining legitimacy in the market is one the primary target for foreign companies. Studies
show that in such scenarios it may be necessary for companies to operate as Joint Ventures
with local partners (Beamish, 1985; Makino & Delios, 1996; Shan & Hamilton, 1991). If the
regulatory conditions of a host country are not very welcoming for foreign firms, they form
joint ventures in order to reduce the liability of foreignness. Moreover forming joint ventures
allows foreign firm to learn about the government policies and infrastructure from their local
partners. Studies also show that firms decide to operate as joint ventures when the host
government maintains a restrictive environment (Contractor, 1990; Fagre & Wells 1982,
Gomes-Casseres, 1990; Lecraw, 1984).
• Normative Institutions
A firms must also take into account the social norms and acceptable economic
behaviours (Zukin & DiMaggio, 1990). Normative institutions refer to understanding of “logic
of appropriateness” (March, 1981) which includes the culture, social customs, norms & values
of the host country. A foreign company is more likely to experience social difficulties in a host
country compared to its local peers (Kostova & Zaheer, 1999). Many failures in the past can
be attributed to normative factors such as Matsushita and MCA (Music Corporation of
Page 27
27
America) merger (McGarvey, 1997). It is thus important for foreign firms to meet social
expectations to survive in the host country (D'Aunno et al. 1991; DiMaggio and Powell, 1991).
This however is not simple to achieve as cultural distance poses a significant hindrance. High
cultural difference means that it will be more difficult for the foreign company to understand
the host country environment. Another factor to overcome can be cultural ethnocentricity. If
the host country has an ethnocentric culture then it can be hard for foreign firms to adjust. If
foreign firms form Joint Venture with local firms having a good social reputation, these
barriers can be overcome and firms can gain social capital (Coleman, 1988). Overall, Joint
Ventures can help companies avoid social problems and use their relationship with their
partners to their advantage by attaining social legitimacy, access to economic resources and
relevant business contacts. Studies also show that when cultural distance is large, foreign
firms choose Joint Ventures as their operation mode. (Agarwal 1994, Kogut & Singh, 1988).
• Cognitive Institutions
The mode of operation a firm chooses often depends on the cognitive mind-set of the
firm. According to studies, people categorize social events based on cognitive structures
(Markus & Zajonc, 1985). "Representativeness heurism," refers to instances where the one’s
decisions are based on their decisions related to similar events, which are stored in their
cognitive memory (Tversky & Kahneman, 1974). Such judgements transform into taken-for-
granted beliefs thereby causing decision makers to overlook other alternatives available
(DiMaggio & Powell 1991; Greenwood & Hinings, 1996). Firms may follow two ways to
achieve cognitive legitimacy:
Page 28
28
a) External Mimicry
This refers to when firms take decisions based on what other firms in the past have
done. Decisions regarding efficiency may also be taken by observing the performance of
other firms (Roberts & Greenwood, 1997). On the other hand, local constituents understand
new foreign firms by relating them to older firms and when they evaluate their legitimacy
they refer to legitimacy of other firms belonging to the same cognitive category (Kostova &
Zaheer, 1999). Thus foreign firms will choose a mode that is most common in the home
country already, as studies show that firms imitate other firms already present in the host
country based on how many firms are already operating in a certain mode and how
comparable they are to them in terms of size & status (Amburgey & Miner, 1992; Haunschild
& Miner, 1997; Haveman, 1993; Korn & Baum, 1999).
b) Internal Mimicry
This refers to when firms make decisions based on what they have been doing
themselves in the past. In a multinational enterprise, practices may be transferred often to
subsidiaries by the parent. So if a subsidiary is able to achieve a high level of legitimacy in one
country, the parent will transfer this into cognitive structure of the entire multinational
enterprise. Organizational inertia theory suggests that firms institutionalize activity patterns,
which eliminates the possibility of any changes (Romanelli & Tushman, 1986). Therefore, it
can be concluded that firms repeat what they have already done in the past successfully.
Page 29
29
2.4. Literature related to the performance measurement due to
ownership structure and control
We can now focus on the literature related to the effects of ownership and control on
the performance of firms entering into foreign countries. Not a lot of work has been done to
measure empirically the performance of these types of entry modes and which one is better,
since the availability of complete and reliable data is of paramount importance in this case.
A study done by Sea, Jaiho and Jon done in 2013 analysed the performance of IJV’s
and WFOE using data based on Chinese firms and discovered that there is a steady
improvement in the performance of converted wholly owned subsidiaries (once converted
from a joint venture to wholly owned subsidiary), as measured by ROA and Operating ROA,
which far exceeds that of continuing joint ventures. Their results suggest that the increase in
the performance due to the conversion is associated with the increased intangible and fixed
assets. This research proves the transaction cost theory, that firms perform better when the
go with a wholly owned subsidiary.
Another study worth mentioning here relates to the financial performance
measurement of Sino-foreign JV’s vs WFOE in China (Yadong Luo and Min Chen, 1995). The
findings suggest that the JV’s perform better than the WFOE in terms of gross margin ratio
while WFOE outperform JV’s in operating margin ratio which directs to the fact the WFOE
have higher costs of goods sold and lower level of operation and administrative costs, which
seconds the transaction cots theory. The fact is that it all depends on the company’s aims and
targets to enter the Chinese market. If the firm aims to have synergies between the assets
and risk reduction through globalization then WFOE is the best way to enter. Second, if the
Page 30
30
strategic objective of the investor entering the Chinese market is to pursue local market share,
the IJV is a better option than the WFOE (Yadong, Luo and Min Chen, 1995).
A study based on Japanese firms based on ownership structure of the firms found out
that there are significant differences between the performance of JV’s and WFOE. Study
showed that performance of WFOE tend to be better than JV’s (Woodcock, beamish &
makino, 1994). The study of Woodcock is based on measuring performance by using empirical
(financial) data of the firms and is not only based on theoretical data. The study of Woodcock
also supports the earlier work (Li and Guisinger, 1991) modes of entry, forms of foreign
ownership, and national culture are found to have effects on the failures and success of
foreign-controlled firms in the United States.
Study done by (Mario Henrique Ogasavara, Yasuo & Hoshino, 2004) is based on the
Japanese foreign subsidiaries in Brazil, counters the study done by Woodcock. The findings
suggest that Japanese–Japanese JV with a partner that has previous experience accumulated
in the local market performed better than WFOE and Traditional IJV. The reason for this
different result is because the study considers non-conventional form of joint ventures as
well.
It is difficult to find further literature measuring empirically the performance
differences of JV’s and WFOE due to lack of resources. So we conclude that more work is
needed to be done on this topic, hence we continue with our research to analyse the
performance differences based on the Chinese Pharmaceutical market.
Page 31
31
3. Introduction to China
In terms of Gross Domestic Product (GDP), China is the world’s second largest
economy after US with GDP amounting to $12.4 trillion in 2017 while GDP per capita was
$8,8361. Ever since economic reforms began in 1978, China has been the world’s fastest
growing economies while a major contributor to that growth has been related with export
and investment. China is the largest industrial producer and manufacturer and these
contribute to 40% of GDP. Due to reforms, China saw a major shift away from state owned
Enterprises and by 2013 they contributed only 45% to the industrial output compared to 80%
in 1978. From 1978 till 2008, the size of Chinese economy multiplied by 50 times with the
annual GDP growth rate at 10%. Initially reforms were focused on agriculture but then were
introduced in services and manufacturing as well.
China has been a member of the World Trade Organization (WTO) since 2001 and is
now the world’s largest trading power while maintaining its status as the main trade partner
for many countries. It is the world’s largest exporter and second largest importer whereas
Manufacturing, Agriculture and tele-communication are the largest industries in China.
The Chinese market can be characterized by high number of manufacturing companies
ranging from heavy-duty commodities such as steel to the most intricate electronics
manufacturing. There has been a growing trend towards research and development in new
sciences and technologies especially in the field of biological sciences. The market can be
characterized by a high influx of foreign investments in the field of R&D. China has maintained
the spot of the most cost effective (Low labour cost) manufacturing in the world since a long
1 (www.stats.gov.cn)
Page 32
32
Figure 6: China FDI’s
Source: Trading economics
time and has attracted a lot of companies across the world. However recently it has lost that
particular spot of low cost labour but still is attracting companies due the availability of
resources, good industrial infrastructure, networks, and a growing economy.
According to a report by China’s Administration for Industry and Commerce (AIC)
released on 14 January 2016, the number of companies in China are recorded to be
77,469,000 and it is expected to grow at an astonishing rate of 11.8% annually. Overall the
industrial production rose by 6.2%2 and the manufacturing economy rose by 6.5% in
December 20173. The trends are very convincing and shows a growing economy and market.
Foreign direct investment in China increased by 7.9 percent year-on-year in January to
December 2017.
The graph in figure 6 shows FDI increment in China for the year 2017 and the current
incremental trend in FDI’s of 2018. According to a recent survey by the world economic forum
the global competitiveness index (based on 12 different pillars ranging from health,
2,3 Trading Economics
Page 33
33
infrastructure and institutions etc.) for China came out to be 5 points out of 7 which confirms
the opportunities for doing good business in China.
It is important to emphasize the growing trend of the R&D in China and that is mainly
the reason a lot of big companies are still looking to shift to China even after it losing the place
for low labor cost. The R&D trend can be seen in the Figure 7. This shows a good commitment
of the Chinese government towards progressive research in future as well.
3.1. Main modes of operation for companies in China
a) Representative Office
A representative office is only meant to represent a foreign company in China for
carrying out activities related to business liaison, product/service introduction, market
research and other indirect business activities. It cannot possess its own capital and is thus
not really considered an independent legal entity.
Figure 7: China R&D expenditure %age
Source: Trading economics: Ministry of commerce of People Republic of China
Page 34
34
b) Branch Office
Only permitted for companies operating in a few sectors, it is also not considered an
independent legal entity in China and the foreign company is directly responsible for the
agreements made by the branch office.
c) State Owned Enterprises
According to the Organization for Economic Co-operation and Development (OECD),
State Owned Enterprises (SOEs) are enterprises where the state has significant control
through full, majority, or significant minority ownership. SOEs mainly operate in specific
sectors such as transport or telecommunications, which can be strategically important for the
government. According to China’s National Bureau of statistics, less than a third of Chinese
industrial output, fixed asset investment, and less than twenty per cent of Chinese real estate
investment is carried on by companies that are controlled by the state.
d) Foreign Invested Partnership Enterprise
It is relatively a new legal form of unlimited liability business entity in China referring
either to two or more than two individuals or foreign enterprises establishing a Partnership
Enterprise or it may refer to a foreign enterprise or individual establishing a Partnership
Enterprise with a Chinese individual or company. This form of entity can enter into contracts
with local and foreign businesses in China and generate revenues.
The structure allows foreign companies to obtain their own import licenses and
develop the sales structure thus making it easy for these companies to buy and export Chinese
products without going through any agent. These can be classified as a type of Wholly Foreign
Owned Enterprise due to similarities in their establishment processes, Legal status, structure
and registration. However, WFOE are fundamentally focused on manufacturing whereas
Page 35
35
while Foreign Invested Partnership Enterprises are established for trading and distributing
goods. Now we are going to focus our attention on Joint Ventures and Wholly Foreign Owned
Subsidiaries which are the main topic of our research.
e) Joint Ventures
Joint Ventures are a “distinct business units owned by 2 or more partner firms” (The
Beamish & Lupton- 2009) or it can be described as an alliance combining resources from more
than one organization to create a new organizational entity ('the child') which is different
from its parents (Inkpen & Beamish -1997). Park, S.H. and Ungson, G. (1997) writes that “an
IJV implies that a firm has to cooperate with a partner with a different cultural background”.
The drivers of international joint ventures are benefits arising from resource pooling, asset
protection, and risk hedging and immediate responses to changes in market. (Anderson and
Gatignon, 1986). Companies also chose Joint Ventures when the host government has
restrictive rules (Fagre &Wells, 1982). The partner commits to providing resources in
exchange for shared management, risks and rewards (Anderson and Gatignon, 1986). Foreign
firms choose to enter China as it is a big potential market for them and sales in China can help
them with their business in other counties. Often the reason also includes competitor
pressure on big multi nationals. Whereas the Chinese government encourages Joint ventures
in order to encourage foreign direct investment, increase jobs, efficiency and open export
opportunities for China. Spill overs from joint ventures include technology, knowledge and
skill transfer to domestic companies (Daniels, 1985).
Several other incentives like tax exemptions, low labour and production costs also
encouraged companies to form joint ventures in China. Introduction of laws favouring joint
Page 36
36
ventures (Child, 1994; Xu and Chew, 1995) and the formation of Special Economic Zones,
lowering transaction costs encouraged these (Tse, 1997).
f) Wholly Owned Foreign Enterprise
Up until 1997, Joint ventures were the most common entry mode for foreign
companies in China after which Wholly Owned Foreign Enterprises started gaining popularity
as an entry mode. A Wholly foreign owned enterprise can be defined as a firm in which 90 %
of ownership is with the foreign company (Luostarinen & Welch, 1990). While a WFOE enables
the firm owner to have more control and power, it also translates to a higher resource
commitment and leads to greater risk and less flexibility. (Hill, 1990). It is encouraged as an
entry mode when the companies going abroad already have such past experiences (Gatignon
& Anderson, 1988; Agarwal & Ramaswami, 1992) and the cultural difference between home
and the host country is not high (Anand & Delios, 1997) .
3.2. Reforms in China
China started receiving a large amount of FDI around 1992 and by 2006, China's FDI
in flows (69.5 billion USD) accounted for 18% of the total FDI flows to developing countries
(Heiwai Tang, 2008). During 1990s wholly foreign owned enterprises (WFOEs) were allowed
but not within special economic zones as per 1986 Law regarding WFOE. Therefore majority
of the FDI was in the form of Sino-foreign Joint Ventures (Cheung, 2007). The figure below
shows that more funds took the form of Joint Ventures till 1998 (for contracted FDI) & till
1999 (for utilized FDI).
Page 37
37
The explanation for Joint Ventures exceeding WFOE after FDI liberalization in 1997 lies
surely within several government policies that favoured Joint ventures over WFOE. According
to Yan and Warner (2002) “at the inception of economic reforms the Chinese government
Figure 8 Contracted FDI inflows to China by registration type, 1992-1999 (in 100 million USD)
Source: China statistical yearbook (Beijing, China statistics press)
Figure 9 Utilized FDI inflows to China by registration type, 1997-2006 (in 100 million USD)
Source: China statistical yearbook (Beijing, China statistics press)
Page 38
38
intentionally packaged EJVs with preferential privileges, while granting WFOEs virtually
nothing but regulations.
WFOE were restricted in specific important industries such as aerospace, nuclear
power generation, chemical, petrochemicals, pharmaceuticals, defense, medicine,
publications, communication, tourism, shipping etc.
Sino-foreign Joint ventures enjoyed tax exemptions as well as access to special
economic zones. They also could operate in sectors WFOE were not allowed to operate in.
There were several other reasons as well related to the governance and market dynamics due
to which foreign firms favored Joint Ventures.
One of these was the uncertain changes in laws and regulations which could only be
understood and dealt with by having a Chinese Partner who could also help with issues related
to procurement or regulatory problems caused due to a lack of Chinese state’s institutional
capacity.
Another factor was that relationships were of significant importance in establishing
a business in China. This is referred to as Guanxi and according to Clarke et al (2008, p. 407),
“discussion of Guanxi links not only relations among entrepreneurs but also relations
between entrepreneurs and government officials.” Therefore, local partners not only could
help understand the local customers better, make local connections in the government but
also enable access to distribution networks or marketing channels (Sutter, 2000).
From the point of view of local firms, they had very limited credit and also preferred
a foreign partner who could financially support them (Haggard and Huang, 2008).
Page 39
39
However in late 90s policies changed and FDI started increasing in the form of WFOE.
The Chinese constitution was changed in 1999 making the infrastructure more favorable for
WFOE. The most significant event was China’s accession into the World Trade Organization
in 2001. The world trade organization is the largest global organization with the goal to
ensure smooth and free trade among its member countries, which is ensured through several
different rules, negotiations and agreements. China officially joined the WTO in November
2001 after 15 years of negotiations, which started with its entry into General Agreement on
Tariff and Trade (GATT). China entered into very challenging negotiations with many other
member countries over several issues such as allowing foreign companies to operate in
sectors where it had competitive edge, the lowering of tariffs and the removal of barriers,
which were initially to protect its domestic industries. Eventually China had to agree to the
demands of other nations and change its economic structure. The Protocol on the Accession
of the People’s Republic of China is a document that contains details about the terms and
conditions China agreed to. Some of the most important amongst those were focused on
making the legal structure more transparent and creating a better infrastructure for foreign
direct investment including the removal of various restrictions, tariffs and other barriers on
FDI. China allowed foreign investors to establish Wholly Owned Foreign Subsidiaries in some
sectors meaning that they would not have to depend on a Chinese partner. For other sectors,
they still require a Chinese partner but can keep majority of the investment share. China
reduced or eliminated technical standards, quotas, import licensing and certification
requirements which allowed for better trade opportunities. According to a U.S. Government
Accounting Office China has “made a substantial number of important, specific commitments
in the rule-of-law-related areas of transparency, judicial review, uniform enforcement of legal
measures, and non-discrimination in its commercial policy” (Tang and Wei-, 2009).
Page 40
40
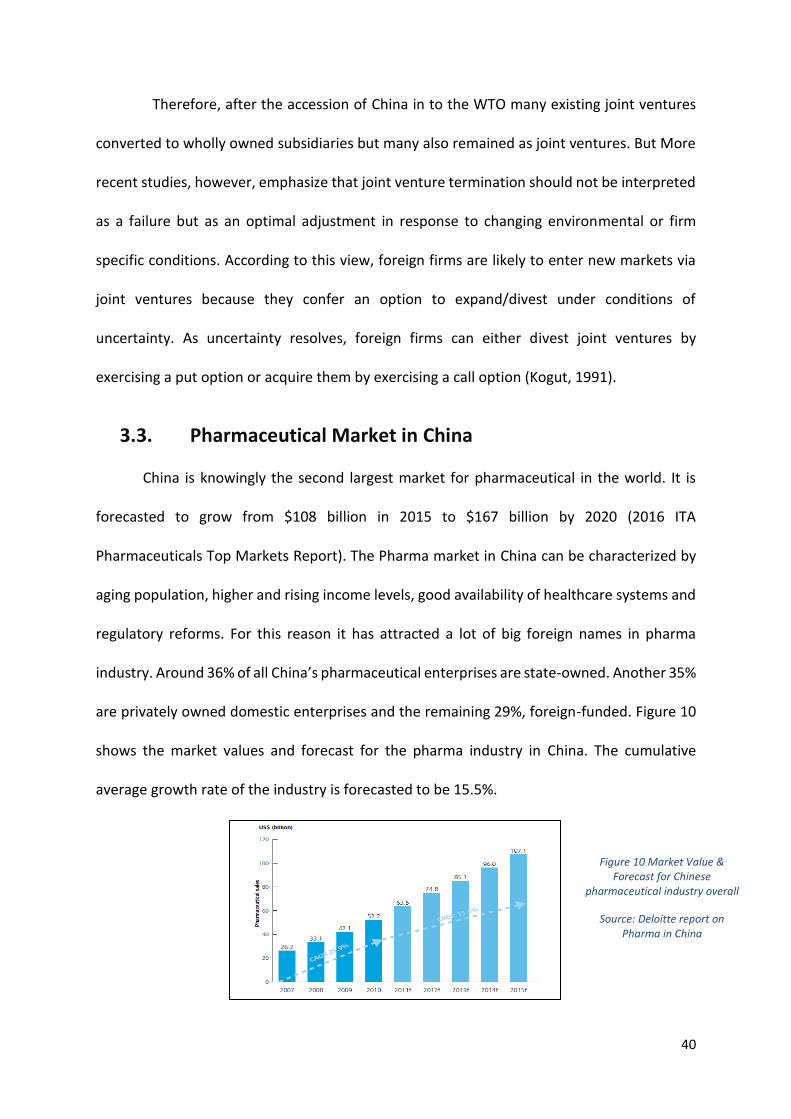
Figure 10 Market Value & Forecast for Chinese
pharmaceutical industry overall
Source: Deloitte report on Pharma in China
Therefore, after the accession of China in to the WTO many existing joint ventures
converted to wholly owned subsidiaries but many also remained as joint ventures. But More
recent studies, however, emphasize that joint venture termination should not be interpreted
as a failure but as an optimal adjustment in response to changing environmental or firm
specific conditions. According to this view, foreign firms are likely to enter new markets via
joint ventures because they confer an option to expand/divest under conditions of
uncertainty. As uncertainty resolves, foreign firms can either divest joint ventures by
exercising a put option or acquire them by exercising a call option (Kogut, 1991).
3.3. Pharmaceutical Market in China
China is knowingly the second largest market for pharmaceutical in the world. It is
forecasted to grow from $108 billion in 2015 to $167 billion by 2020 (2016 ITA
Pharmaceuticals Top Markets Report). The Pharma market in China can be characterized by
aging population, higher and rising income levels, good availability of healthcare systems and
regulatory reforms. For this reason it has attracted a lot of big foreign names in pharma
industry. Around 36% of all China’s pharmaceutical enterprises are state-owned. Another 35%
are privately owned domestic enterprises and the remaining 29%, foreign-funded. Figure 10
shows the market values and forecast for the pharma industry in China. The cumulative
average growth rate of the industry is forecasted to be 15.5%.
Page 41
41
GENERICS PATENTED OTC
The total public and private expenditure on healthcare is expected to rise from $640
billion in 2015 to $1.1 trillion in 2020.
3.3.1. Market Breakdown
The pharma industry in China can be divided into three different categories
a) Generics
Generics is defined as a copy of an ethical (prescription) drug formerly protected by
patents that have now expired. The generics mainly dominate the market with almost 85% of
share from the total sales of pharma in China, as can be seen in the graph below taken from
a report by deloitte.
Generic drugs are the mainstay of China's pharmaceutical industry, and are likely to
remain so for a long time.
Figure 11 Sales of generics drugs in China
Source: Deloitte report on Pharma in China
Page 42
42
b) Patented Drugs
Patented drugs accounted for 20 % of the total sales of pharma in China. That is due
to the improved intellectual property rights in China so more global players were willing to
invest in producing new patented drugs in China. As can be seen from the Figure 12 from 2007
to 2010 the patented drugs sales increased at CAGR of 35.7 % which is very high while it grew
at a rate of 25% during 2010-2015.
c) OTC
Over the counter market consists of drugs that are readily available in the pharmacies
and doesn’t require a prescription by a doctor. The OTC market covers medicines ranging
from mild headaches, cough to flu etc. In 2018, the Chinese OTC pharmaceuticals market is
forecast to have a value of $22,947.1 million, an increase of 41.2% since 2013. The compound
Figure 12: Sales of Patented drugs in China
Source: Deloitte report on Pharma in China
Page 43
43
annual growth rate of the market in the period 2013–18 is predicted to be 7.1% 4. At this rate,
observers at Espicom expect China to become the world's largest OTC market by 2020.
3.4. Research & development in China Pharma
It is important to emphasize on the R&D activities because we need to analyse the
effects of entry modes on the innovative performance of firms in China. As compared to the
other big countries the fig. 13 shows a comparison of pharma expenditure on R&D by other
countries with China.
China has no doubt already became the hot spot of innovation in medicine and a lot
of companies are attracted to it because of the readily available technology (due to years of
technology transfer and innovation), large amount patients, industry knowledge on the
generic drugs and a growing drugs market. It is important to mention the intellectual property
rights have improved in China and hence gives another reason for big pharma to open their
R&D centers in China. For a small example Pfizer which is a very big multinational in 2011,
4 Marketline
Figure 13: R&D expenditures in pharma
Source: Article on euromonitor.com by Giedre Liorancaite
Page 44
44
announced to close its R&D facility in Groton, Connecticut and open the facility in Shanghai
China. GSK also setup its research centre in Shanghai.
4. Data Analysis The data analysis has been done in order to develop useful and practical results based
on the literature review. This section describes the data we have employed and the
methodology along with the results.
4.1. Data description
The data we are using comes from, Oriana & Orbis, which are both a part of Bureau
Van Dijk and contains comprehensive information of more than 8000 pharmaceutical firms in
China. Some required financial data has been acquired by the Orbis database5. The data is
composed of all the firms in Chinese pharmaceuticals based on their national legal forms and
ownership, which are active till 20136, and includes the financial data concerning the past 9
years.
The data provided is structured in the following way:
Financial Data:
Ownership Data:
5 Access to orbis has been provided by Prof. Stefano Elia 6 Data has been collected by University of Leuven, with which this project has been carried out, which started in 2014. Due to which the data collected is only till 2013.
ROE (USING P/L BEFORE
TAX) %
PROFIT MARGIN %
GROSS PROFT IN
USD
OPERATING REVENUE
(TURNOVER)
ROA (USING P/L BEFORE
TAX) %
P/L BEFORE TAX
CASHFLOWS
TOTAL ASSESTS
NUMBER OF EMPLOYEES
FINANCIAL DATA
OWNERSHIP DATA
PATENTS DATA
GLOBAL ULTIMATE
OWNER
DIRECT CONTROL %
NATIONAL LEGAL FORM
DATE OF INCORPORATIO
N
NUMBER OF SUBSIDIARIES
SHAREHOLDERS DATA
Page 45
45
Patents Data:
4.2. Data sampling and sorting
A difficulty in conducting this research thesis was the proper organization of data. The
data was missing key information for most of the companies, mainly because of scarcity of
data provided by the companies on an open platform. However, we managed to summarize
the data into what was relevant for us. The first step of sorting the data was to focus on the
relevant national legal forms that we need. Since our thesis is based entirely on the analysis
of Sino-foreign joint ventures & wholly foreign owned enterprises, we separated these from
all other types that were irrelevant for us. This made our database easier to work with. The
next sorting step was to include only the companies which had reliable and complete data for
the year 2013, that we needed to perform our analysis.
Table 1 Summary of data sorting
NATIONAL LEGAL FORM NUMBER OF COMPANIES
BEFORE SORTING
NUMBER OF COMPANIES
AFTER SORTING
SINO-FOREIGN JOINT
VENTURES
375 99
WHOLLY FOREIGN OWNED
ENTERPRISES
139 75
After filtering the data with firms having complete and required information, the
sample size of WFOE reduced to only 75 firms from 139 firms. In order to perform the Anova
analysis in minitab software it is important to have equal sample size for the groups of factor
NUMBER OF PATENTS
PUBLICATION TITLE
PUBLICATION DATE
Page 46
46
selected and that is the reason we have to select 75 firms for each entry mode. The 75 firms
selected from the sample of 99 Sino-Foreign Joint ventures have been selected randomly7.
Since we have yearly information available for all the companies, we could take an average of
all the financial data provided for over the last 9 available years in order to obtain an average
of the past years, that we can use for our analysis, but this however is not possible since we
do not know the date on which the WFOE was created. We instead took the absolute values
of the financial performance ratios for the year 2013.
4.3. Methodology
Adopted methodology is accordance with the ease of data availability and analysis.
We started primarily with the literature review and found all the relevant studies for the
related topic. We focused our attention to analyse the significant differences between the
groups using statistical analysis tool ANOVA (Analysis of variance) and then follow the post
hoc tests, only in the cases where we find any significant differences.
4.4. ANOVA
Anova is a procedure used to for testing hypothesis that certain population means are
equal. We used one-way Anova for our analysis, it compares the means of the samples or
groups in order to make inferences about the population means. It is also called a single factor
analysis of variance because it has only one independent variable or factor while the
independent variable has ordered levels inside it. Independent variable is controlled by us
and its main purpose is to form groupings of the observations. For example in our case the
factor (Independent variable) is the type of entry mode the company selects, which are JV’s
7 Robustness checks have been done, however, performed by using an alternative software, i.e. Stata, and by employing
the whole sample instead of the random selection. Most of the results, which are available in the appendix, have been confirmed, with only slight deviation in the Profit Margins, which doesnt show significant differences.
Page 47
47
& WFOE. The dependent variable however is the result of the manipulation of independent
variable. In One Way Anova there is only one dependent variable and the hypothesis is tested
based on the means of the groups that are formed on that dependent variable.
In our case the levels of the independent variable are not selected through a large
population of available levels instead these are the only ones that are of particular interest
for this study, hence our model can be called as the fixed-factor effect model.
4.4.1. Model hypothesis & assumptions
• The base hypothesis of the ANOVA model is that the population means are all equal and
there are no significant differences between the means of groups.
• However, we have several assumptions of the model that are to be tested and they are as
follows:
a) Assumption of independence: This assumption implies the fact that all the
observations are independent of each other since in Anova we are comparing the
means by considering the observations comes from a single set of population.
b) Assumption of normality: This assumes that the distribution of the population of data
is normal, from which we select our samples.
c) Homogeneity of variance: The assumption provides that the variances of the
distribution in the population are all equal.
4.5. Selection of Variables
In order to perform the financial analysis it is imperative to select the dependent
variables on which we will test our factors. Since we are comparing the performance of
companies based on the entry mode, the variables we decide must be able to catch the
Page 48
48
differences between the structures. It is possible that WFOE might have more assets (Tangible
and intangible) than net income and hence generates low returns while a JV might have more
knowledge about the local industry and that helps in better financial performance. Using basic
financial measures is the only possible solution we have due to data limitation. It is not
possible to go more in depth to understand the differences in each of the structure. Fig 14
shows the variables we have selected. Basic explanation of variables and comparison of the
two groups (WFOE and JV’s) is explained in the next section.
4.5.1. ROE
ROE is a financial ratio that measures the profitability of a business relative to the
shareholder equity. This is the first measure that we chose to assess the performance of the
JV’s & WFOE. ROE is a good measure to analyse how good the company is in converting cash
invested into the company into greater gains for the investors. The higher this measure is the
higher is the gain for investors.
𝑅𝑂𝐸 = 𝑁𝐸𝑇 𝐼𝑁𝐶𝑂𝑀𝐸/𝑆𝐻𝐴𝑅𝐸𝐻𝑂𝐿𝐷𝐸𝑅𝑆 𝐸𝑄𝑈𝐼𝑇𝑌
26
16
0
5
10
15
20
25
30
Sino-Foreign Joint ventures Wholly foreign owned enterprises
RO
E (R
etu
rn o
n e
qu
ity
Entry mode
ROE
Figure 15: Average ROE comparison
Figure 14 Selected variables
ROE ROAPROFIT
MARGINREVENUES
GROSS PROFIT
Page 49
49
4.5.2. ROA
In order to understand how the company is profitable, relative to its total assets, we
have selected Return on Assets that gives us an idea of how efficient is the management at
using its assets to generate earnings for the company. It takes into account the Net income
and the Total Assets. It is an important measure for us since it gives an understanding of how
the ownership structure is affecting the use of assets.
𝑅𝑂𝐴 = 𝑁𝐸𝑇 𝐼𝑁𝐶𝑂𝑀𝐸/𝑇𝑂𝑇𝐴𝐿 𝐴𝑆𝑆𝐸𝑇𝑆
4.5.3. Profit margin
Profit margin is a profitability ratio calculated as net income divided by revenues, or
net profits divided by sales. We are using the net income divided by revenues due to available
data. Profit margins are expressed as a percentage and, in effect, measures how much out of
every dollar of sales a company actually keeps in earnings (Investopedia). While profit margin
can be very useful for comparing companies, one should only use profit margin to compare
companies within the same industry, and ideally with similar business models.
12
6
0
5
10
15
Sino-Foreign Joint ventures Wholly foreign owned enterprises
RO
A
Entry mode
ROA
Figure 16 Average ROA comparison
Page 50
50
4.5.4. Operating Revenue/Turnover
We have also selected revenues as a measure of profitability of a company. The higher
the revenues the more is the market share of a company. Revenues/turnover is selected as
an absolute measure of profitability here. It might be possible to get a different result with an
absolute measure than a ratio since it doesn’t consider the different financial aspects of a
company.
1,08,510
31,335
0
20,000
40,000
60,000
80,000
1,00,000
1,20,000
Sino-Foreign Joint ventures Wholly foreign owned enterprises
Op
erat
ing
Rev
enu
es
Entry mode
Average operating revenues comparison
10.968
3
0
2
4
6
8
10
12
Sino-Foreign Joint ventures Wholly foreign owned enterprises
Pro
fit
mar
gin
Entry mode
Profit margin
Figure 17 Average Profit Margin Comparison
Figure 18 Average Operating Revenues Comparison
Page 51
51
4.5.5. Gross Profit
Gross profit margin is a financial measure that tells us a lot about a company's overall
financial health. It reveals how much money is left over for operations, expansion, debt
repayment, distributions to owners and shareholders and other miscellaneous expenses
(thebalance.com). This is another absolute measure we have selected.
4.6. Summary of the above
From the basic analysis of the variables we can see visible differences in the
performance of joint ventures and WFOE. JV’s are seen to have better performance than
wholly foreign owned subsidiaries. The difference could be explained by the ease of doing
business due to the availability of knowledge from the Chinese partner. It could also explained
by the fact that when two companies start a partnership it helps them with greater
productivity, increased capacity and resources, sharing of risks and costs with your partner
and also access to more specialised manpower, technology etc. While the WFOE in a market
44,339
9,785
0
5,000
10,000
15,000
20,000
25,000
30,000
35,000
40,000
45,000
50,000
Sino-Foreign Joint ventures Wholly foreign owned enterprises
Gro
ss p
rofi
t
Entry mode
Gross Profit
Figure 19 Average Gross Profit Comparison
Page 52
52
like China might have to struggle with the country’s laws & regulation the cultural barriers
and hence hindering its performance.
Page 53
53
5. Results
5.1. ROE
Our first result in table. 2 shows there are no significant differences between the
WFOE and JV’S when tested on the basis of return on equity.
It can also be seen by the interval plot in fig. 20 that since there is an overlapping of
the confidence interval, we can say that there might be similar performances between the
two groups. While it can be noted here that the Sino-Foreign JV’s are having a higher value
than the WFOE. The amount of variation (width of the interval) as can be seen from fig. 20 for
the two groups is more or less comparable. It is particularly of no use for post hoc-tests, since
there are no significant differences between the two groups.
As can be seen from the box plot in fig. 21 there are many outliers, which indicates
the abnormality of the data. This abnormality can considerably affect the analysis.
Source DF Adj SS F-Value P-Value
C2 1 3938 1.42 0.236
Error 148 411734
Total 149 415672
Table 2: ANOVA results for ROE
WFOESINO-FORIEGN JV'S
40
30
20
10
0
C2
C1
Interval Plot of C1 vs C295% CI for the Mean
The pooled standard deviation is used to calculate the intervals.
WFOESINO-FORIEGN JV'S
400
300
200
100
0
-100
-200
C2
C1
Boxplot of C1
Figure 20 Interval plot for ROE
Figure 21 Box plot of ROE values
Page 54
54
5.2. ROA
With our second test as shown in table. 3 we get a very interesting result that tells us
there are significant differences in performance of joint ventures when measured through
ROA. The difference in performance can be explained by the fact that Sino-foreign JV’s are
using their assets more efficiently than the WFOE, or are generating more income than the
WFOE. This can be analysed when we further test the results with revenues, to understand
better the differences in performance that exists due to ROA.
Source DF Adj SS F-Value P-Value
C2 1 1410 8.85 0.003
Error 148 23583
Total 149 24994 Table 3 ANOVA results for ROE
The differences can be seen easily through the interval plot in fig. 22, which indicates
significant differences between the two groups because there is no overlapping of the
confidence intervals. While the amount of variation in between the samples is comparable
but can be seen to be very high within the samples of groups.
C2 N Mean StDev 95% CI
SINO-FORIEGN JV'S 75 12.21 13.42 (9.33, 15.09)
WFOE 75 6.08 11.78 (3.20, 8.96) Table 4 Comparison of means for ROA.
The comparison of means in table. 4 indicates that Joint ventures have a relatively
higher performance than the corresponding WFOE, which as explained above could be due
to the Sino-Foreign JV’s having better utilization of the assets due to shared resources among
the partners which helps generates more income.
WFOESINO-FORIEGN JV'S
16
14
12
10
8
6
4
2
C2
C1
Interval Plot of C1 vs C295% CI for the Mean
The pooled standard deviation is used to calculate the intervals.
Figure 22 Interval plot for ROA
Page 55
55
The boxplot fig. 23 shows significant outliers in the data, which can affect the data analysis
and shows a room for improvement for further studies. Since we have significant differences it is
important to perform the post hoc tests. We can first do a normality test (fig. 24) of our data to
see if our data follows the normal distribution. Results from Minitab indicates the data samples
are not normal since we have a p-value less than 0.05 which is our confidence interval. Therefore
we reject the null hypothesis that the data is normal. Below in fig 25, we can see the post-hoc
Levenes test (Levenes performed because the data doesn’t follow normal distribution) assuming
equal variances performed of the data which fails the test and indicates no significant differences
between the standard deviations of the two groups.
WFOESINO-FORIEGN JV'S
80
60
40
20
0
-20
-40
C2
C1
Boxplot of C1
Figure 23 Boxplot for ROA
Figure 24 Normal probability plot for ROA
Page 56
56
95% Bonferroni Confidence Intervals for Standard Deviations
C2 N StDev
SINO-FORIEGN JV'S 75 13.4181
WFOE 75 11.7750 Table 5 Comparison of Std. Dev for ROA
However standard deviations as in table 5 second the fact that Sino-Foreign JVs have been
performing better than the WFOE.
5.3. Profit Margin
The third test we perform using the profit margin (table. 7) indicates significant differences
between the WFOE and JV’s. But it is hard to say if the differences are really significant because
the interval plot in (fig. 26) shows the overlapping of confidence interval. It is important to perform
the post hoc tests here to see if the results by Anova are really significant.
Source DF Adj SS F-Value P-Value
C2 1 2118 5.82 0.017
Error 148 53829
Total 149 55947 Table 7 ANOVA results for profit margin
Method Test
Statistic
P-Value
Multiple comparisons 0.31 0.578
Levene 0.06 0.813
Table 6 Results for Levene test for ROA
WFOE
SINO-FORIEGN JV'S
1817161514131211109
P-Value 0.578
P-Value 0.813
Multiple Comparisons
Levene’s Test
C2
Test for Equal Variances: C1 vs C2Multiple comparison intervals for the standard deviation, α = 0.05
If intervals do not overlap, the corresponding stdevs are significantly different.
WFOESINO-FORIEGN JV'S
16
14
12
10
8
6
4
2
0
C2
C1
Interval Plot of C1 vs C295% CI for the Mean
The pooled standard deviation is used to calculate the intervals.
WFOESINO-FORIEGN JV'S
50
25
0
-25
-50
-75
-100
C2
C1
Boxplot of C1
Figure 25 Test for equal variance for ROA: Factors vs Dependent variable. Multiple comparison interval for the std. Deviation, Alpha =
0.05
Figure 26 Interval plot for Profit Margin Figure 27 Box plot for Profit Margin
Page 57
57
The box plot in fig. 27 shows a wide variation of the data in the WFOE than the Sino-Foreign
JVs and again shows significant outliers that might affect the results. A simple analysis of means
(table. 8 ) of the two groups shows JV’s performing significantly better than the WFOE with respect
to the profit margins.
C2 N Mean 95% CI
SINO-FORIEGN JV'S 75 10.97 (6.62, 15.32)
WFOE 75 3.45 (-0.90, 7.80) Table 8 Comparison of mean for profit margin
In order to analyse better if we have significant differences we can do the post hoc test.
The normality test fig. 28 failed to describe a normal data distribution. We can proceed with
Levenes test table. 9 for equal variances in order to analyse significant difference in the standard
deviations.
The Levenes test table 9 identifies significant differences in standard deviations between
the WFEO and Sino-foreign joint ventures profit margin which indicates further performance
differences between the groups.
Method Test
Statistic
P-Value
Multiple comparisons 1.44 0.230
Levene 5.68 0.018
Table 9 Results for Levenes test for profit margin
WFOE
SINO-FORIEGN JV'S
30252015
P-Value 0.230
P-Value 0.018
Multiple Comparisons
Levene’s Test
C2
Test for Equal Variances: C1 vs C2Multiple comparison intervals for the standard deviation, α = 0.05
If intervals do not overlap, the corresponding stdevs are significantly different.
Figure 28 Normal probability plot for Profit Margin
Figure 29 Test for equal variances for profit margin: Factors vs Dependent variable. Multiple comparison interval for the std. Deviation, Alpha = 0.05
Page 58
58
We also did a Fisher Pairwise Comparisons table 10 to further test the differences in means
of the two groups. Grouping Information Using the Fisher LSD method and 95% confidence. The
means that do not share a letter are significantly different from each other.
Also we can see from the fisher interval plot fig. 30 that the means are significantly different
because the interval doesn’t contain zero.
5.4. Revenues
The test on the 4th variable table. 11 shows significant differences in the performances
because the p value is less than the alpha level.
Source DF F-Value P-Value
C2 1 10.97 0.001
Error 148
Total 149 Table 11 ANOVA results for revenues
Below we can also see significant difference by the interval plot fig. 31 since the confidence
intervals do not overlap.
C2 N Mean Grouping
SINO-FORIEGN JV'S 75 10.97 A
WFOE 75 3.45 B
Table 10 Result for Fisher test for profit margin
Figure 30 Fisher individual plot for profit margin. Difference of means for the profit margin with 95 % confidence interval
Page 59
59
C2 N Mean StDev
SINO-FORIEGN JV'S 75 99544 154566
WFOE 75 31319 89108 Table 12 Comparison of Means for revenues
A simple analysis of means table. 12 indicates sino-foreign JV’s performing better than the
WFOE with respect to the revenues. Since there are significant differences by the One Way Anova,
we performed the post hoc test to further analyse the differences of means and variances. Firstly
the data failed the normality test fig. 32 when tested in Mintab.
Method Test
Statistic
P-Value
Multiple comparisons 2.20 0.138
Levene 7.25 0.008 Table 13 Results for Levenes test for revenues
Secondly we perform the test of equal variances table. 13 & fig. 33 which shows significant
differences in the variances and thus we reject the null hypothesis that the variances are equal.
WFOESINO-FORIEGN JV'S
160000
140000
120000
100000
80000
60000
40000
20000
0
C2
C1
Interval Plot of C1 vs C295% CI for the Mean
The pooled standard deviation is used to calculate the intervals.
WFOE
SINO-FORIEGN JV'S
35000030000025000020000015000010000050000
P-Value 0.122
P-Value 0.015
Multiple Comparisons
Levene’s Test
C2
Test for Equal Variances: C1 vs C2Multiple comparison intervals for the standard deviation, α = 0.05
If intervals do not overlap, the corresponding stdevs are significantly different.
Figure 31 Interval Plot for revenues
Figure 33 Test for equal variances for Revenues: Factors vs Dependent variable. Multiple comparison interval for the std.
Deviation, Alpha = 0.05 Figure 32 Normal probability plot for Revenues
Page 60
60
Grouping Information Using the Fisher LSD Method and 95% Confidence
C2 N Mean Grouping
SINO-FORIEGN JV'S 75 99544 A
WFOE 75 31319 B Table 14 Results for fishers test for revenues
Fisher table .14 further indicates significant difference between the groups. Remember that
means that do not share a letter are significantly different.
5.5. Gross Profit
When the performance was tested on the gross profit the results table. 15 are same as of
the revenues and shows significant differences among the two groups.
Source DF Adj MS F-Value P-Value
C2 1 44235240553 10.12 0.002
Error 148 4369163646
Total 149 Table 15 ANOVA results for Gross profit
WFOESINO-FORIEGN JV'S
60000
50000
40000
30000
20000
10000
0
C2
C1
Interval Plot of C1 vs C295% CI for the Mean
The pooled standard deviation is used to calculate the intervals.
Figure 34 Fisher individual plot for Revenues. Difference of means for the profit margin with 95 % confidence interval
Figure 35 Interval Plot for gross profit
Page 61
61
This as well indicates the JV’s have considerably lower cost of goods sold as compared to
the WFOE.
Method Test
Statistic
P-Value
Multiple comparisons 8.89 0.003
Levene 7.62 0.006 Table 16 Results for Levenes test for Gross Profit
Levenes test table. 16 proves the differences in variance hence we can reject the null
hypothesis of equal variances. The comparison as shows below, of the means table. 17, identifies
JV’s performing better than WFOE. The fisher test fig. 37 & table. 18, indicates significant
differences in the mean values of the groups.
C2 N Mean StDev
SINO-FORIEGN JV'S 75 44339 91760
WFOE 75 9993 17843 Table 17 Comparison of Means
Grouping Information Using the Fisher LSD Method and 95% Confidence
C2 N Mean Grouping
SINO-FORIEGN JV'S 75 44339 A
WFOE 75 9993 B
Table 18 Results for fisher test for gross profit
Means that do not share a letter are significantly different.
WFOE
SINO-FORIEGN JV'S
1600
00
1400
00
1200
00
1000
00
8000
0
6000
0
4000
0
2000
00
P-Value 0.003
P-Value 0.006
Multiple Comparisons
Levene’s Test
C2
Test for Equal Variances: C1 vs C2Multiple comparison intervals for the standard deviation, α = 0.05
If intervals do not overlap, the corresponding stdevs are significantly different.
Figure 36 Test for equal variances for gross profit: Factors vs Dependent variable. Multiple comparison interval for the std. Deviation, Alpha =
0.05
Figure 37 Fisher individual plot for Revenues. Difference of means for the gross profit with 95 % confidence interval
Page 62
62
VARIABLE SIGNIFICANT
DIFFERENCES (Y/N)
P-VALUES Mean value
for JV’s
Mean values
for WFOE
ROE NO 0.236 26.02 16
ROA YES 0.003 12.21 6.08
PROFIT MARGIN YES 0.017 10.97 3.45
REVENUES YES 0.001 99,544 31,319
GROSS PROFIT YES 0.002 44,339 9,993
Table 19 Summary of the results
Page 63
63
6. DISCUSSION AND CONCLUSIONS
China has long been known to force joint ventures for companies entering into their
market. The strategy has been adopted when China initially opened its economy in 1981. Joint
venture were forced on specific industries in order to foster the local business. Many things
account for forcing a joint venture that are not a focus of this study but the main aim of this
research as described in the above sections is to analyse whether the joint venture strategy of
China in the 1981 was a good idea or not. Given the fact that China has evolved its economy
towards a more open one over the years, the question still remains whether a firm should enter
with a joint venture or a wholly foreign owned subsidiary. With China entering the WTO the
decision for foreign firms to select an appropriate entry mode is arguably critical to make. To
answer this question in the pharmaceutical industry in China we analysed the performance of firms
based on the data for 2013 provided by Oriana data base. Our analysis involved a basic and static
comparison of performances of WFOE and Sino-foreign joint ventures considering financial ratios
including ROA, ROE, Profit Margin, revenues & Gross Profit. The results indicate that Sino-Foreign
joint ventures perform better than the wholly foreign owned enterprises for a sample of 150 firms
tested in all metrics except in the case of ROE where no significant differences were found. Our
results are in line with the study published by Yadong Luo and Min Chen (1995), who states that
Sino-Foreign JV’s outperform WFOE in terms of gross margin. It is important to discuss here the
possible reasons why WFOE’s in China might not be performing better than JV’s. The choice of
entry mode depends mainly on the strategic orientation of the company. According to a research
by Yadong Luo and Min Chen (1995), if a company wants to gain local market share than IJV’s might
be a better mode to enter while if the aim of company is to spread the operations due to the
pressure of globalization then WFOE is a better option. In Chinese pharmaceutical industry the
first scenario seems to hold. Many major multinational pharmaceutical firms have done JV’s rather
Page 64
64
than WFOE because they are looking towards gaining the local market share in China due to the
growing demand of pharmaceutical industry. They may be able to exploit the wide distribution
channels & knowledge of local partners in order to access the markets whereas WFOE still may
face difficulties in this regard due to which the performance of JV’s is better than WFOE. Other
reasons that could explain this variation of performance is the wide availability of shared resources
in a joint venture including tangible and intangible assets, the use of which can be made more
efficient when combined in order to serve a larger market benefiting from economies of scale,
scope and risk diversification thus resulting in better financial performances.
The results may also be explained by the Transaction Cost Economics external uncertainty
construct meaning that the country risk related to social, political, economic stability, the risks
associated with policies of the government or the risk of converting profits is still prevalent in
Chinese Pharmaceutical market. Cultural differences may also still be relevant between China and
other countries leading to better performance of Joint Ventures considering also that majority of
the foreign firms are from US and Europe and despite globalization there is a gap in cultures. This
can be further reinforced with the normative institutional theory suggesting that Chinese partners
still help foreign firms overcome social problems and enable them to achieve social legitimacy.
Our results hence develop a strong case for the future foreign firms entering in the Chinese
Pharmaceutical market to look for a joint venture with a local Chinese firm in order to have an
optimum use of resources and hence have better financial performance. Apparently the WFOE
have their own benefits that cannot be neglected but in our case the Sino-Foreign Joint ventures
appears to have certain advantages over the WFOE in Chinese pharmaceuticals, which can be
explored by further research and in depth analysis of the factors. The results also conclude the fact
that the Joint Venture strategy enforced by China has had no negative impact on the performance
of foreign firms instead it has helped them to perform better in the Chinese Pharmaceuticals. It is
Page 65
65
suggested that firms entering in future must rely on the benefits that arise from a typical joint
venture such as availability of resources, easy access to labor and local knowledge as discussed in
the discussion above. The thesis also provides great contribution to literature, future researchers
and firm managers to have an overview of the financial situation of pharmaceuticals in China and
the current best entry mode strategy for the sector, which has not been done until now. However
due to the static nature of the analysis it is hard to say whether the results will be same if analysed
based on a longer time period of data, which as well open doors for future studies. The future
research should also focus on the innovative performance of the firms based on their entry modes
and also assess the spill overs associated with the joint ventures. We also suggest further works to
analyse the reasons why such differences in financial performance exists between the Sino-Foreign
Joint ventures and WFOE in Chinese pharmaceutical market. Further studies could also focus on
the Sino-Foreign Joint ventures that converted to WFOE and see the performance difference
before and after conversion. In our study due to limitations of data it was not possible to go in that
direction, however we believe that it still provides a preliminary evidence on the performance
implications of two different types of entries in China (i.e. Sino-Foreign JV. Against WFOEs) that
deserves to be further investigated in future studies.
Page 66
66
APPENDIX
Table 20 Stata Results for Operating Revenues
Summary of Operating Revenues 2013
Factor Mean Std. Dev. Freq.
Sino-Foreign JV's 83659.77 182575.84 99
WFOE 31319.5 89107.599 75
Total 61099.31 151508.77 174
Table 21 Stata ANOVA Results for Operating Revenues
Analysis of Variance Operating Revenues
Source SS df MS F Prob > F
Between groups 1.17E+11 1 1.17E+11 5.22 0.0236
Within groups 3.85E+12 172 2.24E+10
Total 3.97E+12 173 2.30E+10
Table 22 Stata Results for ROE
Summary of ROE 2013
Factor Mean Std. Dev. Freq.
Sino-Foreign JV's 22.07204 45.77385 99
WFOE 15.80205 55.94543 75
Total 19.36946 50.35272 174
Table 23 Stata ANOVA Results for ROE
Analysis of Variance ROE
Source SS df MS F Prob > F
Between groups 1677.569 1 1677.569 0.66 0.4176
Within groups 436945.9 172 2540.383
Total 438623.5 173 2535.396
Table 24 Stata results for ROA
Summary of ROA 2013
Factor Mean Std. Dev. Freq.
Sino-Foreign JV’ 10.22944 13.42563 99
WFOE 6.081493 11.77501 75
Total 8.441535 12.87077 174
Page 67
67
Table 25 Stata ANOVA Results for ROA
Analysis of Variance ROA
Source SS df MS F Prob > F
Between groups 734.2001 1 734.2001 4.52 0.0349
Within groups 27924.42 172 162.3513
Total 28658.62 173 165.6568
Table 26 Stata results for Profit Margin
Summary of Profit Margin 2013
Factor Mean Std. Std Dev. Freq.
Sino-Foreign JV's 9.0810606 16.50162 99
WFOE 3.4520937 21.63437 75
Total 6.6547818 19.03347 174
Table 27 Stata ANOVA Results for Profit Margin
Analysis of Variance Profit Margin
Source SS df MS F Prob > F
Between groups 1352.08687 1 1352.08687 3.79 0.0531
Within groups 61321.1422 172 356.518269
Total 62673.2291 173 362.273
Table 28 Stata results for Gross Profit
Summary of Gross Profit 2013
Factor Mean Std. Dev. Freq.
Sino-Foreign JV's 34140.78 81789.11 99
WFOE 9993.354 17843.23 75
Total 23732.41 63791.99 174
Table 29 Stata ANOVA Results for Gross Profit
Analysis of Variance Gross Profit
Source SS df MS F Prob > F
Between groups 2.49E+10 1 2.49E+10 6.3 0.013
Within groups 6.79E+11 172 3.95E+09
Total 7.04E+11 173 4.07E+09
Page 68
68
VARIABLE SIGNIFICANT
DIFFERENCES (Y/N)
P-VALUES
ROE NO 0.4176
ROA YES 0.0349
PROFIT MARGIN NO 0.0531
REVENUES YES 0.0236
GROSS PROFIT YES 0.013
Table 30 Summary of stata results
Page 69
69
REFERENCES
Agawal, S. (1994), ‘Socio-cultural distance and the choice of joint ventures: A contingency perspective’,
Journal of International Marketing
Agarwal, S. and S.N. Ramaswani (1992), ‘Choice of foreign market entry mode: impact of ownership,
location and internalization factors’, Journal of International Business Studies
Andersen, O. (1997), ‘Internationalization and market entry mode: a review of theories and conceptual
framework’, Management International Review
Anderson, E and H Gatignon. (1986), ‘Modes of foreign entry: A transaction cost analysis and propositions’,
Journal of International Business Studies
Álvarez, M. (2003). Wholly-Owned Subsidiaries Versus Joint Ventures: The Determinant Factors in the
Catalan Multinational Manufacturing Case.
Brouthers, K.D., (2002), ‘Institutions, cultural and transaction cost influences on entry mode choice and
performance’, Journal of International Business Studies.
Brouthers, K.D. and L.E. Brouthers (2003), ‘Why service and manufacturing entry mode choices differ: the
influence of transaction cost factors, risk and trust’, Journal of Management Studies.
Brouthers, K.D., L.E. Brouthers and S. Werner (2003), ‘Transaction cost-enhanced entry mode entry mode
choices and firm performance’, Strategic Management Journal.
Buckley, P. a. C. M., 1985. The Economic Theory of the Multinational Enterprise. London: MacMillan Press
Ltd.
Buckley, P. & Casson, M., 1998. Analyzing foreign market entry strategies: Extending the internalization
approach. Journal of international business studies.
Casson, M.C. (1995), The organization of international business: Studies in the economics of trust,
Aldershot: Elgar.
Chen, S.F.S., and J.F. Hennart (2002), ‘Japanese investors’ choice of joint ventures versus wholly-owned
subsidiaries in the U.S.: The role of market barriers and firm capabilities’, Journal of International Business
Studies
Chen, H.Y., and M.Y. Hu. (2002), ‘An analysis of determinants of entry mode and its impact on performance’,
International Business Review
Chu, W. and E.M. Anderson (1992), ‘Capturing ordinal propositions of categorical dependent variables: a
review with application to modes of foreign entry’, International Journal of Research in Marketing
CHANG, S.-J., CHUNG, J., & MOON, J. J. (2013). WHEN DO WHOLLY OWNED SUBSIDIARIES PERFORM BETTER
THAN JOINT VENTURES? Strategic management journal.
Page 70
70
Chen, P.-L. (2013). Modes of Foreign Direct Investment and Intellectual Property Rights Protection: Wholly-
owned or Joint Venture? Firm-level Evidence from Taiwanese Multinational Manufacturing Enterprises.
Review of International Economics.
Chen, Y. L. (1995). Financial Performance Comparison between international joint ventures and wholly
foreign-owned enterprises in China. The International Executive.
Child, J., & yan, Y. (2003). Predicting the Performance of International Joint ventures: An investigation in
China. Journal of Management Studies.
CHINA: LAW ON JOINT VENTURES. (2017). International Legal Materials.
Caves, R. E., 1996. Multinational Enterprise and Economic Analysis. Cambridge University Press.
Caves, R. & Pugel, T., 1982. New evidence on competition in the grain trade. Food Research Institute Studies
Chung, H. & Enderwick, P., 2001. An investigation of market entry strategy selection: export vs. foreign
direct investment modes: a home-host country scenario. Asia Pacific Journal of Management
Delios, A. and P.W. Beamish (1999), ‘Ownership strategy of Japanese firms: transactional, institutional, and
experience influences’, Strategic Management Journal
Dikova, D and A.V. Witteloostuijn (2007), ‘Foreign direct investment mode choice: entry and establishment
modes in transition economies’, Journal of International Business Studies
Dadzie, S., 2012. Foreign Direct Investment Strategies and Performance of Foreign Subsidiaries in Ghana.
Vaasan Yliopisto.
Dunning, J., 1991. The eclectic paradigm of international production. The Nature of the Transnational Firm
Dunning, J., 1993. Internationalizing Porter's Diamond. Management International Review.
Dunning, J., 1997. Micro and Macro Organizational Aspects of MNE and MNE Activity Columbia: University
of South Carolina Press. Dunning, J. H., 1980. Towards an electric theory of international production: Some
empirical tests. Journal of International Business Studies
Dunning, J. H., 1981. International Production and the Multinational Enterprise. Dunning, J. H., 1988. The
eclectic paradigm of international production: A restatement and some possible extensions. Journal of
International Business Studies
Dunning, J. H., 1993. Multinational Enterprises and the Global Economy.
Dunning, J. H., 1998. Location and the Multinational Enterprise: A Neglected Factor? Journal of International
Business Studies.
Dunning, J. H., 2000. The eclectic paradigm as an envelope for economic and business theories of MNE
activity. International Business Review
Dunning, J. H. & Lundan, S. M., 2008. Multinational Enterprises and the Global Economy.
Dunning, J. & Kundu, S., 1995. The internationalization of the hotel industry: some new findings from a field
study.. MIR: Management International Review
Page 71
71
Erramilli, M.K. (1991), ‘Choice of foreign market entry mode in service firms’, International Marketing
Review
Erramilli, M.K. and C.P. Rao (1993), ‘Service firms’ international entry mode choice: A modified transaction-
cost analysis approach’, Journal of Marketing
Erramilli, M.K., S. Agarwal and S.S. Kim (1997), ‘Are firm-specific advantages location specific too’? Journal
of International Business Studies
Eapen, A. (2013). FDI spill over effects in incomplete datasets. Journal of International Business.
Gatignon, S.H., and E. Anderson (1988), ‘The multinational corporation’s degree of control over foreign
subsidiaires: An empirical test of a transaction cost explanation’, Journal of Law, Economics, and
Organization
Gomes-Casseres, B. (1989), ‘Ownership structures of foreign subsidiaries: Theory and evidence’, Journal of
Economic Behavior and Organization
Gomes-Casseres, B. (1990), ‘Firm ownership preferences and host government restrictions: An integrated
approach’, Journal of International Business Studies
Hennart, J.F. (1991), ‘The transaction costs theory of joint ventures: An empirical study of Japanese
subsidiaries in the United States’, Management Science
Hennart, J.F., and J. Larimo (1998), ‘the impact of cultural on the strategy of multinational enterprises: Does
national origin affect ownership decisions’? Journal of International Business Studies
Hans Mjoen, S. T. (2017). Control and Performance in International Joint Ventures. Organization Science.
HENNART, J.-F. (1988). A transaction costs theory of equity joint ventures. Strategic Management Journal.
Huang, G., & Song, F. M. (2005). The financial and operating performance of China’s newly listed H-firms.
Pacific Basin Finance Journal.
Hill, C. W., Hwang, P. & Kim, W. C., 1990. An eclectic theory of the choice of international entry mode.
Strategic Management Journal.
Holtbrügge, D. & Puck, J. F., 2008. The change of foreign investors' ownership modes in the PRC- Theoretical
framework and empirical results. In: Technology and Innovation Management
Jung, J., 2004. Acquisitions or joint ventures: Foreign market entry strategy of US advertising agencies. The
Journal of Media Economics.
Kim, W.C., and P. Hwang (1992), ‘Global strategy and multinationals’ entry mode choice’, Journal of
International Business Studies
Kogut, B. (1988), ‘Joint ventures: theoretical and empirical perspectives’, Strategic Management Journal
Kogut, B. and H. Singh (1988), ‘The effect of national culture on the choice of entry mode’, Journal of
International Business Studies
Page 72
72
Lopez-Duarte, C. and M.M. Vidal-Suarez (2013), ‘Cultural distance and the choice between wholly owned
subsidiaries and joint ventures’, Journal of Business Research
Leung, W.-F. (2006). The duration of international joint ventures an foreign wholly-owned subsidiaries.
Applied Economics.
Li, J., & Guisinger, S. (1991). COMPARATIVE BUSINESS FAILURES OF FOREIGNCONTROLLED FIRMS IN THE
UNITED STATES. Journal of International Business Studies.
Makino, S., & Beamish, P. W. (1998). Performance and Survival of Joint Ventures with Non-Conventional
Ownership Structures. Journal of International Business Studies.
Mathews. (2006). Dragon multinationals: New players in 21st century globalization. Asia Pacific Journal of
Management.
Michael Y. Hu, H. C. (1996). An Empirical analysis of factors explaining foreign joint venture performance in
China. Journal of business research.
Musteen, M. A. (2011). Multinational enterprises’ Entry Mode Strategies and Uncertainty: A Review and
Extension. International Journal of Management.
Makino, S., Lau, C.-M. & Yeh, R.-S., 2002. Asset-Exploitation versus Asset Seeking: Implications for Location
Choice of Foreign Direct Investment from Newly Industrialized Economies. Journal of International Business
Studies
Ogasavara, M. H., & Hoshino, Y. (2007). The impact of ownership, internalization, and entry mode on
Japanese subsidiaries’ performance in brazil. Science direct.
Peter Westfall, J. J. (2007). Joint Analysis of Multiple Categorical Dependent Variables in Organizational
Research. Sage Publications.
Padmanabhan, P. and K. R. Cho (1996), ‘Ownership strategy for a foreign affiliate: an empirical investigation
of Japanese firms’, Management International Review
Padmanabhan, P. &. C. K., 1999. Decision Specific Experience in Foreign Ownership and Establishment
Strategies: Evidence from Japanese Firms. Journal of International Business.
Ren, H., Gray, B., & Kim, K. (2009). Performance of International Joint Ventures: What factors really make a
difference and how? Journal of Management.
SIMMONDS, P. G. (1990). The combined diversification breadth and mode dimensions and the performance
of large diversified firms. Strategic management journal.
Song, M., tao, J., & Wang, S. (2013). FDI, technology spillovers and green innovation in China: analysis based
on Data Envelopment Analysis. Springer Science Business Media New York.
Talay, B. M. & Cavusgil, T. S., 2008. Choice of ownership mode in joint ventures: An event history analysis
from the automotive industry. Industrial Marketing Management.
Tan, B. & Vertinsky, I., 1996. Foreign direct investment by Japanese electronics firms in the United States
and Canada: Modeling the timing of entry. Journal of International Business Studies
Page 73
73
Utzon, J. H. (2014). A study of joint venture performance and institutional distance. Finance & Strategic
Management.
Wheeler, D. & Mody, A., 1992. International investment location decisions: The case of U.S. firms. Journal
of International Economics
Warner, D. Y. (2001). SINO-FOREIGN JOINT VENTURES’ VERSUS ‘WHOLLY FOREIGN OWNED ENTERPRISES’
IN THE PEOPLE’S REPUBLIC OF CHINA. The Judge Institute of Management Studies.
Yiu, D., & Makino, S. (2017). The Choice between Joint Venture and Wholly Owned Subsidiary: An
Institutional Perspective. Organization Science.
Yiu, D. & Makino, S., 2002. The choice between joint venture and wholly owned subsidiary: An institutional
perspective. Organization Science.
Zhao, X. & Decker, R., 2004. Choice of Foreign Market Entry Mode - Cognitions from Empirical and
Theoretical Studies. Discussion Paper No. 512, Faculty of Economics and at the University of Bielefeld.
Zaheer khan, y. k. (2015). International joint ventures as boundary spanners: technological knowledge
transfer in an emerging economy. Global strategy journal.