24 Population genetics of Cobia (Rachycentron canadum): implications for fishery management along the coast of the southeastern United States Tanya L. Darden (contact author) Matthew J. Walker Karl Brenkert Justin R. Yost Michael R. Denson Email address for contact author: [email protected]South Carolina Department of Natural Resources Marine Resources Research Institute 331 Fort Johnson Road Charleston, South Carolina 29412 Manuscript submitted 25 April 2012. Manuscript accepted 6 November 2013. Fish. Bull. 112:24–35 (2014). doi: 10.7755/FB.112.1.2 The views and opinions expressed or implied in this article are those of the author (or authors) and do not necesarily reflect the position of the National Marine Fisheries Service, NOAA. Abstract—Cobia (Rachycentron cana- dum) is a pelagic, migratory species with a transoceanic distribution in tropical and subtropical waters. Rec- reational fishing pressure on Cobia in the United States has increased substantially during the last decade, especially in areas of its annual in- shore aggregations, making this spe- cies potentially susceptible to overfish- ing. Although Cobia along the Atlantic and Gulf coasts of the southeastern United States are currently managed as a single fishery, the genetic composi- tion of Cobias in these areas is unclear. On the basis of a robust microsatel- lite data set from collections along the U.S. Atlantic coast (2008–09), offshore groups were genetically homogenous. However, the 2 sampled inshore ag- gregations (South Carolina and Vir- ginia) were genetically distinct from each other, as well as from the offshore group. The recapture of stocked fish within their release estuary 2 years after release indicates that some de- gree of estuarine fidelity occurs within these inshore aggregations and sup- ports the detection of their unique ge- netic structure at the population level. These results complement the observed high site fidelity of Cobias in South Carolina and support a recent study that confirms that Cobia spawn in the inshore aggregations. Our increased understanding of Cobia life history will be beneficial for determining the appropriate scale of fishery manage- ment for Cobia. Cobia (Rachycentron canadum), be- longing to the monotypic family Rachycentridae (Actinopterygii: Per- ciformes), is a large, pelagic, migra- tory species distributed throughout tropical and subtropical waters of the Atlantic, Indian, and western Pa- cific oceans (Shaffer and Nakamura, 1989). The species is highly prized by both recreational fisheries and aquaculture producers as excellent table fare. Within the United States, this recreationally and commercially important fish species occurs along the southeastern Atlantic and Gulf of Mexico coasts. Cobia has histori- cally been managed by the South At- lantic Fishery Management Council and Gulf of Mexico Fishery Manage- ment Council as a single reproduc- tive stock on the basis of minimal data from tag and recapture research and mitochondrial fragment analysis (Hrincevich, 1993). Most early life history information on Cobia comes from aquaculture research, and lit- tle is known about its natural life history. In the spring and early summer months, Cobias in the western North Atlantic are thought to migrate with warming waters from Florida to the Chesapeake Bay (Shaffer and Na- kamura, 1989). During this puta- tive northward migration, Cobias enter high salinity bays and estuar- ies, including Port Royal Sound and St. Helena Sound in South Carolina (SC), Pamlico Sound in North Caroli- na (NC; Smith, 1995), and the Chesa- peake Bay (Shaffer and Nakamura, 1989). Cobias have been reported to spawn from April to Septem- ber (Smith, 1995; Lotz et al., 1996; Burns et al.; 1 Brown-Peterson et al., 2001). Regional peaks in spawning correlate with their proposed annual migration from Florida to Massachu- setts, occurring in May along the SC coast (Shaffer and Nakamura, 1989; Burns et al. 1 ), June in NC (Smith, 1995), and during June and July in the Chesapeake Bay region (Joseph et al., 1964). One aspect of Cobia biology that has only recently been investigated is their annual inshore aggregations that occur in high-salinity estuaries. The nature of these aggregations has been hypothesized to be associated with either feeding or reproduction (Joseph et al., 1964; Richards, 1967; Hassler and Rainville, 1975; Smith, 1995; Lotz et al., 1996; Burns et al. 1 ), 1 Burns, K., C. Neidig, J. Lotz, and R. Over- street. 1998. Cobia ( Rachycentron canadum) stock assessment study in the Gulf of Mexico and in the south Atlan- tic. Mote Marine Laboratory Technical Report No. 571, 108 p. [Available from Mote Marine Laboratory, 1600 Thomp- son Parkway, Sarasota, FL 342236.]
Transcript
24
Population genetics of Cobia (Rachycentron canadum): implications for fi shery management along the coast of the southeastern United States
South Carolina Department of Natural ResourcesMarine Resources Research Institute331 Fort Johnson RoadCharleston, South Carolina 29412
Manuscript submitted 25 April 2012.Manuscript accepted 6 November 2013.Fish. Bull. 112:24–35 (2014).doi: 10.7755/FB.112.1.2
The views and opinions expressed orimplied in this article are those of the author (or authors) and do not necesarilyrefl ect the position of the National Marine Fisheries Service, NOAA.
Abstract—Cobia (Rachycentron cana-dum) is a pelagic, migratory species with a transoceanic distribution in tropical and subtropical waters. Rec-reational fishing pressure on Cobia in the United States has increased substantially during the last decade, especially in areas of its annual in-shore aggregations, making this spe-cies potentially susceptible to overfish-ing. Although Cobia along the Atlantic and Gulf coasts of the southeastern United States are currently managed as a single fishery, the genetic composi-tion of Cobias in these areas is unclear. On the basis of a robust microsatel-lite data set from collections along the U.S. Atlantic coast (2008–09), offshore groups were genetically homogenous. However, the 2 sampled inshore ag-gregations (South Carolina and Vir-ginia) were genetically distinct from each other, as well as from the offshore group. The recapture of stocked fish within their release estuary 2 years after release indicates that some de-gree of estuarine fidelity occurs within these inshore aggregations and sup-ports the detection of their unique ge-netic structure at the population level. These results complement the observed high site fidelity of Cobias in South Carolina and support a recent study that confirms that Cobia spawn in the inshore aggregations. Our increased understanding of Cobia life history will be beneficial for determining the appropriate scale of fishery manage-ment for Cobia.
Cobia (Rachycentron canadum), be-longing to the monotypic family Rachycentridae (Actinopterygii: Per-ciformes), is a large, pelagic, migra-tory species distributed throughout tropical and subtropical waters of the Atlantic, Indian, and western Pa-cifi c oceans (Shaffer and Nakamura, 1989). The species is highly prized by both recreational fi sheries and aquaculture producers as excellent table fare. Within the United States, this recreationally and commercially important fi sh species occurs along the southeastern Atlantic and Gulf of Mexico coasts. Cobia has histori-cally been managed by the South At-lantic Fishery Management Council and Gulf of Mexico Fishery Manage-ment Council as a single reproduc-tive stock on the basis of minimal data from tag and recapture research and mitochondrial fragment analysis (Hrincevich, 1993). Most early life history information on Cobia comes from aquaculture research, and lit-tle is known about its natural life history.
In the spring and early summer months, Cobias in the western North Atlantic are thought to migrate with warming waters from Florida to the Chesapeake Bay (Shaffer and Na-kamura, 1989). During this puta-tive northward migration, Cobias enter high salinity bays and estuar-
ies, including Port Royal Sound and St. Helena Sound in South Carolina (SC), Pamlico Sound in North Caroli-na (NC; Smith, 1995), and the Chesa-peake Bay (Shaffer and Nakamura, 1989). Cobias have been reported to spawn from April to Septem-ber (Smith, 1995; Lotz et al., 1996; Burns et al.;1 Brown-Peterson et al., 2001). Regional peaks in spawning correlate with their proposed annual migration from Florida to Massachu-setts, occurring in May along the SC coast (Shaffer and Nakamura, 1989; Burns et al.1), June in NC (Smith, 1995), and during June and July in the Chesapeake Bay region (Joseph et al., 1964).
One aspect of Cobia biology that has only recently been investigated is their annual inshore aggregations that occur in high-salinity estuaries. The nature of these aggregations has been hypothesized to be associated with either feeding or reproduction (Joseph et al., 1964; Richards, 1967; Hassler and Rainville, 1975; Smith, 1995; Lotz et al., 1996; Burns et al.1),
1 Burns, K., C. Neidig, J. Lotz, and R. Over-street. 1998. Cobia (Rachycentron canadum) stock assessment study in the Gulf of Mexico and in the south Atlan-tic. Mote Marine Laboratory Technical Report No. 571, 108 p. [Available from Mote Marine Laboratory, 1600 Thomp-son Parkway, Sarasota, FL 342236.]
Darden et al.: Population genetics of Rachycentron canadum 25
and only recently has research verifi ed the reproduc-tive function of these aggregations through documen-tation of the presence of eggs, newly hatched Cobia larvae and reproductively mature females within the Port Royal Sound and St. Helena Sound estuaries in SC (Lefebvre and Denson, 2012). Therefore, the limited understanding of Cobia life history provides confl ict-ing expectations regarding the genetic structure at the population level (hereafter ‘population genetic struc-ture’). On one hand, their pelagic nature and trans-oceanic distribution would indicate a high potential for long distance movement and gene fl ow (i.e., no genetic structure expected); conversely, the presence of site-specifi c spawning aggregations might indicate a low potential for gene fl ow (i.e., genetic structure expect-ed). Because the foundation for effective management of marine fi shes is built upon the determination of bio-logical population segments, a better understanding of Cobia biology and population genetic structure over a broad geographic area is necessary.
Commercial and recreational U.S. harvests of Cobia along the middle and south Atlantic have been highly variable over time, but generally have been increas-ing since 1980 (Atlantic Coastal Cooperative Statistics Program, http://www.ACCSP.org). Concurrently, recre-ational fi shing pressure on Cobias has increased sub-stantially in the last decade, especially in areas where they exhibit annual inshore aggregations (SC, VA) and this pressure has made them susceptible to overfi shing during a potentially critical life stage. In these areas, fi shing tournaments focused solely on Cobias are popu-lar (McGlade, 2007) and “catch and release” is the ex-ception rather than the rule. Therefore, with continued increases in human populations in coastal areas and subsequent increased fi shing pressure on both offshore and inshore coastal fi nfi sh populations, the South Caro-lina Department of Natural Resources (SCDNR) began evaluating the feasibility of stocking Cobias as a man-agement option. In 2001, the SCDNR began collecting Cobias from the wild, developing broodstock condition-ing regimes, spawning broodstock in the laboratory, and producing juveniles for aquaculture development and stock enhancement (Weirich et al., 2004). In addi-tion, efforts were made to collect life history informa-tion (spawning, growth, and genetics) of the wild popu-lations during seasonal migrations. Externally tagged, cultured fi sh were also released into the estuary from which the wild broodstock had been collected as a fi sh-eries research tool to monitor movement, determine appropriate tag types, identify site fi delity, determine growth rates, and verify annulus formation in otoliths.
In 2007, shortly after Pruett et al. (2005) and Ren-shaw et al. (2006) published microsatellite loci for Co-bia, we optimized 3 multiplexed microsatellite panels of 10 loci to use as genetic tags for stocked fi sh and population genetic analyses. Although the genetic tools were not ready for use until 2007, fi n clips were avail-able from all hatchery broodstock used in the program between 2004 and 2007. Here, we present population
genetic data on the basis of the 2008 and 2009 col-lections and recapture data for Cobias collected from south Atlantic coastal waters. Specifi cally, our goals are to characterize the genetic structure of the Cobia population along the southeast Atlantic coast of the United States; determine if population genetic struc-ture is detectable on the basis of movement patterns; document if any degree of estuarine fi delity occurs in Cobias; and evaluate whether genetic data support the reproductive role of their seasonal inshore aggrega-tions. Because of the general lack of knowledge of their biology, we used a multidisciplinary effort over a broad geographical area to address current obstacles facing management of Cobia.
Materials and methods
Broodstock and production
Broodstock used for the production of all stocked fi sh was collected from the Port Royal Sound estuary (Fig. 1); the broodstock pool ranged from 9 to 16 individu-als per year (Table 1). Spawning occurred at the Ma-rine Resources Research Institute in Charleston, SC, and Waddell Mariculture Center in Bluffton, SC, and all rearing occurred in outdoor nursery ponds at the Waddell Mariculture Center. Relatively small numbers of fi sh have been produced and released since 2004; 2007 represented the largest release with ~54,000 fi sh (Table 1). All year classes are identifi able with distinct genetic tags (as described later). Genetic tags offer a noninvasive, permanent approach that can be applied to all sizes of fi sh, including larvae, and they are identi-fi able through parentage analysis. Small juveniles were released at approximately 30 days after hatching, large juveniles at approximately 90 days after hatching, and yearlings the following spring. Yearlings from the 2004 and 2005 year classes were also individually tagged with external tags before release. Either an 89-mm or 127-mm nylon dart tag (Hallprint Pty Ltd.,2 Hind-marsh Valley, Australia) was inserted into the dorsal musculature. All Cobia releases occurred in the Port Royal Sound at the Trask boat landing in Bluffton, SC.
Sampling
Anal-fi n tissue samples were collected from adult Co-bias at fi shing tournaments, fi lleted fi sh carcasses do-nated to SCDNR’s freezer program by cooperating an-glers, and fi sh collected by SCDNR personnel during the spawning seasons of 2008 and 2009 (April–July). Because Cobia is a federally managed species with a minimum size limit of 83.8 cm fork length (~93.8 cm TL), the species is not expected to recruit to the fi shing
2 Mention of trade names or commercial companies is for iden-tifi cation purposes only and does not imply endorsement by the National Marine Fisheries Service, NOAA.
26 Fishery Bulletin 112(1)
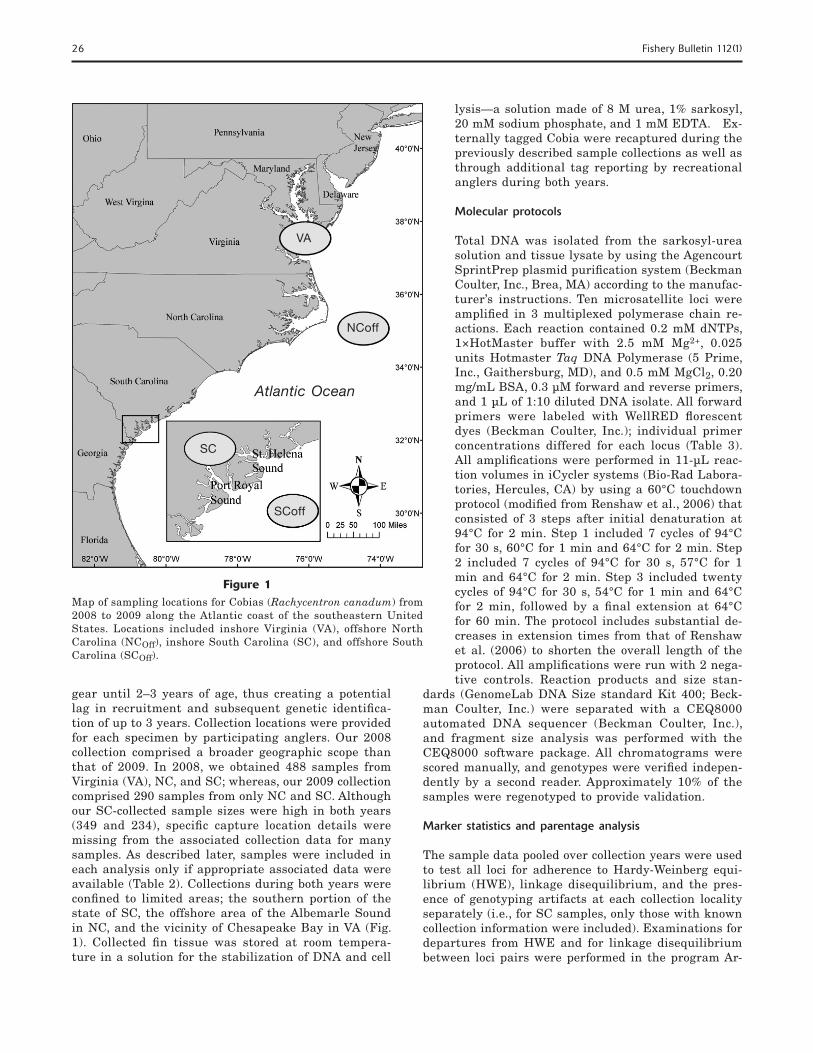
Figure 1Map of sampling locations for Cobias (Rachycentron canadum) from 2008 to 2009 along the Atlantic coast of the southeastern United States. Locations included inshore Virginia (VA), offshore North Carolina (NCOff), inshore South Carolina (SC), and offshore South Carolina (SCOff).
VA
NCoff
SCoff
SC
Atlantic Ocean
gear until 2–3 years of age, thus creating a potential lag in recruitment and subsequent genetic identifi ca-tion of up to 3 years. Collection locations were provided for each specimen by participating anglers. Our 2008 collection comprised a broader geographic scope than that of 2009. In 2008, we obtained 488 samples from Virginia (VA), NC, and SC; whereas, our 2009 collection comprised 290 samples from only NC and SC. Although our SC-collected sample sizes were high in both years (349 and 234), specifi c capture location details were missing from the associated collection data for many samples. As described later, samples were included in each analysis only if appropriate associated data were available (Table 2). Collections during both years were confi ned to limited areas; the southern portion of the state of SC, the offshore area of the Albemarle Sound in NC, and the vicinity of Chesapeake Bay in VA (Fig. 1). Collected fi n tissue was stored at room tempera-ture in a solution for the stabilization of DNA and cell
lysis—a solution made of 8 M urea, 1% sarkosyl, 20 mM sodium phosphate, and 1 mM EDTA. Ex-ternally tagged Cobia were recaptured during the previously described sample collections as well as through additional tag reporting by recreational anglers during both years.
Molecular protocols
Total DNA was isolated from the sarkosyl-urea solution and tissue lysate by using the Agencourt SprintPrep plasmid purifi cation system (Beckman Coulter, Inc., Brea, MA) according to the manufac-turer’s instructions. Ten microsatellite loci were amplifi ed in 3 multiplexed polymerase chain re-actions. Each reaction contained 0.2 mM dNTPs, 1×HotMaster buffer with 2.5 mM Mg2+, 0.025 units Hotmaster Taq DNA Polymerase (5 Prime, Inc., Gaithersburg, MD), and 0.5 mM MgCl2, 0.20 mg/mL BSA, 0.3 µM forward and reverse primers, and 1 µL of 1:10 diluted DNA isolate. All forward primers were labeled with WellRED fl orescent dyes (Beckman Coulter, Inc.); individual primer concentrations differed for each locus (Table 3). All amplifi cations were performed in 11-µL reac-tion volumes in iCycler systems (Bio-Rad Labora-tories, Hercules, CA) by using a 60°C touchdown protocol (modifi ed from Renshaw et al., 2006) that consisted of 3 steps after initial denaturation at 94°C for 2 min. Step 1 included 7 cycles of 94°C for 30 s, 60°C for 1 min and 64°C for 2 min. Step 2 included 7 cycles of 94°C for 30 s, 57°C for 1 min and 64°C for 2 min. Step 3 included twenty cycles of 94°C for 30 s, 54°C for 1 min and 64°C for 2 min, followed by a fi nal extension at 64°C for 60 min. The protocol includes substantial de-creases in extension times from that of Renshaw et al. (2006) to shorten the overall length of the protocol. All amplifi cations were run with 2 nega-tive controls. Reaction products and size stan-
dards (GenomeLab DNA Size standard Kit 400; Beck-man Coulter, Inc.) were separated with a CEQ8000 automated DNA sequencer (Beckman Coulter, Inc.), and fragment size analysis was performed with the CEQ8000 software package. All chromatograms were scored manually, and genotypes were verifi ed indepen-dently by a second reader. Approximately 10% of the samples were regenotyped to provide validation.
Marker statistics and parentage analysis
The sample data pooled over collection years were used to test all loci for adherence to Hardy-Weinberg equi-librium (HWE), linkage disequilibrium, and the pres-ence of genotyping artifacts at each collection locality separately (i.e., for SC samples, only those with known collection information were included). Examinations for departures from HWE and for linkage disequilibrium between loci pairs were performed in the program Ar-
Darden et al.: Population genetics of Rachycentron canadum 27
lequin 3.11 (Excoffi er et al., 2005) with default param-eters. The frequencies of potential null alleles at each locus were estimated in Cervus, vers. 3.0 (Kalinowski et al., 2007). Signifi cance levels for all simultaneous analyses were adjusted with a sequential Bonferroni correction (Rice, 1989).
To confi rm the utility of the marker suite for genetic evaluation and parentage analysis (i.e., identifi cation of genetic tags), loci were examined for genetic diver-sity and polymorphism, for the ability to distinguish between related individuals, and for adherence to the principles of Mendelian inheritance. Basic molecular diversity indices, including number of alleles per locus (Na), and allelic size range were calculated for each lo-cus through the use of Arlequin software. Cervus was used to estimate the average parent-pair and identify nonexclusion probabilities for the loci suite—indices that measure the probability that a set of markers will match erroneous parents to offspring and the probabil-ity that a set of markers will not be able to distinguish between related individuals, respectively.
To determine whether hatchery individuals contrib-uted to the southeastern Atlantic Cobia populations, parentage analyses were conducted that incorporated all fi eld samples and hatchery broodstock. Simula-tions (n=5) for the “sexes known” parentage analysis in Cervus consisted of 10,000 offspring and 8 candi-date parent pairs per year (100% sampled) with allele frequencies generated from all Cobia samples. Critical delta values were determined with 95% confi dence for the relaxed criteria and with 99% confi dence for the strict criteria. All parentage analyses were run with the modal simulation fi le. Although all project samples
genotyped at 8 or more loci were sub-jected to parentage analyses, contribu-tion calculations were limited to only those sampled within the stocking area. The percentage of hatchery con-tribution is reported as [S(W+S)–1]100, where S is the number of stocked in-dividuals and W is the number of wild individuals as designated by Cervus at the strict confi dence level because no additional offspring were identifi ed with the relaxed criteria. Contribution is reported in terms of both population (all samples) and year class (on the ba-sis of known-age fi sh). All sampled fi sh identifi ed as being of hatchery origin were removed from population struc-ture analyses. Identity analyses (as implemented in Cervus) were also con-ducted to compare the 2008 and 2009 samples in order to identify recaptures of both hatchery and wild individuals.
For the Mendelian inheritance tests, 25 offspring from two parental families of the 2007 hatchery production year were compared with the 2007 brood-
stock by using Probmax, vers. 3.1 parentage analysis software (Danzmann, 1997) to verify the contributing parent pairs. The genotypes of the contributing parents were merged into a single fi le and imported into FAP 3.6 (Taggart, 2007), to generate all the possible prog-eny genotypes associated with these parental crosses. A chi-square analysis (χ2) was performed to compare the observed genotypic frequencies from the progeny data set with the expected genotypic frequencies from FAP.
Population genetic analyses
For all population genetic analyses, samples were partitioned into those from the inshore aggregations (defi ned as being captured landward of the barrier island, either along the coast or in the estuary) and
Table 1
Summary of data for tagged and released cultured Cobia (Rachycentron canadum) in South Carolina by release year, with number of broodstock used for production, size at release, mean total length (TL), and number of individuals released. Small juveniles were released during the summer of the production year, large juveniles were released during the fall of the production year, and yearlings were released the following spring.
Year Number of Size at Mean TL Numberclass broodstock release (mm) released
2004 8 Small juveniles 97 1128 Large juveniles 328 679 Yearlings 496 932005 7 Small juveniles 56 3200 Large juveniles 230 516 Yearlings 545 3852007 16 Small juveniles 82 53,264 Large juveniles 250 409 Yearlings 541 592008 11 Large juveniles 249 2000 Yearlings 530 542009 9 Large juveniles 235 1392
Table 2
Distribution of Cobia (Rachycentron canadum) collected during 2008 and 2009 with a known collection location that were included in the analyses of population genetic structure. Dashes indicate locations where no sampling occurred.
those from offshore areas (defi ned as captured seaward of the barrier islands, mostly near wrecks or reefs); samples without suffi cient collection details for assign-ment were excluded (Table 2). Samples collected from the Port Royal Sound and St. Helena Sound estuaries were pooled for the SC inshore location because tagged fi sh recaptured after being at liberty for only a short period indicated substantial movement between these adjacent and connected estuaries.
An exact G-test with Markov Chain permutations, as implemented in Genepop, vers. 4.0.10 (Raymond and Rousset, 1995), was used to test for pairwise differences in genotypic distributions among collec-tion locations during each collection year. Markov chain parameters included 10,000 dememorizations, 100 batches, and 5000 iterations per batch. Part of the analyses of genetic structure used RST statistics, which incorporate a stepwise mutation model to es-timate population differentiation and are analogous to FST statistics (Slatkin, 1995). Pairwise, hierarchi-cal RST statistics were calculated and an analysis of molecular variance (AMOVA) was conducted—as im-plemented in Arlequin with 10,000 iterations to de-termine the degree of genetic structuring occurring among states. Structure, vers. 2.3 (Pritchard et al., 2000) also was used to infer subpopulations through a clustering-based algorithm. The Admixture with LocPrior model was implemented, including runs of k=1–4 for the 2008 collection and k=1–3 for the 2009 collection. All models incorporated 10,000 iterations and a 10,000 burn-in period and were replicated in triplicate. Pairwise comparisons of genotypic distri-butions and RST calculations between 2008 and 2009 collection locations were conducted as described pre-viously to determine the degree of temporal genetic stability of Cobia populations along the southeast-
ern U.S. Atlantic coast as well as to validate tempo-ral pooling of samples for genetic characterization of detected populations. Populations were characterized genetically by calculation of the average number of alleles per locus (Na), observed heterozygosity (HO), genetic diversity (HE; Nei, 1987), and inbreeding coef-fi cients (FIS) by using Arlequin and Genepop.
Results
For this project, 764 individuals were genotyped. For both collection years, high proportions of loci were able to be scored unambiguously with high repeatability (>99%), resulting in low levels of missing data (2008: 1.6%; 2009: 0%). Genetic data from 519 samples were used for all loci testing (Table 2). All loci at all collec-tion locations were found to be in HWE (P>0.05), with no evidence of null alleles (frequency<0.06) and no indication of linkage disequilibrium between any loci (critical P-value after Bonferonni=0.001). All 10 loci were polymorphic with allelic richness ranging from 6 to 28 (mean: 15.4 alleles per locus) (Table 3). The χ2 test for comparing hatchery broodstock and offspring indicated that all loci are inherited in a Mendelian fashion (Table 4).
The loci suite provides an average nonexclusion parent-pair probability of 1.3×10⁻⁷ and average non-exclusion identity probability of 5.8×10⁻¹², signifying that the possibility of misassignment of parentage in the parentage analysis is substantially less than 0.01% and individuals can be identifi ed confi dently. Therefore, on the basis of initial tests, our suite of microsatel-lite markers is valuable for characterization of popula-tion genetic diversity and genetic structure, as well as for parentage analysis because the loci are genetically
Table 3
Multiplex group (panel), locus, fl uorescent label (dye), repeat motif, and primer concentrations (µM) for poly-merase chain reactions for 10 Cobia-specifi c microsatellite loci (modifi ed from Renshaw et al., 2006). Summary statistics for each locus were based on the total combined project data set. n=sample size, NA= number of al-leles, A=allelic size range.
Panel Locus WellRED dye Repeat motif [Primer] n NA A
Darden et al.: Population genetics of Rachycentron canadum 29
Table 4
Mendelian inheritance statistics for two independent families of Cobia (Rachycentron canadum): chi-square (χ2) values, degrees of freedom (df), and P-values at each of the 10 Cobia-specifi c microsatellite loci. For two loci in family 2, both parents were homozygous for different alleles and all offspring were fi xed heterozygotes, as expected (an asterisk indicates each of these loci).
varied, adhere to the expectations of Mendelian in-heritance, distinguish between related individuals, and correctly match offspring to their parents with a high degree of confi dence.
Movement and estuarine fi delity
No fi sh collected outside of SC were genetically iden-tifi ed as SC-stocked fi sh; therefore our evaluation of hatchery contribution represents their contribution to SC Cobia populations. Parentage analysis of 341 sam-ples identifi ed two fi sh in the SC 2008 collections that were both originally stocked in 2004 into Port Royal Sound. On the basis of otolith aging, 174 fi sh from the 2004 year class (YC) were present in the SC 2008 col-lections. Therefore, the 2004 stocked fi sh made a 1.1% contribution to the SC 2004 YC of Cobias. A large num-ber of the SC 2008 samples, including the two recap-tured stocked fi sh, were missing specifi c collection de-tails. Without these details, we were unable to assign samples to inshore and offshore groups. Therefore, the year-class contribution was estimated on the basis of all SC samples—an assessment that likely underesti-mated the true contribution. From the 2008 samples, the 2004 YC stocked fi sh represented 0.6% of all SC-collected samples.
From the 2009 collections (n=232), 11 stocked fi sh were identifi ed, all from the 2007 YC small juvenile stockings in Port Royal Sound. Thirteen 2007 YC fi sh were identifi ed in the 2009 collections, resulting in an 84.6% contribution of stocked fi sh to the SC Cobia 2007 YC and a 4.7% contribution to the overall SC popula-
tion of sampled Cobias. Of the identifi ed stocked fi sh, 8 were recaptured within the Port Royal Sound estu-ary, and the remaining 3 recaptured stocked fi sh did not have suffi cient collection information for group as-signment. In addition to the recapture of stocked fi sh in their release estuary, one wild fi sh was recaptured within the Port Royal Sound estuary in multiple years (this fi nding was based on genetic identity analyses—see previous section). No wild recaptures were detected among different collection locations. Although these recaptures were represented by low sample sizes, the pattern of site fi delity among all recapture groups was consistent.
For external tag recaptures, 7 tag returns were re-ported from the 2004 YC of stocked yearling Cobias (93 originally stocked; Table 5). Within 32 days after release (mean of 25 days at large), 5 of the fi sh were recaptured, and 1 fi sh was recaptured later that sum-mer; however, the remaining fi sh was recaptured the following spring after 370 days at large. All tag returns of 2004 YC fi sh were recaptured within the SC inshore area. From the 2005 YC fi sh that were stocked with ex-ternal tags (n=385), 58 were recaptured over a 3-year period. Two of these recaptures were reported with no collection information. Within 40 days after release (mean of 17 days at large), 44 of the 2005 YC fi sh were recaptured, and all of the fi sh that were reported with location information were recaptured within the SC in-shore area. Of the remaining fi sh, 7 were recaptured within the SC inshore area 2–3 years after their stock-ing during the spawning season; these fi sh had a mean of 813 days at large. The fi nal 5 fi sh were recaptured
30 Fishery Bulletin 112(1)
outside of the stocked area (3 in SC and 2 in Florida); however, these fi sh were recaptured either outside of the spawning season (September–October) or just be-fore or at the onset of the spawning season (early May). Although the sample sizes for recaptures at large for at least one year were small (n=13), all of the recaptures during the spawning season (n=8) occurred within the inshore vicinity of the stocked estuary.
Population structure
On the basis of the 2008 samples, pairwise compari-sons of both genotypic distributions and hierarchical RST values indicated no differences among the off-shore collection locations (G-test: P=0.075, RST=0.005, P=0.14; Table 6). However, the two inshore collec-tion locations were signifi cantly different from both each other (G-test: P<0.001; RST: 0.043, P<0.001) and from the homogenous offshore group (G-test:
P<0.001; RST: 0.011–0.023, P<0.05); with the excep-tion of the inshore VA and offshore NC collection lo-cations. The AMOVA results were consistent with this pattern, showing signifi cant differences among populations (1.6%, P<0.001, Table 7) and the highest proportion of among-group molecular variation (1.3%) when grouped according to the pair-wise results. Re-sults derived from the 2009 samples were concor-dant with the patterns detected in 2008 (AMOVA: 1.2%, P<0.001; 2.3% among groups), with the SC in-shore collection being signifi cantly different (G-test: P<0.001; RST: 0.017–0.018, P<0.009) from the ho-mogenous NC and SC offshore group (G-test: P=0.53; RST=0.006, P=0.16; Table 8). Results from use of the Structure software for both collection years supported the pairwise and AMOVA patterns of genetic differen-tiation (Fig. 2). On the basis of trajectories of both Ln probabilities and variance metrics, k (number of popu-lations) was estimated at 3 populations for the 2008
Table 5
Summary of recapture information for Cobia (Rachycentron canadum) released in South Carolina with external tags. Distance values represent the distance from the specifi c stocking location in Port Royal Sound to the recapture location. Calibogue Sound is a small estuary in the vicinity of Port Royal Sound and St. Helena Sound estuaries in South Carolina (SC).
Year Release Recapture Recapture Days at Distanceclass Tag no. date date location large (km)
2004 M0562 05/11/05 05/27/05 Port Royal Sound 16 –2004 M1472 05/11/05 05/28/05 Port Royal Sound 17 10.02004 M1382 05/11/05 06/09/05 Port Royal Sound 29 10.02004 M1397 05/11/05 06/09/05 Port Royal Sound 29 10.02004 M1434 05/11/05 06/12/05 Port Royal Sound 32 –2004 M1477 05/11/05 08/25/05 Port Royal Sound 106 11.62004 M1326 05/11/05 05/16/06 Port Royal Sound 370 –2005 M2079 05/03/06 05/07/06 Port Royal Sound 4 0.02005 M2245 04/27/06 05/02/06 Port Royal Sound 5 12.22005 M2082 05/03/06 05/10/06 Port Royal Sound 7 11.02005 M2357 05/03/06 05/10/06 Port Royal Sound 7 11.02005 M2360 05/03/06 05/10/06 Port Royal Sound 7 10.02005 M2327 05/08/06 05/16/06 Port Royal Sound 8 10.02005 M2282 04/27/06 05/06/06 Port Royal Sound 9 10.02005 M2081 05/03/06 05/12/06 Port Royal Sound 9 9.32005 M2227 05/03/06 05/12/06 Port Royal Sound 9 12.22005 M2310 05/08/06 05/17/06 – 9 –2005 M2089 05/03/06 05/13/06 Port Royal Sound 10 11.02005 M2234 04/27/06 05/08/06 Port Royal Sound 11 11.02005 M2239 04/27/06 05/08/06 – 11 –2005 M2321 05/08/06 05/20/06 Port Royal Sound 12 10.02005 M2018 04/27/06 05/10/06 Port Royal Sound 13 0.02005 M2091 05/03/06 05/17/06 Port Royal Sound 14 11.02005 M2132 05/03/06 05/17/06 Port Royal Sound 14 –2005 M2155 05/03/06 05/17/06 Port Royal Sound 14 11.02005 M2205 05/03/06 05/17/06 Port Royal Sound 14 10.02005 M2285 05/08/06 05/22/06 Port Royal Sound 14 11.02005 M2024 04/27/06 05/12/06 Port Royal Sound 15 10.02005 M2210 05/03/06 05/19/06 Port Royal Sound 16 11.0
Darden et al.: Population genetics of Rachycentron canadum 31
Table 5 (continued)
2005 M2211 05/03/06 05/19/06 Port Royal Sound 16 11.02005 M2028 04/27/06 05/14/06 St. Helena Sound 17 62.02005 M2102 05/03/06 05/20/06 – 17 –2005 M2086 05/03/06 05/21/06 Port Royal Sound 18 11.02005 M2107 05/03/06 05/21/06 Port Royal Sound 18 11.02005 M2146 05/03/06 05/21/06 Port Royal Sound 18 11.02005 M2007 04/27/06 05/16/06 Port Royal Sound 19 11.02005 M2187 05/03/06 05/22/06 Port Royal Sound 19 11.02005 M2005 04/27/06 05/17/06 Port Royal Sound 20 11.02005 M2042 04/27/06 05/17/06 Port Royal Sound 20 11.02005 M2002 04/27/06 05/19/06 Port Royal Sound 22 11.02005 M2232 04/27/06 05/19/06 Port Royal Sound 22 11.02005 M2016 04/27/06 05/21/06 Port Royal Sound 24 –2005 M2039 04/27/06 05/21/06 Port Royal Sound 24 –2005 M2163 05/03/06 05/29/06 – 26 –2005 M2223 05/03/06 05/29/06 – 26 –2005 M2241 04/27/06 05/24/06 Port Royal Sound 27 –2005 M2068 05/03/06 06/05/06 – 33 –2005 M2141 05/03/06 06/05/06 St. Helena Sound 33 54.72005 M2015 04/27/06 06/02/06 Port Royal Sound 36 11.02005 M2027 04/27/06 06/02/06 Port Royal Sound 36 11.02005 M2242 04/27/06 06/06/06 Port Royal Sound 40 11.02005 M2377 05/03/06 05/05/07 Charleston Harbor 367 123.92005 M2249 05/03/06 09/15/07 Offshore SC 500 65.52005 M2131 05/03/06 05/20/08 Port Royal Sound 748 11.02005 M2238 04/27/06 05/20/08 Calibogue Sound 754 44.32005 M2017 04/27/06 05/25/08 Port Royal Sound 759 20.62005 M2281 04/27/06 05/30/08 Port Royal Sound 764 11.02005 M217? 05/03/06 06/18/08 Port Royal Sound 777 20.02005 M2046 04/27/06 06/18/08 Port Royal Sound 783 20.02005 M2197 05/03/06 10/03/08 Offshore SC 884 77.22005 M2118 05/03/06 05/11/09 Offshore FL 1104 241.42005 M2387 05/03/06 05/15/09 Port Royal Sound 1108 11.02005 M2265 05/03/06 09/14/09 St. Mary’s River, FL 1230 207.62005 M2004 04/27/06 – – – –2005 M2051 05/03/06 – – – –
Table 6
Summary of results for the comparision of genotypic distribution (P-values below diagonal) and RST pairwise (above diagonal) location from the 2008 sample collec-tions of Cobia (Rachycentron canadum). Collection lo-cations included inshore Virginia (VA), offshore North Carolina (NCOff), and offshore South Carolina (SCOff), and inshore South Carolina (SC). Bold type indicates statistical signifi cance after Bonferroni correction (criti-cal P=0.008).
collection and 2 populations for the 2009 collections. Consistent with the low RST estimates, the results from the Structure software indicated the presence of mixed ancestry among these populations.
Temporal within-location comparisons of the 2008 and 2009 collections showed no significant differ-ences in genetic compositions (G-test: P=0.51–0.56; RST<0.006, P>0.016), validating the pooling of samples across collection years for population characterization. Basic molecular diversity indices were similar among collection locations, with high levels of genetic diver-sity across all loci and high levels of polymorphism (Table 9). The mean number of alleles per locus ranged from 10.4 to 14.0 (average allelic range: 14.5–16.4). The overall average observed heterozygosity for Cobias was moderate and ranged from 0.709 in the SC inshore col-lection to 0.772 in the VA inshore collection, with the NC and SC offshore collections showing intermediate
32 Fishery Bulletin 112(1)
Table 7
Summary of analysis of molecular variance (AMOVA) indicating partitioning of genetic variation on the basis of our 2008 (top) and 2009 (bottom) sample collections of Cobia (Rachycentron canadum) in South Carolina. df=degrees of freedom.
Collection Sum of Variance Percentageyear Source of variation df squares component of variation P-value
2008 Among populations 3 973 1.6 1.6 <0.0001 Within populations 594 56,980 95.9 98.4 Total 597 57,953 97.5
2009 Among populations 2 473 1.1 1.2 <0.0001 Within populations 437 37,760 86.4 98.8 Total 439 38,233 87.5
Table 8
Results of the genotypic distribution (P-values below di-agonal) and RST pair-wise (above diagonal) comparisons of locations from the 2009 sample collections of Cobia (Rachycentron canadum). Collection locations were off-shore North Carolina (NCOff), offshore South Carolina (SCOff), and inshore South Carolina (SC). Bold type in-dicates statistical signifi cance following Bonferroni cor-rection (critical P=0.017).
diversity. Inbreeding was low (P>0.21; FIS<0.07) in all collection locations.
Discussion
In recent years, SCDNR has expanded the use of ge-netic tools to identify many types of stocked fi sh, spe-cifi cally Red Drum (Sciaenops ocellatus), Striped Bass (Morone saxatilis), and Spotted Seatrout (Cynoscion nebulosus), and to characterize their genetic popula-tion structure. These tools create permanently identifi -able tags with the use of microsatellite markers that are useful for genetically characterizing fi sh popula-tions. South Carolina’s Cobia research program is the fi rst to begin rigorously evaluating U.S. populations from a genetic perspective. On the basis of our U.S. collections of Cobias encountered along the south At-lantic coast, tests of both genotypic distributions and pairwise hierarchical RST statistics indicate that the offshore groups are genetically homogenous, a fi nding
that is consistent with Hrincevich’s (1993) fi ndings. However, the detection of the two genetically distinct inshore aggregations (SC and VA) is new information in our understanding of Cobia life history. Although a signifi cant degree of genetic isolation was detected among these inshore aggregations and the offshore group, the low RST statistics and the mixed ancestry patterns indicate that a low level of gene fl ow does occur.
We recognize that population structure can be easily masked by a mixed stock effect, whereby gene fl ow is limited among population groups by different spawn-ing behaviors, yet intermingling occurs outside of the spawning period. For example, if populations of fi sh spawn in unique locations but intermingle and migrate with other populations during the nonspawning season, the composition of nonspawning breeding stocks would appear to be homogenous in terms of allele frequency distributions, whereas gene fl ow would be restricted to individuals spawning at each unique spawning site. Only sampling of spawning individuals at each unique spawning site would reveal the true genetic structure. Although we have temporally limited our sampling to the spawning period of Cobia, it is possible that the lack of detected genetic differences between the VA inshore aggregation and the NC offshore samples is due to con-founding effects of the potential migration patterns of Cobia. In a migrating species, the logistics of sampling individuals in one location without resampling from the same group in another location is challenging. Al-though temporally limiting sampling can lessen the confounding effects of such migrations on evaluations of population genetics, in the case of Cobias, the lim-ited period of accessibility for sampling coincides with both their spawning season as well as their proposed northward migration. Therefore, although our sampling was temporally limited, it is possible that VA individu-als were present among the Cobias collected offshore of NC as they were completing their migration to the VA inshore aggregation.
Darden et al.: Population genetics of Rachycentron canadum 33
Figure 2Results of genetic analyses with the use of Structure software for (A) the 2008 and (B) 2009 collections of Cobia (Rachycen-tron canadum), where each column represents an individual sample and the shades of gray represent the ancestral popula-tions. Multiple shades within a column indicate an individual of mixed ancestry. Collection locations are grouped together and are the following: offshore North Carolina (NCOff), inshore South Carolina (SC), offshore South Carolina (SCOff), and inshore Virginia (VA).
A
B
Table 9
Summary of genetic diversity statistics pooled across collection years for Cobia (Rachycentron canadum). Collection locations included inshore Virginia (VA), offshore North Carolina (NCOff), inshore South Carolina (SC), and offshore South Carolina (SCOff). n=sample size, NA=average number of alleles per locus, HO=average observed heterozygosity across loci, HE=average expected heterozygosity across loci, FIS=inbreeding coeffi cient.
The genesis of Cobia research in SC began with the need to collect life history information to explore the potential of this species for aquaculture produc-tion and to better understand the impact stocking
may have on a highly migratory species. The scope of our program not only encompassed gathering infor-mation on basic life history and population dynamics from the wild population, but also incorporated infor-
mation on tagged stocked animals to better understand movement patterns and fi delity to natal estuaries. Collec-tion of such information has proven to be useful for interpreting genetic results. The detection of stocked fi sh from multiple year classes of fi sh re-leased within the Port Royal Sound estuary was somewhat unexpected given the many unknowns regarding Cobia life history (e.g., their use of juvenile habitat, their home ranges, movement patterns, and spawning mi-grations). Although the initial 1.1% contribution to the 2004 YC appears low, when considering the limited number of fi sh originally released, we interpreted these results as being pos-
Pro
po
rtio
n o
f A
nces
try
Pro
po
rtio
n o
f A
nces
try
1.00
0.80
0.60
0.40
0.20
0.00
1.00
0.80
0.60
0.40
0.20
0.00
NCOff SC SCOff VA
NCOff SC SCOff
34 Fishery Bulletin 112(1)
itive in terms of the potential for stock enhancement to be effective as a fi sheries management tool for Cobia. The results show how understanding life his-tory attributes is necessary to designing a stocking program for a highly migratory pelagic species. The much higher stocking contribution observed in 2009 following the larger 2007 YC release during their fi rst year of potential recruitment to the fi shing gear provides additional support for the effi cacy of stock enhancement. Furthermore, the recapture of these stocked fi sh within their release estuary two years after release indicates that some degree of estuarine fi delity occurs within these inshore Cobia aggrega-tions, supporting the identifi cation of the unique ge-netic structure in wild fi sh populations. Estuarine fi delity is also indicated by the recapture of an in-dividual wild fi sh within the Port Royal Sound es-tuary during multiple collection years; as well as by the high incidence of external tag recapture reports occurring within the Port Royal Sound area. There-fore, these results complement both the previously observed high site fi delity in SC (Hammond3) and Lefebvre and Denson’s (2012) documented spawning function of the inshore aggregations on the basis of positive Cobia egg and larval detection within the Port Royal Sound estuary.
In the Persian Gulf and Oman Sea, Salari Aliabadi et al. (2008) also investigated small-scale population structure in Cobias, using microsatellite markers. Al-though they reported the presence of 3 distinct genetic populations along their northern coasts, their study was likely confounded by small sample sizes, lack of a temporal sampling design, and no corrections for mul-tiple comparisons in their analyses as they were un-able to identify any potential behavioral or geographic mechanisms of genetic isolation among detected group-ings. In contrast, we used robust sampling and analysis approaches that provided links between the detected genetic structure and the several indications of mecha-nisms of genetic isolation (seasonal aggregations and estuarine fi delity).
Conclusions
The genetic diversity, in terms of both gene diver-sity and allelic richness, detected in Cobias along the southeastern U.S. Atlantic coast is similar to that re-ported in both Iran (Salari Aliabadi et al., 2008) and the northern Gulf of Mexico (Pruett et al., 2005), and all metrics are somewhat higher than the averages re-ported for marine fi shes (DeWoody and Avise, 2000). Therefore, on the basis of the genetic characterization
3 Hammond, D. 2001. Status of the South Carolina fi shery for cobia. South Carolina Department of Natural Resources Technical Report Number 89, 22 p. [Available from the Offi ce of Fisheries Management, Marine Resources Division, South Carolina Department of Natural Resources, P.O. Box 12559, Charleston, SC 29422-2559.]
along the southeastern Atlantic coast of the United States, Cobia appears to be quite genetically diverse both overall and within localized areas and exhibits temporal stability over the project period. However, the detection of discrete genetic structure for Cobia within this portion of its range has implications for the ap-propriate management of this important recreational fi sheries species.
As with many aspects of Cobia’s life history, the im-plications of our genetic results for management are not straightforward. For example, information gathered from the offshore collections shows high levels of move-ment along the southeastern U.S. Atlantic, and a rec-ommendation founded only on that observation might include continuation of the single population man-agement strategy because overfi shing in one offshore area would affect other areas as well. In contrast, a recommendation made solely on the basis of the in-shore collections that indicate the presence of distinct population segments and estuarine fi delity in Cobia might favor separate management of the population segments because localized fi shing pressure would pri-marily impact the local population. However, perhaps given the complicated life history of the Cobia, a more appropriate recommendation would be to use a 2-tiered strategy, in which Cobias are managed regionally as a single population for offshore fi shery activities, but are also managed at the local level (state management) for aggregation-specifi c inshore fi shing activities. Consid-ering the genetic uniqueness of the inshore aggrega-tions, there is concern that the majority of the fi shing pressure on these aggregations targets the reproduc-tive pool of Cobia on their spawning grounds. Although there is still much to learn about the intricacies of Co-bia life history, the results presented here are needed for informed decisions regarding the future manage-ment of this recreationally and commercially important species.
Acknowledgments
The authors wish to thank the charter boat captains and cooperating fi shermen in VA, NC, SC, and Flori-da who provided genetic samples and reported exter-nal tags—for their efforts without which we would not have been able to complete this research. We also thank L. Borecki, B. Cushman, D. Farrae, M. Jamison, W. Jenkins, L. Lefebvre, B. McAbee, M. Perkinson, and C. Tarpey for providing invaluable assistance and com-ments on this project. We appreciate the cooperation of M. Renshaw and J. Gold during our initial project work. Our work was funded in part by the South Caro-lina Department of Natural Resources and grant no. 114775-GL10013 (grant in aid no. NA16RG1646) from the National Marine Aquaculture Initiative of the Na-tional Oceanic and Atmospheric Administration. This publication is number 692 from the Marine Resources Research Institute.
Darden et al.: Population genetics of Rachycentron canadum 35
Literature cited
Brown-Peterson, N. J., R. M. Overstreet, J. M. Lotz, J. S. Franks, and K. M. Burns.
2001. Reproductive biology of cobia, Rachycentron canadum, from coastal waters of the southern United States. Fish. Bull. 99:15–28.
Danzmann, R. G.1997. Probmax: a computer program for assigning un-
known parentage in pedigree analysis from known ge-notypic pools of parents and progeny. J. Hered. 88:333.
DeWoody, J. A., and J. C. Avise.2000. Microsatellite variation in marine, freshwater, and
anadromous fi shes compared to other animals. J. Fish. Biol. 56:461–473.
Excoffi er L., G. Laval, and S. Schneider.2005. Arlequin (version 3.0): an integrated software
package for population genetics data analysis. Evol. Bioinformatics Online 1:47–50.
Hassler, W. W., and R. P. Rainville.1975. Techniques for hatching and rearing cobia, Rachy-
centron canadum, through larval and juvenile stag-es. Sea Grant College Prog. Rep. UNC-SC-75-30, 26 p. Univ. North Carolina, Raleigh, NC.
Hrincevich, A. W.1993. Mitochondrial DNA analysis of cobia Rachycentron
canadum population structure using restriction frag-ment length polymorphisms and cytochrome b sequence variation. M.S. thesis, 92 p. Univ. Southern Missis-sippi, Hattiesburg, MS.
Joseph, E. B., J. J. Norcross, and W. H. Massmann.1964. Spawning of the cobia, Rachycentron canadum, in
the Chesapeake Bay Area, with observations of juvenile specimens. Chesapeake Sci. 5:67–71.
Kalinowski, S. T., M. L. Taper, and T. C. Marshall.2007. Revising how the computer program CERVUS ac-
Lefebvre, L. S., and M. R. Denson.2012. Inshore spawning of cobia. (Rachycentron cana-
dum) in South Carolina. Fish. Bull. 110:397–412.Lotz, J. M., R. M. Overstreet, and J. S. Franks.
1996. Gonadal maturation in the cobia, Rachycentron canadum, from the northcentral Gulf of Mexico. Gulf Res. Rep. 9:147–159.
McGlade, M.2007. Cobia at the Chesapeake. Virginia Wildlife 68:
12–16.Nei, M.
1987. Molecular evolutionary genetics, 512 p. Columbia Univ. Press, New York.
Pritchard, J. K., M. Stephens, and P. Donnelly.2000. Inference of population structure using multilocus
genotype data. Genetics 155:945–959.Pruett, C. L., E. Saillant, M. A. Renshaw, J. C. Patton, C. E.
Rexroad III, and J. R. Gold.2005. Microsatellite DNA markers for population genetic
studies and parentage assignment in cobia, Rachycen-tron canadum. Mol. Ecol. Notes 5:84–86.
Raymond, M., and F. Rousset.1995. Genepop (version 1.2): population genetics soft-
ware for exact tests and ecumenicism. J. Hered. 86:248–249.
Renshaw, M. A., E. Saillant, S. C. Bradfi eld, and J. R. Gold.2006. Microsatellite multiplex panels for genetic stud-
ies of three species of marine fi shes: red drum (Sciae-nops ocellatus), red snapper (Lutjanus campechanus), and cobia (Rachycentron canadum). Aquaculture 253:731–735.
Rice, W. R.1989. Analyzing tables of statistical tests. Evolution
43:223–225.Richards, C. E.
1967. Age, growth, and fecundity of the cobia, Rachycen-tron canadum, from Chesapeake Bay and adjacent mid-Atlantic waters. Trans. Am. Fish. Soc. 96:343–350.
Salari Aliabadi, M. A., S. Rezvani Gilkolaei, A. Savari, H. Zol-gharnein, and S. M. B. Nabavi.
2008. Microsatellite polymorphism in Iranian popula-tions of cobia (Rachycentron canadum G.). Biotechnol-ogy 7:775–780.
Shaffer, R. V., and E. L. Nakamura.1989. Synopsis of biological data on the cobia Rachycen-
tron canadum. Pisces: Rachycentridae. NOAA Tech. Rep. NMFS 82 (FAO Fisheries Synopsis 153), 21 p.
Slatkin, M.1995. A measure of population subdivision based on mi-
crosatellite allele frequencies. Genetics 139:457–462.Smith, J. W.
1995. Life history of cobia, Rachycentron canadum (Os-teichthyes: Rachycentridae), in North Carolina. Brim-leyana 23:1–23.
Taggart, J. B.2007. FAP: an exclusion-based parental assignment pro-
gram with enhanced predictive functions. Mol. Ecol. Notes 7:412–415.
Weirich, C. R., T. I. J. Smith, M. R. Denson, A. D. Stokes, and W. E. Jenkins.
2004. Pond rearing of larval and juvenile cobia, Rachy-centron canadum, in the southeastern United States: initial observations. J. Appl. Aquacult. 16:27–44.