19
74

74
CHILD POPULATION (0-6 AGE GROUP)
PROVISIONAL POPULATION TOTALS 75
CHILD POPULATION (0-6 AGE GROUP)
4

76
Every child comes with the message that God is not yet discouraged of man ”
-Rabindranath Tagore
“
CHILD POPULATION (0-6 AGE GROUP)
PROVISIONAL POPULATION TOTALS 77
CHILD POPULATION (0-6 AGE GROUP)
4
Data on child population in the age group 0-6 is primarily intended for calculating the effective
literacy rates. However it also allows us to broadly analyse possible linkages of child population
with growth of population. Higher levels of literacy and economic development, in addition
to adoption of family planning measures are important factors that have led to smaller family
sizes causing a decline in child population.
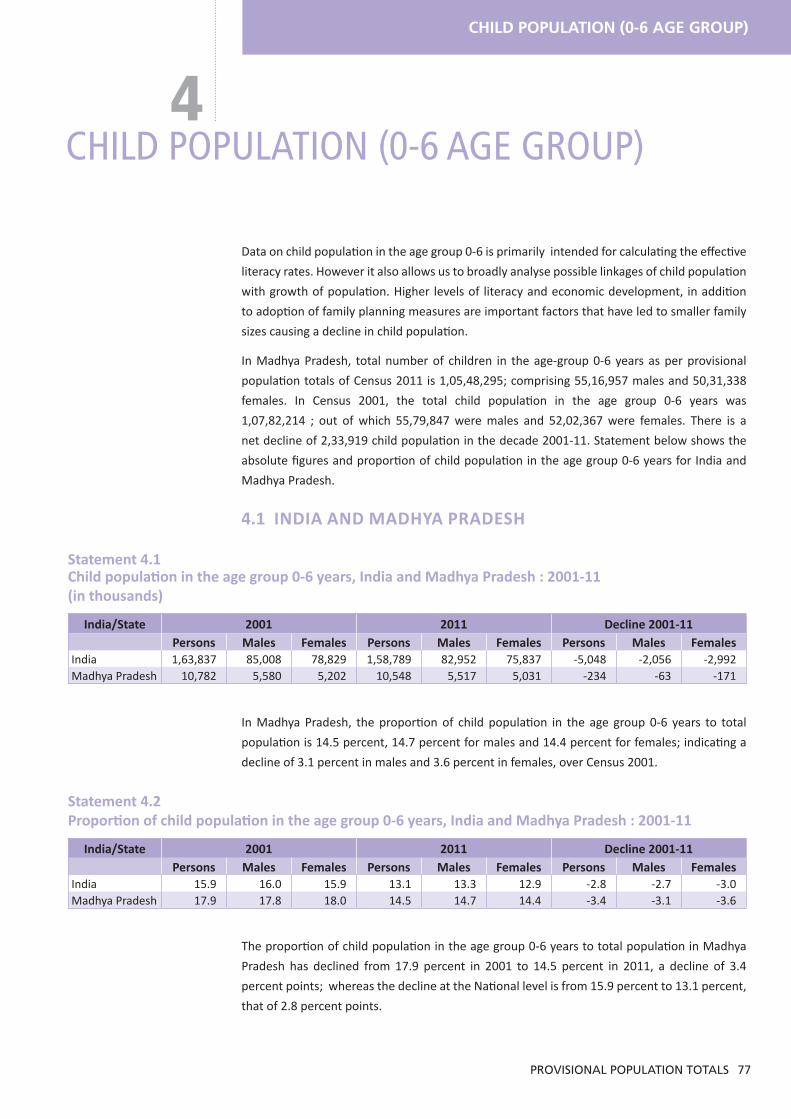
In Madhya Pradesh, total number of children in the age-group 0-6 years as per provisional
population totals of Census 2011 is 1,05,48,295; comprising 55,16,957 males and 50,31,338
females. In Census 2001, the total child population in the age group 0-6 years was
1,07,82,214 ; out of which 55,79,847 were males and 52,02,367 were females. There is a
net decline of 2,33,919 child population in the decade 2001-11. Statement below shows the
absolute figures and proportion of child population in the age group 0-6 years for India and
Madhya Pradesh.
4.1 INDIA AND MADHYA PRADESH
Statement 4.1 Child population in the age group 0-6 years, India and Madhya Pradesh : 2001-11 (in thousands)
India/State 2001 2011 Decline 2001-11Persons Males Females Persons Males Females Persons Males Females
India 1,63,837 85,008 78,829 1,58,789 82,952 75,837 -5,048 -2,056 -2,992Madhya Pradesh 10,782 5,580 5,202 10,548 5,517 5,031 -234 -63 -171
In Madhya Pradesh, the proportion of child population in the age group 0-6 years to total
population is 14.5 percent, 14.7 percent for males and 14.4 percent for females; indicating a
decline of 3.1 percent in males and 3.6 percent in females, over Census 2001.
Statement 4.2 Proportion of child population in the age group 0-6 years, India and Madhya Pradesh : 2001-11
India/State 2001 2011 Decline 2001-11Persons Males Females Persons Males Females Persons Males Females
India 15.9 16.0 15.9 13.1 13.3 12.9 -2.8 -2.7 -3.0Madhya Pradesh 17.9 17.8 18.0 14.5 14.7 14.4 -3.4 -3.1 -3.6
The proportion of child population in the age group 0-6 years to total population in Madhya
Pradesh has declined from 17.9 percent in 2001 to 14.5 percent in 2011, a decline of 3.4
percent points; whereas the decline at the National level is from 15.9 percent to 13.1 percent,
that of 2.8 percent points.

78
0.0
5.0
10.0
15.0
20.0
2001 2011
Perc
enta
ge
Census Year
India Madhya Pradesh
Fig. 4.1 Percentage of 0-6 years child population,India and Madhya Pradesh: 2001-11
Fig: 4.2 Share of child population in the age group 0-6 years to total population, India and Madhya Pradesh
Madhya Pradesh
child 0-617.9%
others 82.1%
child 0-614.5%
others 85.5%
2001 2011
India
child 0-615.9%
others 84.1%
child 0-613.1%
others 86.9%
2001 2011

CHILD POPULATION (0-6 AGE GROUP)
PROVISIONAL POPULATION TOTALS 79
4.2 InDIa- TOP FIVE anD BOTTOM FIVE STaTES anD UnIOn TErrITOrIES
The child population in the age group 0-6 years is highest in Uttar Pradesh (2,97,28,235),
followed by Bihar (1,85,82,229). Lakshadweep is the lowest in child population (7,088),
followed by Daman & Diu (25,880).
Statement 4.3 Top five and bottom five States/UTs according to child population in the age group 0-6 years
Top five states /UTs - 2011State/UT Population
Uttar Pradesh 2,97,28,235Bihar 1,85,82,229Maharashtra 1,28,48,375Madhya Pradesh 1,05,48,295Rajasthan 1,05,04,916
Bottom five states/UTs - 2011State/UT Population
Lakshadweep 7,088Daman & Diu 25,880Andaman & Nicobar Islands 39,497Dadra & Nagar Haveli 49,196Sikkim 61,077
4.3 MaDhya PraDESh anD Eag STaTES
It is observed from the statement below that share of child population to total child population
of India is found to be very high in Uttar Pradesh (18.7% ) followed by Bihar (11.7%), Madhya
Pradesh (6.6 % ) and Rajasthan (6.6 %).
Statement 4.4 Share of Child Population, India, Madhya Pradesh and Eag States
India and Empowered action group States - 2011India/EAG State absolute Figures Percentage
Persons Males Females Persons Males FemalesIndia 15,87,89,287 8,29,52,135 7,58,37,152 100.0 100.0 100.0Uttar Pradesh 2,97,28,235 1,56,53,175 1,40,75,060 18.7 18.9 18.6Bihar 1,85,82,229 96,15,280 89,66,949 11.7 11.6 11.8Madhya Pradesh 1,05,48,295 55,16,957 50,31,338 6.6 6.7 6.6Rajasthan 1,05,04,916 55,80,212 49,24,704 6.6 6.7 6.5Jharkhand 52,37,582 26,95,921 25,41,661 3.3 3.3 3.4Orissa 50,35,650 26,03,208 24,32,442 3.2 3.1 3.2Chhattisgarh 35,84,028 18,24,987 17,59,041 2.3 2.2 2.3Uttarakhand 13,28,844 7,04,769 6,24,075 0.8 0.9 0.8Total of EAG States 8,45,49,779 4,41,94,509 4,03,55,270 53.3 53.3 53.2
80
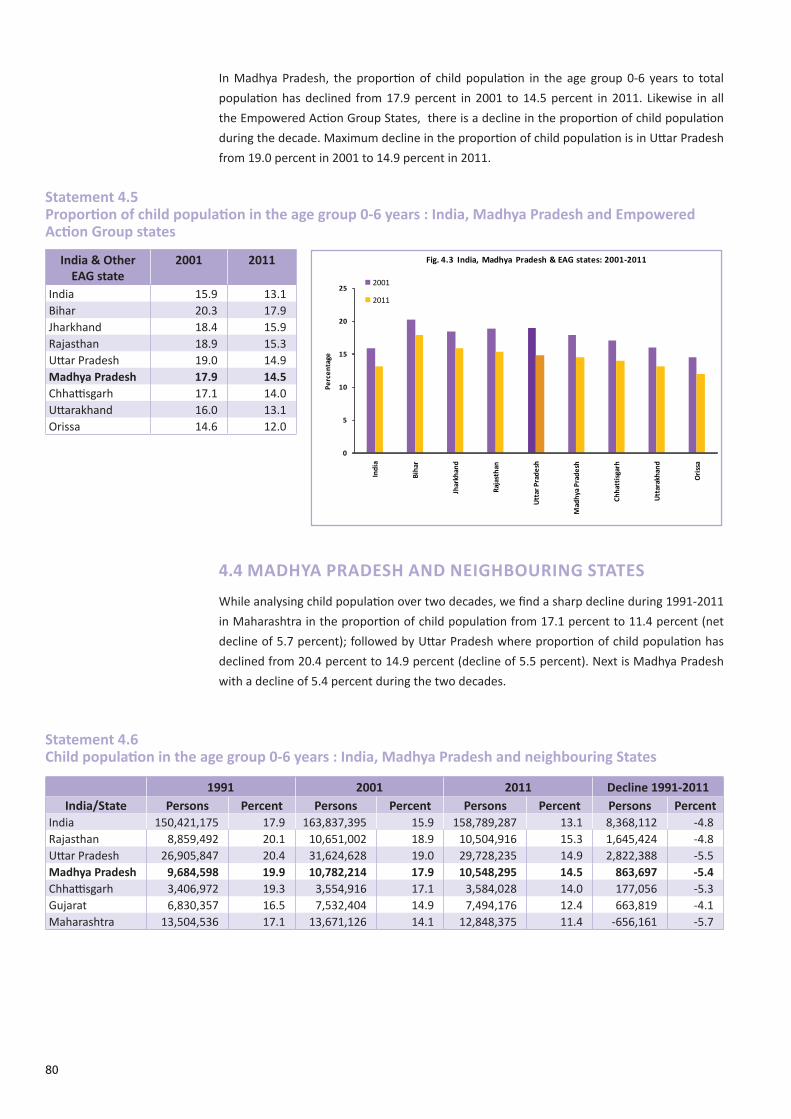
In Madhya Pradesh, the proportion of child population in the age group 0-6 years to total
population has declined from 17.9 percent in 2001 to 14.5 percent in 2011. Likewise in all
the Empowered Action Group States, there is a decline in the proportion of child population
during the decade. Maximum decline in the proportion of child population is in Uttar Pradesh
from 19.0 percent in 2001 to 14.9 percent in 2011.
Statement 4.5 Proportion of child population in the age group 0-6 years : India, Madhya Pradesh and Empowered action group states
India & Other Eag state
2001 2011
India 15.9 13.1Bihar 20.3 17.9Jharkhand 18.4 15.9Rajasthan 18.9 15.3Uttar Pradesh 19.0 14.9Madhya Pradesh 17.9 14.5Chhattisgarh 17.1 14.0Uttarakhand 16.0 13.1Orissa 14.6 12.0
0
5
10
15
20
25
Indi
a
Biha
r
Jhar
khan
d
raja
stha
n
Utt
ar P
rade
sh
Mad
hya
Prad
esh
Chha
ttis
garh
Utt
arak
hand
Ori
ssa
Perc
enta
ge
Fig. 4.3 India, Madhya Pradesh & Eag states: 2001-2011
2001
2011
4.4 MaDhya PraDESh anD nEIghBOUrIng STaTES
While analysing child population over two decades, we find a sharp decline during 1991-2011
in Maharashtra in the proportion of child population from 17.1 percent to 11.4 percent (net
decline of 5.7 percent); followed by Uttar Pradesh where proportion of child population has
declined from 20.4 percent to 14.9 percent (decline of 5.5 percent). Next is Madhya Pradesh
with a decline of 5.4 percent during the two decades.
Statement 4.6 Child population in the age group 0-6 years : India, Madhya Pradesh and neighbouring States
1991 2001 2011 Decline 1991-2011India/State Persons Percent Persons Percent Persons Percent Persons Percent
India 150,421,175 17.9 163,837,395 15.9 158,789,287 13.1 8,368,112 -4.8Rajasthan 8,859,492 20.1 10,651,002 18.9 10,504,916 15.3 1,645,424 -4.8Uttar Pradesh 26,905,847 20.4 31,624,628 19.0 29,728,235 14.9 2,822,388 -5.5Madhya Pradesh 9,684,598 19.9 10,782,214 17.9 10,548,295 14.5 863,697 -5.4Chhattisgarh 3,406,972 19.3 3,554,916 17.1 3,584,028 14.0 177,056 -5.3Gujarat 6,830,357 16.5 7,532,404 14.9 7,494,176 12.4 663,819 -4.1Maharashtra 13,504,536 17.1 13,671,126 14.1 12,848,375 11.4 -656,161 -5.7

CHILD POPULATION (0-6 AGE GROUP)
PROVISIONAL POPULATION TOTALS 81
10
13
16
19
22
1991 2001 2011
Perc
enta
ge
Census Year
Fig. 4.4 Percentage of Child population in the age group 0-6, India, Madhya Pradesh and neighbouring states: 1991 to 2011
India Rajasthan Uttar Pradesh Madhya Pradesh Chhattisgarh Gujarat Maharashtra
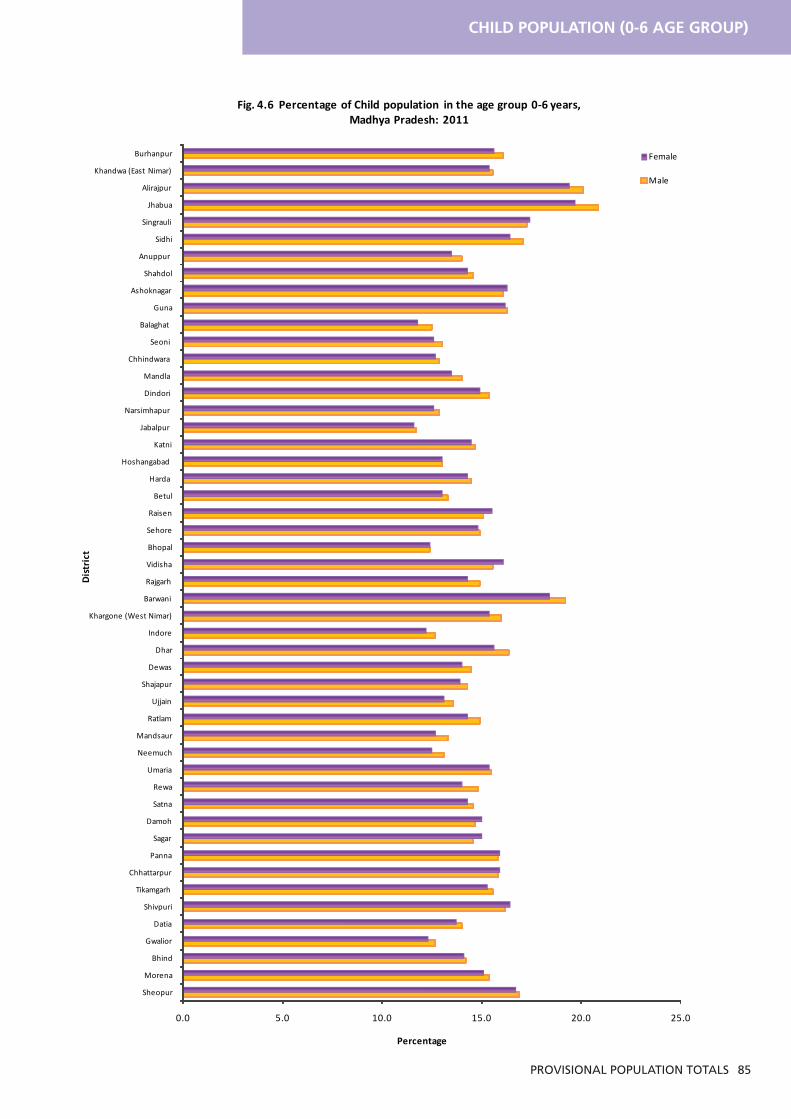
4.5 DISTrICTS OF MaDhya PraDESh
Among the districts of the state, Jhabua has the highest proportion of child population at
20.3%, followed by Alirajpur, Barwani, Singrauli and Sheopur. The lowest proportion is in
Jabalpur at 11.7%, followed by Balaghat, Bhopal, Indore and Gwalior.
Statement 4.7 Top five and bottom five districts by proportion of child population in the age group 0-6 years
Top five districts -2011District Proportion of child
populationJhabua 20.3Alirajpur 19.8Barwani 18.8Singrauli 17.3Sheopur 16.8
Bottom five districts-2011District Proportion of child
populationJabalpur 11.7Balaghat 12.2Bhopal 12.4Indore 12.5Gwalior 12.5
There has been an increase in the number of districts falling under lower ranges of proportion
of child population to total population in 2011 compared to 2001. Number of districts in
the highest range of 18.00 percent and above has come down from 28 in 2001 to 3 in 2011.
Maximum 40 districts are in the range of 14.00-15.99 with 50.6 percent of child population.
Statement 4.8 range in proportion of child population in the age group 0-6 years to total population: 2001-11
Districts by range in proportion of children in the age group 0-6 year to total population : 2001-11range of Proportion of Child Population in the
age group 0-6 years
number of districts 2001
Percentage of population to total
population,2001 (all ages)
number of districts 2011
Percentage of population to total
population,2011 (all ages)
1 2 3 4 59.00-11.99 0 0.0 1 3.412.00-13.99 0 0.0 0 32.414.00-15.99 5 15.9 40 50.616.00-17.99 17 31.2 6 9.418.00 and above 28 52.9 3 4.3

82
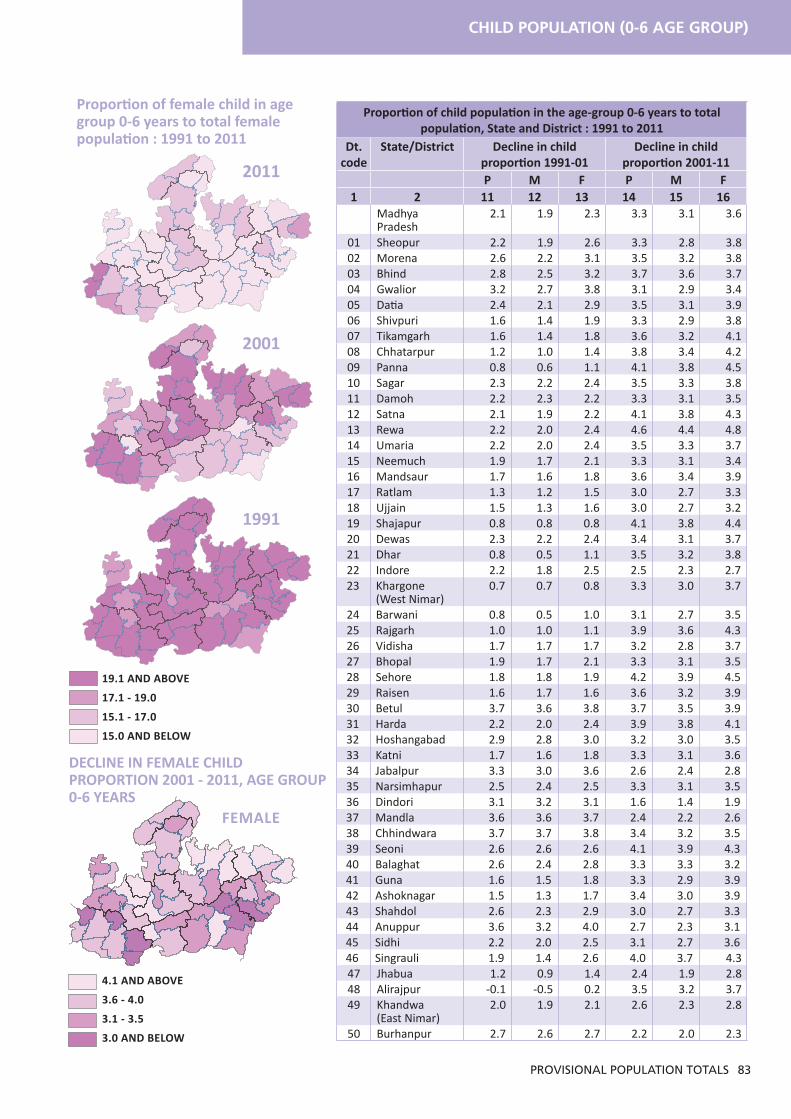
Statement 4.9
Proportion of child population in the age group 0-6 years to total population, State and District : 1991 to 2011
Dt. code
State/District 1991 2001 2011
P M F P M F P M F1 2 3 4 5 6 7 8 8 9 10 Madhya
Pradesh19.9 19.6 20.3 17.9 17.7 18.0 14.5 14.7 14.4
01 Sheopur 22.2 21.5 23.0 20.1 19.7 20.5 16.8 16.9 16.702 Morena 21.4 20.8 22.1 18.7 18.6 18.9 15.2 15.4 15.103 Bhind 20.7 20.3 21.1 17.8 17.8 17.9 14.2 14.2 14.104 Gwalior 18.8 18.2 19.5 15.6 15.6 15.7 12.5 12.7 12.305 Datia 19.8 19.2 20.4 17.3 17.2 17.5 13.9 14.0 13.706 Shivpuri 21.2 20.5 22.1 19.6 19.1 20.2 16.3 16.2 16.407 Tikamgarh 20.7 20.1 21.2 19.1 18.8 19.4 15.5 15.6 15.308 Chhatarpur 20.8 20.1 21.6 19.6 19.1 20.2 15.8 15.8 15.909 Panna 20.8 20.2 21.4 20.0 19.7 20.3 15.8 15.8 15.910 Sagar 20.6 20.0 21.2 18.3 17.8 18.8 14.8 14.6 15.011 Damoh 20.3 20.1 20.6 18.1 17.8 18.4 14.8 14.7 15.012 Satna 20.6 20.3 20.8 18.5 18.4 18.6 14.4 14.6 14.313 Rewa 21.2 21.2 21.2 19.0 19.1 18.8 14.4 14.8 14.014 Umaria 21.1 20.9 21.4 18.9 18.8 19.1 15.5 15.5 15.415 Neemuch 17.9 17.9 18.0 16.0 16.2 15.9 12.8 13.1 12.516 Mandsaur 18.3 18.3 18.3 16.6 16.7 16.5 13.0 13.3 12.717 Ratlam 18.9 18.8 19.1 17.6 17.6 17.6 14.6 14.9 14.318 Ujjain 17.8 17.6 17.9 16.3 16.3 16.3 13.3 13.6 13.119 Shajapur 19.0 18.9 19.1 18.2 18.1 18.3 14.1 14.3 13.920 Dewas 19.9 19.8 20.0 17.7 17.7 17.7 14.3 14.5 14.021 Dhar 20.2 20.1 20.5 19.5 19.6 19.3 16.0 16.4 15.622 Indore 17.1 16.8 17.5 15.0 15.0 15.0 12.5 12.7 12.223 Khargone
(West Nimar)19.8 19.6 19.9 19.0 18.9 19.2 15.7 16.0 15.4
24 Barwani 22.7 22.5 22.9 22.0 22.0 22.0 18.8 19.2 18.425 Rajgarh 19.6 19.5 19.7 18.5 18.5 18.6 14.6 14.9 14.326 Vidisha 20.7 20.0 21.5 19.0 18.4 19.8 15.8 15.6 16.127 Bhopal 17.6 17.1 18.1 15.7 15.4 15.9 12.4 12.4 12.428 Sehore 20.9 20.7 21.1 19.0 18.8 19.2 14.9 14.9 14.829 Raisen 20.5 20.0 21.1 18.9 18.3 19.5 15.3 15.1 15.530 Betul 20.6 20.4 20.7 16.8 16.8 16.9 13.2 13.3 13.031 Harda 20.5 20.3 20.8 18.3 18.3 18.4 14.4 14.5 14.332 Hoshangabad 19.1 18.7 19.5 16.2 16.0 16.5 13.0 13.0 13.033 Katni 19.7 19.5 19.9 17.9 17.8 18.0 14.6 14.7 14.534 Jabalpur 17.6 17.1 18.0 14.3 14.1 14.4 11.7 11.7 11.635 Narsimhapur 18.5 18.4 18.7 16.1 16.0 16.1 12.8 12.9 12.636 Dindori 19.9 20.0 19.9 16.8 16.8 16.8 15.1 15.4 14.937 Mandla 19.8 19.9 19.7 16.1 16.3 16.0 13.7 14.0 13.538 Chhindwara 19.9 19.8 20.0 16.1 16.1 16.2 12.8 12.9 12.739 Seoni 19.5 19.5 19.5 16.9 16.9 16.8 12.8 13.0 12.640 Balaghat 18.0 18.2 17.8 15.4 15.8 15.0 12.2 12.5 11.841 Guna 21.2 20.7 21.9 19.6 19.2 20.0 16.2 16.3 16.242 Ashoknagar 21.1 20.4 21.9 19.6 19.1 20.2 16.2 16.1 16.343 Shahdol 20.0 19.6 20.4 17.4 17.3 17.6 14.5 14.6 14.344 Anuppur 20.1 19.5 20.6 16.4 16.3 16.6 13.7 14.0 13.545 Sidhi 22.1 21.7 22.5 19.9 19.8 20.0 16.8 17.1 16.446 Singrauli 23.3 22.4 24.3 21.3 21.0 21.7 17.3 17.3 17.447 Jhabua 23.9 23.8 24.0 22.7 22.8 22.5 20.3 20.9 19.748 Alirajpur 23.1 22.8 23.3 23.2 23.4 23.1 19.8 20.1 19.449 Khandwa (East
Nimar)20.0 19.8 20.3 18.1 18.0 18.2 15.5 15.6 15.4
50 Burhanpur 20.7 20.7 20.7 18.0 18.1 17.9 15.9 16.1 15.6
Proportion of child population in the age group 0-6 years to total population : 1991 to 2011
19.1 anD aBOVE
17.1 - 19.0
15.1 - 17.0
15.0 anD BELOW
1991D
D
D
D
D
D
DECLInE In MaLE ChILD PrOPOrTIOn 2001 - 2011, agE grOUP 0-6 yEarS
MaLE
2001D
D
D
2011
D
D
D
4.1 anD aBOVE
3.6 - 4.0
3.1 - 3.5
3.0 anD BELOW
CHILD POPULATION (0-6 AGE GROUP)
PROVISIONAL POPULATION TOTALS 83
DECLInE In FEMaLE ChILD PrOPOrTIOn 2001 - 2011, agE grOUP 0-6 yEarS
4.1 anD aBOVE
3.6 - 4.0
3.1 - 3.5
3.0 anD BELOW
FEMaLE
Proportion of female child in age group 0-6 years to total female population : 1991 to 2011
19.1 anD aBOVE
17.1 - 19.0
15.1 - 17.0
15.0 anD BELOW
D
D
D
2001
1991
D
D
D
2011
D
D
D
Proportion of child population in the age-group 0-6 years to total population, State and District : 1991 to 2011
Dt. code
State/District Decline in child proportion 1991-01
Decline in child proportion 2001-11
P M F P M F1 2 11 12 13 14 15 16 Madhya
Pradesh2.1 1.9 2.3 3.3 3.1 3.6
01 Sheopur 2.2 1.9 2.6 3.3 2.8 3.802 Morena 2.6 2.2 3.1 3.5 3.2 3.803 Bhind 2.8 2.5 3.2 3.7 3.6 3.704 Gwalior 3.2 2.7 3.8 3.1 2.9 3.405 Datia 2.4 2.1 2.9 3.5 3.1 3.906 Shivpuri 1.6 1.4 1.9 3.3 2.9 3.807 Tikamgarh 1.6 1.4 1.8 3.6 3.2 4.108 Chhatarpur 1.2 1.0 1.4 3.8 3.4 4.209 Panna 0.8 0.6 1.1 4.1 3.8 4.510 Sagar 2.3 2.2 2.4 3.5 3.3 3.811 Damoh 2.2 2.3 2.2 3.3 3.1 3.512 Satna 2.1 1.9 2.2 4.1 3.8 4.313 Rewa 2.2 2.0 2.4 4.6 4.4 4.814 Umaria 2.2 2.0 2.4 3.5 3.3 3.715 Neemuch 1.9 1.7 2.1 3.3 3.1 3.416 Mandsaur 1.7 1.6 1.8 3.6 3.4 3.917 Ratlam 1.3 1.2 1.5 3.0 2.7 3.318 Ujjain 1.5 1.3 1.6 3.0 2.7 3.219 Shajapur 0.8 0.8 0.8 4.1 3.8 4.420 Dewas 2.3 2.2 2.4 3.4 3.1 3.721 Dhar 0.8 0.5 1.1 3.5 3.2 3.822 Indore 2.2 1.8 2.5 2.5 2.3 2.723 Khargone
(West Nimar)0.7 0.7 0.8 3.3 3.0 3.7
24 Barwani 0.8 0.5 1.0 3.1 2.7 3.525 Rajgarh 1.0 1.0 1.1 3.9 3.6 4.326 Vidisha 1.7 1.7 1.7 3.2 2.8 3.727 Bhopal 1.9 1.7 2.1 3.3 3.1 3.528 Sehore 1.8 1.8 1.9 4.2 3.9 4.529 Raisen 1.6 1.7 1.6 3.6 3.2 3.930 Betul 3.7 3.6 3.8 3.7 3.5 3.931 Harda 2.2 2.0 2.4 3.9 3.8 4.132 Hoshangabad 2.9 2.8 3.0 3.2 3.0 3.533 Katni 1.7 1.6 1.8 3.3 3.1 3.634 Jabalpur 3.3 3.0 3.6 2.6 2.4 2.835 Narsimhapur 2.5 2.4 2.5 3.3 3.1 3.536 Dindori 3.1 3.2 3.1 1.6 1.4 1.937 Mandla 3.6 3.6 3.7 2.4 2.2 2.638 Chhindwara 3.7 3.7 3.8 3.4 3.2 3.539 Seoni 2.6 2.6 2.6 4.1 3.9 4.340 Balaghat 2.6 2.4 2.8 3.3 3.3 3.241 Guna 1.6 1.5 1.8 3.3 2.9 3.942 Ashoknagar 1.5 1.3 1.7 3.4 3.0 3.943 Shahdol 2.6 2.3 2.9 3.0 2.7 3.344 Anuppur 3.6 3.2 4.0 2.7 2.3 3.145 Sidhi 2.2 2.0 2.5 3.1 2.7 3.646 Singrauli 1.9 1.4 2.6 4.0 3.7 4.347 Jhabua 1.2 0.9 1.4 2.4 1.9 2.848 Alirajpur -0.1 -0.5 0.2 3.5 3.2 3.749 Khandwa
(East Nimar)2.0 1.9 2.1 2.6 2.3 2.8
50 Burhanpur 2.7 2.6 2.7 2.2 2.0 2.3

84
0.0 5.0 10.0 15.0 20.0 25.0
Sheopur
Morena
Bhind
Gwalior
Datia
Shivpuri
Tikamgarh
Chhattarpur
Panna
Sagar
Damoh
Satna
Rewa
Umaria
Neemuch
Mandsaur
Ratlam
Ujjain
Shajapur
Dewas
Dhar
Indore
Khargone (West Nimar)
Barwani
Rajgarh
Vidisha
Bhopal
Sehore
Raisen
Betul
Harda
Hoshangabad
Katni
Jabalpur
Narsimhapur
Dindori
Mandla
Chhindwara
Seoni
Balaghat
Guna
Ashoknagar
Shahdol
Anuppur
Sidhi
Singrauli
Jhabua
Alirajpur
Khandwa (East Nimar)
Burhanpur
Percentage
Dis
tric
t
Fig. 4.5 Percentage of child population in the age group 0-6 years to total population, Madhya Pradesh: 2001-11
2011 2001
CHILD POPULATION (0-6 AGE GROUP)
PROVISIONAL POPULATION TOTALS 85
0.0 5.0 10.0 15.0 20.0 25.0
Sheopur
Morena
Bhind
Gwalior
Datia
Shivpuri
Tikamgarh
Chhattarpur
Panna
Sagar
Damoh
Satna
Rewa
Umaria
Neemuch
Mandsaur
Ratlam
Ujjain
Shajapur
Dewas
Dhar
Indore
Khargone (West Nimar)
Barwani
Rajgarh
Vidisha
Bhopal
Sehore
Raisen
Betul
Harda
Hoshangabad
Katni
Jabalpur
Narsimhapur
Dindori
Mandla
Chhindwara
Seoni
Balaghat
Guna
Ashoknagar
Shahdol
Anuppur
Sidhi
Singrauli
Jhabua
Alirajpur
Khandwa (East Nimar)
Burhanpur
Percentage
Dis
tric
t
Fig. 4.6 Percentage of Child population in the age group 0-6 years, Madhya Pradesh: 2011
Female
Male

86
4.6 PrOPOrTIOn OF ChILD POPULaTIOn In DIVISIOnS OF MADHYA PRADESH
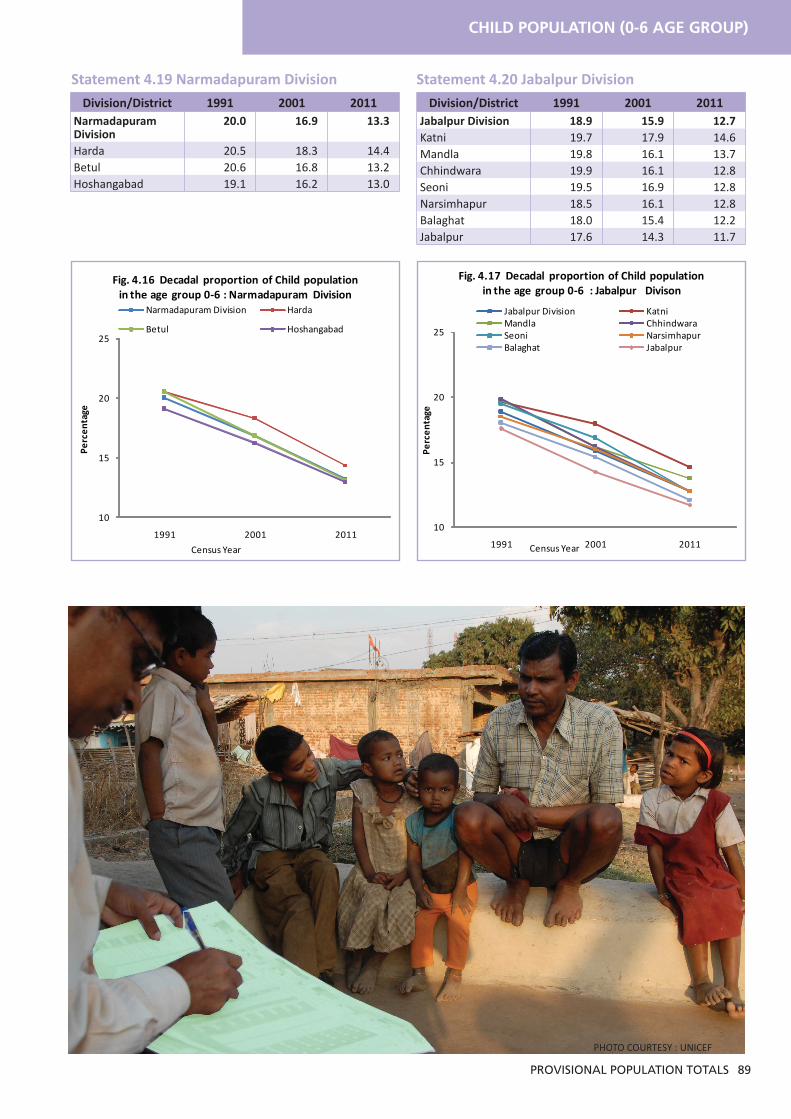
While analysing divisionwise data during the two decades 1991 to 2011, we find that the
proportion of child population in all the divisions shows a downward trend and highest decline
is in Narmadapuram division from 20.0 percent to 13.3 percent in 1991-2011 followed by
Jabalpur division from 18.9 percent to 12.7 percent.
Similarly in Rewa division, the decline of 0-6 population for 1991-2011 is from 21.4 percent to
15.3 percent followed by Bhopal division from 19.6 percent to 14.3 percent. The proportion of
child population in last three censuses 1991, 2001 and 2011, divisionwise as well as districtwise
are presented in Statements 4.10 to 4.20 & Fig. 4.7 to 4.17.
Statement 4.10 Divisionwise proportion of child population in the age group 0-6 years
Proportion of child population in the age group 0-6 years in divisions of Madhya Pradesh: 1991 to 2011Sr. no. State/Division 1991 2001 2011
Madhya Pradesh 20.0 17.9 14.51 Chambal 21.2 18.6 15.12 Gwalior 20.3 18.1 14.83 Sagar 20.6 18.9 15.34 Rewa 21.4 19.4 15.35 Shahdol 20.2 17.3 14.66 Ujjain 18.6 17.1 13.77 Indore 20.3 18.8 15.98 Bhopal 19.6 18.0 14.39 Narmadapuram 20.0 16.9 13.3
10 Jabalpur 18.9 15.9 12.7
12.0
13.5
15.0
16.5
18.0
19.5
21.0
1991 2001 2011
Perc
enta
ge
Census Year
Fig. 4.7 Proportion of child population in the age group 0-6 yearsMadhya Pradesh and Divisions: 1991 to 2011
Madhya Pradesh Chambal Gwalior Sagar Rewa Shahdol
Ujjain Indore Bhopal Narmadapuram Jabalpur

CHILD POPULATION (0-6 AGE GROUP)
PROVISIONAL POPULATION TOTALS 87
Division/District 1991 2001 2011Chambal Division 21.2 18.6 15.1Sheopur 22.2 20.1 16.8Morena 21.4 18.7 15.2Bhind 20.7 17.8 14.2
Statement 4.11 Chambal Division
Division/District 1991 2001 2011Gwalior Division 20.3 18.1 14.8Shivpuri 21.2 19.6 16.3Guna 21.2 19.6 16.2Ashoknagar 21.1 19.6 16.2Datia 19.8 17.3 13.9Gwalior 18.8 15.6 12.5
Statement 4.12 gwalior Division
Division/District 1991 2001 2011Sagar Division 20.6 18.9 15.3Chhatarpur 20.8 19.6 15.8Panna 20.8 20.0 15.8Tikamgarh 20.7 19.1 15.5Damoh 20.3 18.1 14.8Sagar 20.6 18.3 14.8
Statement 4.13 Sagar Division Division/District 1991 2001 2011
rewa Division 21.4 19.3 15.3Singrauli 23.3 21.3 17.3Sidhi 22.1 19.9 16.8Satna 20.6 18.5 14.4Rewa 21.2 19.0 14.4
Statement 4.14 rewa Division
10
15
20
25
1991 2001 2011
Perc
enta
ge
Census Year
Fig. 4.8 Decadal proportion of Child population in the age group 0-6: Chambal Division
Chambal Division Sheopur
Morena Bhind
10
15
20
25
1991 2001 2011
Perc
enta
ge
Census Year
Fig. 4.9 Decadal proportion of Child population in the age group 0-6 : gwalior Divison
Gwalior Division ShivpuriGuna AshoknagarDatia Gwalior
10
15
20
25
1991 2001 2011
Perc
enta
ge
Census Year
Fig. 4.10 Decadal proportion of Child population in the age group 0-6 : Sagar Division
Sagar Division Chhattarpur PannaTikamgarh Damoh Sagar
10
15
20
25
1991 2001 2011
Perc
enta
ge
Census Year
Fig. 4.11 Decadal proportion of Child population in the age group 0-6 : rewa Division
Rewa Division Singrauli SidhiSatna Rewa

88
Division/District 1991 2001 2011Shahdol Division 20.2 17.3 14.6Umaria 21.1 18.9 15.5Dindori 19.9 16.8 15.1Shahdol 20.0 17.4 14.5Anuppur 20.1 16.4 13.7
Statement 4.15 Shahdol Division Division/District 1991 2001 2011
Ujjain Division 18.6 17.1 13.7Ratlam 18.9 17.6 14.6Dewas 19.9 17.7 14.3Shajapur 19.0 18.2 14.1Ujjain 17.8 16.3 13.3Mandsaur 18.3 16.6 13.0Neemuch 17.9 16.0 12.8
Statement 4.16 Ujjain Division
Division/District 1991 2001 2011Indore Division 20.3 18.8 15.9Jhabua 23.9 22.7 20.3Alirajpur 23.1 23.2 19.8Barwani 22.7 22.0 18.8Dhar 20.2 19.5 16.0Burhanpur 20.7 18.0 15.9West Nimar 19.8 19.0 15.7East Nimar 20.0 18.1 15.5Indore 17.1 15.0 12.5
Statement 4.17 Indore Division Division/District 1991 2001 2011
Bhopal Division 19.6 18.0 14.3Vidisha 20.7 19.0 15.8Raisen 20.5 18.9 15.3Sehore 20.9 19.0 14.9Rajgarh 19.6 18.5 14.6Bhopal 17.6 15.7 12.4
Statement 4.18 Bhopal Division
10
15
20
25
1991 2001 2011
Perc
enta
ge
Census Year
Fig. 4.12 Decadal proportion of Child population in the age group 0-6 :Shahdol Division
Shahdol Division UmariaDindori ShahdolAnuppur
10
15
20
25
1991 2001 2011
Perc
enta
ge
Census Year
Fig. 4.13 Decadal proportion of Child population in the age group 0-6: Ujjain Division
Ujjain Division Ratlam DewasShajapur Ujjain MandsaurNeemuch
10
15
20
25
1991 2001 2011
Perc
enta
ge
Census Year
Fig. 4.15 Decadal proportion of Child population in the age group 0-6 : Bhopal Division
Bhopal Division VidishaRaisen SehoreRajgarh Bhopal
10
15
20
25
1991 2001 2011
Perc
enta
ge
Census Year
Fig. 4.14 Decadal proportion of Child population in the age group 0-6 : Indore Division
Indore Division Jhabua AlirajpurBarwani Dhar BurhanpurWest Nimar East Nimar Indore
CHILD POPULATION (0-6 AGE GROUP)
PROVISIONAL POPULATION TOTALS 89
Division/District 1991 2001 2011narmadapuram Division
20.0 16.9 13.3
Harda 20.5 18.3 14.4Betul 20.6 16.8 13.2Hoshangabad 19.1 16.2 13.0
Statement 4.19 narmadapuram Division
10
15
20
25
1991 2001 2011
Perc
enta
ge
Census Year
Fig. 4.16 Decadal proportion of Child population in the age group 0-6 : narmadapuram Division
Narmadapuram Division Harda
Betul Hoshangabad
Division/District 1991 2001 2011Jabalpur Division 18.9 15.9 12.7Katni 19.7 17.9 14.6Mandla 19.8 16.1 13.7Chhindwara 19.9 16.1 12.8Seoni 19.5 16.9 12.8Narsimhapur 18.5 16.1 12.8Balaghat 18.0 15.4 12.2Jabalpur 17.6 14.3 11.7
Statement 4.20 Jabalpur Division
10
15
20
25
1991 2001 2011
Perc
enta
ge
Census Year
Fig. 4.17 Decadal proportion of Child population in the age group 0-6 : Jabalpur Divison
Jabalpur Division KatniMandla Chhindwara Seoni Narsimhapur Balaghat Jabalpur
PHOTO COURTESY : UNICEF

90
25,000 75,000 125,000 175,000 225,000 275,000 325,000 375,000 425,000
Sheopur
Morena
Bhind
Gwalior
Datia
Shivpuri
Tikamgarh
Chhattarpur
Panna
Sagar
Damoh
Satna
Rewa
Umaria
Neemuch
Mandsaur
Ratlam
Ujjain
Shajapur
Dewas
Dhar
Indore
Khargone (West Nimar)
Barwani
Rajgarh
Vidisha
Bhopal
Sehore
Raisen
Betul
Harda
Hoshangabad
Katni
Jabalpur
Narsimhapur
Dindori
Mandla
Chhindwara
Seoni
Balaghat
Guna
Ashoknagar
Shahdol
Anuppur
Sidhi
Singrauli
Jhabua
Alirajpur
Khandwa (East Nimar)
Burhanpur
number of children (in thousand)
Dis
tric
st
Fig.4.18 Child population in the age group 0-6 years,Madhya Pradesh:2011
Male Female

CHILD POPULATION (0-6 AGE GROUP)
PROVISIONAL POPULATION TOTALS 91
GUNAASHOKNAGAR
SAGARRAJGARH
RAISEN
CHHATARPUR
DAMOH
JABALPUR
PANNA
MORENA
SHEOPUR
BHIND
GWALIOR
DATIA
SHIVPURI
SATNA
REWA
SIDHI
KATNI
UMARIASHAHDOL
ANUPPUR
MANDLA
DINDORI
BALAGHAT
HOSHANGABAD
NARSIMHAPUR
SEONICHHINDWARA
VIDISHA
BETUL
HARDAALIRAJPUR
JHABUA
DHAR
(WEST NIMAR)(EAST NIMAR)
INDORE DEWAS
UJJAINRATLAM
NEEMUCH
MANDSAUR
SHAJAPUR
SEHORE
TIKAMGARH
BARWANI
BURHANPUR
BHOPAL
KHARGONEKHANDWA
SINGRAULI
16.0
12.8
13.0
14.8
16.3
13.2
13.0
12.2
15.8
15.7
15.3
12.8
14.4
13.7
14.8
15.5
14.3
15.8
16.2
14.4
15.8
14.9
16.8
13.3
14.6
14.1
17.3
15.2
15.1
18.8
15.5
11.7
14.5
14.6
12.8
16.2
14.6
14.2
16.8
15.5
12.8
12.5
13.7
12.520.3
19.8
15.9
14.4
13.9
12.4
74 76 78 80 82
28
26
24
22
20
8278 807674
20
22
24
26
28
0 0 0 0 0
0
0
0
0
0
00000
0
0
0
0
EAST OF GREENWICH
PROPORTION OF CHILD POPULATION IN AGE GROUP 0 - 6
TO TOTAL POPULATION 2011
c Government of India copyright, 2011The state boundaries between Chhattisgarh and Madhya Pradesh have not been verified by the Government concerned.
PERCENTAGE OF CHILD POPULATIONTO TOTAL POPULATION
17.1 AND ABOVE
15.1 - 17.0
13.1 - 15.0 State 14.50
13.00 AND BELOW
40 0 12040 80
KILOMETRES
MADHYA PRADESHR
AJ
A
S
T
H
A
N U T
TA
R P R A
DE
SH
GU
JA
RA
T
M
AH
A RA
SH T
R A
INDIA
D
D
D
BOUNDARIES : - STATE.............................
DISTRICT.........................DIVISION.........................
CH
HA
T
TI
SG
AR
H

92


