22
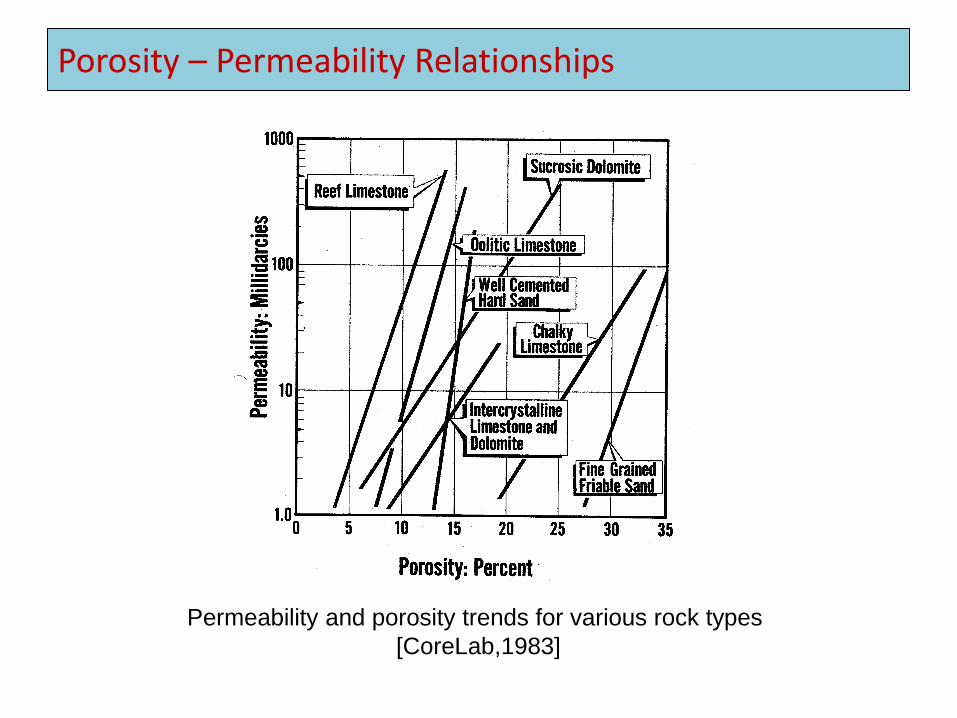
Porosity – Permeability Relationships Permeability and porosity trends for various rock types [CoreLab,1983]
| Date post: | 02-May-2017 |
| Category: |
Documents |
| Upload: | stephen-oche |
| View: | 234 times |
| Download: | 0 times |
Porosity – Permeability Relationships
Permeability and porosity trends for various rock types
[CoreLab,1983]
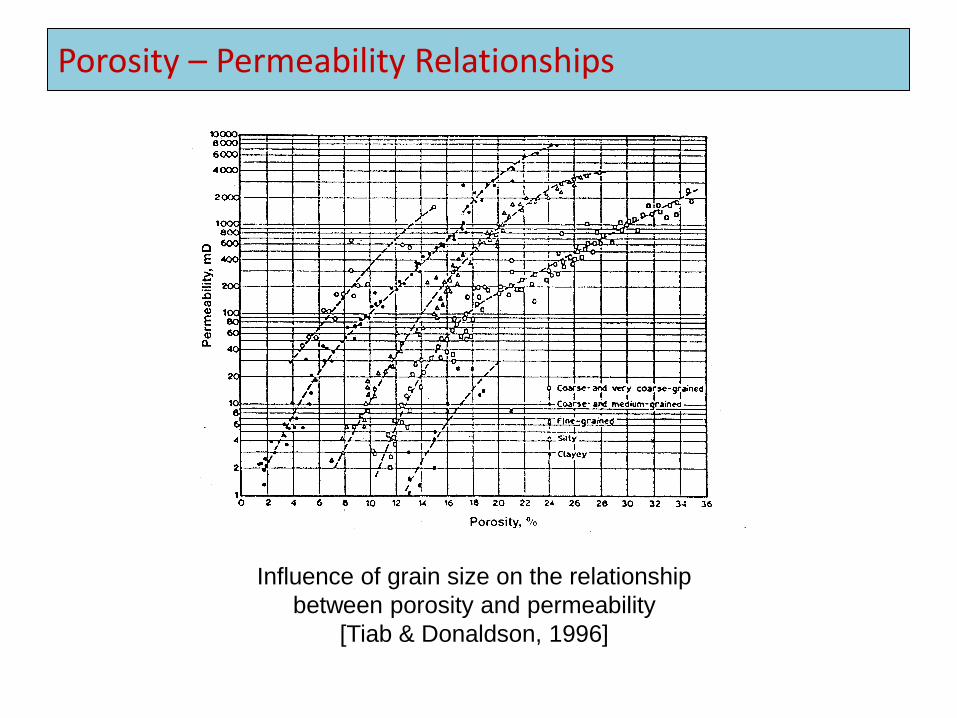
Porosity – Permeability Relationships
Influence of grain size on the relationship
between porosity and permeability
[Tiab & Donaldson, 1996]

Porosity – Permeability Relationships
• Darcy’s Law (1856) – empirical observations of flow to obtain permeability
• Slichter (1899) – theoretical analysis of fluid flow in packed uniform spheres
• Kozeny (1927),Carmen (1939) – capillary tube model
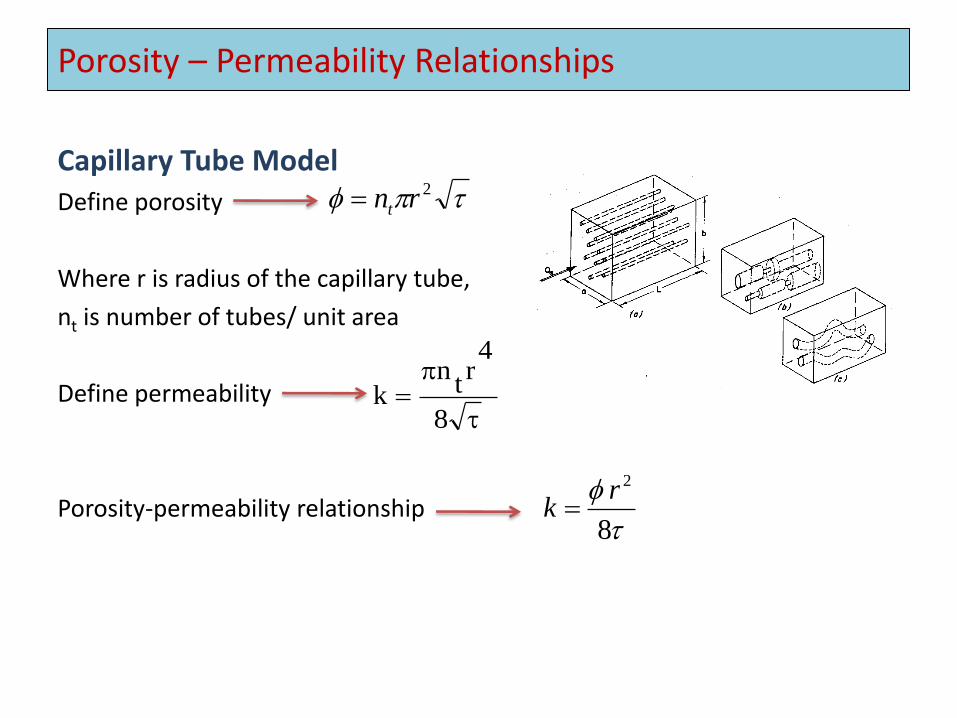
Porosity – Permeability Relationships
Capillary Tube Model Define porosity
Where r is radius of the capillary tube,
nt is number of tubes/ unit area
Define permeability
Porosity-permeability relationship
2rnt
8
4r
tn
k
8
2rk
Porosity – Permeability Relationships
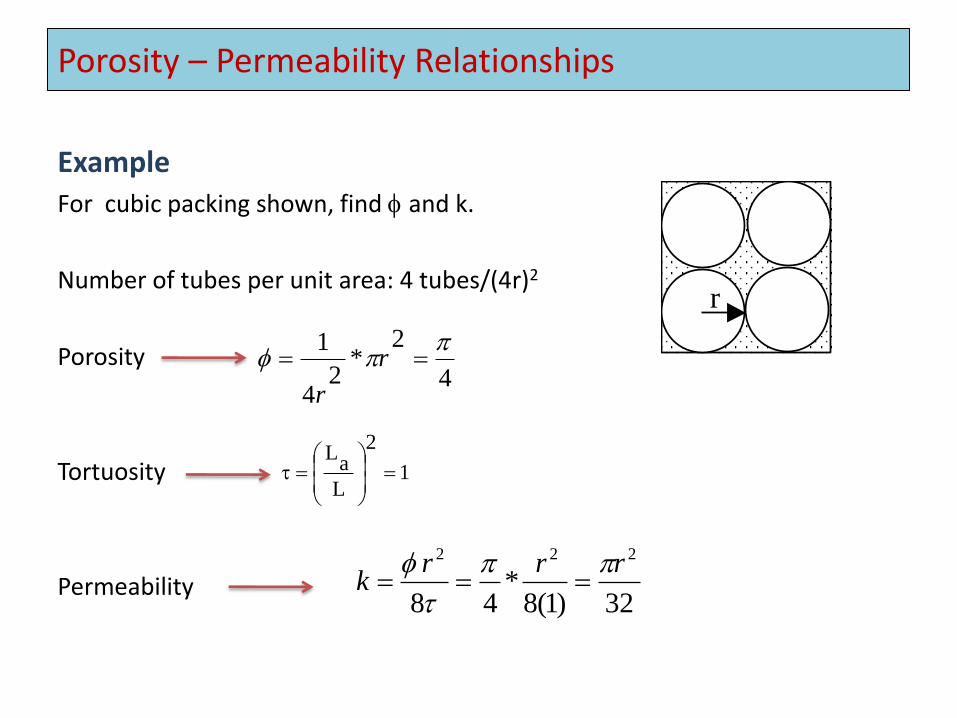
Example
For cubic packing shown, find and k.
Number of tubes per unit area: 4 tubes/(4r)2
Porosity
Tortuosity
Permeability
r
4
2*
24
1 r
r
1
2
L
aL
32)1(8*
48
222 rrrk

Carmen – Kozeny Equation
Where
Kz, Kozeny constant-shape factor to account for variability in shape and length
Porosity – Permeability Relationships
Define specific surface area
Spv – specific surface area per unit pore volume
Spv = 2/r (for cylindrical pore shape)
Sbv- …unit bulk volume
Sgv- …unit grain volume
pvS
gvS
pvS
bvS
1
*
2
pvS
zk
k
2
L
aL
8
2rk
Spv = 2/r

Carmen – Kozeny Equation
Tortuosity,
ko is a shape factor
= 2 for circular
= 1.78 for square
Porosity – Permeability Relationships
2
L
aL
2
pvS
zk
k
Carmen – Kozeny Equation
Where
Kz, Kozeny constant-shape factor to account for variability in shape and length
8
2rk
Spv = 2/r *oz kk
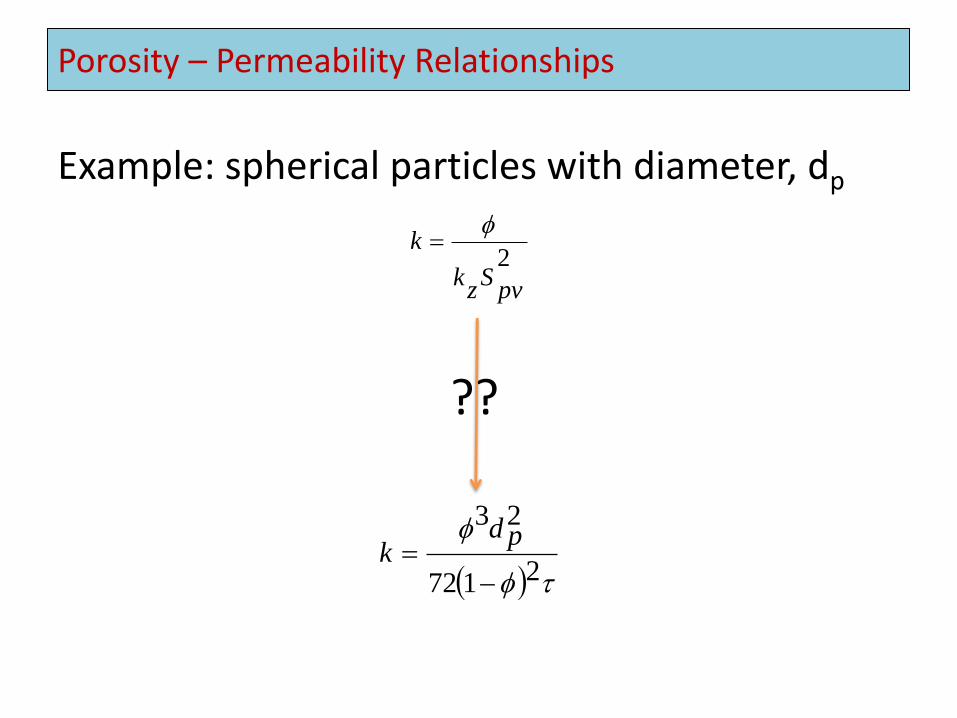
Porosity – Permeability Relationships
Example: spherical particles with diameter, dp
2172
23
pdk
2
pvS
zk
k
??
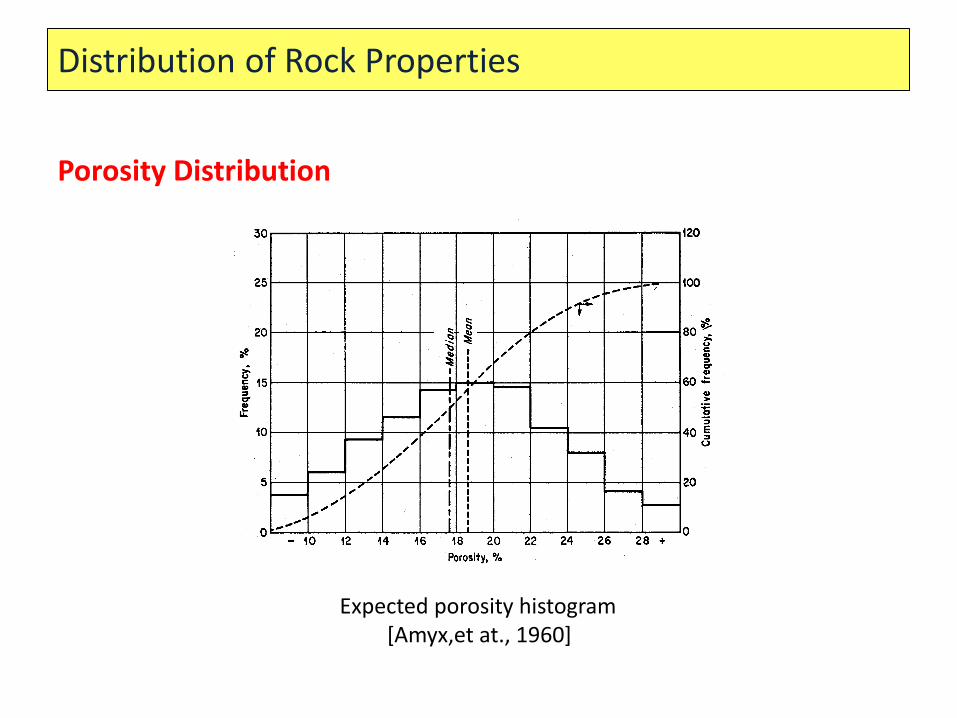
Distribution of Rock Properties
Porosity Distribution
Expected porosity histogram [Amyx,et at., 1960]
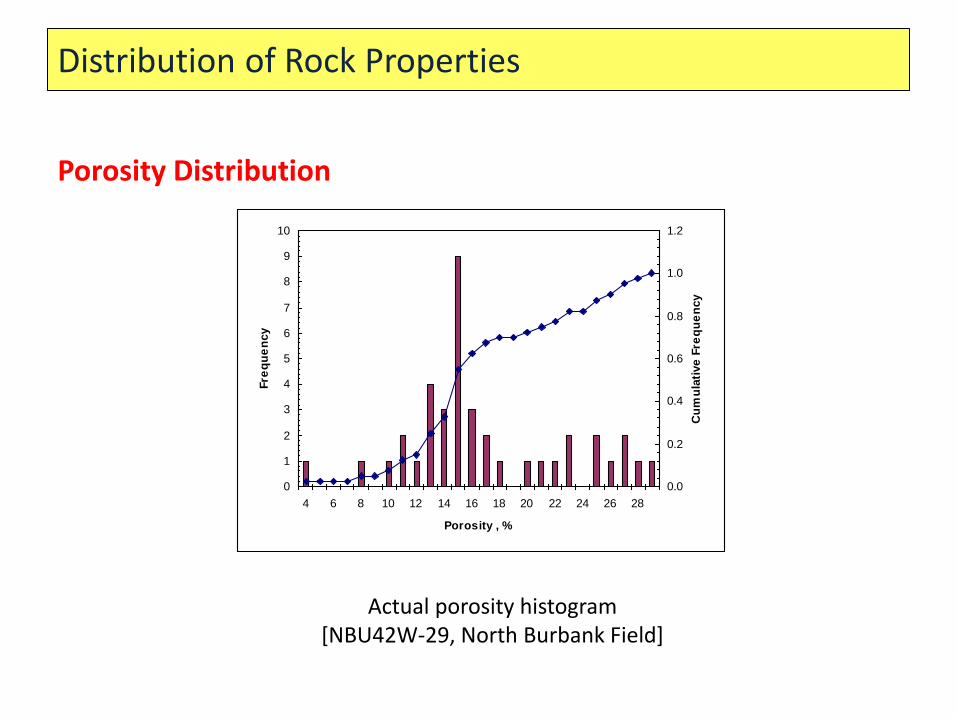
Distribution of Rock Properties
Porosity Distribution
Actual porosity histogram [NBU42W-29, North Burbank Field]
0
1
2
3
4
5
6
7
8
9
10
4 6 8 10 12 14 16 18 20 22 24 26 28
Porosity , %
Fre
qu
en
cy
0.0
0.2
0.4
0.6
0.8
1.0
1.2
Cu
mu
lati
ve
Fre
qu
en
cy
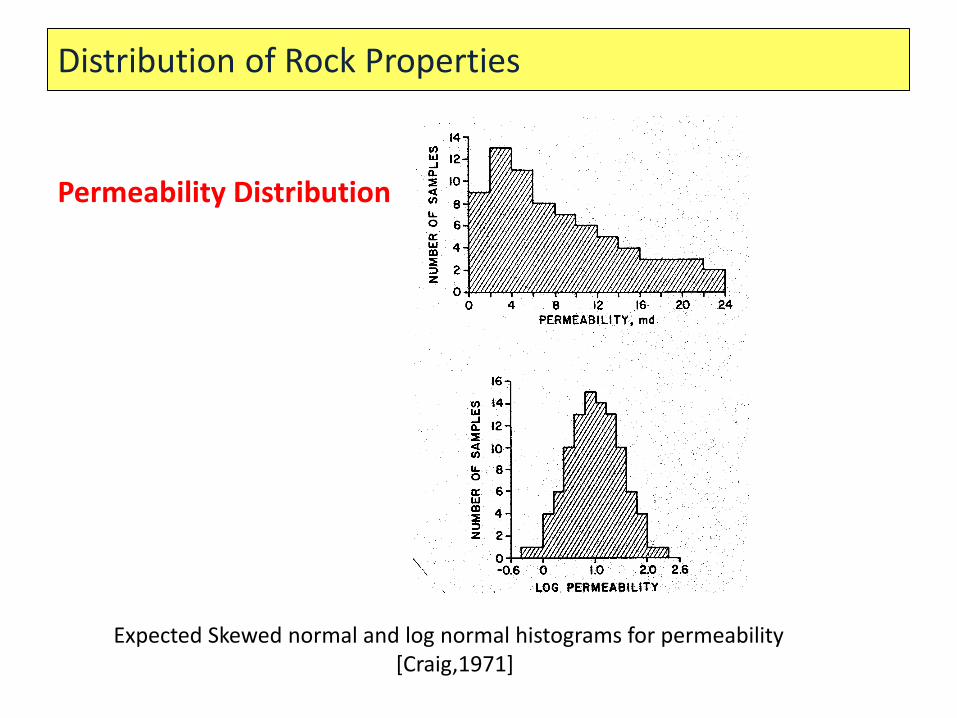
Distribution of Rock Properties
Permeability Distribution
Expected Skewed normal and log normal histograms for permeability [Craig,1971]
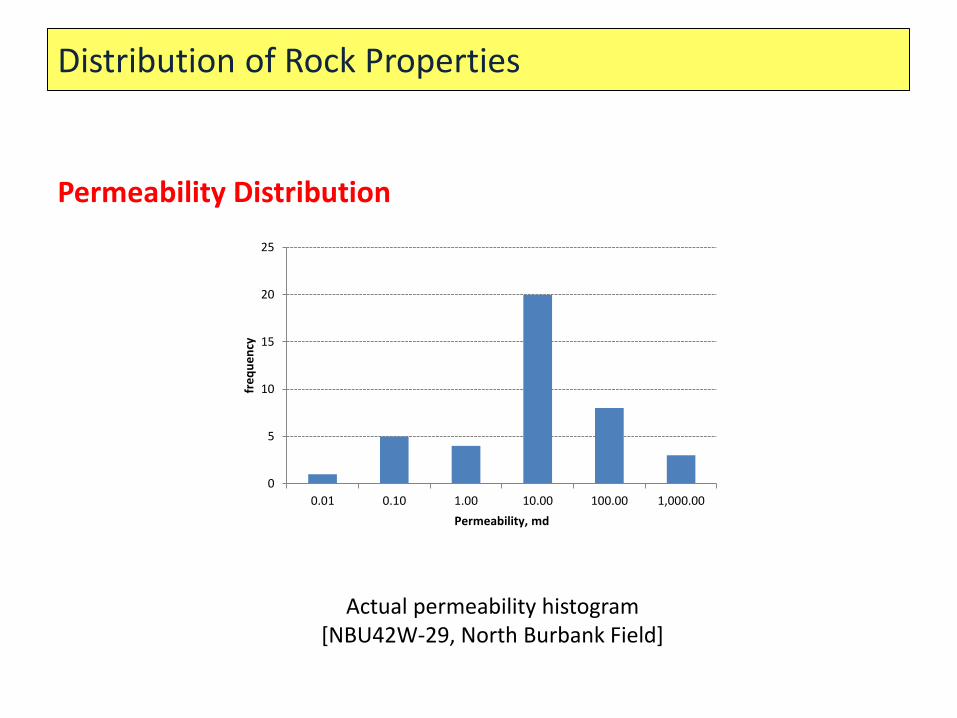
Distribution of Rock Properties
Permeability Distribution
Actual permeability histogram [NBU42W-29, North Burbank Field]
0
5
10
15
20
25
0.01 0.10 1.00 10.00 100.00 1,000.00
fre
qu
en
cy
Permeability, md

Distribution of Rock Properties
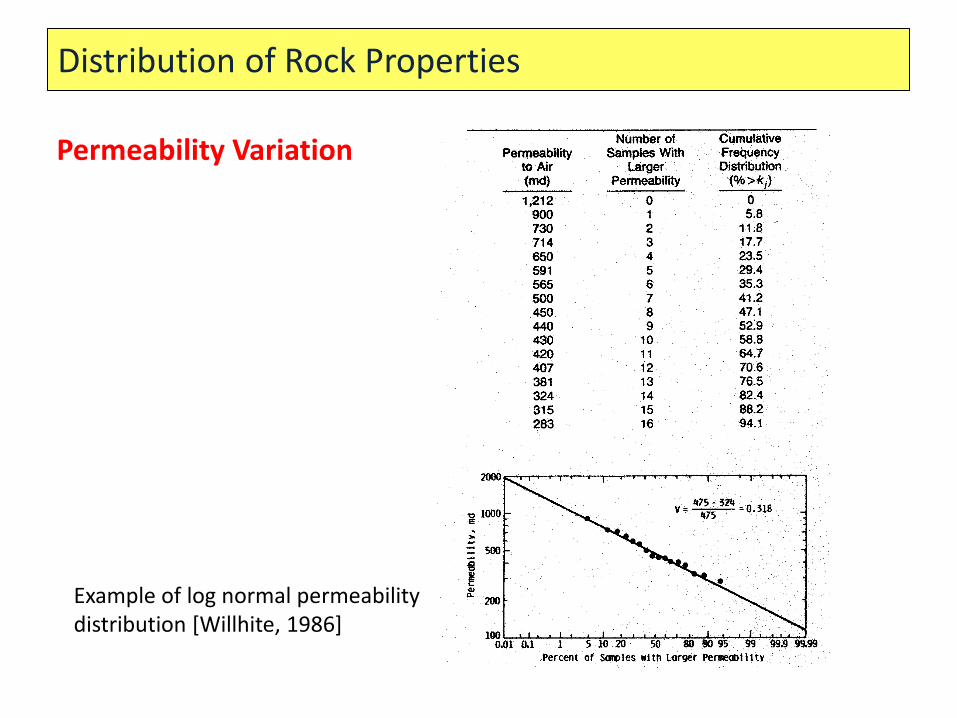
Permeability Variation
Dykstra-Parsons Coefficient
Characterization of reservoir heterogeneity by permeability variation
[Willhite, 1986]
50k
1.84k
50k
V
Distribution of Rock Properties
Permeability Variation
Example of log normal permeability distribution [Willhite, 1986]

Distribution of Rock Properties
Permeability Variation
Actual Dykstra-Parsons probability plot [NBU42W-29, North Burbank Field]
y = 578.37e-4.647x R² = 0.9917
0.001
0.010
0.100
1.000
10.000
100.000
1000.000
10000.000
0.0 0.2 0.4 0.6 0.8 1.0
k,m
d
probability of samples with permeability >
Flow units

Distribution of Rock Properties
Flow capacity vs storage capacity distribution [Craig, 1971]
Permeability Variation
Lorenz Coefficient
ADCAArea
ABCAArea
kL

Distribution of Rock Properties
Permeability Variation
Lorenz Coefficient
643.0
ADCAArea
ABCAAreaLk
Actual Lorenz plot [NBU42W-29, North Burbank Field]
y = -3.8012x4 + 10.572x3 - 11.01x2 + 5.2476x - 0.0146 R² = 0.9991
0
0.1
0.2
0.3
0.4
0.5
0.6
0.7
0.8
0.9
1
0 0.2 0.4 0.6 0.8 1
Fra
cti
on
of
tota
l F
low
Cap
acit
y
Fraction of total Volume
Flow Capacity Distribution
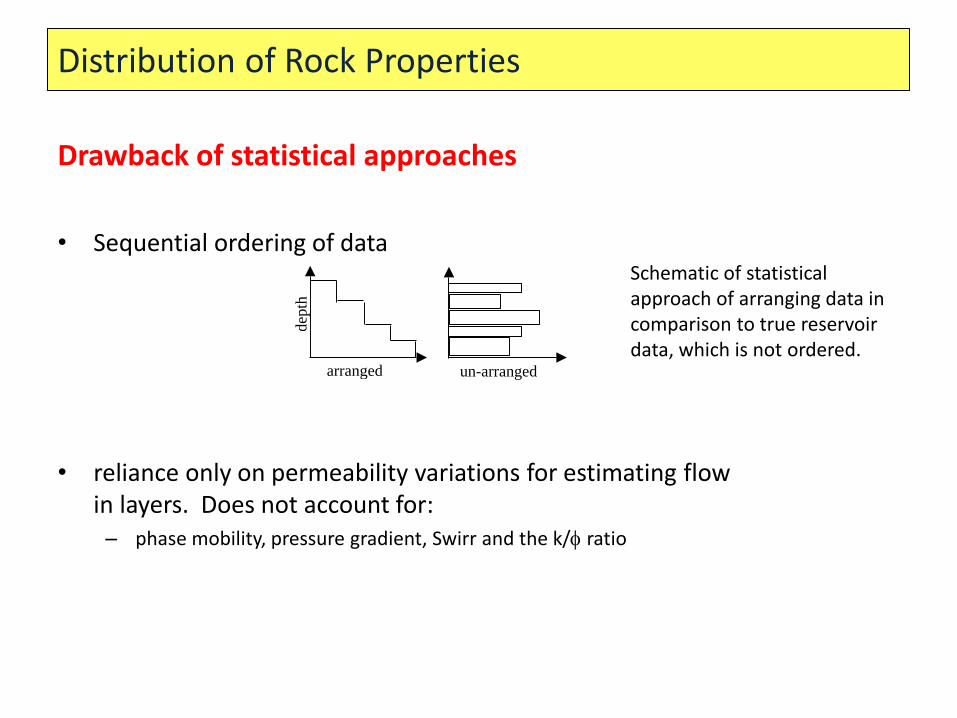
Distribution of Rock Properties
dep
th
arranged un-arranged
Schematic of statistical approach of arranging data in comparison to true reservoir data, which is not ordered.
Drawback of statistical approaches
• Sequential ordering of data
• reliance only on permeability variations for estimating flow in layers. Does not account for: – phase mobility, pressure gradient, Swirr and the k/ ratio
Distribution of Rock Properties
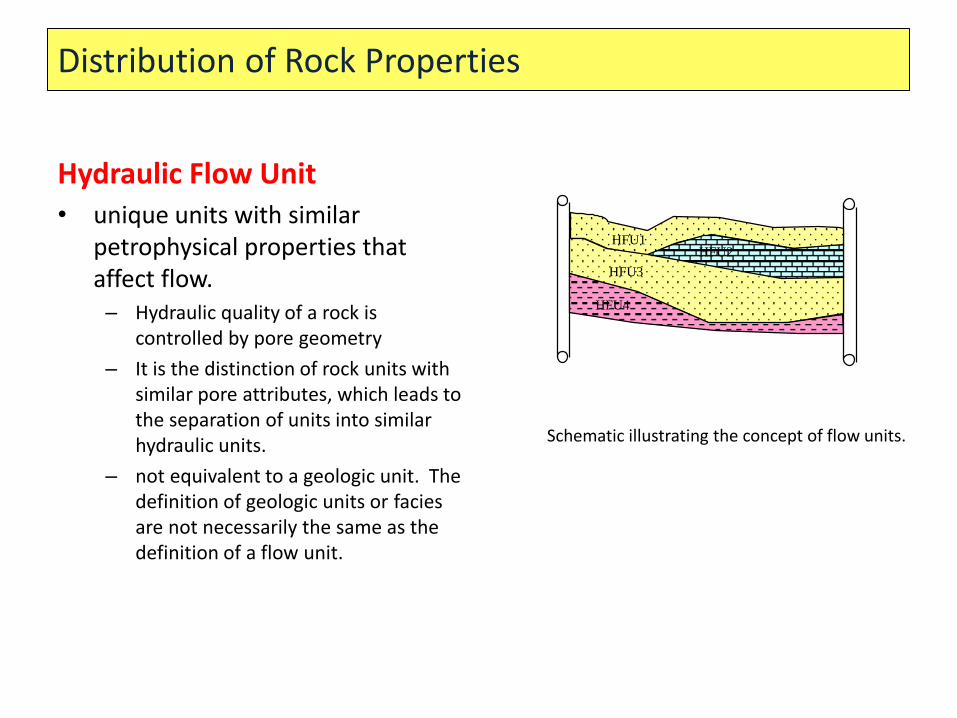
Hydraulic Flow Unit • unique units with similar
petrophysical properties that affect flow. – Hydraulic quality of a rock is
controlled by pore geometry
– It is the distinction of rock units with similar pore attributes, which leads to the separation of units into similar hydraulic units.
– not equivalent to a geologic unit. The definition of geologic units or facies are not necessarily the same as the definition of a flow unit.
HFU1 HFU2
HFU3
HFU4
Schematic illustrating the concept of flow units.
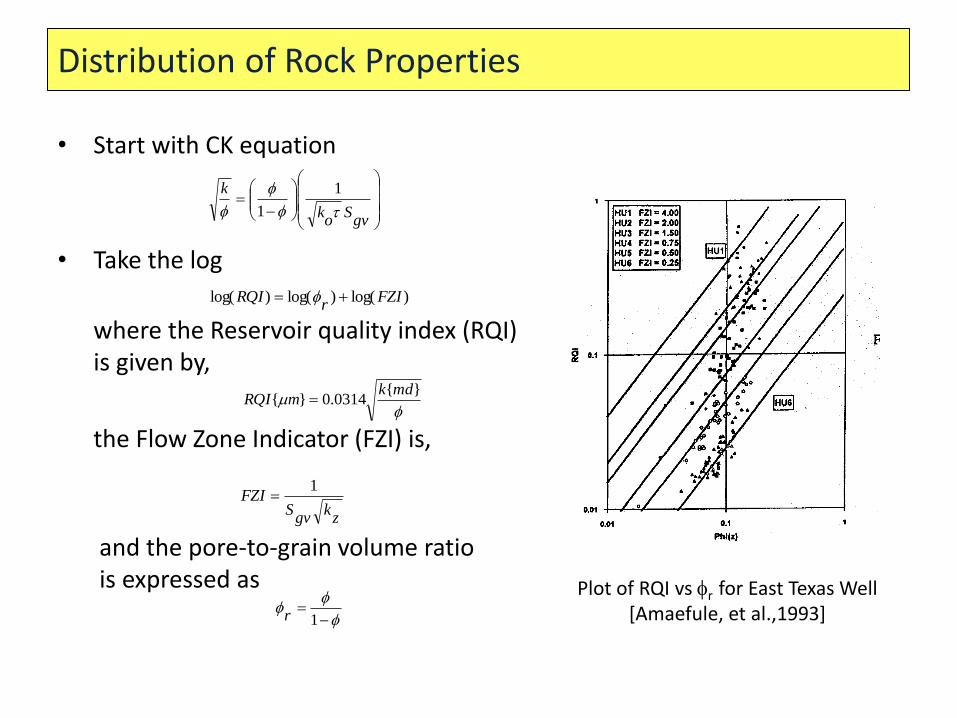
Distribution of Rock Properties
• Start with CK equation
• Take the log
where the Reservoir quality index (RQI) is given by,
the Flow Zone Indicator (FZI) is,
and the pore-to-grain volume ratio is expressed as Plot of RQI vs r for East Texas Well
[Amaefule, et al.,1993]
)log()log()log( FZIr
RQI
}{0314.0}{
mdkmRQI
zk
gvS
FZI1
1r
gvS
ok
k
1
1
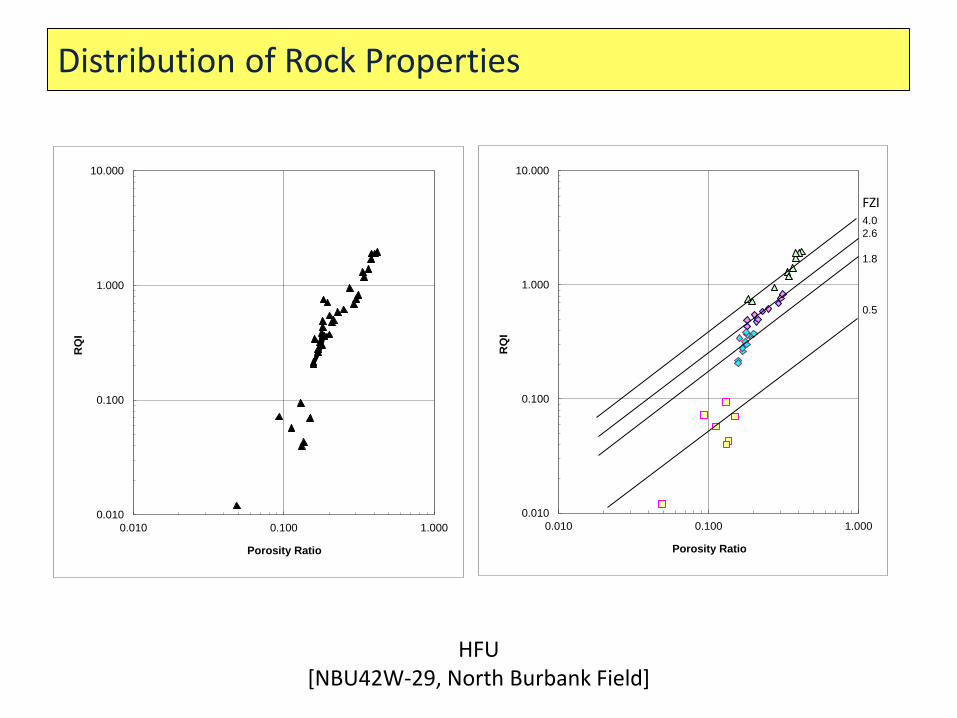
Distribution of Rock Properties
HFU [NBU42W-29, North Burbank Field]
0.010
0.100
1.000
10.000
0.010 0.100 1.000
RQ
I
Porosity Ratio
0.010
0.100
1.000
10.000
0.010 0.100 1.000
RQ
I
Porosity Ratio
4.0
2.6
1.8
0.5
FZI
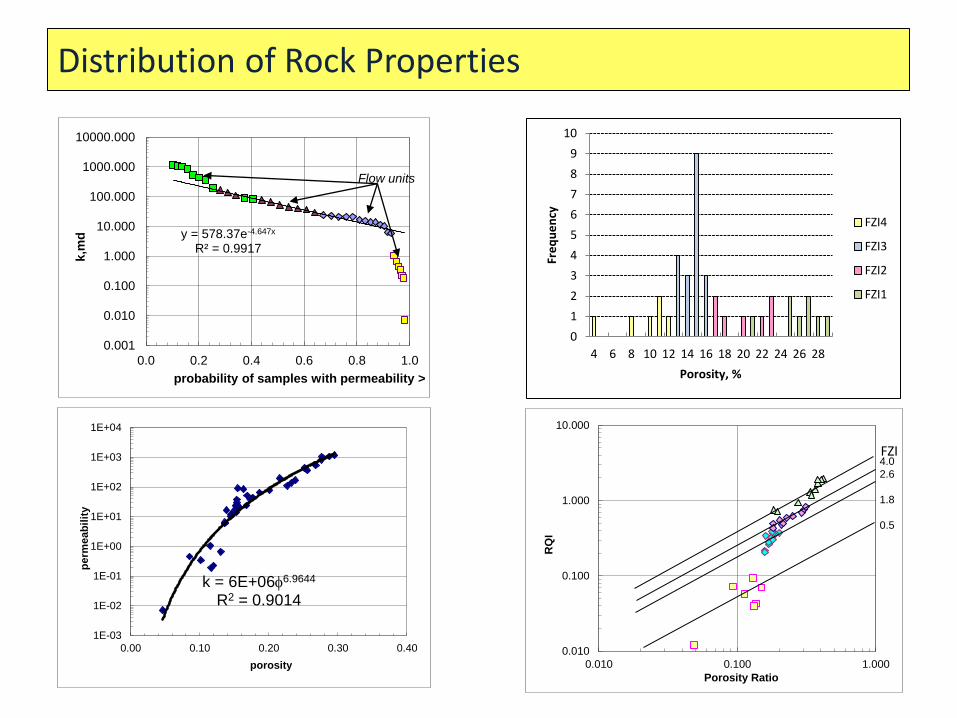
Distribution of Rock Properties
y = 578.37e-4.647x R² = 0.9917
0.001
0.010
0.100
1.000
10.000
100.000
1000.000
10000.000
0.0 0.2 0.4 0.6 0.8 1.0
k,m
d
probability of samples with permeability >
Flow units
0
1
2
3
4
5
6
7
8
9
10
4 6 8 10 12 14 16 18 20 22 24 26 28
Fre
qu
en
cy
Porosity, %
FZI4
FZI3
FZI2
FZI1
k = 6E+066.9644 R2 = 0.9014
1E-03
1E-02
1E-01
1E+00
1E+01
1E+02
1E+03
1E+04
0.00 0.10 0.20 0.30 0.40
pe
rme
ab
ilit
y
porosity
0.010
0.100
1.000
10.000
0.010 0.100 1.000
RQ
I
Porosity Ratio
4.0
2.6
1.8
0.5
FZI


