Portrait of the Crisis: Risks and Opportunities for Investors Hung Tran IIF, Counsellor and Senior Director of Capital Markets and Emerging Markets Policy Garanti Masters Private Banking Conference Istanbul, Turkey April 17, 2009
Transcript
Portrait of the Crisis: Risks and Opportunities for Investors
Hung TranIIF, Counsellor and Senior Director of Capital Markets
and Emerging Markets Policy
Garanti Masters Private Banking Conference
Istanbul, Turkey
April 17, 2009
2
Main Themes
1. Perceived tail risk of economic and financial meltdown has diminished
2. Risk appetite has revived: risk assets have outperformed YTD
3. Most EMs and HG corporates could provide stabilization
4. Weaknesses in key sectors:
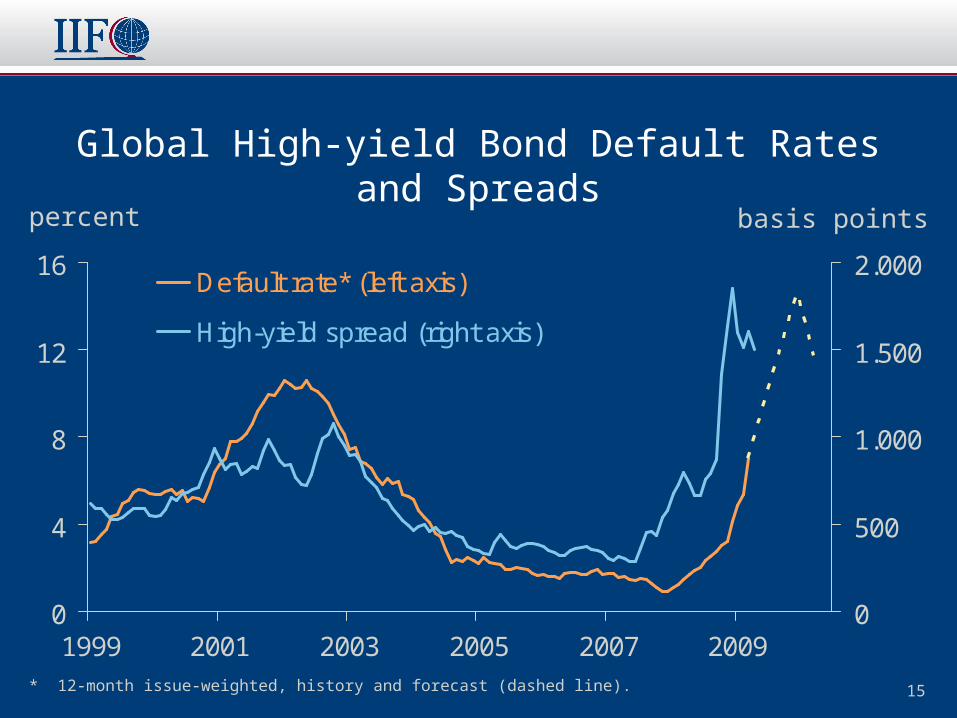
• HY corporates: sharply rising default rates, collapsing recovery rates
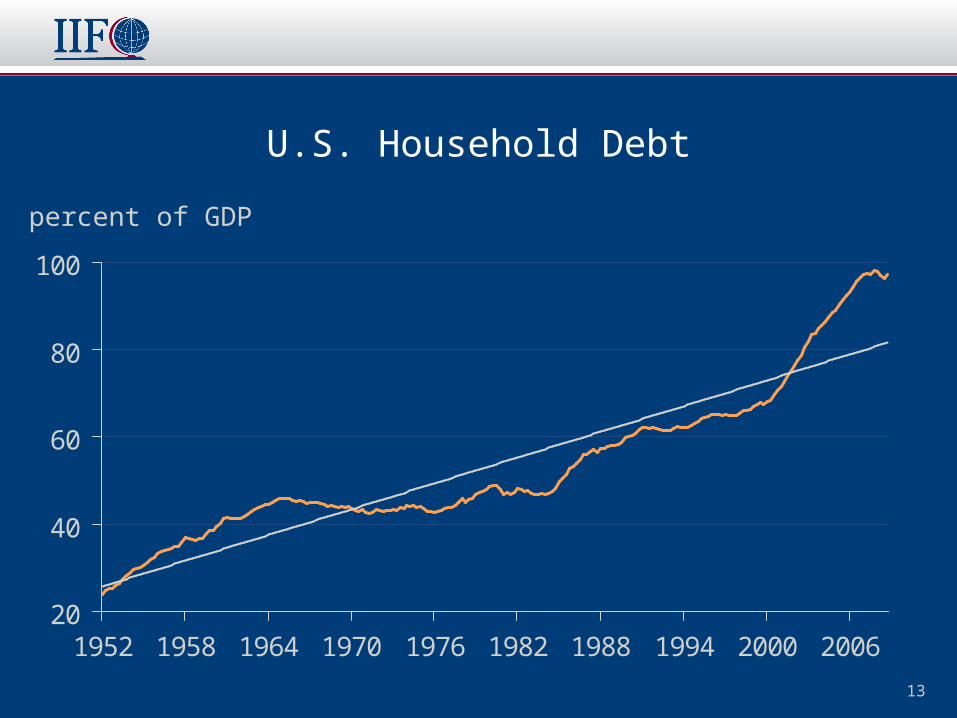
• Households: becoming more leveraged, more pressure to reduce debt
• Life insurance companies: facing solvency problems
• Pension funds: seriously underfunded
• Banks: funding situation and pre-tax/pre-provision earnings improved, but troubled assets/capital adequacy remain serious challenges
5. Key risks: threats to senior bank debt could trigger another spike in risk aversion
3
Outperformance of Risk Assets Year-to-date
-13,1-1,9
3,17,07,1
11,3
-6,3
12,2
16,5
10-year U.S. TreasuryEM local bonds
U.S. HG corporatesEM HG corporates
EM sovereign bondsEM HY corporates
U.S. HY corporates
Mature marketsEmerging markets
percent
Equities*
Fixed Income
* Returns in US$ terms.
4
Equity Market Volatility*
0
20
40
60
80
Oca.07 Haz.07 Kas.07 Nis.08 Eyl.08 Şub.09
percent
* VIX index of implied volatility of S&P 500 index options.
5
Mature and Emerging Market Equities*
index, end-2007=100
* MSCI indices (US$ returns).
Jan 08 Apr 08 Jul 08 Oct 08 Jan 09 Apr 09
6
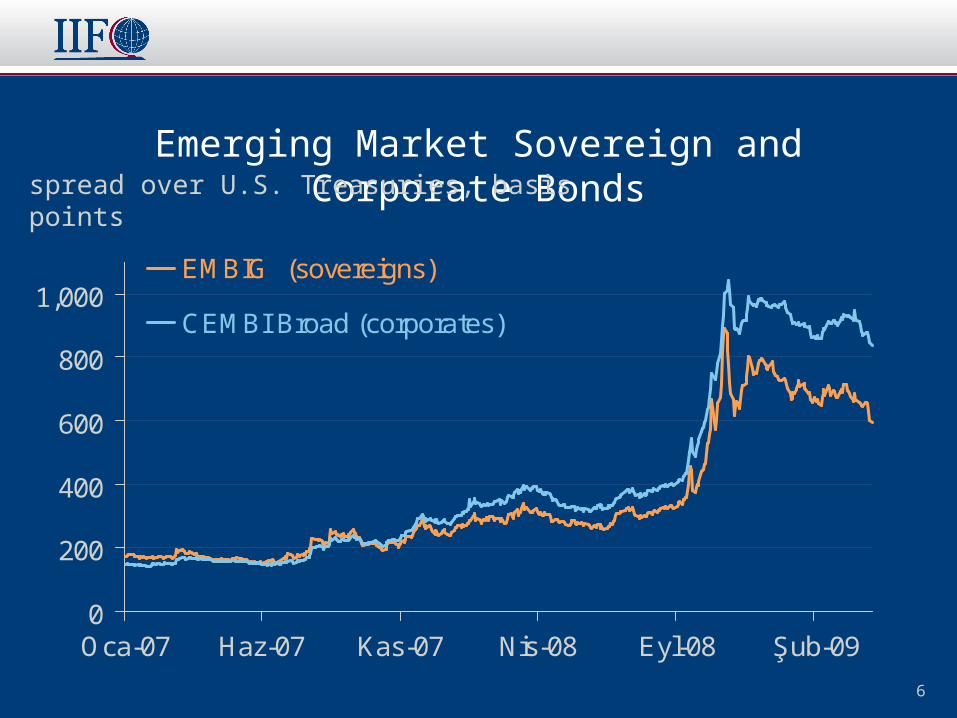
Emerging Market Sovereign and Corporate Bonds
0
200
400
600
800
1,000
Oca-07 Haz-07 Kas-07 Nis-08 Eyl-08 Şub-09
EMBIG (sovereigns)
CEMBI Broad (corporates)
spread over U.S. Treasuries, basis points
7
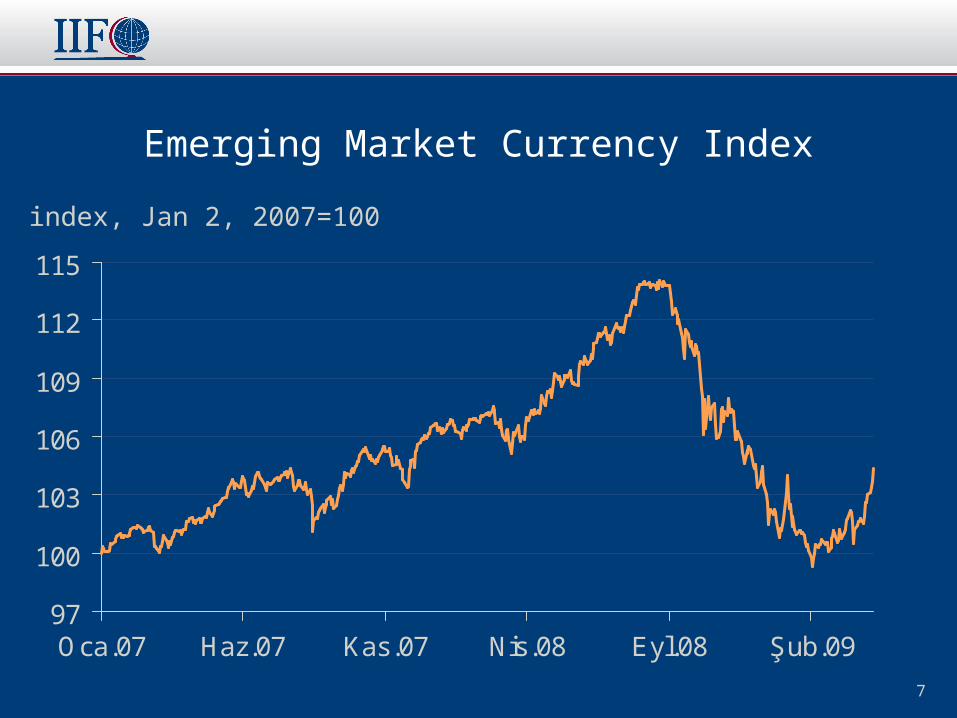
Emerging Market Currency Index
97
100
103
106
109
112
115
Oca.07 Haz.07 Kas.07 Nis.08 Eyl.08 Şub.09
index, Jan 2, 2007=100
8
Central & Eastern Europe Currency Peg CountriesCurrent Account Balances
* Cash defined as foreign deposits, checkable deposits and currency, time and savings deposits, and money market fund shares. Tangible assets at market value or replacement cost.
percent
12
U.S. Household Debt
4
8
12
16
20
24
28
1952 1958 1964 1970 1976 1982 1988 1994 2000 2006
percent of net worth
13
U.S. Household Debt
20
40
60
80
100
1952 1958 1964 1970 1976 1982 1988 1994 2000 2006
percent of GDP
14
High-yield Bond Annual Recovery Rates
0
10
20
30
40
50
60
70
1982 1985 1988 1991 1994 1997 2000 2003 2006 2009
Average, 1982-2009
percent
15
Global High-yield Bond Default Rates and Spreads
0
4
8
12
16
1999 2001 2003 2005 2007 20090
500
1.000
1.500
2.000Default rate* (left axis)
High-yield spread (right axis)
percent basis points
* 12-month issue-weighted, history and forecast (dashed line).
16
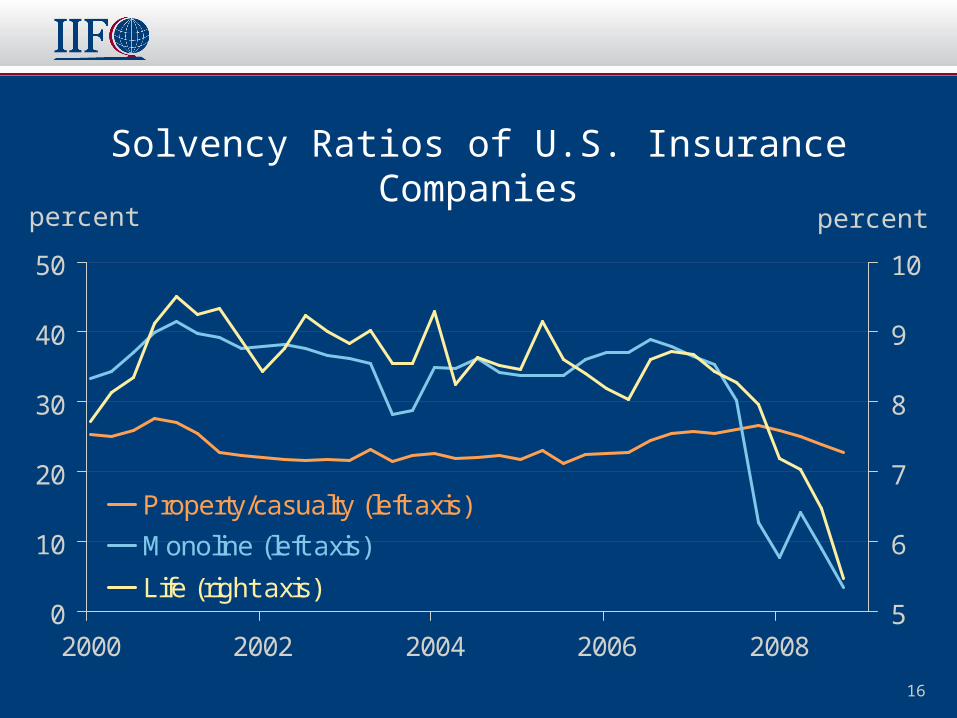
Solvency Ratios of U.S. Insurance Companies
0
10
20
30
40
50
2000 2002 2004 2006 20085
6
7
8
9
10
Property/casualty (left axis)
Monoline (left axis)
Life (right axis)
percent percent
17
Global Pension Assets
25
3028
2522
201617
0
5
10
15
20
25
30
35
2001 2002 2003 2004 2005 2006 2007 2008e
OECD Non-OECD Estimate
US$ trillions
e = estimate.
18
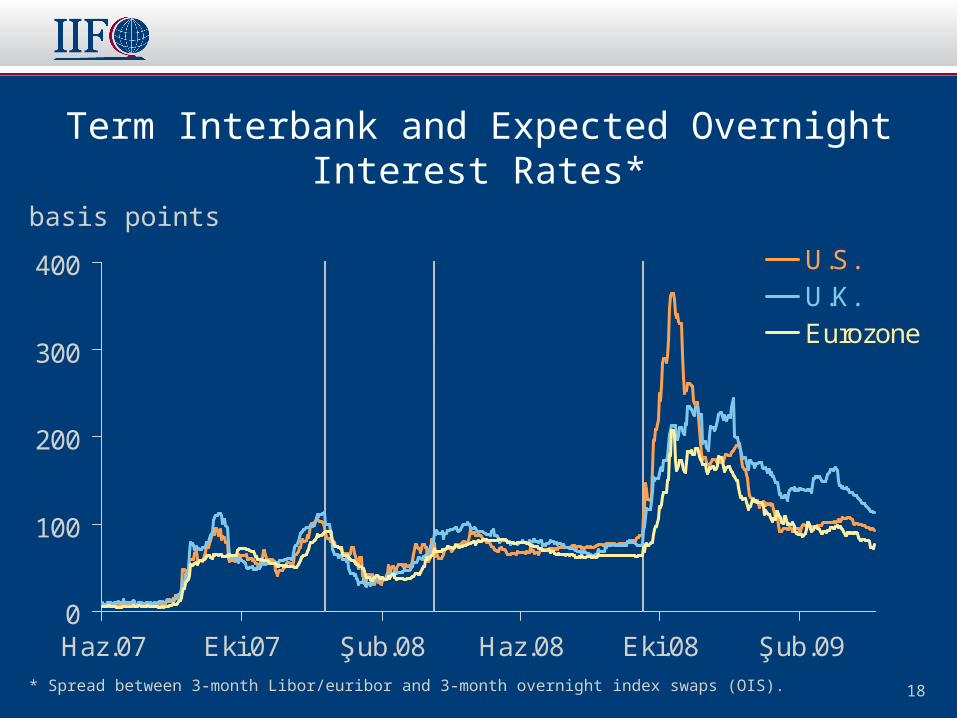
Term Interbank and Expected Overnight Interest Rates*
0
100
200
300
400
Haz.07 Eki.07 Şub.08 Haz.08 Eki.08 Şub.09
U.S.U.K.Eurozone
Dec 12 -coordinated central bank liquidity measures announced
Mar 17 -Fed approves financing for the purchase of Bear Stearns
Sep 15 -Lehman Brothers files for bankruptcy
basis points
* Spread between 3-month Libor/euribor and 3-month overnight index swaps (OIS).
19
Fed’s Central Bank U.S. Dollar Liquidity Swap Lines
0
100
200
300
400
500
600
Ara.07 Mar.08 Haz.08 Eyl.08 Ara.08 Mar.09
US$ billions
20
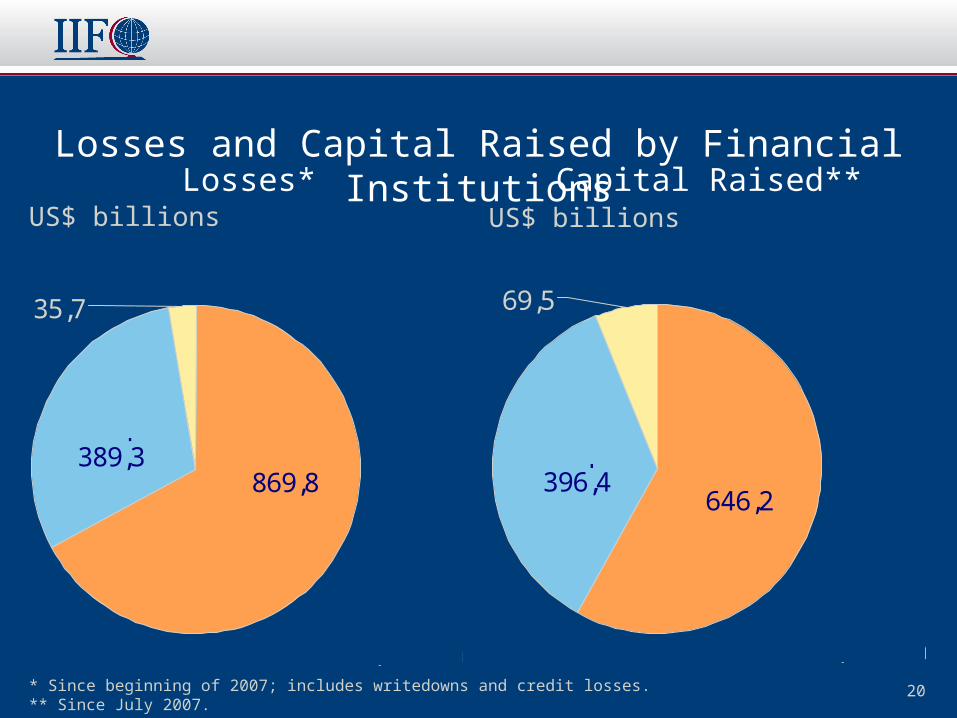
Losses and Capital Raised by Financial Institutions
35,7
389,3869,8
AmericasEurope
Asia
Total: $1,295 bn
US$ billions
* Since beginning of 2007; includes writedowns and credit losses. ** Since July 2007.
Losses*US$ billions
Capital Raised**
69,5
646,2396,4 Americas
Europe
Asia
Total: $1,112 bn
21
U.S. and European Debt Outstandingand Estimated Losses
0
3
6
9
12
15
U.S.securitizedassets andcorporate
bonds*
U.S. financialsectorloans**
Eurozonecorporate
debt
Europeansecuritized
assets
Exposure ofBIS reporting
banks todevelopingcountries
Total potential mark-to-market or loan lossesBalance of outstandings
US$ trillions
* Includes ABS, ABS CDOs, prime MBS, CMBS, corporate debt and CLOs.** Includes subprime and prime mortgages, and consumer, corporate and leveraged loans.
22
U.S. Fixed-rate Credit Card ABS Spreads*
0
500
1.000
1.500
2.000
2.500
Haz.07 Eki.07 Şub.08 Haz.08 Eki.08 Şub.09
AAA A BBB
basis points
* 5-year bonds; spread to swaps.
23
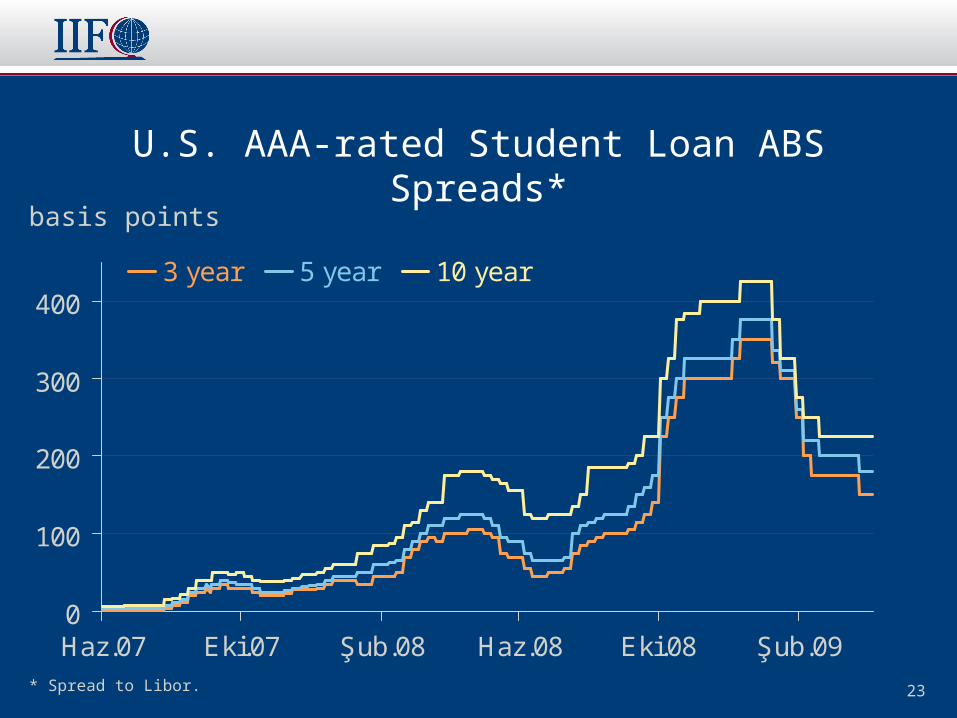
U.S. AAA-rated Student Loan ABS Spreads*
0
100
200
300
400
Haz.07 Eki.07 Şub.08 Haz.08 Eki.08 Şub.09
3 year 5 year 10 year
basis points
* Spread to Libor.
24
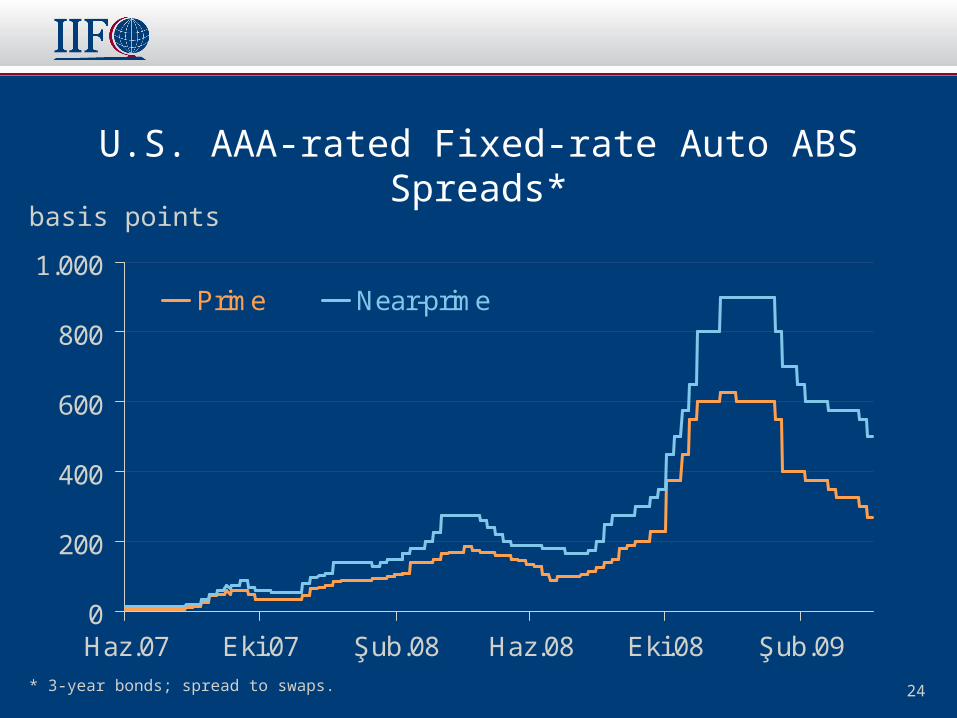
U.S. AAA-rated Fixed-rate Auto ABS Spreads*
0
200
400
600
800
1.000
Haz.07 Eki.07 Şub.08 Haz.08 Eki.08 Şub.09
Prime Near-prime
basis points
* 3-year bonds; spread to swaps.
25
U.S. Mortgage Delinquencies*
0
10
20
30
40
2005 2006 2007 2008 2009
All Prime
Alt-A Subprime
percent of loans outstanding
* Includes only non-agency mortgages; 30+ days delinquent, bank owned, or in foreclosure.
26
Cost of Protection Against Default onU.S. Home Equity ABS*
0
20
40
60
80
100
Haz.07 Eki.07 Şub.08 Haz.08 Eki.08 Şub.09
AAA AA A
percentage of par
* ABX.HE 2007-01 indices.
27
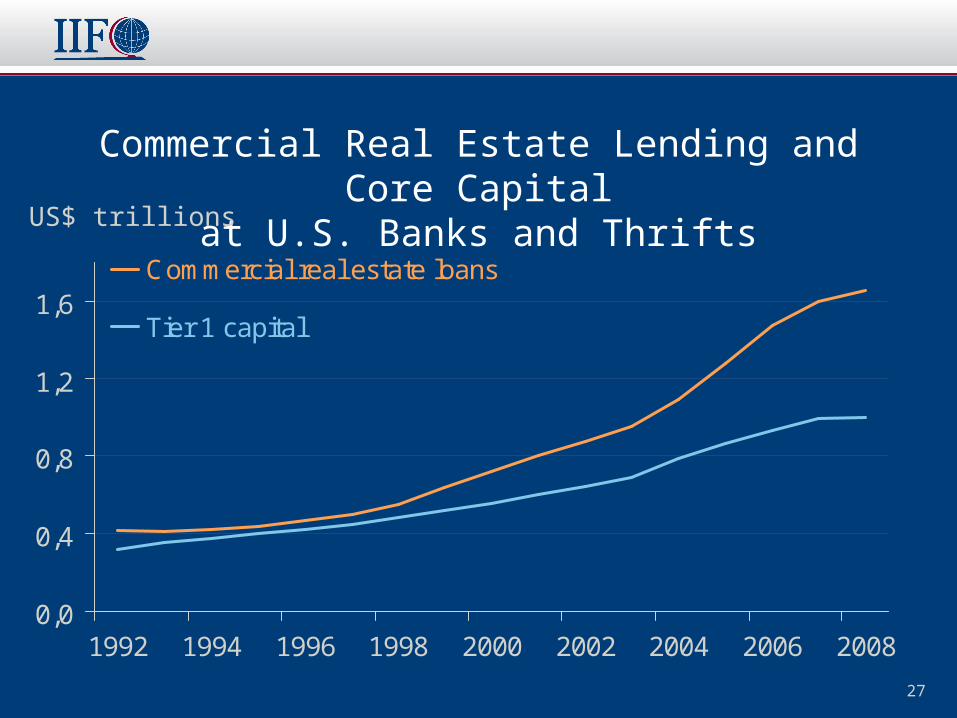
Commercial Real Estate Lending and Core Capitalat U.S. Banks and Thrifts
0,0
0,4
0,8
1,2
1,6
1992 1994 1996 1998 2000 2002 2004 2006 2008
Commercial real estate loans
Tier 1 capital
US$ trillions
28
Cost of Protection Against Default on U.S. CMBS*
0
1.000
2.000
3.000
4.000
5.000
Haz.07 Kas.07 Nis.08 Eyl.08 Şub.09
AAA AA BBB
basis points
* CMBX.NA.3 index spreads.
29
Capital Ratios of U.S. Commercial Banks*
7
8
9
10
11
12
2000 2002 2004 2006 2008
percent
* Asset-weighted average for sample of 12 U.S. commercial banks.
Tier 1 Capital Ratiopercent
Common Equity to Assets
5,5
6,0
6,5
7,0
7,5
8,0
2000 2002 2004 2006 2008
30
Capital Ratios of U.K. and European Banks*
7,5
8,0
8,5
9,0
9,5
10,0
2000 2002 2004 2006 2008
percent
* Asset-weighted average for sample of 12 U.K. and European commercial banks.
Tier 1 Capital Ratiopercent
Common Equity to Assets
2,0
2,5
3,0
3,5
4,0
4,5
2000 2002 2004 2006 2008
31
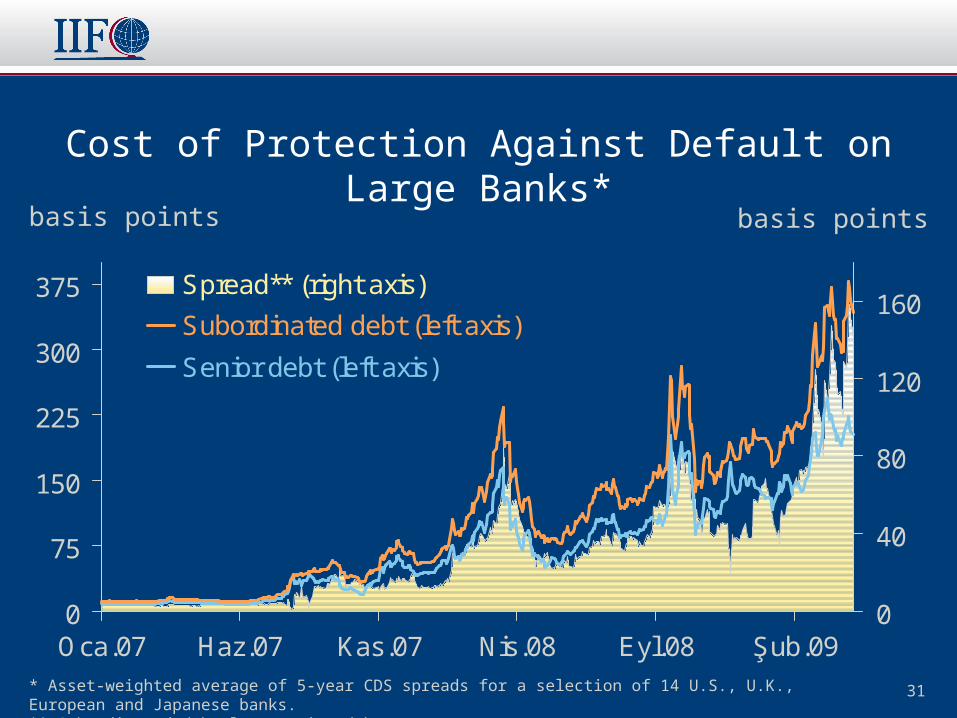
Cost of Protection Against Default on Large Banks*
0
75
150
225
300
375
Oca.07 Haz.07 Kas.07 Nis.08 Eyl.08 Şub.090
40
80
120
160Spread** (right axis)
Subordinated debt (left axis)
Senior debt (left axis)
basis points basis points
* Asset-weighted average of 5-year CDS spreads for a selection of 14 U.S., U.K., European and Japanese banks.** Subordinated debt less senior debt.
Portrait of the Crisis: Risks and Opportunities for Investors
Hung TranIIF, Counsellor and Senior Director of Capital Markets


![;;.iif' Paper ID[ C 8305]](https://static.documents.pub/doc/80x56/6256e8dccd6bb25972726384/iif-paper-id-c-8305.jpg)


