Position 170 of Rabbit Na 1 /Glucose Cotransporter (rSGLT1) Lies in the Na 1 Pathway; Modulation of Polarity/Charge at this Site Regulates Charge Transfer and Carrier Turnover Steven A. Huntley, Daniel Krofchick, and Mel Silverman Department of Medicine, University of Toronto, Toronto, Ontario, Canada ABSTRACT Positions 163, 166, and 173, within the putative external loop joining transmembrane segments IV and V of rabbit Na 1 /glucose cotransporter, form part of its Na 1 interaction and voltage-sensing domain. Since a Q170C mutation within this region exhibits anomalous behavior, its function was further investigated. We used Xenopus oocytes coinjected with mouse T-antigen to enhance Q170C expression, and the two-microelectrode voltage-clamp technique. For Q170C, a-methyl D-glucopyranoside, phloridzin, and Na 1 affinity values are equivalent to those of wild-type; but turnover is reduced ;50%. Decreased [Na 1 ] reduces Q170C, but not wild-type, charge transfer. Q170C presteady-state currents exhibit three time constants, t, identical to wild-type. MTSES decreases maximal a-methyl D-glucopyranoside-induced currents by ;64% and Na 1 leak by ;55%; phloridzin and Na 1 affinity are unchanged. MTSES also reduces charge transfer (dithiothreitol-reversible) and Q170C turnover by ;60–70%. MTSEA and MTSET protect against MTSES, but neither affect Q170C function. MTSES has no obvious effect on the t-values. Q170A behaves the same as Q170C. The mutation Q170E affects voltage sensitivity and reduces turnover, but also appears to influence Na 1 interaction. We conclude that 1), glutamine 170 lies in the Na 1 pathway in rabbit Na 1 /glucose cotransporter and 2), altered polarity and charge at position 170 affect a cotransporter conformational state and transition, which is rate-limiting, but probably not associated with empty carrier reorientation. INTRODUCTION The rabbit intestinal Na 1 /glucose carrier (rSGLT1) is the first Na 1 cotransporter to have been cloned (Hediger et al., 1987), and serves as an excellent model system to explore the mechanisms of ion-coupled transport. The expression of cloned SGLT1 in Xenopus oocytes and the use of the two- microelectrode voltage-clamp technique have been particu- larly informative. Steady-state, sugar-induced inward Na 1 currents of the cotransporter yield affinity values for Na 1 , and sugar substrate, as well as estimates of substrate coupling stoichiometry (Chen et al., 1996; Parent et al., 1992a). Presteady-state current traces, acquired in the presence of Na 1 (but not sugar substrate), are inhibited with either excess sugar, or the inhibitor phloridzin (pz). These current traces contain information about transition states involved in Na 1 binding/debinding, and reorientation of empty carrier across the membrane (Loo et al., 1993; Zampighi et al., 1995). The presteady-state currents are attributed to movement of Na 1 within the electric field of the membrane, and movement of charged residues of the empty cotransporter as it undergoes conformational transitions (Loo et al., 1993). The simplest model that has been proposed, as illustrated in Fig. 1 A, consists of two outward-facing conformational states: one with bound Na 1 , state 1, and one without Na 1 , state 2; and an inward-facing conformational state of empty carrier, state 3. According to this three-state model, there are two transitions, one involving Na 1 binding/debinding, and another involving reorientation of the empty cotransporter between outward- and inward-facing conformations. However, using the cut- open oocyte technique (Costa et al., 1994; Taglialatela et al., 1992), Chen et al. (1996) documented the existence of two distinct transitions of human SGLT1 (hSGLT1) in the complete absence of Na 1 , implying that reorientation of empty carrier from outside to inside takes place in two steps rather than one. This evidence led to the revised four-state model, illustrated in Fig. 1 B. Recently, Krofchick and Silverman (2003) performed a detailed analysis of rSGLT1 OFF currents. Using this experimental approach, complemented by computer simula- tion studies, the transient currents were characterized by a third-order exponential decay, yielding three time con- stants, thus supporting the four-state model. Although there now appears to be sufficient evidence that the number of Submitted January 18, 2004, and accepted for publication April 5, 2004. Address reprint requests to Mel Silverman, Medical Sciences Building, Room 7205, 1 King’s College Circle, Toronto, ON, M5S 1A8, Canada. Tel.: 416-978-7189; Fax: 416-971-2132; E-mail: [email protected]. Abbreviations used: aMG, a-methyl D-glucopyranoside; DTT, dithiothrei- tol; hSGLT1, human SGLT1; I max , maximal substrate-induced current; k, turnover number; K D , phloridzin affinity constant; K M , substrate affinity constant; K Na , Na 1 affinity constant; MTS, methanethiosulfonate; MTSEA, (2-aminoethyl)methanethiosulfonate hydrobromide; MTSES, Na 1 (2-sulfonatoethyl)methanethiosulfonate; MTSET, [2-(trimethylammo- nium)ethyl]methanethiosulfonate bromide; n, Hill coefficient; pz, phlor- idzin; Q dep , charge due to depolarizing pulses; Q hyp , charge due to hyperpolarizing pulses; Q max , the maximum charge transferred as calculated with the two-state Boltzmann relation; Q total , the maximum charge transferred; rSGLT1, rabbit SGLT1; SGLT1, high affinity Na 1 / glucose cotransporter; wt SGLT1, wild-type SGLT1; t, decay constant; t s , slow decay constant; t m , medium decay constant; t f , fast decay constant; TM, transmembrane segment; V 0.5 , potential at which charge transfer is half complete; V h , holding potential; V t , test potential; z, steady-state valence; z app , apparent valence of charge movement. Ó 2004 by the Biophysical Society 0006-3495/04/07/295/16 $2.00 doi: 10.1529/biophysj.104.040253 Biophysical Journal Volume 87 July 2004 295–310 295
Transcript
Position 170 of Rabbit Na1/Glucose Cotransporter (rSGLT1) Lies in theNa1 Pathway; Modulation of Polarity/Charge at this Site RegulatesCharge Transfer and Carrier Turnover
Steven A. Huntley, Daniel Krofchick, and Mel SilvermanDepartment of Medicine, University of Toronto, Toronto, Ontario, Canada
ABSTRACT Positions 163, 166, and 173, within the putative external loop joining transmembrane segments IV and V of rabbitNa1/glucose cotransporter, form part of its Na1 interaction and voltage-sensing domain. Since a Q170C mutation within thisregion exhibits anomalous behavior, its function was further investigated. We used Xenopus oocytes coinjected with mouseT-antigen to enhance Q170C expression, and the two-microelectrode voltage-clamp technique. For Q170C, a-methylD-glucopyranoside, phloridzin, and Na1 affinity values are equivalent to those of wild-type; but turnover is reduced ;50%.Decreased [Na1] reduces Q170C, but not wild-type, charge transfer. Q170C presteady-state currents exhibit three timeconstants, t, identical to wild-type. MTSES decreases maximal a-methyl D-glucopyranoside-induced currents by ;64% andNa1 leak by ;55%; phloridzin and Na1 affinity are unchanged. MTSES also reduces charge transfer (dithiothreitol-reversible)and Q170C turnover by;60–70%. MTSEA and MTSET protect against MTSES, but neither affect Q170C function. MTSES hasno obvious effect on the t-values. Q170A behaves the same as Q170C. The mutation Q170E affects voltage sensitivity andreduces turnover, but also appears to influence Na1 interaction. We conclude that 1), glutamine 170 lies in the Na1 pathway inrabbit Na1/glucose cotransporter and 2), altered polarity and charge at position 170 affect a cotransporter conformational stateand transition, which is rate-limiting, but probably not associated with empty carrier reorientation.
INTRODUCTION
The rabbit intestinal Na1/glucose carrier (rSGLT1) is the first
Na1 cotransporter to have been cloned (Hediger et al., 1987),
and serves as an excellent model system to explore the
mechanisms of ion-coupled transport. The expression of
cloned SGLT1 in Xenopus oocytes and the use of the two-
microelectrode voltage-clamp technique have been particu-
currents of the cotransporter yield affinity values for Na1, and
sugar substrate, as well as estimates of substrate coupling
stoichiometry (Chen et al., 1996; Parent et al., 1992a).
Presteady-state current traces, acquired in the presence ofNa1
(but not sugar substrate), are inhibited with either excess
sugar, or the inhibitor phloridzin (pz). These current traces
contain information about transition states involved in Na1
binding/debinding, and reorientation of empty carrier across
the membrane (Loo et al., 1993; Zampighi et al., 1995). The
presteady-state currents are attributed to movement of Na1
within the electric field of the membrane, and movement of
charged residues of the empty cotransporter as it undergoes
conformational transitions (Loo et al., 1993). The simplest
model that has been proposed, as illustrated in Fig. 1 A,consists of two outward-facing conformational states: one
with boundNa1, state 1, and one without Na1, state 2; and aninward-facing conformational state of empty carrier, state 3.According to this three-state model, there are two transitions,
one involving Na1 binding/debinding, and another involving
reorientation of the empty cotransporter between outward-
and inward-facing conformations. However, using the cut-
open oocyte technique (Costa et al., 1994; Taglialatela et al.,
1992), Chen et al. (1996) documented the existence of
two distinct transitions of human SGLT1 (hSGLT1) in the
complete absence of Na1, implying that reorientation of
empty carrier from outside to inside takes place in two steps
rather than one. This evidence led to the revised four-state
model, illustrated in Fig. 1 B.Recently, Krofchick and Silverman (2003) performed
a detailed analysis of rSGLT1 OFF currents. Using this
experimental approach, complemented by computer simula-
tion studies, the transient currents were characterized by
a third-order exponential decay, yielding three time con-
stants, thus supporting the four-state model. Although there
now appears to be sufficient evidence that the number of
Submitted January 18, 2004, and accepted for publication April 5, 2004.
FIGURE 9 A comparison of the decay constants and voltage dependen-
cies of Q170C and wt rSGLT1 transient currents. (A) ts, Slow decay
constant. (B) tm, Medium decay constant. (C) tf, Fast decay constant. For wtrSGLT1, n ¼ 3, except for �150 mV, �110 mV, �90 mV, and 50 mV, in
which n ¼ 2. For Q170C rSGLT1, n¼ 3. Error bars represent standard error
for data points of n ¼ 3, and the mean of the difference for n ¼ 2.
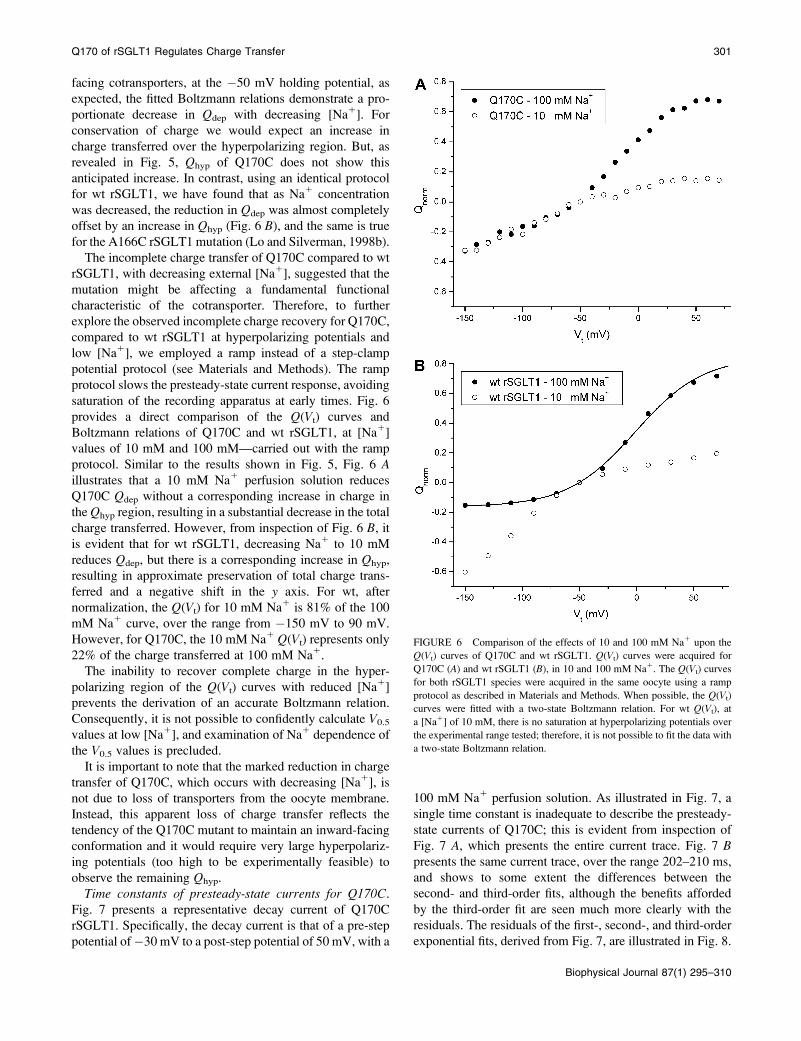
Q170 of rSGLT1 Regulates Charge Transfer 303
Biophysical Journal 87(1) 295–310
The effects of methanethiosulfonate compoundson Q170C functional behavior
We next examined the consequences of reacting Q170C with
cysteine-specific sulfhydryl reagents, MTSEA, MTSES, and
MTSET. Rabbit SGLT1 has 15 endogenous cysteine
residues; none of the native cysteine residues was removed.
Recall that neitherMTSEAnorMTSES affects the function of
wt rSGLT1 (Lo and Silverman, 1998a,b; Vayro et al., 1998).
Effect of MTSES on Q170C steady-state currents
MTSES greatly suppresses sugar-induced inward Na1
currents. Because of the marked degree of inhibition by
MTSES, it was not possible to obtain accurate measurements
of sugar-induced Na1 currents at sugar concentrations below
saturation (i.e.,,10 mM aMG). However, using sufficiently
high expressing oocytes, it was possible to carry out pz
titrations before and after exposure to 1 mM MTSES in the
same oocyte and obtain estimates of pz KD. The pz KD before
exposure to MTSES was determined to be 2.8 6 1.7 mM,
and the KD after exposure was determined to be 3.4 6 2.3
mM (n ¼ 3), indicating that MTSES has no effect on
phloridzin affinity.
As previously indicated, MTSES inhibits sugar-induced
inward Na1 currents to such a degree that oocytes with
exceptional expression of Q170C are required to obtain
reliable experimental data at low Na1 concentrations. We
were fortunate to identify such a high expressor and carry
out a complete post-MTSES Na1 titration. We employed
a protocol in which the Na1 titration was carried out before
and after MTSES exposure in the presence of 10 mM aMG,
in the same oocyte. As shown in Fig. 10 A, treatment with
MTSES significantly suppresses Imax for each of the
hyperpolarizing pulses, �150 mV to �50 mV. The value
Imax was reduced to 36 1/� 3% of the pre-exposure values
(n ¼ 6). Fig. 10 B displays data from the same oocyte used
for Fig. 10 A, and demonstrates that Na1 affinity is far less
affected by MTSES exposure than is Imax. The KNa values
before and after MTSES exhibit voltage dependency, and are
comparable for Vt values from �90 mV to �10 mV.
However, at extreme hyperpolarizing pulses, from�150 mV
to�110 mV, MTSES exposure reduces Q170C’s affinity for
Na1 by one-half or greater. Exposure to 1 mMMTSES does
not alter the apparent stoichiometry of rSGLT1, since the
Hill coefficients match those derived in the absence of
MTSES.
We also carried out experiments to determine the effect on
the Q170C Na1 leak after MTSES exposure. The Na1
current at �150 mV is decreased to 456 2% (n ¼ 3) of pre-
exposure values (data not shown).
Effect of MTSES on Q170C presteady-state currents
As shown in Fig. 11 A, exposure to MTSES results in
substantial reduction of the Q170C Q versus Vt curves,
which is reversed by treatment with 10 mM dithiothreitol
(DTT). Although MTSEA has no effect upon Q170C
function, prior exposure to MTSEA prevents the action of
MTSES, and the MTSEA protection is reversed by DTT
(data not shown). To exclude the possibility that MTSEA
reacts with hydrophobically located native cysteines to bring
about a conformational change, which alters MTSES
accessibility to the 170 position, we performed protection
experiments using the membrane-impermeant, cationic
MTSET. As shown in Fig. 11 B, exposure to MTSET
completely prevents MTSES reaction with Q170C, but
MTSET has no effect on Q170C maximum charge transfer.
FIGURE 10 The effects of 1 mM MTSES upon the steady-state
parameters of a Na1 titration experiment. Na1 titrations, as described in
the legend of Fig. 3, were performed with the same oocyte, before and after
exposure to 1 mM MTSES for 5 min. (A) The Imax values derived with the
Hill equation versus Vt are presented for pre-exposure and post-exposure to
MTSES. (B) KNa vs. Vt are presented for pre-exposure and post-exposure to
MTSES.
304 Huntley et al.
Biophysical Journal 87(1) 295–310
MTSET protection is reversed after exposure to 10 mM
DTT. Given that MTSET reactivity is restricted to externally
accessible native cysteines in SGLT1, we conclude that
MTSET protects against MTSES accessibility to the cysteine
mutation introduced at the 170 position (which is located in
the putative external loop joining TMs IV–V), by directly
reacting (modifying) the cysteine at that site. We conclude
that both cationic MTSEA and MTSET react with Q170C
and that the inhibitory effect of MTSES on charge transfer is
a consequence of the anionic ethylsulfonate group added at
the 170 position. The fact that DTT completely reverses the
inhibitory effect of MTSES within minutes suggests that
reduction in charge transfer byMTSES is not due to a change
in the number of surface-expressed Q170C transporters. To
confirm this, using methods previously established for wt
SGLT1 and an A166C rSGLT1 mutant (Vayro et al., 1998),
we verified that the number of [3H]phloridzin binding sites
in COS-7 cells transfected with Q170C, before and after
treatment with MTSES, was the same (data not shown).
Several other protection experiments were performed with
Q170C expressed in Xenopus oocytes and it was verified thatthe inhibitory effect of MTSES on Q170C function was
independent of Na1 or prior exposure to 200 mM phloridzin.
The effects of MTSES upon the various presteady-state
parameters of Q170C are displayed in Table 2. Exposure to
1 mM MTSES reduces total charge transfer by ;50% over
the voltage range, �150 mV to 190 mV. Further, similar to
what occurs when [Na1] is reduced (see Figs. 5 and 6), there
is a preferential inhibitory effect upon the charge transfer
at depolarizing voltages. In a paired comparison of five
different oocytes, before and after MTSES exposure, the
Qdep contribution to total charge transferred was found to be
82 6 2% in the five oocytes tested, and this contribution is
reduced to 73 6 3% after MTSES exposure (Table 2). This
difference is significant at the p ¼ 0.01 level, but only
accounts for ;10% of the observed ;50% reduction in
Qmax. The majority of the ‘‘loss’’ in charge transfer in the
presence of MTSES occurs because of a failure to recover
charge transfer in the hyperpolarizing region over the range
of observation, up to �150 mV. This behavior is similar to
what is observed when [Na1] is reduced (Figs. 5 and 6), in
the absence of MTSES, and is a direct consequence of the
fact that under both reduced external Na1, and after reaction
with MTSES, the transporter occupancy of its inward-facing
conformation states is substantially increased. More com-
plete charge recovery would require extending the hyper-
polarization beyond �150 mV, a range not feasible
experimentally. Because of the incomplete charge recovery
over the hyperpolarization region, it is not possible to
FIGURE 11 Effects of MTSES, MTSEA, and MTSET on charge transfer
of Q170C. Typical results demonstrating the effects of sulfhydryl-specific
reagents on Q170C charge transfer. The protocols, for each panel, were
carried out in the same oocyte. (A) After documenting the Q vs. Vt behavior
under control conditions (——), the oocyte was superfused with 1 mM
MTSES (...............) for 5 min, followed by 10 mM DTT for 10 min (��������).Data have been normalized to the control. (B)Q vs. V behavior under control
conditions was determined (——), followed by MTSET for 5 min, washed
with voltage-clamping solution, superfused with 1 mM MTSES for 5 min,
washed, and Q vs. V determined (...............). Next, the oocyte was superfused
with 10 mM DTT for 10 min, washed, and Q vs. V measured (��������).Finally, the oocyte was superfused with 1 mM MTSES for 5 min, washed,
and Q vs. V obtained (.....��.....��.....). All curves were normalized to control.
TABLE 2 Effects of 1 mM MTSES on the presteady-state
parameters of Q170C rSGLT1
Parameter pre-MTSES post-MTSES
Qtotal (%) 100 44 6 13
Qdep/Qtotal (%) 82 6 2 73 6 3
The charge (Q) versus potential (Vt) curves of Q170C rSGLT1, were
acquired before and after exposure to 1 mM MTSES for 5 min in the same
oocyte. Qtotal refers to the total charge transferred within the experimental
range, �150 mV to 90 mV. The pre-MTSES Qtotal values correspond to
Qmax.
Q170 of rSGLT1 Regulates Charge Transfer 305
Biophysical Journal 87(1) 295–310
determine the Boltzmann for Q170C post-MTSES and,
consequently, estimation of the effect on V0.5 and dV is
precluded.
After Q170C exposure to MTSES, the substantial
reduction in transient currents made it difficult to resolve the
three decay constants, t (slow, medium, fast), for potentials
more hyperpolarizing than �10 mV. Nevertheless, there
appeared to be no significant difference in the t-values,comparing pre- and post-MTSES conditions from �10 to
70 mV (data not shown).
Effect of MTSES on carrier turnover
Turnover was calculated before and after a 5-min exposure to
1 mMMTSES, in the same oocytes (n¼ 4). The pre-MTSES
turnover was 12.76 1.32 s�1; the post-MTSES turnover was
found to be 4.9 6 1.89 s�1. This ;60% post-MTSES
reduction, observed in the present study, contradicts our
earlier published result (Lo and Silverman, 1998a), in which
we reported that MTSES exposure did not appear to change
Q170C turnover. However, the present investigation,
performed with oocytes of significantly higher Q170C
expression, clearly demonstrates that Q170C turnover is,
indeed, substantially reduced. In fact, after reaction with
MTSES, the Q170C turnover is approximately less than one-
fourth that of wt rSGLT1 (wt turnover ¼ 22.86 0.5 s�1). Of
interest, the reduction in turnover, due to MTSES, can be
reversed by exposure to DTT. In two different oocytes, pre-
MTSES exposure turnover averaged 11.8 s�1; after MTSES,
turnover was reduced to 3.4 s�1; and after 10 min exposure
to 10 mM DTT, the turnover was measured at 13.4 s�1.
These estimates of turnover are calculated using direct
measurements of Imax at �150 mV and Qtotal, before and
after exposure to MTSES. In the equation for turnover, the
total Q serves as an estimate of the number of cotransporters,
N, expressed at the oocyte surface (Eq. 3a). However, as
noted in previous sections, the measured total Q, post-
MTSES, is an underestimate because of incomplete charge
recovery. We note that exposure to 1 mM MTSES causes
a 70% reduction in Imax. Since N, the number of transporters,
is in fact unchanged, and z, the net charge transported per
cycle (i.e., 2), is likewise the same, the turnover is, in fact,
proportional to Imax (Eq. 3b).
We sought to corroborate this measurement using the
COS-7 cell system transiently transfected with Q170C. The
maximal velocity (Vmax) of [14C]aMG uptake at 10 mM
aMG concentration, pre- and post-MTSES exposure, was
determined and the ratio was calculated to be;2.6. Since the
number of Q170C transporters at the surface, as measured by
phloridzin binding in COS-7 cells, was the same pre- and
post-MTSES, the ratio of Vmax pre- and post-MTSES should
be a reliable measure of turnover number under the same
conditions. The COS-7 cell measurements suggest that the
turnover of Q170C has been reduced, post-MTSES expo-
sure, by ;80%. The COS-7 cell measurements, therefore,
represent independent confirmation that the post-MTSES
turnover is proportional to Imax, i.e., at least ;60–70%
reduced. In summary, the glutamine-to-cysteine mutation at
the 170 position reduces the cotransporter turnover by
;50%, and treatment with MTSES further reduces the
Q170C turnover time by another 60–70%, so that Q170C
post-MTSES is more than fourfold slower than wt SGLT1.
The effects of glutamine-to-alanine andglutamine-to-glutamate mutations at 170
To corroborate the observed effects of Q170C and Q170C
post-MTSES on SGLT1 function, the presteady-state
parameters of Q170A and Q170E rSGLT1 were examined.
Q170A was examined to probe neutrality, for comparison
with Q170C; Q170E was employed to investigate the effects
of negative charge, for comparison with MTSES-reacted
Q170C. The mean Q(Vt) curves for Q170A and Q170E were
normalized and fitted with the Boltzmann relation. The data
for Q170A and Q170E are presented with those of wt and
Q170C (Fig. 12, Table 1).
The mean Q(Vt) curve and the fitted Boltzmann relation of
Q170A closely mirror those of Q170C (Fig. 12). As pre-
sented in Table 1, the various presteady-state parameters of
Q170C and Q170A are equivalent. The Qdep/Qmax values of
Q170C and Q170A are 786 4% (n¼ 11) and 806 3% (n¼3), respectively. As with Q170C, the Q170A Qdep/Qmax
FIGURE 12 Comparison of the mean charge (Q) versus potential (Vt)
curves, and the calculated two-state Boltzmann relations, of Q170C, Q170A,
Q170E, and wt rSGLT1. The Q(Vt) curves of Q170C, Q170A, Q170E, and
wt were normalized and zeroed, then the mean charge and SD were
calculated for each Vt. The mean charge and SD values were plotted versus
Vt. Each curve was then fitted with a two-state Boltzmann relation. All
curves were acquired with 100 mM Na1. The Q170C mean Q(Vt) curve
represents 11 oocytes; the Q170A mean Q(Vt) curve represents three
oocytes; the Q170E mean Q(Vt) curve represents four oocytes; and the wt
mean Q(Vt) curve represents five oocytes.
306 Huntley et al.
Biophysical Journal 87(1) 295–310
value is significantly different from the wt value ( p, 0.01).
The Qdep/Qmax values of Q170C and Q170A indicate
comparable cotransporter conformational distributions at
Vh ¼ �50 mV, with a greater proportion of transporters at
the inside-facing conformation, compared to wt. The V0.5
value for the Q170C Boltzmann is �13.8 6 5.5 mV (n ¼11), versus the V0.5 value for Q170A of �12.8 6 4.2 mV
(n ¼ 3), verifying an equivalent voltage sensitivity. Finally,
the z-values of the two mutants are comparable: Q170C z ¼1.08 6 0.11, versus Q170A z ¼ 0.98 6 0.14 (Table 1).
Neutrality at 170, therefore, appears to exert significant
influence on empty carrier kinetics.
The Q(Vt) curve of Q170E demonstrates saturation in
the hyperpolarizing region (Fig. 12), therefore a Boltzmann
relation can be fitted to the data and the appropriate
parameters can be derived (Table 1). Although a direct
comparison cannot be drawn to Q170C post-MTSES,
Q170E offers insight into the effects of a negative charge
at 170. As displayed in Table 1, the Q170E Qdep/Qmax is
92 6 1%, which is significantly different from the wt value
of 86 6 2% ( p ¼ 0.0005). The Q170E mutation, therefore,
elicits a cotransporter conformational distribution with
a greater number of cotransporters at the outside-facingconformation, compared to wt, at Vh ¼ �50 mV. This
greater Q170E Qdep contribution, compared to wt, is
opposite to the trend of the neutral mutants Q170C and
Q170A. The Q170E Q(Vt) curve and fitted Boltzmann
relation show a shift of V0.5 to positive potentials with a mean
value of 25.1 6 2.6 mV (n ¼ 4). The negative charge of the
glutamate does not have a significant effect upon the z (Table1). Qhyp saturation and an unchanged z-value suggest that
the Q170E mutation has very little effect upon the charge
exhibits a Q(Vt) curve shifted to a negative potential, the
presence of a negative glutamate shifts the Q(Vt) curve to
a significantly positive potential. This positive shift suggests
an increased Na1 affinity.
The carrier turnover values were calculated for the Q170A
and Q170E rSLGT1 mutants. The turnover value for Q170A
was calculated to be 9.6 s�1 (n ¼ 1) and the turnover for
Q170E is 11.6 6 2.5 s�1 (n ¼ 4). This is comparable to the
reduction in turnover observed for Q170C (11.2 6 1.7 s�1
(n ¼ 7)). Interestingly, the reduction in turnover, elicited by
the Q170E mutation, is not as great as the reduction in turn-
over observed for MTSES-reacted Q170C. Therefore, al-
though replacement of polarity at 170 with neutrality or
negative charge serves to significantly reduce turnover, the
structure of the side chain bearing the negative charge ap-
pears to modify the extent of turnover reduction.
DISCUSSION
The rationale for exploring the functional characteristics of
Q170C in greater depth was to explain its anomalous
behavior relative to the cysteine mutants of adjacent residues
163, 166, and 173, which together, form part of the Na1
binding and voltage-sensing domain of rSGLT1 (Lo and
Silverman, 1998a,b).
Charge specificity of chemical modification by MTS
sulfhydryl reagents is one characteristic that distinguishes
Q170C from the other loop mutants. For A166C (Lo and
Silverman, 1998a,b) and for F163C and L173C (M.
Silverman, unpublished data), the anionic MTS derivative,
MTSES, reacts with the cysteine at the mutated position, but
does not affect transport—whereas the cationic MTSEA
markedly alters transport activity (Lo and Silverman,
1998a,b). The opposite is true for Q170C; both MTSEA
and MTSET react with the cysteine at the 170 position and
block MTSES, yet neither has functional consequence. This
charge specificity perhaps indicates that the loop region has
a complexity beyond the primary structure, with an intricate
tertiary structure.
These studies, as well as previous studies by Lo and
Silverman (1998a,b) demonstrated that the MTS compounds
do not alter wt rSGLT1 function. It is, therefore, reasonable
to assume that the effects of these MTS reagents are due
to reaction with the exogenous cysteines introduced in the
various mutants. In the present investigation, there remains
a legitimate question concerning the mechanism of MTSET
and MTSEA protection against Q170C exposure to MTSES.
Two scenarios for protection are possible. The first mech-
anism of observed MTSET and MTSEA protection against
MTSES exposure involves binding of the MTSEA and
MTSETwith the cysteine at the 170 position, thereby directly
blocking MTSES reaction. A possible second mechanism
could involve the limiting of MTSES accessibility to the
170 position, through an indirect conformational change oc-
curring in response to MTSET or MTSEA reacting with one
or more of the native cysteines, putatively located in an
extracellular position (i.e., C255, C345, C351, C355, and
C361). Although such indirect effects might be attributable
to MTSEA protection, MTSET is membrane-impermeant
and therefore would be expected to interact with both native
extracellular cysteines as well as with the extracellular
cysteine introduced at the 170 position. We conclude that it
is the presence of a negative ethylsulfonate group at the 170
position, arising out of reaction with MTSES, that causes
altered function of the chemically modified Q170C.
Even more intriguing are the marked qualitative differ-
ences in function that occur in Q170C after exposure to MTS
reagents compared to A166C, F163C, and L173C. We have
previously shown that exposure to MTSEA shifts the V0.5 of
each of the single cysteine mutants F163C, A166C, and
L173C to negative potentials (Lo and Silverman, 1998a,b).
Further, progressively greater negative shifts in potential are
observed for the combination of double- and triple-cysteine
mutants created at these three positions (Lo and Silverman,
1998a). Moreover, Qmax under these conditions remains
constant (Lo and Silverman, 1998a). This behavior (i.e., shift
of V0.5 to more negative potentials with no change in Qmax)
Q170 of rSGLT1 Regulates Charge Transfer 307
Biophysical Journal 87(1) 295–310
mimics the effect of progressively lowering the external Na1
concentration (Lo and Silverman, 1998a). Collectively, these
results lead us to conclude that 163, 166, and 173 together
form part of the Na1 binding and voltage-sensing domain of
rSGLT1.
In contrast to the observed V0.5 shift to negative potentials
described above with no change inQmax, exposure of Q170C
to MTSES produces almost the opposite results—i.e.,
a substantial decrease in measured charge transfer over the
voltage range from �150 to 190 mV, which precludes an
accurate derivation of Boltzmann parameters, such as V0.5.
The results of this study provide new insights into the
conformational states and transitions that underlie rSGLT1
function. This conclusion is based on several behavioral
characteristics of Q170C compared to wt rSGLT1:
1. In general, the relative magnitudes of charge transferred
at hyperpolarizing pulses, Qhyp, and depolarizing pulses,
Qdep, to the total charge transferred, Qmax, reflect
cotransporter conformational state distribution at the
holding potential, Vh. Our data show that for Q170C,
depolarizing pulses contribute less charge to Qmax than
do depolarizing pulses to wt rSGLT1 Qmax. This reduced
Qdep indicates that at steady state, fewer Q170C trans-
porters are in the outside-facing, Na1 bound state, and
more are redistributed among the other conformational
states. Thus replacement of the polar glutamine, with
a relatively nonpolar and bulky cysteine, serves to drive
the Q170C equilibrium, at Vh ¼ �50 mV, toward the
inside-facing conformation.
2. Lower [Na1] should favor a distribution of cotransporters
toward inside-facing conformation, resulting in a reduced
Qdep. As expected, our experiments (Figs. 5 and 6 A) showthat reduced Na1 concentrations proportionately decrease
the Qdep region of Q170C. However, if carrier reorienta-
tion to the outside is unaffected by the mutation, we would
expect that any loss of Qdep would be regained in the Qhyp
region. This would manifest as a negative shift in the
Boltzmann relation along the y axis leading to a substantialincrease in charge transfer at hyperpolarizing voltages.
This is precisely what is observed for wt at 10 mM Na1
(Fig. 6 B). The fact that this is not observed in the case
of Q170C (Fig. 6 A), where reduced [Na1] results in
a preferential reduction in Qdep, implies that empty carrier
reorientation to the outside-facing conformation is
significantly retarded for Q170C, compared to wt SGLT1.
3. Exposure to 1 mM MTSES reduces the Q(Vt) curves of
Q170C, via a preferential effect upon the Qdep. But after
reaction with MTSES, there is no increase in charge
transfer at hyperpolarizing potentials. It is noteworthy
that the effect of MTSES on Q170C mimics that of
decreasing [Na1]—i.e., both appear to reduce the total
charge transferred. However, since KNa of Q170C is
unchanged, the implication is that addition of an anionic
ethylsulfonate at the 170 position affects a potential
dependent transition of empty (non-Na1-bound) carrier.
This once again argues for a steady-state cotransporter
distribution, which favors maintenance of the inward-
facing conformation and further suggests that anionic
charge at the 170 position enhances this localization.
4. The most profound effect of a change of polarity and
charge at the 170 position in rSGLT1 is the reduction in
transporter turnover number. The enhanced expression
levels, which we were able to achieve in the present
study, by coinjection of the Q170C cDNA together with
plasmid-bearing mouse T-antigen, have allowed us to
carry out more quantitative evaluation than we were able
to accomplish in our earlier investigations of Q170C
function (Lo and Silverman, 1998a). Our new findings
convincingly demonstrate that replacement of glutamine
with cysteine at 170 causes a reduction in turnover by
a factor of 2 compared to wt rSGLT1. Also, reaction of
Q170C with MTSES produces a further decrease of
.50% in turnover. Therefore, MTSES-reacted Q170C
exhibits a turnover, which is more than four times slower
than wt rSGLT1.
Many of the observed effects of altered polarity and charge
at the 170 residue, elicited with the Q170C mutation and
subsequent reaction with MTSES, were confirmed with
Q170A (neutral) and Q170E (anionic) mutations.
The glutamine-to-alanine mutation generated Q(Vt) curves
that correspond closely to those of Q170C. Q170A and
Q170C have comparable V0.5 values, Qdep/Qmax values, and
turnover numbers, which are reduced in both mutations by
;50%, compared to wt.
The glutamine-to-glutamate mutation, Q170E, had in-
teresting consequences on presteady-state behavior. There
was a substantial positive shift in the V0.5 of the Boltzmann
relation,with little change in z compared towt. Taken together
with the shift in V0.5 to negative voltages observed for Q170A
and Q170C, without a significant change in z (Table 1), theimplication is that change in polarity and charge at position
170 affects theNa1-binding and voltage-sensing properties of
the transporter. This behavior is similar but opposite to that
described for the F163C, A166C, and L173C single, double,
and triple mutants reacted with cationic MTSEA (Lo and
Silverman, 1998a,b). A positive charge on residues at the 163,
166, and 173 positions inhibits Na1 binding (negative charge
has no effect), a negative charge at position 170 increasesNa1
binding, but a positive charge (i.e., reaction with MTSEA or
MTSET) has no effect. The statistically significant increase in
Qdep/Qmax observed for Q170E, implies a greater distribution
of cotransporters in an outside-facing conformation, com-
pared to wt at Vh ¼ �50 mV, also consistent with increased
binding affinity for Na1. Collectively, these data suggest that
the glutamine at position 170 lies in the Na1 permeation
pathway. Another observation, which implicates a Na1
permeation pathway localization of 170, is the fact that
anionic MTSES reduces the Q170C Na1 leak.
308 Huntley et al.
Biophysical Journal 87(1) 295–310
Lo and Silverman previously demonstrated that replacement
of an alaninewith a cysteine at 166 effects a;50% reduction in
turnover number (Lo and Silverman, 1998b). Although the
cysteine mutation at 166 mimics the effects of cysteine
mutation at 170, the mutation does not duplicate the shift in
residue polarity; i.e., alanine to cysteine is a neutral to neutral
mutation, unlike glutamine to cysteine, which is polar to
neutral. Further, a charge-dependent effect on A166C turnover
number was observed, which is opposite to that found for 170.
Specifically, a positive point charge at 170 has no effect, but
a negative point charge significantly reduces substrate
turnover. For the 166 cysteine mutant, a positive ethylamine
group causes a significant reduction in turnover. Therefore,
althoughmutations at both the 166 and 170 positions influence
empty carrier kinetics and participate in Na1 interaction,
a border exists there that delineates charge specificity.
Just as a precise spatial organization appears to exist in the
loop region, from 163 to 173, with two regions delineated
with a border of charge specificity, there also appears to be an
emerging spatial organization to the more immediate
environment surrounding Q170. This Q170 spatial organiza-
tion is made evident by the differential effects of Q170C,
Q170A, Q170E, and Q170C after exposure to MTSES.
Replacement of polarity with neutrality, via the Q170C and
Q170Amutations, caused a substantial and equivalent change
in voltage sensitivity and a reduction in turnover number.
Neither MTSEA- nor MTSET-reacted Q170 had an effect
upon cotransporter function; therefore a positive charge is
benign. However, a negative charge, as observedwith Q170C
post-MTSES and Q170E, generated a profound reduction in
turnover number. Although the turnover trend was similar,
what was particularly informative was the differential effect
that Q170C post-MTSES and Q170E had upon function. The
negative charge of Q170E caused a reduction in turnover,
equivalent to Q170C and Q170A. After MTSES exposure,
Q170C caused a reduction in turnover that was approximately
twofold greater than Q170C, Q170A, and Q170E. This
difference in turnover reduction could be due to two different
mechanisms. The first involves the degree to which the
negative charge can extend out from the cotransporter
backbone. In this case, the negative charge of the ethyl-
sulfonate group likely has a greater radius of mobility than the
negative charge of the glutamic acid. Perhaps the ethyl-
sulfonate is able to move closer to a critical area in the three-
dimensional Q170 region. Another possible mechanism
involves a modifying effect by the polar disulfide bond of
the MTS-reacted Q170C upon the negative charge of the
ethylsulfonate. Either scenario indicates a charge-specific
spatial sensitivity in the immediate Q170 environment.
The Q170E mutant yielded valuable insights. For Q170E,
z is not significantly different from that of wt or Q170C. Since
the apparent valence represents the formal charge moved
through the electric field of the membrane, the fact that an
added negative charge at 170 is without significant
consequence upon z, suggests that the 170 position moves
very little during cotransporter charge transfer. Perhaps this
indicates that the residue at 170 influences charge transfer
and turnover by serving as a hinge or a gate that moves very
little during function. The finding that MTSET reacts with the
cysteine at Q170C but has no effect demonstrates that steric
hindrance is insufficient to explain the effects. Unfortunately,
a direct comparison cannot be drawn between the V0.5 values
of Q170C post-MTSES and Q170E, because of our inability
to fit a Boltzmann relation to MTSES-reacted Q170C.
Nevertheless, what is clear is that rather than an effect on
Na1 binding, reaction of Q170CwithMTSES has a profound
effect on charge transfer. Thus the Q170C post-MTSES
effects also point to position 170 being located in the vicinity
of a segment with the properties of a voltage sensor.
The Qdep/Qmax values of the investigated Q170 mutants
offer insight into empty carrier kinetics. The two neutral
mutants, Q170C and Q170A, exhibit a significant decrease
in Qdep contribution compared to wt rSGLT1. The negative
mutant Q170E, however, shows a significant increase inQdep
compared to wt. This suggests that cotransporter distribution
is influenced by polarity and charge at 170. Neutrality drives
cotransporter distribution toward inside facing. Moreover,
the Na1 dependence of the Q170C Qdep contribution to total
charge transferred, Qtotal, implies that once at the inside-
facing conformation, cotransporters do not easily move back
to outside-facing conformation. Q170E results indicate that
negative charge causes a cotransporter redistribution to
outside facing. Thus polarity and charge affect the carrier
distribution and reorientation, which is reflected in the
reduced turnover values of Q170C, Q170C post-MTSES,
Q170A, and Q170E.
A final consideration, concerning the reduced turnover
number, involves the aspect of the rate-limiting step.
Collectively, our findings imply that modification of charge
and polarity at the 170 position in rSGLT1 has a profound
effect on certain rate-limiting step(s) in cotransporter
function. In an attempt to localize the transition state(s) that
are being affected by the mutation at the 170 position,
we sought to compare the presteady-state behavior of wt
rSGLT1 with that of Q170C and with Q170C reacted with
MTSES. The transient currents of Q170C rSGLT1 clearly
possess multiorder exponential decay, a characteristic also
demonstrated by the transient currents of wt hSGLT1 (Chen
et al., 1996) and wt rSGLT1 (Krofchick and Silverman,
2003). Q170C transient currents are well resolved with third-
order exponential decay, for Vt values from �30 mV to 90
mV.Third-order exponential decay, appliedwithin this exper-
imental range, consistently generates three decay constants
that closely correspond to those of wt rSGLT1 (Krofchick
and Silverman, 2003). Both Q170C and wt rSGLT1 have
a slow decay (voltage-dependent, ts ¼ ;10–40 ms), a
medium decay (voltage-dependent, tm ¼ ;1.5–6 ms), and
a fast decay (voltage-independent, tf ¼ ;0.5–1.5 ms).
Chen and co-workers, in 1996, reported two decay
components for hSGLT1, even with zero trans Na1, and
Q170 of rSGLT1 Regulates Charge Transfer 309
Biophysical Journal 87(1) 295–310
attributed both decay components to empty carrier transitions.
The Na1 and voltage dependencies of Q170C rSGLT1 ts andtf are very similar to those reported by Chen’s group for wt
hSGLT1 (Chen et al., 1996), and Krofchick and Silverman
(2003) for wt rSGLT1. The voltage dependence of the slow
decay of Q170C exhibits a sigmoidal shape, very similar to the
sigmoidal shapes of the voltage dependencies of the slow
decays of wt hSGLT1 (Chen et al., 1996) and wt rSGLT1
(Krofchick and Silverman, 2003). The magnitude of the fast
decay component of Q170C, as well as its voltage-inde-
pendence, is also very similar to the fast decay components of
wt hSGLT1 (Chen et al., 1996) and wt rSGLT1 (Krofchick
and Silverman, 2003). The Na1 and voltage-dependent data of
Q170C rSGLT1 and wt rSGLT1 ts and tf, therefore, suggestthat these transitions correspond to the empty carrier
transitions of wt hSGLT1, determined by Chen et al. (1996).
A plausible candidate for the rate-limiting step of SGLT1 is
the slow transition (Fig. 1 B) C25 C3. Although the Q170C
mutation reduces turnover number by;50% compared to wt,
there is no change in any of the decay constants, including ts.Similarly, analysis of the time constants after reaction of
Q170C with MTSES also shows no significant change
compared to pre-MTSES or wt values. We conclude that
altered polarity and charge at the 170 glutamine position of
rSGLT1 affect a cotransporter conformational transition; this
is rate-limiting but probably not associated with reorientation
of empty carrier (i.e., the affected transition is not accounted
for by any of the transitions depicted in Fig. 1 B). Thisconclusion is consistent with the proposal of Parent and co-
workers, who suggested that the rate-limiting step of hSGLT1
is the Na1 binding/debinding event of the inside-facing
conformations (Parent et al., 1992b). This latter transition is
excluded from the four-state system depicted in Fig. 1 B, andwould not contribute to the decay components of the transient
currents. If the inside-facing Na1 binding/debinding transi-
tion is indeed the rate-limiting step, this might explain why
the Q170C mutation and the exposure of Q170C to MTSES
causes a reduction in turnover and a tendency toward
occupancy of inside-facing conformation.
On the basis of this study, we conclude that the glutamine
at 170 is of profound importance to rSGLT1 function.
Further investigations into the Q170 residue and the region
adjacent, should provide greater insight into the behavior of
the Na1/glucose cotransporter.
The authors acknowledge R. Reithmeier, D. Clarke, P. Backx, R. Tsushima,
and V. Khutorsky for helpful discussion.
This work was supported by a grant to M. Silverman (FRN-15267) as part
of the Canadian Institutes of Health Research Group in Membrane Biology
(FRN-25026).
REFERENCES
Chen, X. K., M. J. Coady, and J. Y. Lapointe. 1996. Fast voltageclamp discloses a new component of presteady-state currents from theNa1-glucose cotransporter. Biophys. J. 71:2544–2552.
Costa, A. C. S., J. W. Patrick, and J. A. Dani. 1994. Improved technique forstudying ion channels expressed in Xenopus oocytes, including fastsuperfusion. Biophys. J. 67:395–401.
Hediger, M. A., M. J. Coady, T. S. Ikeda, and E. M. Wright. 1987.Expression cloning and cDNA sequencing of the Na1/glucosecotransporter. Nature. 330:379–381.
Krofchick, D., and M. Silverman. 2003. Investigating the conformationalstates of the rabbit Na1/glucose cotransporter. Biophys. J. 84:3690–3702.
Lo, B., and M. Silverman. 1998a. Cysteine scanning mutagenesis of the seg-ment between putative transmembrane helices IV andV of the high affinityNa1/glucose cotransporter SGLT1. J. Biol. Chem. 273:29341–29351.
Lo, B., and M. Silverman. 1998b. Replacement of Ala-166 with cysteine inthe high affinity rabbit sodium/glucose transporter alters transportkinetics and allows methanethiosulfonate ethylamine to inhibit trans-porter function. J. Biol. Chem. 273:903–909.
Loo, D. D., A. Hazama, S. Supplisson, E. Turk, and E. M. Wright. 1993.Relaxation kinetics of the Na1/glucose cotransporter. Proc. Natl. Acad.Sci. USA. 90:5767–5771.
Panayotova-Heiermann,M., S. Eskandari,E.Turk,G.A.Zampighi, andE.M.Wright. 1997. Five transmembrane helices form the sugar pathway throughthe Na1/glucose cotransporter. J. Biol. Chem. 272:20324–20327.
Panayotova-Heiermann, M., D. D. Loo, C. T. Kong, J. E. Lever, and E. M.Wright. 1996. Sugar binding to Na1/glucose cotransporters is determinedby the carboxyl-terminal half of the protein. J. Biol. Chem. 271:10029–10034.
Panayotova-Heiermann, M., D. D. Loo, M. P. Lostao, and E. M. Wright.1994. Sodium/D-glucose cotransporter charge movements involve polarresidues. J. Biol. Chem. 269:21016–21020.
Parent, L., S. Supplisson, D. D. Loo, and E. M. Wright. 1992a. Electrogenicproperties of the cloned Na1/glucose cotransporter. I. Voltage-clampstudies. J. Membr. Biol. 125:49–62.
Parent, L., S. Supplisson, D. D. F. Loo, and E. M. Wright. 1992b.Electrogenic properties of the cloned Na1/glucose cotransporter. II. Atransport model under nonrapid equilibrium conditions. J. Membr. Biol.125:63–79.
Taglialatela, M., L. Toro, and E. Stefani. 1992. Novel voltage clamp torecord small, fast currents from ion channels expressed in Xenopusoocytes. Biophys. J. 61:78–82.
Vayro, S., B. Lo, and M. Silverman. 1998. Functional studies of the rabbitintestinal Na1/glucose carrier (SGLT1) expressed in COS-7 cells:evaluation of the mutant A166C indicates this region is important forNa1-activation of the carrier. Biochem. J. 332:119–125.
Zampighi, G. A., M. Kreman, K. J. Boorer, D. D. Loo, F. Bezanilla, G.Chandy, J. E. Hall, and E. M. Wright. 1995. A method for determiningthe unitary functional capacity of cloned channels and transportersexpressed in Xenopus laevis oocytes. J. Membr. Biol. 148:65–78.