

Position 170 of Rabbit Na1/Glucose Cotransporter (rSGLT1) Lies in theNa1 Pathway; Modulation of Polarity/Charge at this Site RegulatesCharge Transfer and Carrier Turnover
Steven A. Huntley, Daniel Krofchick, and Mel SilvermanDepartment of Medicine, University of Toronto, Toronto, Ontario, Canada
ABSTRACT Positions 163, 166, and 173, within the putative external loop joining transmembrane segments IV and V of rabbitNa1/glucose cotransporter, form part of its Na1 interaction and voltage-sensing domain. Since a Q170C mutation within thisregion exhibits anomalous behavior, its function was further investigated. We used Xenopus oocytes coinjected with mouseT-antigen to enhance Q170C expression, and the two-microelectrode voltage-clamp technique. For Q170C, a-methylD-glucopyranoside, phloridzin, and Na1 affinity values are equivalent to those of wild-type; but turnover is reduced ;50%.Decreased [Na1] reduces Q170C, but not wild-type, charge transfer. Q170C presteady-state currents exhibit three timeconstants, t, identical to wild-type. MTSES decreases maximal a-methyl D-glucopyranoside-induced currents by ;64% andNa1 leak by ;55%; phloridzin and Na1 affinity are unchanged. MTSES also reduces charge transfer (dithiothreitol-reversible)and Q170C turnover by;60–70%. MTSEA and MTSET protect against MTSES, but neither affect Q170C function. MTSES hasno obvious effect on the t-values. Q170A behaves the same as Q170C. The mutation Q170E affects voltage sensitivity andreduces turnover, but also appears to influence Na1 interaction. We conclude that 1), glutamine 170 lies in the Na1 pathway inrabbit Na1/glucose cotransporter and 2), altered polarity and charge at position 170 affect a cotransporter conformational stateand transition, which is rate-limiting, but probably not associated with empty carrier reorientation.
INTRODUCTION
The rabbit intestinal Na1/glucose carrier (rSGLT1) is the first
Na1 cotransporter to have been cloned (Hediger et al., 1987),
and serves as an excellent model system to explore the
mechanisms of ion-coupled transport. The expression of
cloned SGLT1 in Xenopus oocytes and the use of the two-
microelectrode voltage-clamp technique have been particu-
larly informative. Steady-state, sugar-induced inward Na1
currents of the cotransporter yield affinity values for Na1, and
sugar substrate, as well as estimates of substrate coupling
stoichiometry (Chen et al., 1996; Parent et al., 1992a).
Presteady-state current traces, acquired in the presence ofNa1
(but not sugar substrate), are inhibited with either excess
sugar, or the inhibitor phloridzin (pz). These current traces
contain information about transition states involved in Na1
binding/debinding, and reorientation of empty carrier across
the membrane (Loo et al., 1993; Zampighi et al., 1995). The
presteady-state currents are attributed to movement of Na1
within the electric field of the membrane, and movement of
charged residues of the empty cotransporter as it undergoes
conformational transitions (Loo et al., 1993). The simplest
model that has been proposed, as illustrated in Fig. 1 A,consists of two outward-facing conformational states: one
with boundNa1, state 1, and one without Na1, state 2; and aninward-facing conformational state of empty carrier, state 3.According to this three-state model, there are two transitions,
one involving Na1 binding/debinding, and another involving
reorientation of the empty cotransporter between outward-
and inward-facing conformations. However, using the cut-
open oocyte technique (Costa et al., 1994; Taglialatela et al.,
1992), Chen et al. (1996) documented the existence of
two distinct transitions of human SGLT1 (hSGLT1) in the
complete absence of Na1, implying that reorientation of
empty carrier from outside to inside takes place in two steps
rather than one. This evidence led to the revised four-state
model, illustrated in Fig. 1 B.Recently, Krofchick and Silverman (2003) performed
a detailed analysis of rSGLT1 OFF currents. Using this
experimental approach, complemented by computer simula-
tion studies, the transient currents were characterized by
a third-order exponential decay, yielding three time con-
stants, thus supporting the four-state model. Although there
now appears to be sufficient evidence that the number of
Submitted January 18, 2004, and accepted for publication April 5, 2004.
Address reprint requests toMel Silverman,Medical Sciences Building, Room
7205, 1 King’s College Circle, Toronto, ON, M5S 1A8, Canada. Tel.:
416-978-7189; Fax: 416-971-2132; E-mail: [email protected].
Abbreviations used: aMG, a-methyl D-glucopyranoside; DTT, dithiothrei-
tol; hSGLT1, human SGLT1; Imax, maximal substrate-induced current; k,
turnover number; KD, phloridzin affinity constant; KM, substrate affinity
constant; KNa, Na1 affinity constant; MTS, methanethiosulfonate; MTSEA,
(2-aminoethyl)methanethiosulfonate hydrobromide; MTSES,
Na1(2-sulfonatoethyl)methanethiosulfonate; MTSET, [2-(trimethylammo-
nium)ethyl]methanethiosulfonate bromide; n, Hill coefficient; pz, phlor-
idzin; Qdep, charge due to depolarizing pulses; Qhyp, charge due to
hyperpolarizing pulses; Qmax, the maximum charge transferred as
calculated with the two-state Boltzmann relation; Qtotal, the maximum
charge transferred; rSGLT1, rabbit SGLT1; SGLT1, high affinity Na1/
glucose cotransporter; wt SGLT1, wild-type SGLT1; t, decay constant; ts,
slow decay constant; tm, medium decay constant; tf, fast decay constant;
TM, transmembrane segment; V0.5, potential at which charge transfer is half
complete; Vh, holding potential; Vt, test potential; z, steady-state valence;
zapp, apparent valence of charge movement.
� 2004 by the Biophysical Society
0006-3495/04/07/295/16 $2.00 doi: 10.1529/biophysj.104.040253
Biophysical Journal Volume 87 July 2004 295–310 295

transitions associated with the presteady-state currents of
SGLT1 is greater than originally assumed (Loo et al., 1993),
the region(s) of the cotransporter that are implicated in these
transitions remains unknown.
Site-directed mutagenesis, as well as comparison of the
functional behavior of wt SGLT1 from different species,
have helped identify amino acids of functional importance in
the Na1/sugar cotransport (Panayotova-Heiermann et al.,
1994). Moreover, the C-terminal half of the transporter,
specifically the region involving transmembrane segments
(TMs) X–XIII, has been implicated in sugar permeation
(Panayotova-Heiermann et al., 1997, 1996). Several years
ago, our laboratory began to use cysteine-scanning muta-
genesis and the substituted cysteine accessibility method as
a strategy to identify functional domains of rSGLT1. The
studies determined that a region localized to the putative loop
joining TMs IV and V is involved in the Na1 binding and
voltage-sensing properties of rSGLT1, particularly residues
163, 166, and 173 (Lo and Silverman, 1998a,b; Vayro et al.,
1998). Further, the 166 residue was demonstrated to in-
fluence empty carrier kinetics (Lo and Silverman, 1998b).
However, in this same region, one loop mutant, Q170C,
displayed unique functional behavioral characteristics com-
pared to F163C, A166C, and L173C. For example, whereas
F163C, A166C, and L173C were each inhibited by reaction
with the cationic MTS derivative 2-aminoethyl methane-
thiosulfonate (MTSEA) but not MTSES (Lo and Silverman,
1998a), Q170C was inhibited by reaction with MTSES, but
not MTSEA. Moreover, MTSES reaction with Q170C
appeared to affect charge transfer rather than Na1 binding.
Complete characterization of Q170C was limited in our
earlier studies by the fact that measured charge transfer in the
presence of MTSES was too low to permit quantitative
evaluation of this phenomenon. To overcome this difficulty,
we coinjected mouse T-antigen along with Q170C cDNA,
and obtained 2.5-fold-enhanced expression of Q170C
compared to the cDNA injection protocol used previously.
The improved Q170C levels of expression were comparable
to those of wt rSGLT1, therefore altered transporter function
due to overexpression is unlikely. Using this approach we
undertook a thorough examination of all steady-state and
presteady-state parameters to extend our earlier work on
Q170C, and achieve a comprehensive functional character-
ization. In the present study we confirm our earlier finding
(Lo and Silverman, 1998a), that the glutamine-to-cysteine
mutation at position 170 exerts little influence over the
cotransporter’s affinity for Na1, aMG, or phloridzin.
However, our new data show that the mutation reduces
cotransporter turnover by 50% and elicits profound changes
in its presteady-state behavior. Furthermore, lowering
external [Na1] progressively decreases charge transfer of
Q170C at depolarizing potentials, without proportionately
increasing charge transfer at hyperpolarizing potentials. By
comparison, for wt rSGLT1, reducing external [Na1] shifts
the V0.5 of the Boltzmann without affecting total charge
transferred. This suggests that the mutation has altered some
rate-limiting transition step(s). When analyzed using the new
OFF current protocol (Krofchick and Silverman, 2003),
Q170C presteady-state currents demonstrate a third-order,
rather than a single-order, exponential decay—characterized
by three time constants, ts (slow), tm (medium), and tf (fast),with similar values to that documented for wt rSGLT1
(Krofchick and Silverman, 2003).
Taking advantage of the increased levels of Q170C
expression resulting from coinjection of mouse T-antigen
cDNA, an extensive assessment of the effects of MTSES
on steady-state and presteady-state behavior of Q170C was
performed. Introduction of the negatively charged ethyl-
sulfonate at residue 170, after reaction with anionic MTSES,
causes marked reduction in steady-state sugar-induced
inward Na1 currents, without affecting Na1 or sugar
substrate affinity. In contrast, chemical modification of
Q170C with either cationic MTSEA or membrane imper-
meant MTSET does not alter transporter function. However,
exposure to MTSEA or MTSET blocks the effects of anionic
MTSES. MTSES also significantly reduces the Q170C Na1
leak. After reaction with MTSES there is a marked reduction
of charge transfer at depolarizing potentials that is not
recovered at hyperpolarizing voltages—similar to observa-
tions for Q170C when the Na1 concentration is reduced by
a factor of 10. Previously, it was reported that MTSES has
FIGURE 1 The state models of SGLT1 in the absence of sugar substrate.
(A) Three-state system. The model is comprised of two outside-facing
conformations, one with bound Na1 (CNa1 state) and one without (C state),
and an inside-facing conformation (C# state). Three states necessarily have
two transitions, a Na1 binding/debinding transition involving either one
ion or two simultaneous ions, CNa1 5 C, and an empty carrier transition,
C 5 C#. (B) Four-state system. Model proposed by Chen et al. (1996)
for hSGLT1, which introduced an intermediate empty carrier conforma-
tional state, C3. Consequently, reorientation of empty carrier from inside fac-
ing to outside facing occurs with two transitions, C2 5 C3, C3 5 C4. The
rate constants for the transitions are displayed.
296 Huntley et al.
Biophysical Journal 87(1) 295–310

little effect on Q170C turnover (Lo and Silverman, 1998a);
however, these earlier studies were made difficult by the fact
that in the presence of MTSES, the Q170C currents are
reduced to low levels, thereby compromising measurement
accuracy. By taking advantage of enhanced expression
achieved through coinjection of T-antigen, we now show
that reaction with MTSES causes a 60–70% reduction in
Q170C turnover. Thus, Q170C reacted with MTSES has
a turnover number which is less than one-fourth of wt
rSGLT1 turnover. Interestingly, although charge transfer is
significantly retarded after MTSES exposure, the observed
values for the three t-measurements, which characterize
Q170C presteady-state behavior, are not obviously changed.
Q170A and Q170E rSGLT1 mutants were employed to
add further evidence that polarity and charge at the 170
residue affect transporter turnover. Presteady-state experi-
ments revealed that Q170A behaves almost identically with
Q170C, and also exhibits reduced turnover. Q170E, on the
other hand, appears to have a similar but less pronounced
effect compared to Q170C post-MTSES—voltage sensitivity
was affected, and turnover reduced, but not to the same
extent as with MTSES. Q170E also provided the first
evidence of Na1 interaction at position 170.
It therefore appears that modulation of polarity and charge
at the 170 glutamine position, specifically introduction of
a negative but not positive charge, critically reduces car-
rier turnover and charge transfer, and can influence Na1
interaction. Interestingly, both the Q170C mutation, and
subsequent reaction with MTSES significantly reduce
turnover, yet neither alters the investigated time constants—
suggesting that a transporter conformational transition is
affected, which is rate-limiting but probably not associated
with transmembrane reorientation of empty carrier.
MATERIALS AND METHODS
Molecular biology
The eukaryotic expression vector pMT3 (provided by the Genetics Institute,
Boston, MA) was treated with PstI and KpnI to extract the multiple cloning
site, generating pMT4. The cDNA of rSGLT1 (provided byM. Hediger) was
subcloned into the remaining EcoRI site. The Q170C, Q170A, and Q170E
mutations were generated via the megaprimer protocol of polymerase chain
reaction mutagenesis as described previously and confirmed by sequencing
(Lo and Silverman, 1998a).
Oocyte preparation
Xenopus laevis were anesthetized in 0.2% aqueous solution of 3-amino-
benzoic acid ethyl ester. Gravid ovarian sacs were removed, then carefully
drawn to expose oocytes and allow access to solution. The oocytes were
digested for 25–60 min with 2 mg/ml of type IV collagenase (Sigma,
Oakville, ON, Canada). Collagenase was dissolved in Modified Barth’s
Saline (MBS) solution supplemented with MgCl. MBS/Mg21 consists of
0.88 mM NaCl, 1.0 mM KCl, 2.4 mM NaHCO3, 15.0 mM HEPES-NaOH,
1.0 mM MgCl2, pH 7.4. Post-harvest/digestion care involved Leibovitz
solution (Sigma) supplemented with 10 mM HEPES, 20 mg gentamycin,
and 0.184 g L-glutamine, pH 7.4 with 10 mM NaOH.
Oocyte injection
Q170C rSGLT1 cDNA was delivered to the nucleus, via the animal pole, of
the defolliculated oocytes at a concentration of 60 ng/ml. The injected oocytes
were stored at 16–18�C for four ormore days in Leibovitz solution of the same
composition as that used immediately after collagenase treatment. To enhance
expression of the rSGLT1, the rSGLT1 pMT4 plasmid was coinjected with
a plasmid bearing the mouse plasmid LFI gene for large T-antigen, middle
T-antigen, and small T-antigen at a concentration of 20 ng/ml.
Two-microelectrode voltage-clamp
Voltage-clamping and recordings were performed using a GeneClamp 500
amplifier, Digidata 1200B interface, and pClamp 6.0 data acquisition
software (Axon Instruments, Union City, CA). Oocytes were impaled with
150-mm borosilicate glass capillary tubes (World Precision Instruments,
Sarasota, FL). The capillary tubes were filled with 3 M KCl solution.
Oocytes with resting potentials more positive than �30 mV were discarded.
Eligible oocytes were constantly superfused with a voltage-clamping
solution consisting of 100 mM NaCl, 2 mM KCl, 1 mM MgCl2, 1 mM
CaCl2, and 10 mM HEPES-Tris base (pH 7.4). This voltage-clamping
solution was used for all experiments, with the exception of Na1 titrations
and certain presteady-state experiments, which examined Na1 dependence.
The rate of superfusion was;3.5 ml/min. The oocyte was held at a holding
potential, Vh, of �50 mV, then was subjected to a series of voltage test
pulses, Vt. The current responses were recorded with a sampling interval of
200 ms for steady-state experiments, 25 ms for the ramp protocol, and 20 ms
for decay analysis. The traces represent presteady-state currents generated
by the cotransporter, in response to stepping the voltage from the holding
potential of �50 mV through a range of test pulses from �150 mV to 190
mV, in 10- or 20-mV increments. The OFF currents represent the reciprocal
current responses when the voltage step is discontinued and returned to the
holding potential, �50 mV. For those experiments, which required a more
accurate measurement of charge transfer, the step function test pulse was
replaced by a 5-ms ramp (Krofchick and Silverman, 2003). The array of
ramp pulses mirrors that of the step protocol. The ramp protocol avoids
conditions of measuring apparatus saturation, which typically occurs at early
times of the step clamp, when large capacitive currents are produced. Thus,
the ramp protocol ensures complete recovery of charge transfer over the
entire range of voltages, including the extreme range of depolarizing and
hyperpolarizing potentials.
Steady-state parameters were determined with the difference in the
steady-state currents obtained before and after exposure to the substrate of
interest. Steady-state currents were acquired with test pulses of 300-ms
duration. The final 150 ms of a test pulse were selected and the average
current value of this range was acquired. The average current values were
plotted versus [substrate] and the following equation was fit to the curve,
I ¼ Imax 3 ½S�n=ð½S�n 1Kn
0:5Þ; (1)
where S is the substrate of investigation (Na1, aMG), Imax is the maximal
current induced at saturating [substrate], n is the Hill coefficient, and K0.5 is
the Michaelis constant, which is the [S] at which the I¼ Imax/2, which serves
as an approximation of substrate affinity. The calculation of substrate affinity
values used the Imax values of �150 mV test pulses.
The presteady-state current of an expressing oocyte is comprised of both
a nonspecific component, due to oocyte membrane capacitance, and an
SGLT1-specific component. Isolation of the SGLT1-specific component
was accomplished with phloridzin (pz), which is an SGLT1 inhibitor. The
current recordings acquired in the presence of saturating pz (200 mM) were
subtracted from the recordings acquired in the absence of pz, to provide the
current due exclusively to rSGLT1. Presteady-state experiments used test
pulses of the same values as those used for steady-state experiments;
however, the test pulses were of a 150-ms duration. Baseline correction for
Q170 of rSGLT1 Regulates Charge Transfer 297
Biophysical Journal 87(1) 295–310

each trace was accomplished by subtracting the average values for the
currents measured in the steady-state region (beyond 100 ms). The rSGLT1
presteady-state currents for each Vt were integrated over the entire course of
the trace to calculate the total charge transferred by the cotransporter. The
charge,Q, was plotted as a function of the test pulses, and theseQ(Vt) curves
were fitted to the two-state Boltzmann relation,
Q¼�N3e3z=ð11expðz3u3ðVt�V0:5ÞÞ1QdepÞ; (2)
whereQ is the total charge transferred,Qdep is the charge due to depolarizing
pulses, e is the elementary charge, z is the apparent valence of the movable
charge, V0.5 is the potential at which half of the total charge transfer is
complete, and N is the number of cotransporters expressed at the surface.
The term u ¼ F/RT; F is Faraday’s constant, R is the gas constant, and T is
absolute temperature.
The initial mathematical operations were performed with Clampfit (Axon
Instruments). Results were filtered via a 1-kHz, 5-point Gaussian filter.
Additional curve fitting was performed in ORIGIN 6.0 with the Levenberg-
Marquardt algorithm.
Transient current measurement
Transient decay parameters of Q170C OFF currents were derived with the
protocol illustrated in Fig. 2, and described in detail by Krofchick and
Silverman (2003). The holding potential, Vh, was �50 mV; this potential
was maintained between experiments. From �50 mV, the potential was
stepped to an array of pre-step potentials, or ON potentials. The pre-step
potentials were from �150 mV to 90 mV in 10-mV increments, and were
applied for a 100-ms duration, to allow the system to equilibrate. At t¼ 0 ms,
the desired post-step potential, or OFF potential, was applied. A set of post-
step potentials was used, from�150 mV to 90 mV in 20-mV increments; the
representative waveform of Fig. 2 A has a post-step potential of 50 mV. The
post-step potential is applied for a 100-ms duration, from t¼ 0 ms to t¼ 100
ms. The resulting array of post-step transient currents, generated with the
waveform described, is analyzed for presteady-state parameters. The settling
time of the voltage-clamp was determined by measuring the oocyte
membrane potential as a function of time. Voltage steps, ranging from 70
mV to 240 mV, were investigated. Final potentials were attained 0.6 (70 mV
jump) to 1.3 ms (240 mV jump) after the onset of the clamp. Transient
currents before the settling of the clamp were removed before fitting.
Fitting decay currents
Each current trace of a post-step potential was fitted, from 0 to 100 ms,
to a first-order exponential decay, a second-order exponential decay, and
a third-order exponential decay. The order of exponential decay at which the
x2 value demonstrated no change, or at which the higher order terms became
meaningless, was discarded for the previous order of decay. Extremely large
or small time constants, amplitude values or large error values associated
with such parameters, precluded the validity of a particular order of decay.
Several criteria were considered when deciding upon an order of decay.
Typically, higher order of decay was accepted if its x2 value decreased by
;10% or more compared to the previous lower order fit. Also, a higher order
fit was only deemed valid if the trends observed for such parameters as time
constants and amplitude values were consistent over a range of post-step
potentials (Krofchick and Silverman, 2003). Finally the residuals had to
demonstrate a definitive improvement at the highest order fit. The complete
details of the technique are provided by Krofchick and Silverman (2003).
Statistical comparisons of means
The mean values of parameters are presented with standard deviation
(mean 6 SD). Comparisons of parameters, drawn between wild-type and
Q170C rSGLT1, were tested with a two-sample t-test for independent
samples with equal variances. Comparisons of parameters, before and after
exposure to sulfhydryl specific compounds in the same oocyte, were tested
with the paired t-test.
Tissue culture
COS-7 cells were grown and maintained in RPMI 1640 medium (Invitrogen
Canada, Burlington, ON). The RPMI 1640 was supplemented with 21 mM
NaHCO3, 25 mM HEPES/NaOH, pH 7.4, 10% fetal calf serum, and
50 units/ml antibiotic solution containing penicillin/streptomycin. Cells
were maintained in a 5% CO2 atmosphere at 37�C.
Cell transfection
At 70% confluency, the COS-7 cells were transfected with Lipofectamine
Plus (Invitrogen) according to manufacturer’s protocol.
aMG uptake experiments
Uptake was gauged with [14C]a-MG (Amersham Health, Oakville, ON,
Canada) with a specific radioactivity of 293 mCi/mmol. Culture medium
was aspirated, and replaced with 500 mL of incubation medium containing
either 140 mM NaCl or 140 mM KCl, 20 mM mannitol, 10 mM HEPES/
Tris, pH 7.4 and 1 mM [14C]a-MG. After 10 min at room temperature, the
incubation medium was aspirated and the wells were washed three times
with 3 mL of ice-cold stop buffer, consisting of 140 mM KCl, 20 mM
mannitol, 10 mM HEPES/Tris, pH 7.4, and 200 mM phloridzin. The cells
FIGURE 2 Representative transient OFF currents of Q170C rSGLT1 for
a 50-mV post-step potential. (A) The waveform used to generate the Q170C
transient currents, displayed in B. The pre-step potentials were from �150
mV to 90 mV, in 10-mV increments, and were applied for a 100-ms duration
before the step at t ¼ 0, to allow the system to stabilize. At t ¼ 0 ms, the
desired post-step potential was applied; the representative waveform of A
has a post-step potential of 50 mV. The post-step potential is applied for
a 100 ms duration, from t ¼ 0 ms to t ¼ 100 ms. (B) An array of Q170C
rSGLT1 post-step transient currents, generated with the waveform described
in A.
298 Huntley et al.
Biophysical Journal 87(1) 295–310

were solubilized with 500 mL of PBS buffer with 0.1% SDS. Solubilization
proceeded for 20 min, then the solution was removed and prepared for
liquid-scintillation counting.
Phloridzin binding experiments
Phloridzin binding was gauged with [3H]phloridzin (Sigma) with a specific
radioactivity of 55 Ci/mmol. The transfected plates were removed from the
incubator. The medium in the wells was aspirated, and replaced with 500 mL
of incubation medium at room temperature. The incubation medium
consisted of 140 mM NaCl, 20 mM mannitol, 10 mM HEPES/Tris at pH
7.4, and various concentrations of phloridzin. The phloridzin concentrations
examined were 0.01, 0.05, 0.1, 0.3, 0.4, 0.5, or 1.0 mM. The incubation
period was 1 min. The solubilization procedure was identical to that
described for uptake experiments.
RESULTS
The effects of the glutamine-to-cysteinemutation at 170
Steady-state behavior of Q170C
As described in Materials and Methods, 300-ms test pulses
are routinely employed in steady-state experiments, and the
steady-state currents are analyzed over the time frame from
150 ms to 300 ms. These protracted currents allow optimized
determination of the average current value during the steady-
state region of the traces. The aMG-induced inward Na1
currents of Q170C were measured over a range of aMG
concentrations; each aMG bathing solution had a saturating
[Na1] of 100 mM. The resulting current (I) versus voltage(Vt) curves were transformed to I versus [aMG], and the
Michaelis-Menten relationship was then fitted to these
curves. The average aMG KM for Q170C, from Vt ¼�150 mV to �90 mV, is 0.10 6 0.01 mM (n ¼ 4), which
confirms our earlier findings (Lo and Silverman, 1998a), and
is comparable to the value of 0.156 0.024 mM obtained for
wt SGLT1 over the same potential range (Lo and Silverman,
1998a). At the more negative test pulses, from �150 mV to
�90 mV, there is little or no voltage dependency. However,
voltage dependence is evident from �70 mV to �10 mV,
similar to the aMG KM voltage dependency of wt SGLT1
(Lo and Silverman, 1998a,b).
We next expanded our investigation of Q170C to examine
the interaction with Na1. The current versus [Na1] curves
(obtained at saturating 10 mM aMG), for a representative
expressing oocyte, are displayed in Fig. 3 A. The Hill
equation was fitted to these curves, for five oocytes, which
permitted the derivation of the Hill coefficients and the Na1
affinity values (KNa). The Hill coefficients display a voltage
dependence with values of 1.56 0.20 to 2.36 0.24, over the
voltage range �150 mV to �10 mV (n ¼ 5), suggesting that
Q170C has a stoichiometry of at least two Na1/transport
cycle, the same as wt SGLT1. The Q170C KNa values and
voltage dependencies are similar to those of wt rSGLT1, as
observed in our lab (data not shown) and as published
previously (Parent et al., 1992a). The KNa values were then
plotted versus the test potentials, with the KNa values
presented with the natural logarithm scale (Fig. 3 B). Least-squares linear analysis yielded a slope of 0.01672; the
inverse of the slope revealed that the fitted KNa values vary
exponentially with voltage at a rate of e-fold/59.8 mV.
Since pz locks the transporter at the outside face of the
membrane, thereby inhibiting charge transfer (Q), measure-
ment of fractional Qmax as a function of phloridzin concen-
tration provides a method of determining pz affinity (KD). The
FIGURE 3 Steady-state kinetics of Q170C: determination of KNa.
Expressing oocytes were voltage-clamped and Na1 titrations were
performed using solutions with Na1 concentrations ranging from 0 to 100
mM. The voltage-clamping solutions were supplemented with appropriate
concentrations of choline, to provide a cation concentration of 100 mM. All
voltage-clamping solutions were of pH 7.4. (A) Typical results from a sin-
gle oocyte showing Na1 dependence of Q170C steady-state currents, for
negative Vt values. The data from the Na1 titration were transformed to
examine Na1 dependence of the steady-state currents for Vt values, ranging
from �150 mV to �10 mV, inclusive. Each curve was fitted with the Hill
equation, I ¼ Imax 3 ½Na1 �n=ð½Na1 �n 1Kn0:5Þ; where Imax ¼ current at
�150mV, to yield values for affinity,KNa, andHill coefficient, n. (B) Voltage
dependence of the Na1 affinity of Q170C. The Vt values from �150 mV to
�10 mV, inclusive, are plotted versus [Na1] on a semilogarithmic scale.
Least-squares linear analysis yielded y ¼ 0.01672x 1 3.9298, SD ¼ 0.45.
The inverse of the slope indicates that the KNa varies e-fold per 59.8 mV.
Q170 of rSGLT1 Regulates Charge Transfer 299
Biophysical Journal 87(1) 295–310

Q170CKD for pz is 1.936 0.08mM(n¼ 4),which is similar to
that of wt rSGLT1, 1.386 0.18 mM (n¼ 3) (data not shown).
In summary, the glutamine-to-cysteine mutation at the 170
site appears to exert little influence over the steady-state
behavior of rSGLT1. The affinities of Q170C for Na1, sugar,
and pz are unaltered, and the stoichiometry of the substrates
over one transport cycle appears to be unaffected.
Presteady-state behavior of Q170C
Q170C charge transfer characteristics. Fig. 4 compares the
mean Q versus Vt curves and calculated Boltzmann relations,
of wt (n ¼ 5) and Q170C rSGLT1 (n ¼ 11). Inspection of
Fig. 4 shows that the V0.5 for Q170C is shifted to more
negative potentials compared to wt (Table 1). The wt V0.5
is �1.5 6 5.1 mV (n ¼ 5), whereas the V0.5 of Q170C is
�13.8 6 5.5 mV (n ¼ 11). This shift in the Q170C V0.5
value is statistically significant (p ¼ 0.001) and, therefore,
indicates an altered voltage sensitivity of the mutated
cotransporter, but the shift is not marked. Moreover, there
is no significant difference between the dV values of the two
species of rSGLT1. The dV values are proportional to the
voltage sensitivity of the Boltzmann relations, and are used
to derive the apparent valencies, z. Consequently, the
apparent valencies of Q170C and wt rSGLT1 are the same
(Table 1).
The relative contributions of hyperpolarizing (Qhyp) and
depolarizing (Qdep) charges to the overall charge transfer,
Qmax, reflect the distribution of Q170C, between inward- and
outward-facing conformational states at the holding potential
studied. As displayed in Table 1, Qdep comprises;786 4%
(n¼ 11) of the total charge transferred for Q170C. However,
for wt rSGLT1, Qdep comprises 86 6 2% (n ¼ 5). This
difference is significant at the p¼ 0.01 level. The disparity in
the relative charge contribution of Qdep, between Q170C and
wt rSGLT1, indicates that occupancy of the outward-facing
Na1 bound conformation of Q170C is less than that of wt
rSGLT1, at �50 mV. In other words, the glutamine-to-
cysteine mutation at position 170 seems to be affecting the
inward/outward-facing distribution of cotransporters.
To investigate this effect more fully, we determined the
Na1 dependence of the relative contributions of Qhyp and
Qdep to Qmax. Fig. 5 presents the results of a typical single
oocyte experiment in which the Na1 dependence of the Qversus Vt curves of Q170C rSGLT1 was examined over
a broad range of [Na1] values. Since reducing external Na1
causes proportionate increases in the number of inward-
FIGURE 4 Comparison of the mean charge (Q) versus potential (Vt)
curves, and the calculated two-state Boltzmann relations, of Q170C and wt
rSGLT1. The Q(Vt) curves of Q170C and wt were normalized and zeroed,
then the mean charge and SD were calculated for each Vt. The mean charge
and SD values were plotted versus Vt. Each curve was then fitted with a two-
state Boltzmann relation. All curves were acquired with 100 mM Na1. The
Q170C mean Q(Vt) curve represents 11 oocytes; the wt mean Q(Vt) curve
represents five oocytes.
TABLE 1 Comparison of the presteady-state parameters for
Q170C and wt rSGLT1
Parameter
wt rSGLT1
(n ¼ 5)
Q170C
(n ¼ 11)
Q170A
(n ¼ 3)
Q170E
(n ¼ 4)
Qdep/Qmax (%) 86 6 2 78 6 4 80 6 3 92 6 1
V0.5 (mV) �1.5 6 5.1 �13.8 6 5.5 �12.8 6 4.2 25.1 6 2.6
dV (mV) 25.7 6 2.5 27.6 6 2.7 25.0 6 4.3 30.3 6 1.2
z 1.01 6 0.11 1.08 6 0.1 0.98 6 0.14 1.18 6 0.05
The transient currents of wt and Q170C, Q170A, and Q170E rSGLT1 were
integrated to yield the total charge transferred, via the cotransporter, for
each Vt. The charge (Q) versus potential (Vt) curves for each rSGLT1
species were fitted with the two-state Boltzmann relation (Eq. 2), enabling
the derivation of the presteady-state parameters.
FIGURE 5 The Na1 dependence of the Q(Vt) curves of Q170C rSGLT1.
The results of a representative experiment investigating the effects of [Na1]
upon the Q(Vt) curves of Q170C. The Q(Vt) curves were acquired in the
same oocyte for various [Na1] values. The Na1 concentrations used were
140 mM, 100 mM, 80 mM, 60 mM, 40 mM, 20 mM, 10 mM, and 5 mM.
When possible, the Q(Vt) curves were fitted with a two-state Boltzmann
relation.
300 Huntley et al.
Biophysical Journal 87(1) 295–310
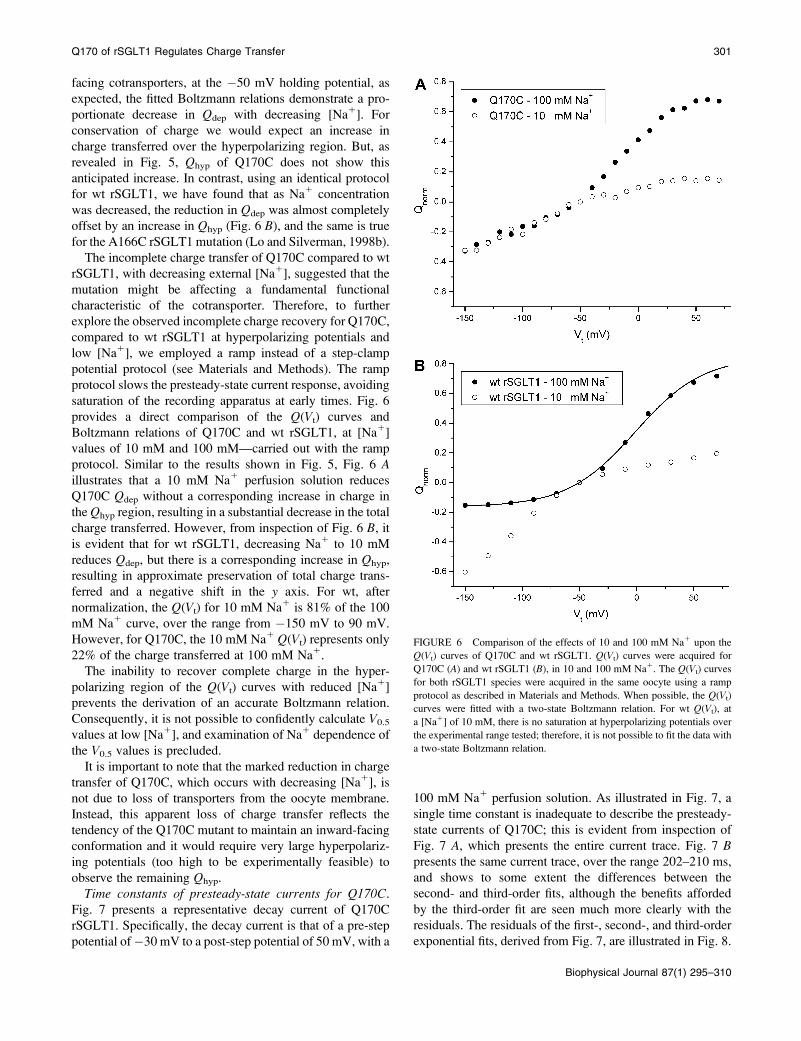
facing cotransporters, at the �50 mV holding potential, as
expected, the fitted Boltzmann relations demonstrate a pro-
portionate decrease in Qdep with decreasing [Na1]. For
conservation of charge we would expect an increase in
charge transferred over the hyperpolarizing region. But, as
revealed in Fig. 5, Qhyp of Q170C does not show this
anticipated increase. In contrast, using an identical protocol
for wt rSGLT1, we have found that as Na1 concentration
was decreased, the reduction in Qdep was almost completely
offset by an increase in Qhyp (Fig. 6 B), and the same is true
for the A166C rSGLT1 mutation (Lo and Silverman, 1998b).
The incomplete charge transfer of Q170C compared to wt
rSGLT1, with decreasing external [Na1], suggested that the
mutation might be affecting a fundamental functional
characteristic of the cotransporter. Therefore, to further
explore the observed incomplete charge recovery for Q170C,
compared to wt rSGLT1 at hyperpolarizing potentials and
low [Na1], we employed a ramp instead of a step-clamp
potential protocol (see Materials and Methods). The ramp
protocol slows the presteady-state current response, avoiding
saturation of the recording apparatus at early times. Fig. 6
provides a direct comparison of the Q(Vt) curves and
Boltzmann relations of Q170C and wt rSGLT1, at [Na1]
values of 10 mM and 100 mM—carried out with the ramp
protocol. Similar to the results shown in Fig. 5, Fig. 6 Aillustrates that a 10 mM Na1 perfusion solution reduces
Q170C Qdep without a corresponding increase in charge in
the Qhyp region, resulting in a substantial decrease in the total
charge transferred. However, from inspection of Fig. 6 B, itis evident that for wt rSGLT1, decreasing Na1 to 10 mM
reduces Qdep, but there is a corresponding increase in Qhyp,
resulting in approximate preservation of total charge trans-
ferred and a negative shift in the y axis. For wt, after
normalization, the Q(Vt) for 10 mM Na1 is 81% of the 100
mM Na1 curve, over the range from �150 mV to 90 mV.
However, for Q170C, the 10 mM Na1 Q(Vt) represents only
22% of the charge transferred at 100 mM Na1.
The inability to recover complete charge in the hyper-
polarizing region of the Q(Vt) curves with reduced [Na1]
prevents the derivation of an accurate Boltzmann relation.
Consequently, it is not possible to confidently calculate V0.5
values at low [Na1], and examination of Na1 dependence of
the V0.5 values is precluded.
It is important to note that the marked reduction in charge
transfer of Q170C, which occurs with decreasing [Na1], is
not due to loss of transporters from the oocyte membrane.
Instead, this apparent loss of charge transfer reflects the
tendency of the Q170C mutant to maintain an inward-facing
conformation and it would require very large hyperpolariz-
ing potentials (too high to be experimentally feasible) to
observe the remaining Qhyp.
Time constants of presteady-state currents for Q170C.Fig. 7 presents a representative decay current of Q170C
rSGLT1. Specifically, the decay current is that of a pre-step
potential of�30 mV to a post-step potential of 50 mV, with a
100 mM Na1 perfusion solution. As illustrated in Fig. 7, a
single time constant is inadequate to describe the presteady-
state currents of Q170C; this is evident from inspection of
Fig. 7 A, which presents the entire current trace. Fig. 7 Bpresents the same current trace, over the range 202–210 ms,
and shows to some extent the differences between the
second- and third-order fits, although the benefits afforded
by the third-order fit are seen much more clearly with the
residuals. The residuals of the first-, second-, and third-order
exponential fits, derived from Fig. 7, are illustrated in Fig. 8.
FIGURE 6 Comparison of the effects of 10 and 100 mM Na1 upon the
Q(Vt) curves of Q170C and wt rSGLT1. Q(Vt) curves were acquired for
Q170C (A) and wt rSGLT1 (B), in 10 and 100 mM Na1. The Q(Vt) curves
for both rSGLT1 species were acquired in the same oocyte using a ramp
protocol as described in Materials and Methods. When possible, the Q(Vt)
curves were fitted with a two-state Boltzmann relation. For wt Q(Vt), at
a [Na1] of 10 mM, there is no saturation at hyperpolarizing potentials over
the experimental range tested; therefore, it is not possible to fit the data with
a two-state Boltzmann relation.
Q170 of rSGLT1 Regulates Charge Transfer 301
Biophysical Journal 87(1) 295–310

The fit residuals are calculated as the difference between
measured data and the best fit. Inspection of Fig. 8, A and B,shows that the residuals of the first- and second-order
exponential decay fits have regions that are nonrandom (Fig.
8, A and B). However, the third-order fit (Fig. 8 C) yieldsa residual comprised entirely of random noise.
Q170C transient currents consistently display third-order
decays for all depolarizing Vt traces. The derived decay
constants are distinct in their durations, and are denoted
accordingly: ts, the slow decay constant; tm, the medium
decay constant; and tf, the fast decay constant. The voltage
dependencies of the decay constants of Q170C are presented
in Fig. 9, with the corresponding decay constants of wt
FIGURE 7 A comparison of various orders of exponential decay fits to
a transient decay. The transient decay is that of a pre-step potential of �30
mV to a post-step potential of 50 mV. (A) First- (dotted line), second-
(dashed line), and third-order (solid line) fits are presented with the decay
trace. The first-order decay exponential fit is clearly inadequate to describe
the transient. (B) The decay transient and the exponential fits are presented
on a different scale to give a better view of the second- and third-order fits.
FIGURE 8 The fit residuals. First- (A), second- (B), and third- (C) order fit
residuals for the �30 mV pre-step, 50 mV post-step potential transient
presented in Fig. 7. The residuals are calculated as data � fit. A good fit
results in noise only, so that the residual oscillates randomly around the zero
axis. The residuals of the first- and second-order exponential decay fits have
regions, which are nonrandom. However, the third-order fit yields residuals
comprised of random noise.
302 Huntley et al.
Biophysical Journal 87(1) 295–310

rSGLT1. To a reasonable first approximation, there is no
difference in the voltage dependence of the three time
constants over the range tested. Indeed, the voltage de-
pendence of the three time constants, as a function of
external [Na1], is also very similar for Q170C and wt
SGLT1 (data not shown).
It is important to address the validity of the Q170C fast
decay. As exhibited in Fig. 9 C, the derived Q170C tf isvoltage-independent and varies from ;0.8–1.4 ms (compa-
rable to the wt rSGLT1 tf). This range approximates that of
the voltage-clamp. As described in Materials and Methods,
the settling time of the voltage-clamp was determined by
measuring the oocyte membrane potential as a function of
time. Voltage steps ranging from 70 mV to 240 mV were
investigated. Final potentials were achieved from 0.6 (70 mV
jump) to 1.3 ms (240 mV jump) after the onset of the clamp.
Transient currents before the settling of the clamp were
removed before fitting, which leaves;40% of the fast decay
component. Three decays are cited as the minimum required
to adequately fit a decay exponential. The fastest decay value
derived is ;0.8 ms. The amplitude of the fast transition is
;2000 nA or greater and the minimum resolution of the
system is 5 nA, therefore at least six decays are present
before the loss of the transient. Consequently, the resolution
of the fast component is deemed valid.
Q170C transporter turnover. An estimate of the maxi-
mal rate of transporter turnover, k, is calculated using the
measured steady-state Imax and the presteady-state value
Qmax,
k¼ Imaxzapp=ðzssQmaxÞ; (3a)
¼ Imax=ðzssNeÞ; (3b)
(Loo et al., 1993; Panayotova-Heiermann et al., 1994). The
parameters Imax and Qmax are calculated using an expressing
oocyte: Imax is the measurement of the maximal steady-state
current generated at saturating concentrations of aMG and
Na1, for a Vt of �150 mV; zss is the steady-state valence,
which equals 2, and corresponds to the 2 Na1 translocated
with each transport cycle; and Qmax is the value derived by
fitting aQ(Vt) curve with a two-state Boltzmann relation. The
presteady-state Qmax serves as an estimate of expressed
cotransporters sinceQmax¼ Nzappe, with N being the number
of cotransporters, zapp the apparent valence of the presteady-state model (e.g., the model in Fig. 1 B), and e the elementary
charge.
In our earlier preliminary survey of Q170C (Lo and
Silverman, 1998a), we did not measure turnover relative to
wt SGLT1. From our present study, we now show that for
Q170C, a turnover value of 11.26 1.7 s�1 is derived (n¼ 7).
This value should be compared to the wt value of 22.8 60.5 s�1 (Lo and Silverman, 1998b). Therefore, the glutamine-
to-cysteine mutation significantly reduces cotransporter turn-
over by ;50%.
FIGURE 9 A comparison of the decay constants and voltage dependen-
cies of Q170C and wt rSGLT1 transient currents. (A) ts, Slow decay
constant. (B) tm, Medium decay constant. (C) tf, Fast decay constant. For wtrSGLT1, n ¼ 3, except for �150 mV, �110 mV, �90 mV, and 50 mV, in
which n ¼ 2. For Q170C rSGLT1, n¼ 3. Error bars represent standard error
for data points of n ¼ 3, and the mean of the difference for n ¼ 2.
Q170 of rSGLT1 Regulates Charge Transfer 303
Biophysical Journal 87(1) 295–310

The effects of methanethiosulfonate compoundson Q170C functional behavior
We next examined the consequences of reacting Q170C with
cysteine-specific sulfhydryl reagents, MTSEA, MTSES, and
MTSET. Rabbit SGLT1 has 15 endogenous cysteine
residues; none of the native cysteine residues was removed.
Recall that neitherMTSEAnorMTSES affects the function of
wt rSGLT1 (Lo and Silverman, 1998a,b; Vayro et al., 1998).
Effect of MTSES on Q170C steady-state currents
MTSES greatly suppresses sugar-induced inward Na1
currents. Because of the marked degree of inhibition by
MTSES, it was not possible to obtain accurate measurements
of sugar-induced Na1 currents at sugar concentrations below
saturation (i.e.,,10 mM aMG). However, using sufficiently
high expressing oocytes, it was possible to carry out pz
titrations before and after exposure to 1 mM MTSES in the
same oocyte and obtain estimates of pz KD. The pz KD before
exposure to MTSES was determined to be 2.8 6 1.7 mM,
and the KD after exposure was determined to be 3.4 6 2.3
mM (n ¼ 3), indicating that MTSES has no effect on
phloridzin affinity.
As previously indicated, MTSES inhibits sugar-induced
inward Na1 currents to such a degree that oocytes with
exceptional expression of Q170C are required to obtain
reliable experimental data at low Na1 concentrations. We
were fortunate to identify such a high expressor and carry
out a complete post-MTSES Na1 titration. We employed
a protocol in which the Na1 titration was carried out before
and after MTSES exposure in the presence of 10 mM aMG,
in the same oocyte. As shown in Fig. 10 A, treatment with
MTSES significantly suppresses Imax for each of the
hyperpolarizing pulses, �150 mV to �50 mV. The value
Imax was reduced to 36 1/� 3% of the pre-exposure values
(n ¼ 6). Fig. 10 B displays data from the same oocyte used
for Fig. 10 A, and demonstrates that Na1 affinity is far less
affected by MTSES exposure than is Imax. The KNa values
before and after MTSES exhibit voltage dependency, and are
comparable for Vt values from �90 mV to �10 mV.
However, at extreme hyperpolarizing pulses, from�150 mV
to�110 mV, MTSES exposure reduces Q170C’s affinity for
Na1 by one-half or greater. Exposure to 1 mMMTSES does
not alter the apparent stoichiometry of rSGLT1, since the
Hill coefficients match those derived in the absence of
MTSES.
We also carried out experiments to determine the effect on
the Q170C Na1 leak after MTSES exposure. The Na1
current at �150 mV is decreased to 456 2% (n ¼ 3) of pre-
exposure values (data not shown).
Effect of MTSES on Q170C presteady-state currents
As shown in Fig. 11 A, exposure to MTSES results in
substantial reduction of the Q170C Q versus Vt curves,
which is reversed by treatment with 10 mM dithiothreitol
(DTT). Although MTSEA has no effect upon Q170C
function, prior exposure to MTSEA prevents the action of
MTSES, and the MTSEA protection is reversed by DTT
(data not shown). To exclude the possibility that MTSEA
reacts with hydrophobically located native cysteines to bring
about a conformational change, which alters MTSES
accessibility to the 170 position, we performed protection
experiments using the membrane-impermeant, cationic
MTSET. As shown in Fig. 11 B, exposure to MTSET
completely prevents MTSES reaction with Q170C, but
MTSET has no effect on Q170C maximum charge transfer.
FIGURE 10 The effects of 1 mM MTSES upon the steady-state
parameters of a Na1 titration experiment. Na1 titrations, as described in
the legend of Fig. 3, were performed with the same oocyte, before and after
exposure to 1 mM MTSES for 5 min. (A) The Imax values derived with the
Hill equation versus Vt are presented for pre-exposure and post-exposure to
MTSES. (B) KNa vs. Vt are presented for pre-exposure and post-exposure to
MTSES.
304 Huntley et al.
Biophysical Journal 87(1) 295–310

MTSET protection is reversed after exposure to 10 mM
DTT. Given that MTSET reactivity is restricted to externally
accessible native cysteines in SGLT1, we conclude that
MTSET protects against MTSES accessibility to the cysteine
mutation introduced at the 170 position (which is located in
the putative external loop joining TMs IV–V), by directly
reacting (modifying) the cysteine at that site. We conclude
that both cationic MTSEA and MTSET react with Q170C
and that the inhibitory effect of MTSES on charge transfer is
a consequence of the anionic ethylsulfonate group added at
the 170 position. The fact that DTT completely reverses the
inhibitory effect of MTSES within minutes suggests that
reduction in charge transfer byMTSES is not due to a change
in the number of surface-expressed Q170C transporters. To
confirm this, using methods previously established for wt
SGLT1 and an A166C rSGLT1 mutant (Vayro et al., 1998),
we verified that the number of [3H]phloridzin binding sites
in COS-7 cells transfected with Q170C, before and after
treatment with MTSES, was the same (data not shown).
Several other protection experiments were performed with
Q170C expressed in Xenopus oocytes and it was verified thatthe inhibitory effect of MTSES on Q170C function was
independent of Na1 or prior exposure to 200 mM phloridzin.
The effects of MTSES upon the various presteady-state
parameters of Q170C are displayed in Table 2. Exposure to
1 mM MTSES reduces total charge transfer by ;50% over
the voltage range, �150 mV to 190 mV. Further, similar to
what occurs when [Na1] is reduced (see Figs. 5 and 6), there
is a preferential inhibitory effect upon the charge transfer
at depolarizing voltages. In a paired comparison of five
different oocytes, before and after MTSES exposure, the
Qdep contribution to total charge transferred was found to be
82 6 2% in the five oocytes tested, and this contribution is
reduced to 73 6 3% after MTSES exposure (Table 2). This
difference is significant at the p ¼ 0.01 level, but only
accounts for ;10% of the observed ;50% reduction in
Qmax. The majority of the ‘‘loss’’ in charge transfer in the
presence of MTSES occurs because of a failure to recover
charge transfer in the hyperpolarizing region over the range
of observation, up to �150 mV. This behavior is similar to
what is observed when [Na1] is reduced (Figs. 5 and 6), in
the absence of MTSES, and is a direct consequence of the
fact that under both reduced external Na1, and after reaction
with MTSES, the transporter occupancy of its inward-facing
conformation states is substantially increased. More com-
plete charge recovery would require extending the hyper-
polarization beyond �150 mV, a range not feasible
experimentally. Because of the incomplete charge recovery
over the hyperpolarization region, it is not possible to
FIGURE 11 Effects of MTSES, MTSEA, and MTSET on charge transfer
of Q170C. Typical results demonstrating the effects of sulfhydryl-specific
reagents on Q170C charge transfer. The protocols, for each panel, were
carried out in the same oocyte. (A) After documenting the Q vs. Vt behavior
under control conditions (——), the oocyte was superfused with 1 mM
MTSES (...............) for 5 min, followed by 10 mM DTT for 10 min (��������).Data have been normalized to the control. (B)Q vs. V behavior under control
conditions was determined (——), followed by MTSET for 5 min, washed
with voltage-clamping solution, superfused with 1 mM MTSES for 5 min,
washed, and Q vs. V determined (...............). Next, the oocyte was superfused
with 10 mM DTT for 10 min, washed, and Q vs. V measured (��������).Finally, the oocyte was superfused with 1 mM MTSES for 5 min, washed,
and Q vs. V obtained (.....��.....��.....). All curves were normalized to control.
TABLE 2 Effects of 1 mM MTSES on the presteady-state
parameters of Q170C rSGLT1
Parameter pre-MTSES post-MTSES
Qtotal (%) 100 44 6 13
Qdep/Qtotal (%) 82 6 2 73 6 3
The charge (Q) versus potential (Vt) curves of Q170C rSGLT1, were
acquired before and after exposure to 1 mM MTSES for 5 min in the same
oocyte. Qtotal refers to the total charge transferred within the experimental
range, �150 mV to 90 mV. The pre-MTSES Qtotal values correspond to
Qmax.
Q170 of rSGLT1 Regulates Charge Transfer 305
Biophysical Journal 87(1) 295–310

determine the Boltzmann for Q170C post-MTSES and,
consequently, estimation of the effect on V0.5 and dV is
precluded.
After Q170C exposure to MTSES, the substantial
reduction in transient currents made it difficult to resolve the
three decay constants, t (slow, medium, fast), for potentials
more hyperpolarizing than �10 mV. Nevertheless, there
appeared to be no significant difference in the t-values,comparing pre- and post-MTSES conditions from �10 to
70 mV (data not shown).
Effect of MTSES on carrier turnover
Turnover was calculated before and after a 5-min exposure to
1 mMMTSES, in the same oocytes (n¼ 4). The pre-MTSES
turnover was 12.76 1.32 s�1; the post-MTSES turnover was
found to be 4.9 6 1.89 s�1. This ;60% post-MTSES
reduction, observed in the present study, contradicts our
earlier published result (Lo and Silverman, 1998a), in which
we reported that MTSES exposure did not appear to change
Q170C turnover. However, the present investigation,
performed with oocytes of significantly higher Q170C
expression, clearly demonstrates that Q170C turnover is,
indeed, substantially reduced. In fact, after reaction with
MTSES, the Q170C turnover is approximately less than one-
fourth that of wt rSGLT1 (wt turnover ¼ 22.86 0.5 s�1). Of
interest, the reduction in turnover, due to MTSES, can be
reversed by exposure to DTT. In two different oocytes, pre-
MTSES exposure turnover averaged 11.8 s�1; after MTSES,
turnover was reduced to 3.4 s�1; and after 10 min exposure
to 10 mM DTT, the turnover was measured at 13.4 s�1.
These estimates of turnover are calculated using direct
measurements of Imax at �150 mV and Qtotal, before and
after exposure to MTSES. In the equation for turnover, the
total Q serves as an estimate of the number of cotransporters,
N, expressed at the oocyte surface (Eq. 3a). However, as
noted in previous sections, the measured total Q, post-
MTSES, is an underestimate because of incomplete charge
recovery. We note that exposure to 1 mM MTSES causes
a 70% reduction in Imax. Since N, the number of transporters,
is in fact unchanged, and z, the net charge transported per
cycle (i.e., 2), is likewise the same, the turnover is, in fact,
proportional to Imax (Eq. 3b).
We sought to corroborate this measurement using the
COS-7 cell system transiently transfected with Q170C. The
maximal velocity (Vmax) of [14C]aMG uptake at 10 mM
aMG concentration, pre- and post-MTSES exposure, was
determined and the ratio was calculated to be;2.6. Since the
number of Q170C transporters at the surface, as measured by
phloridzin binding in COS-7 cells, was the same pre- and
post-MTSES, the ratio of Vmax pre- and post-MTSES should
be a reliable measure of turnover number under the same
conditions. The COS-7 cell measurements suggest that the
turnover of Q170C has been reduced, post-MTSES expo-
sure, by ;80%. The COS-7 cell measurements, therefore,
represent independent confirmation that the post-MTSES
turnover is proportional to Imax, i.e., at least ;60–70%
reduced. In summary, the glutamine-to-cysteine mutation at
the 170 position reduces the cotransporter turnover by
;50%, and treatment with MTSES further reduces the
Q170C turnover time by another 60–70%, so that Q170C
post-MTSES is more than fourfold slower than wt SGLT1.
The effects of glutamine-to-alanine andglutamine-to-glutamate mutations at 170
To corroborate the observed effects of Q170C and Q170C
post-MTSES on SGLT1 function, the presteady-state
parameters of Q170A and Q170E rSGLT1 were examined.
Q170A was examined to probe neutrality, for comparison
with Q170C; Q170E was employed to investigate the effects
of negative charge, for comparison with MTSES-reacted
Q170C. The mean Q(Vt) curves for Q170A and Q170E were
normalized and fitted with the Boltzmann relation. The data
for Q170A and Q170E are presented with those of wt and
Q170C (Fig. 12, Table 1).
The mean Q(Vt) curve and the fitted Boltzmann relation of
Q170A closely mirror those of Q170C (Fig. 12). As pre-
sented in Table 1, the various presteady-state parameters of
Q170C and Q170A are equivalent. The Qdep/Qmax values of
Q170C and Q170A are 786 4% (n¼ 11) and 806 3% (n¼3), respectively. As with Q170C, the Q170A Qdep/Qmax
FIGURE 12 Comparison of the mean charge (Q) versus potential (Vt)
curves, and the calculated two-state Boltzmann relations, of Q170C, Q170A,
Q170E, and wt rSGLT1. The Q(Vt) curves of Q170C, Q170A, Q170E, and
wt were normalized and zeroed, then the mean charge and SD were
calculated for each Vt. The mean charge and SD values were plotted versus
Vt. Each curve was then fitted with a two-state Boltzmann relation. All
curves were acquired with 100 mM Na1. The Q170C mean Q(Vt) curve
represents 11 oocytes; the Q170A mean Q(Vt) curve represents three
oocytes; the Q170E mean Q(Vt) curve represents four oocytes; and the wt
mean Q(Vt) curve represents five oocytes.
306 Huntley et al.
Biophysical Journal 87(1) 295–310

value is significantly different from the wt value ( p, 0.01).
The Qdep/Qmax values of Q170C and Q170A indicate
comparable cotransporter conformational distributions at
Vh ¼ �50 mV, with a greater proportion of transporters at
the inside-facing conformation, compared to wt. The V0.5
value for the Q170C Boltzmann is �13.8 6 5.5 mV (n ¼11), versus the V0.5 value for Q170A of �12.8 6 4.2 mV
(n ¼ 3), verifying an equivalent voltage sensitivity. Finally,
the z-values of the two mutants are comparable: Q170C z ¼1.08 6 0.11, versus Q170A z ¼ 0.98 6 0.14 (Table 1).
Neutrality at 170, therefore, appears to exert significant
influence on empty carrier kinetics.
The Q(Vt) curve of Q170E demonstrates saturation in
the hyperpolarizing region (Fig. 12), therefore a Boltzmann
relation can be fitted to the data and the appropriate
parameters can be derived (Table 1). Although a direct
comparison cannot be drawn to Q170C post-MTSES,
Q170E offers insight into the effects of a negative charge
at 170. As displayed in Table 1, the Q170E Qdep/Qmax is
92 6 1%, which is significantly different from the wt value
of 86 6 2% ( p ¼ 0.0005). The Q170E mutation, therefore,
elicits a cotransporter conformational distribution with
a greater number of cotransporters at the outside-facingconformation, compared to wt, at Vh ¼ �50 mV. This
greater Q170E Qdep contribution, compared to wt, is
opposite to the trend of the neutral mutants Q170C and
Q170A. The Q170E Q(Vt) curve and fitted Boltzmann
relation show a shift of V0.5 to positive potentials with a mean
value of 25.1 6 2.6 mV (n ¼ 4). The negative charge of the
glutamate does not have a significant effect upon the z (Table1). Qhyp saturation and an unchanged z-value suggest that
the Q170E mutation has very little effect upon the charge
transfer, unlike MTSES-reacted Q170C. Whereas, Q170A
exhibits a Q(Vt) curve shifted to a negative potential, the
presence of a negative glutamate shifts the Q(Vt) curve to
a significantly positive potential. This positive shift suggests
an increased Na1 affinity.
The carrier turnover values were calculated for the Q170A
and Q170E rSLGT1 mutants. The turnover value for Q170A
was calculated to be 9.6 s�1 (n ¼ 1) and the turnover for
Q170E is 11.6 6 2.5 s�1 (n ¼ 4). This is comparable to the
reduction in turnover observed for Q170C (11.2 6 1.7 s�1
(n ¼ 7)). Interestingly, the reduction in turnover, elicited by
the Q170E mutation, is not as great as the reduction in turn-
over observed for MTSES-reacted Q170C. Therefore, al-
though replacement of polarity at 170 with neutrality or
negative charge serves to significantly reduce turnover, the
structure of the side chain bearing the negative charge ap-
pears to modify the extent of turnover reduction.
DISCUSSION
The rationale for exploring the functional characteristics of
Q170C in greater depth was to explain its anomalous
behavior relative to the cysteine mutants of adjacent residues
163, 166, and 173, which together, form part of the Na1
binding and voltage-sensing domain of rSGLT1 (Lo and
Silverman, 1998a,b).
Charge specificity of chemical modification by MTS
sulfhydryl reagents is one characteristic that distinguishes
Q170C from the other loop mutants. For A166C (Lo and
Silverman, 1998a,b) and for F163C and L173C (M.
Silverman, unpublished data), the anionic MTS derivative,
MTSES, reacts with the cysteine at the mutated position, but
does not affect transport—whereas the cationic MTSEA
markedly alters transport activity (Lo and Silverman,
1998a,b). The opposite is true for Q170C; both MTSEA
and MTSET react with the cysteine at the 170 position and
block MTSES, yet neither has functional consequence. This
charge specificity perhaps indicates that the loop region has
a complexity beyond the primary structure, with an intricate
tertiary structure.
These studies, as well as previous studies by Lo and
Silverman (1998a,b) demonstrated that the MTS compounds
do not alter wt rSGLT1 function. It is, therefore, reasonable
to assume that the effects of these MTS reagents are due
to reaction with the exogenous cysteines introduced in the
various mutants. In the present investigation, there remains
a legitimate question concerning the mechanism of MTSET
and MTSEA protection against Q170C exposure to MTSES.
Two scenarios for protection are possible. The first mech-
anism of observed MTSET and MTSEA protection against
MTSES exposure involves binding of the MTSEA and
MTSETwith the cysteine at the 170 position, thereby directly
blocking MTSES reaction. A possible second mechanism
could involve the limiting of MTSES accessibility to the
170 position, through an indirect conformational change oc-
curring in response to MTSET or MTSEA reacting with one
or more of the native cysteines, putatively located in an
extracellular position (i.e., C255, C345, C351, C355, and
C361). Although such indirect effects might be attributable
to MTSEA protection, MTSET is membrane-impermeant
and therefore would be expected to interact with both native
extracellular cysteines as well as with the extracellular
cysteine introduced at the 170 position. We conclude that it
is the presence of a negative ethylsulfonate group at the 170
position, arising out of reaction with MTSES, that causes
altered function of the chemically modified Q170C.
Even more intriguing are the marked qualitative differ-
ences in function that occur in Q170C after exposure to MTS
reagents compared to A166C, F163C, and L173C. We have
previously shown that exposure to MTSEA shifts the V0.5 of
each of the single cysteine mutants F163C, A166C, and
L173C to negative potentials (Lo and Silverman, 1998a,b).
Further, progressively greater negative shifts in potential are
observed for the combination of double- and triple-cysteine
mutants created at these three positions (Lo and Silverman,
1998a). Moreover, Qmax under these conditions remains
constant (Lo and Silverman, 1998a). This behavior (i.e., shift
of V0.5 to more negative potentials with no change in Qmax)
Q170 of rSGLT1 Regulates Charge Transfer 307
Biophysical Journal 87(1) 295–310

mimics the effect of progressively lowering the external Na1
concentration (Lo and Silverman, 1998a). Collectively, these
results lead us to conclude that 163, 166, and 173 together
form part of the Na1 binding and voltage-sensing domain of
rSGLT1.
In contrast to the observed V0.5 shift to negative potentials
described above with no change inQmax, exposure of Q170C
to MTSES produces almost the opposite results—i.e.,
a substantial decrease in measured charge transfer over the
voltage range from �150 to 190 mV, which precludes an
accurate derivation of Boltzmann parameters, such as V0.5.
The results of this study provide new insights into the
conformational states and transitions that underlie rSGLT1
function. This conclusion is based on several behavioral
characteristics of Q170C compared to wt rSGLT1:
1. In general, the relative magnitudes of charge transferred
at hyperpolarizing pulses, Qhyp, and depolarizing pulses,
Qdep, to the total charge transferred, Qmax, reflect
cotransporter conformational state distribution at the
holding potential, Vh. Our data show that for Q170C,
depolarizing pulses contribute less charge to Qmax than
do depolarizing pulses to wt rSGLT1 Qmax. This reduced
Qdep indicates that at steady state, fewer Q170C trans-
porters are in the outside-facing, Na1 bound state, and
more are redistributed among the other conformational
states. Thus replacement of the polar glutamine, with
a relatively nonpolar and bulky cysteine, serves to drive
the Q170C equilibrium, at Vh ¼ �50 mV, toward the
inside-facing conformation.
2. Lower [Na1] should favor a distribution of cotransporters
toward inside-facing conformation, resulting in a reduced
Qdep. As expected, our experiments (Figs. 5 and 6 A) showthat reduced Na1 concentrations proportionately decrease
the Qdep region of Q170C. However, if carrier reorienta-
tion to the outside is unaffected by the mutation, we would
expect that any loss of Qdep would be regained in the Qhyp
region. This would manifest as a negative shift in the
Boltzmann relation along the y axis leading to a substantialincrease in charge transfer at hyperpolarizing voltages.
This is precisely what is observed for wt at 10 mM Na1
(Fig. 6 B). The fact that this is not observed in the case
of Q170C (Fig. 6 A), where reduced [Na1] results in
a preferential reduction in Qdep, implies that empty carrier
reorientation to the outside-facing conformation is
significantly retarded for Q170C, compared to wt SGLT1.
3. Exposure to 1 mM MTSES reduces the Q(Vt) curves of
Q170C, via a preferential effect upon the Qdep. But after
reaction with MTSES, there is no increase in charge
transfer at hyperpolarizing potentials. It is noteworthy
that the effect of MTSES on Q170C mimics that of
decreasing [Na1]—i.e., both appear to reduce the total
charge transferred. However, since KNa of Q170C is
unchanged, the implication is that addition of an anionic
ethylsulfonate at the 170 position affects a potential
dependent transition of empty (non-Na1-bound) carrier.
This once again argues for a steady-state cotransporter
distribution, which favors maintenance of the inward-
facing conformation and further suggests that anionic
charge at the 170 position enhances this localization.
4. The most profound effect of a change of polarity and
charge at the 170 position in rSGLT1 is the reduction in
transporter turnover number. The enhanced expression
levels, which we were able to achieve in the present
study, by coinjection of the Q170C cDNA together with
plasmid-bearing mouse T-antigen, have allowed us to
carry out more quantitative evaluation than we were able
to accomplish in our earlier investigations of Q170C
function (Lo and Silverman, 1998a). Our new findings
convincingly demonstrate that replacement of glutamine
with cysteine at 170 causes a reduction in turnover by
a factor of 2 compared to wt rSGLT1. Also, reaction of
Q170C with MTSES produces a further decrease of
.50% in turnover. Therefore, MTSES-reacted Q170C
exhibits a turnover, which is more than four times slower
than wt rSGLT1.
Many of the observed effects of altered polarity and charge
at the 170 residue, elicited with the Q170C mutation and
subsequent reaction with MTSES, were confirmed with
Q170A (neutral) and Q170E (anionic) mutations.
The glutamine-to-alanine mutation generated Q(Vt) curves
that correspond closely to those of Q170C. Q170A and
Q170C have comparable V0.5 values, Qdep/Qmax values, and
turnover numbers, which are reduced in both mutations by
;50%, compared to wt.
The glutamine-to-glutamate mutation, Q170E, had in-
teresting consequences on presteady-state behavior. There
was a substantial positive shift in the V0.5 of the Boltzmann
relation,with little change in z compared towt. Taken together
with the shift in V0.5 to negative voltages observed for Q170A
and Q170C, without a significant change in z (Table 1), theimplication is that change in polarity and charge at position
170 affects theNa1-binding and voltage-sensing properties of
the transporter. This behavior is similar but opposite to that
described for the F163C, A166C, and L173C single, double,
and triple mutants reacted with cationic MTSEA (Lo and
Silverman, 1998a,b). A positive charge on residues at the 163,
166, and 173 positions inhibits Na1 binding (negative charge
has no effect), a negative charge at position 170 increasesNa1
binding, but a positive charge (i.e., reaction with MTSEA or
MTSET) has no effect. The statistically significant increase in
Qdep/Qmax observed for Q170E, implies a greater distribution
of cotransporters in an outside-facing conformation, com-
pared to wt at Vh ¼ �50 mV, also consistent with increased
binding affinity for Na1. Collectively, these data suggest that
the glutamine at position 170 lies in the Na1 permeation
pathway. Another observation, which implicates a Na1
permeation pathway localization of 170, is the fact that
anionic MTSES reduces the Q170C Na1 leak.
308 Huntley et al.
Biophysical Journal 87(1) 295–310
Lo and Silverman previously demonstrated that replacement
of an alaninewith a cysteine at 166 effects a;50% reduction in
turnover number (Lo and Silverman, 1998b). Although the
cysteine mutation at 166 mimics the effects of cysteine
mutation at 170, the mutation does not duplicate the shift in
residue polarity; i.e., alanine to cysteine is a neutral to neutral
mutation, unlike glutamine to cysteine, which is polar to
neutral. Further, a charge-dependent effect on A166C turnover
number was observed, which is opposite to that found for 170.
Specifically, a positive point charge at 170 has no effect, but
a negative point charge significantly reduces substrate
turnover. For the 166 cysteine mutant, a positive ethylamine
group causes a significant reduction in turnover. Therefore,
althoughmutations at both the 166 and 170 positions influence
empty carrier kinetics and participate in Na1 interaction,
a border exists there that delineates charge specificity.
Just as a precise spatial organization appears to exist in the
loop region, from 163 to 173, with two regions delineated
with a border of charge specificity, there also appears to be an
emerging spatial organization to the more immediate
environment surrounding Q170. This Q170 spatial organiza-
tion is made evident by the differential effects of Q170C,
Q170A, Q170E, and Q170C after exposure to MTSES.
Replacement of polarity with neutrality, via the Q170C and
Q170Amutations, caused a substantial and equivalent change
in voltage sensitivity and a reduction in turnover number.
Neither MTSEA- nor MTSET-reacted Q170 had an effect
upon cotransporter function; therefore a positive charge is
benign. However, a negative charge, as observedwith Q170C
post-MTSES and Q170E, generated a profound reduction in
turnover number. Although the turnover trend was similar,
what was particularly informative was the differential effect
that Q170C post-MTSES and Q170E had upon function. The
negative charge of Q170E caused a reduction in turnover,
equivalent to Q170C and Q170A. After MTSES exposure,
Q170C caused a reduction in turnover that was approximately
twofold greater than Q170C, Q170A, and Q170E. This
difference in turnover reduction could be due to two different
mechanisms. The first involves the degree to which the
negative charge can extend out from the cotransporter
backbone. In this case, the negative charge of the ethyl-
sulfonate group likely has a greater radius of mobility than the
negative charge of the glutamic acid. Perhaps the ethyl-
sulfonate is able to move closer to a critical area in the three-
dimensional Q170 region. Another possible mechanism
involves a modifying effect by the polar disulfide bond of
the MTS-reacted Q170C upon the negative charge of the
ethylsulfonate. Either scenario indicates a charge-specific
spatial sensitivity in the immediate Q170 environment.
The Q170E mutant yielded valuable insights. For Q170E,
z is not significantly different from that of wt or Q170C. Since
the apparent valence represents the formal charge moved
through the electric field of the membrane, the fact that an
added negative charge at 170 is without significant
consequence upon z, suggests that the 170 position moves
very little during cotransporter charge transfer. Perhaps this
indicates that the residue at 170 influences charge transfer
and turnover by serving as a hinge or a gate that moves very
little during function. The finding that MTSET reacts with the
cysteine at Q170C but has no effect demonstrates that steric
hindrance is insufficient to explain the effects. Unfortunately,
a direct comparison cannot be drawn between the V0.5 values
of Q170C post-MTSES and Q170E, because of our inability
to fit a Boltzmann relation to MTSES-reacted Q170C.
Nevertheless, what is clear is that rather than an effect on
Na1 binding, reaction of Q170CwithMTSES has a profound
effect on charge transfer. Thus the Q170C post-MTSES
effects also point to position 170 being located in the vicinity
of a segment with the properties of a voltage sensor.
The Qdep/Qmax values of the investigated Q170 mutants
offer insight into empty carrier kinetics. The two neutral
mutants, Q170C and Q170A, exhibit a significant decrease
in Qdep contribution compared to wt rSGLT1. The negative
mutant Q170E, however, shows a significant increase inQdep
compared to wt. This suggests that cotransporter distribution
is influenced by polarity and charge at 170. Neutrality drives
cotransporter distribution toward inside facing. Moreover,
the Na1 dependence of the Q170C Qdep contribution to total
charge transferred, Qtotal, implies that once at the inside-
facing conformation, cotransporters do not easily move back
to outside-facing conformation. Q170E results indicate that
negative charge causes a cotransporter redistribution to
outside facing. Thus polarity and charge affect the carrier
distribution and reorientation, which is reflected in the
reduced turnover values of Q170C, Q170C post-MTSES,
Q170A, and Q170E.
A final consideration, concerning the reduced turnover
number, involves the aspect of the rate-limiting step.
Collectively, our findings imply that modification of charge
and polarity at the 170 position in rSGLT1 has a profound
effect on certain rate-limiting step(s) in cotransporter
function. In an attempt to localize the transition state(s) that
are being affected by the mutation at the 170 position,
we sought to compare the presteady-state behavior of wt
rSGLT1 with that of Q170C and with Q170C reacted with
MTSES. The transient currents of Q170C rSGLT1 clearly
possess multiorder exponential decay, a characteristic also
demonstrated by the transient currents of wt hSGLT1 (Chen
et al., 1996) and wt rSGLT1 (Krofchick and Silverman,
2003). Q170C transient currents are well resolved with third-
order exponential decay, for Vt values from �30 mV to 90
mV.Third-order exponential decay, appliedwithin this exper-
imental range, consistently generates three decay constants
that closely correspond to those of wt rSGLT1 (Krofchick
and Silverman, 2003). Both Q170C and wt rSGLT1 have
a slow decay (voltage-dependent, ts ¼ ;10–40 ms), a
medium decay (voltage-dependent, tm ¼ ;1.5–6 ms), and
a fast decay (voltage-independent, tf ¼ ;0.5–1.5 ms).
Chen and co-workers, in 1996, reported two decay
components for hSGLT1, even with zero trans Na1, and
Q170 of rSGLT1 Regulates Charge Transfer 309
Biophysical Journal 87(1) 295–310

attributed both decay components to empty carrier transitions.
The Na1 and voltage dependencies of Q170C rSGLT1 ts andtf are very similar to those reported by Chen’s group for wt
hSGLT1 (Chen et al., 1996), and Krofchick and Silverman
(2003) for wt rSGLT1. The voltage dependence of the slow
decay of Q170C exhibits a sigmoidal shape, very similar to the
sigmoidal shapes of the voltage dependencies of the slow
decays of wt hSGLT1 (Chen et al., 1996) and wt rSGLT1
(Krofchick and Silverman, 2003). The magnitude of the fast
decay component of Q170C, as well as its voltage-inde-
pendence, is also very similar to the fast decay components of
wt hSGLT1 (Chen et al., 1996) and wt rSGLT1 (Krofchick
and Silverman, 2003). The Na1 and voltage-dependent data of
Q170C rSGLT1 and wt rSGLT1 ts and tf, therefore, suggestthat these transitions correspond to the empty carrier
transitions of wt hSGLT1, determined by Chen et al. (1996).
A plausible candidate for the rate-limiting step of SGLT1 is
the slow transition (Fig. 1 B) C25 C3. Although the Q170C
mutation reduces turnover number by;50% compared to wt,
there is no change in any of the decay constants, including ts.Similarly, analysis of the time constants after reaction of
Q170C with MTSES also shows no significant change
compared to pre-MTSES or wt values. We conclude that
altered polarity and charge at the 170 glutamine position of
rSGLT1 affect a cotransporter conformational transition; this
is rate-limiting but probably not associated with reorientation
of empty carrier (i.e., the affected transition is not accounted
for by any of the transitions depicted in Fig. 1 B). Thisconclusion is consistent with the proposal of Parent and co-
workers, who suggested that the rate-limiting step of hSGLT1
is the Na1 binding/debinding event of the inside-facing
conformations (Parent et al., 1992b). This latter transition is
excluded from the four-state system depicted in Fig. 1 B, andwould not contribute to the decay components of the transient
currents. If the inside-facing Na1 binding/debinding transi-
tion is indeed the rate-limiting step, this might explain why
the Q170C mutation and the exposure of Q170C to MTSES
causes a reduction in turnover and a tendency toward
occupancy of inside-facing conformation.
On the basis of this study, we conclude that the glutamine
at 170 is of profound importance to rSGLT1 function.
Further investigations into the Q170 residue and the region
adjacent, should provide greater insight into the behavior of
the Na1/glucose cotransporter.
The authors acknowledge R. Reithmeier, D. Clarke, P. Backx, R. Tsushima,
and V. Khutorsky for helpful discussion.
This work was supported by a grant to M. Silverman (FRN-15267) as part
of the Canadian Institutes of Health Research Group in Membrane Biology
(FRN-25026).
REFERENCES
Chen, X. K., M. J. Coady, and J. Y. Lapointe. 1996. Fast voltageclamp discloses a new component of presteady-state currents from theNa1-glucose cotransporter. Biophys. J. 71:2544–2552.
Costa, A. C. S., J. W. Patrick, and J. A. Dani. 1994. Improved technique forstudying ion channels expressed in Xenopus oocytes, including fastsuperfusion. Biophys. J. 67:395–401.
Hediger, M. A., M. J. Coady, T. S. Ikeda, and E. M. Wright. 1987.Expression cloning and cDNA sequencing of the Na1/glucosecotransporter. Nature. 330:379–381.
Krofchick, D., and M. Silverman. 2003. Investigating the conformationalstates of the rabbit Na1/glucose cotransporter. Biophys. J. 84:3690–3702.
Lo, B., and M. Silverman. 1998a. Cysteine scanning mutagenesis of the seg-ment between putative transmembrane helices IV andV of the high affinityNa1/glucose cotransporter SGLT1. J. Biol. Chem. 273:29341–29351.
Lo, B., and M. Silverman. 1998b. Replacement of Ala-166 with cysteine inthe high affinity rabbit sodium/glucose transporter alters transportkinetics and allows methanethiosulfonate ethylamine to inhibit trans-porter function. J. Biol. Chem. 273:903–909.
Loo, D. D., A. Hazama, S. Supplisson, E. Turk, and E. M. Wright. 1993.Relaxation kinetics of the Na1/glucose cotransporter. Proc. Natl. Acad.Sci. USA. 90:5767–5771.
Panayotova-Heiermann,M., S. Eskandari,E.Turk,G.A.Zampighi, andE.M.Wright. 1997. Five transmembrane helices form the sugar pathway throughthe Na1/glucose cotransporter. J. Biol. Chem. 272:20324–20327.
Panayotova-Heiermann, M., D. D. Loo, C. T. Kong, J. E. Lever, and E. M.Wright. 1996. Sugar binding to Na1/glucose cotransporters is determinedby the carboxyl-terminal half of the protein. J. Biol. Chem. 271:10029–10034.
Panayotova-Heiermann, M., D. D. Loo, M. P. Lostao, and E. M. Wright.1994. Sodium/D-glucose cotransporter charge movements involve polarresidues. J. Biol. Chem. 269:21016–21020.
Parent, L., S. Supplisson, D. D. Loo, and E. M. Wright. 1992a. Electrogenicproperties of the cloned Na1/glucose cotransporter. I. Voltage-clampstudies. J. Membr. Biol. 125:49–62.
Parent, L., S. Supplisson, D. D. F. Loo, and E. M. Wright. 1992b.Electrogenic properties of the cloned Na1/glucose cotransporter. II. Atransport model under nonrapid equilibrium conditions. J. Membr. Biol.125:63–79.
Taglialatela, M., L. Toro, and E. Stefani. 1992. Novel voltage clamp torecord small, fast currents from ion channels expressed in Xenopusoocytes. Biophys. J. 61:78–82.
Vayro, S., B. Lo, and M. Silverman. 1998. Functional studies of the rabbitintestinal Na1/glucose carrier (SGLT1) expressed in COS-7 cells:evaluation of the mutant A166C indicates this region is important forNa1-activation of the carrier. Biochem. J. 332:119–125.
Zampighi, G. A., M. Kreman, K. J. Boorer, D. D. Loo, F. Bezanilla, G.Chandy, J. E. Hall, and E. M. Wright. 1995. A method for determiningthe unitary functional capacity of cloned channels and transportersexpressed in Xenopus laevis oocytes. J. Membr. Biol. 148:65–78.
310 Huntley et al.
Biophysical Journal 87(1) 295–310


