WG-AEN 016.2003.doc Page 1 of 63 European Commission Working Group Assessment of Exposure to Noise (WG-AEN) Position Paper Good Practice Guide for Strategic Noise Mapping and the Production of Associated Data on Noise Exposure Version 1 5 December 2003
Transcript
WG-AEN 016.2003.doc
Page 1 of 63
European Commission Working Group Assessment of Exposure to Noise
(WG-AEN)
Position Paper
Good Practice Guide for Strategic
Noise Mapping and the Production of Associated Data on Noise Exposure
Version 1
5 December 2003
WG-AEN 016.2003.doc
Page 2 of 63
Contents Page Chapter 1. Introduction 4 Chapter 2. General issues and specific technical challenges
raised by the END
2.1 Strategic noise maps (and mapping) 6 2.2 Assessment methods 7 2.3 Most exposed façade 8 2.4 Assessment point (grid spacing, contour mapping and reflections) 9 2.5 Assignment of noise levels to residential buildings 12 2.6 Assignment of population to residential buildings 14 2.7 Assignment of noise exposure levels to population 14 2.8 Dwelling 16 2.9 Determination of the number of dwelling units per residential building and population per dwelling unit 16 2.10 Agglomeration 17 2.11 Area to be mapped 18 2.12 Area outside are to be mapped 18 2.13 Places near major roads, major railways and major airports 18 2.14 Quiet areas in an agglomeration and in open country 19 2.15 Quiet façade 20 2.16 Relevant year as regards the emission of sound 20 2.17 Average year as regards the meteorological circumstances 21 2.18 Reviewing strategic noise maps 22 2.19 Special insulation against noise 22 2.20 Action plans 23
Chapter 3. Toolkits of solutions relating to specific challenges 3.1 Key for Toolkits and Tools 25 3.2 Toolkits for input data - source related issues Toolkit 1. Road traffic flow 26 Toolkit 2. Average road traffic speed 29 Toolkit 3. Composition of road traffic 31 Toolkit 4. Train speed 34 Toolkit 5. Sound power levels of industrial sources 35 3.3 Toolkits for input data - geographical issues Toolkit 6. Building heights 38 Toolkit 7. Obstacles 39 Toolkit 8. Cuttings and embankments in the site model 40 Toolkit 9. Sound absorption coefficients αr for buildings and barriers 41 3.4 Toolkits for input data - meteorological issues Toolkit 10. Occurrence of favourable sound propagation conditions 42 Toolkit 11. Humidity and temperature 43 3.5 Toolkits for input data - demographic issues Toolkit 12. Assignment of population data to residential buildings 44 Toolkit 13. Determination of the number of dwelling units per
residential building and the population per dwelling unit 46 3.6 Toolkits - miscellaneous issues Toolkit 14. Determination of agglomerations 47 Toolkit 15. Area to be mapped 48 Toolkit 16. Area outside the area being mapped 49
WG-AEN 016.2003.doc
Page 3 of 63
Contents Page References 51
Appendix 1 Membership of WG-AEN 52
Appendix 2 Introduction to the use of Geographical Information Systems (GIS) in noise mapping 53
Appendix 3 Dates and deadlines relating to the implementation
of the END 60
WG-AEN 016.2003.doc
Page 4 of 63
Chapter 1. Introduction 1.1 This Position Paper has been produced by the European Commission’s
Working Group - Assessment of Exposure to Noise (WG-AEN).
1.2 The purpose of this Position Paper is to assist Member States and their competent authorities to undertake noise mapping and produce the associated data required by Directive 2002/49/EC of the European Parliament and of the Council of 25 June 2002 relating to the assessment and management of environmental noise (commonly known as the Environmental Noise Directive and hereafter referred to as the END). This Position Paper addresses in particular those requirements associated with the first round of strategic noise mapping, which must be completed by 30 June 2007. It is not the purpose of this Position Paper to assist noise mapping software designers to develop software and systems that are consistent with the requirements of the END. Neither is it intended to address in detail the role of Geographical Information Systems (GIS) in noise mapping and the production of associated data. WG-AEN nevertheless recognises the importance of GIS in relation to the processing and management of data. Consequently, this Position Paper includes an introduction to the subject in Appendix 2.
1.3 This Position Paper benefits from the results of a two-part study concerning the identification and development of good practice in the field of noise mapping and the determination of associated information on the noise exposure of people. The study was funded by the UK Government’s Department for Environment, Food and Rural Affairs (Defra), and the main contractor was Wölfel Meßsysteme Software GmbH & Co. WG-AEN is extremely grateful to Defra, and Wölfel and their partners, for their contributions.
Part one of the study (ref. 1), completed in October 2002, was a questionnaire-based exercise to identify general issues and technical challenges that Member States believe they may need to resolve when they implement the requirements of the END.
Part two of the study (ref. 2), completed in April 2003, was to initiate the process of developing a good practice guide and associated toolkits to address the key issues and challenges identified in part one of the study.
1.4 A particular challenge for WG-AEN in preparing this document has been to consider how much guidance should be provided. WG-AEN has attempted to find an appropriate balance between the need for a consistent approach across Europe and the flexibility required by individual Member States to develop noise-mapping programmes that meet their own national needs.
WG-AEN 016.2003.doc
Page 5 of 63
1.5 Recommendations for dealing with the general issues and specific technical challenges identified by Member States in relation to implementing the first round of strategic noise mapping (2007) are discussed in Chapter 2. Options for dealing with a number of the technical challenges are further described by a series of toolkits, which are presented in Chapter 3.
1.6 This is the first version of WG-AEN’s Good Practice Guide. It does not cover all the key issues and challenges that have been identified nor does it attempt to specify the required accuracy of strategic noise mapping, as is also the case with the END. It is, however, the first step towards producing such a comprehensive document, which will evolve and develop during the coming years. Improved and extended versions of this Guide will be produced by WG-AEN, as appropriate.
1.7 WG-AEN invites comments from all stakeholders in order to assist in the development of this Good Practice Guide. Comments from noise mapping software specialists on the technical solutions that may be available, in particular in relation to the issues raised in section 2.4, would be most welcome. Please send comments to:
IMPORTANT NOTE This Good Practice Guide is intended to assist Member States in understanding and fulfilling the requirements of Directive 2002/49/EC. This document should not be considered as an official statement of the position of the European Commission. Only the text of the Directive is applicable in law. If in any circumstance, the recommendations contained in this guide seem to be at variance with the Directive, then the text of the Directive should be applied.
WG-AEN 016.2003.doc
Page 6 of 63
Chapter 2. General issues and specific technical challenges raised by the END
2.1 Strategic noise maps (and mapping)
Formal END Definition: Article 3 (r) ‘strategic noise map’ shall mean a map designed for the global assessment of noise exposure in a given area due to different noise sources or for overall predictions for such an area; Other occurrences in the END: Preliminary remarks (10) Article 5 (1) Article 7 (1), (2) Article 9 (1) Article 10 (2), (3), (4) Article 11 (4) Annex I (1) Annex IV Discussion 1 The acquisition of input data (particularly source related and geographic) required for the purposes of strategic noise mapping and the production of exposure data will be a major task for Member States. In some instances it may be impractical for a Member State to obtain real data i.e. data that has been measured directly or has been estimated using modelling techniques. WG-AEN’s recommendations 1 WG-AEN recommends that Member States use the Toolkits, provided in Chapter 3, to address and resolve data acquisition issues in the first round of strategic noise mapping. Toolkits 1 to 5 contain advice on issues relating to the way that the input data on noise sources required for the production of strategic noise maps may be acquired or, if unavoidable, estimated. However, even for the first round of
WG-AEN 016.2003.doc
Page 7 of 63
strategic noise mapping WG-AEN strongly recommends that every effort should be made to obtain accurate real data on noise sources. Toolkits 6 to 9 provide advice on issues relating to the way that geographical data may be acquired or can be estimated. Toolkits 10 and 11 provide advice on issues relating to the way that meteorological data may be acquired or estimated. In all the above cases where data has to be estimated because real data cannot be obtained, the methods / solutions - the Tools - provided in Toolkits 1-11 that produce the highest possible accuracy, within the limits of practicality, should be used. Low accuracy Tools should only be used when there is absolutely no alternative. The Toolkits are grouped according to the type of issues they address, rather than by any assessment of their relative importance. Discussion 2 The purpose of strategic noise mapping is primarily threefold; to provide the EC with strategic estimates of noise exposure across Europe to assist in the future development of European noise policy, to provide information to the public and decision makers on noise exposure locally, nationally and internationally and finally, to develop action plans. However, the use of the terms ‘strategic noise maps’ and ‘global assessment’ in the formal definition can be taken to imply that a certain amount of approximation may be made in the production of these maps and the associated data on noise exposure. This is unlikely to cause any significant difficulties in providing global assessments of noise exposure for the EC and for providing the public with suitable data in the form of maps or tables. However, it may cause difficulties in developing detailed action plans. These difficulties are identified and discussed in section 2.20. WG-AEN’s recommendations 2
In the first round of strategic noise mapping some approximations in relation to the assignment of noise levels to residential buildings, the assignment of the population to residential buildings and in the determination of the exposure to noise of people living in these residential buildings should be accepted. Examples of good practice in respect of making such approximations are provided in turn in sections 2.5, 2.6 and 2.7 and in associated Toolkits 12 and 13 which relate to demographic data issues.
2.2 Assessment methods Explanation Annex II (1) of the END indicates that values of Lden and Lnight can be determined by computation or measurement methods (at the assessment
WG-AEN 016.2003.doc
Page 8 of 63
position). Other occurrences in the END Article 5 (1) Article 6 (1), (2) Discussion The measurement of the yearly average noise levels at all the assessment positions required by the END, or at a representative number of such positions is likely to require an impractically large number of long term noise measurements. Furthermore, as indicated in Annex II (1) of the END, when predicting the effects of proposed actions on noise levels, only computation methods are applicable. This means that if noise mapping is carried out by measurement it will be difficult to fully evaluate the impact of proposed action plans or new developments. WG-AEN’s recommendations The END permits the use of noise measurement for strategic noise mapping and it would be inappropriate for WG-AEN to recommend that noise measurement should not be used for this purpose. Nevertheless, WG-AEN encourages Member States and their competent authorities to undertake the first round of strategic noise mapping for the END using computation methods wherever possible. WG-AEN recognises that some noise measurement is essential to the development and validation of computation methods. It also has a role to play in the verification of noise mapping results, in the development of the local elements of action plans and in the assessment of the effectiveness of implemented action plans. 2.3 Most exposed façade Explanation Annex I (1) of the END indicates that when computation methods are used for the purpose of strategic noise mapping in relation to noise exposure in and near buildings, the assessment points must be at the most exposed façade and that for this purpose, the most exposed façade will be the external wall facing onto and nearest to the specific noise source. Other occurrences in the END: Annex VI (1.5), (1.6) Discussion The above text defines the most exposed façade in term of geometry, not in terms of noise level. If this is taken literally in some instances the most
WG-AEN 016.2003.doc
Page 9 of 63
exposed façade will not be the façade exposed to the highest noise level from a specific category of source. For example, where road traffic noise from more than one road affects a building. WG-AEN’s recommendations The most exposed façade should be taken to be the façade exposed to the highest noise level from the specific category of noise source under consideration (e.g. road traffic). 2.4 Assessment point (grid spacing, contour mapping and reflections). Explanation An assessment point is a physical location at which noise levels need to be measured or calculated for the purpose of producing data to comply with the requirements of the END. Occurrences in the END: Annex I (1), (2) Discussion Some of the terms in the END require careful consideration to ensure consistency in the calculation of noise levels in various situations: In Annex I (1) of the END it is stated that assessment points have to be located ‘at the most exposed façade’ and that for the purposes of determining noise levels (at the assessment points) in terms of Lden and Lnight only the incident sound is considered. It is not clear precisely what at means. In Annex 6 (1.5) of the END, the term ‘on the most exposed façade’ is used. A different description is given in Annex VI (1.5), (2.5) where the concept of ‘a quiet façade’ is outlined 1. Such a façade of a dwelling is one where the Lden (or Lnight), assessed ‘two metres in front of the façade’, for the noise from a specific noise source, is 20 dB lower than the Lden (or Lnight) ‘on the façade’ of the dwelling having the highest value of Lden (or Lnight). Finally, a further complication is introduced in that noise levels at grid points also have to be assessed in order to produce some of the data required by the END (e.g. for producing noise contours – see Annex VI (2.7) of the END). Unless the relevant sections described above are interpreted in a pragmatic way to reflect the overall aims of the END, it appears that 3 sets of noise level calculations might have to be carried out in terms of both Lden and Lnight to satisfy the requirements of the END. In summary these are: 1 It should be noted that the provision of data to the EC on the number of people living in dwellings with a quiet façade is not a mandatory requirement of the END.
WG-AEN 016.2003.doc
Page 10 of 63
• Set 1. Calculation of noise levels at or on assessment points at building façades, which do not include reflections from the façade in question, in order to determine the levels on the most exposed façade;
• Set 2. Calculation of noise levels at grid points that are not linked to facades and which, therefore, include all reflections (within the limitations of available computing power and time) or no reflections at all. These grid-based levels may then be used to produce the noise contour maps that need to be provided to the EC (see Annex VI (2.7) of the END). Such maps or other types of map developed from the contour maps (e.g. conflict maps) may also be used by Member States to present information to the public and decision makers domestically; and
• Set 3. Calculation of noise levels at assessment points 2 metres from building façades in order to identify the existence of a quite façade. It is not clear from the END whether such calculations should include a reflection from the façade in question;
WG-AEN’s recommendations For the moment WG-AEN’s recommendations must be pragmatic and simple. Therefore, WG-AEN recommends that Member States should carry out just one set of grid-based calculations (using nominally a 10 metre grid spacing) for the first round of END strategic noise mapping. These calculations should include at least all first order reflections. The grid-based noise level results should be used for producing noise maps (e.g. contour maps) to inform the public and to fulfil some of the END reporting requirements. However, in order to produce data on the noise exposure of people living in dwellings also required by the END, and the optional data needed to identify the existence of quiet facades, a correction of minus 3dB should be applied to any grid-based levels that are attributed/allocated to residential buildings and subsequently to the residents of these buildings for determining estimates of noise exposure. Although this 3dB adjustment is a compromise, and will cause some inaccuracies, WG-AEN believes that such an approach is justified in the first round of END strategic noise mapping as the inaccuracies that will result from data deficiencies are likely to be much more significant. Section 2.5 provides recommendations on how grid-based noise levels may be assigned to residential buildings. An alternative approach which may help Member States develop mapping programmes to meet their national requirements would be to produce 2 or 3 sets of strategic noise mapping data. Set 1 should be produced from the direct calculation of noise levels at building facades in order to identify the most exposed façade. In this case it is recommended that a calculation should be carried out every 3m around the
WG-AEN 016.2003.doc
Page 11 of 63
building envelope and that at least first order reflections are included other than those from the façade in question. Set 2 should be grid-based and should include at least all first order reflections. The grid spacing should normally be a uniform 10m in built up areas. However, it may be necessary to reduce this to 5m where, for example, there are narrow streets or relatively small gaps between large buildings. In large open areas the grid spacing could be increased to 25 to 30m. Set 3 should be the optional data, which will permit the identification of a quiet façade. This should be calculated directly at a distance of 2m from the façade in question and should be carried out every 3m. Such calculations should take no account of reflections from the façade in question so that direct comparisons with the noise level calculated on the most exposed façade are made possible. Caution. If Member States choose to use the alternative approach they should note that grid-based noise contour maps produced from data set 2 would include reflections from all facades (or none) and, therefore, may show different noise levels just outside buildings to data sets 1 and 3 as these data sets will not include the reflection from the façade in question.
WG-AEN 016.2003.doc
Page 12 of 63
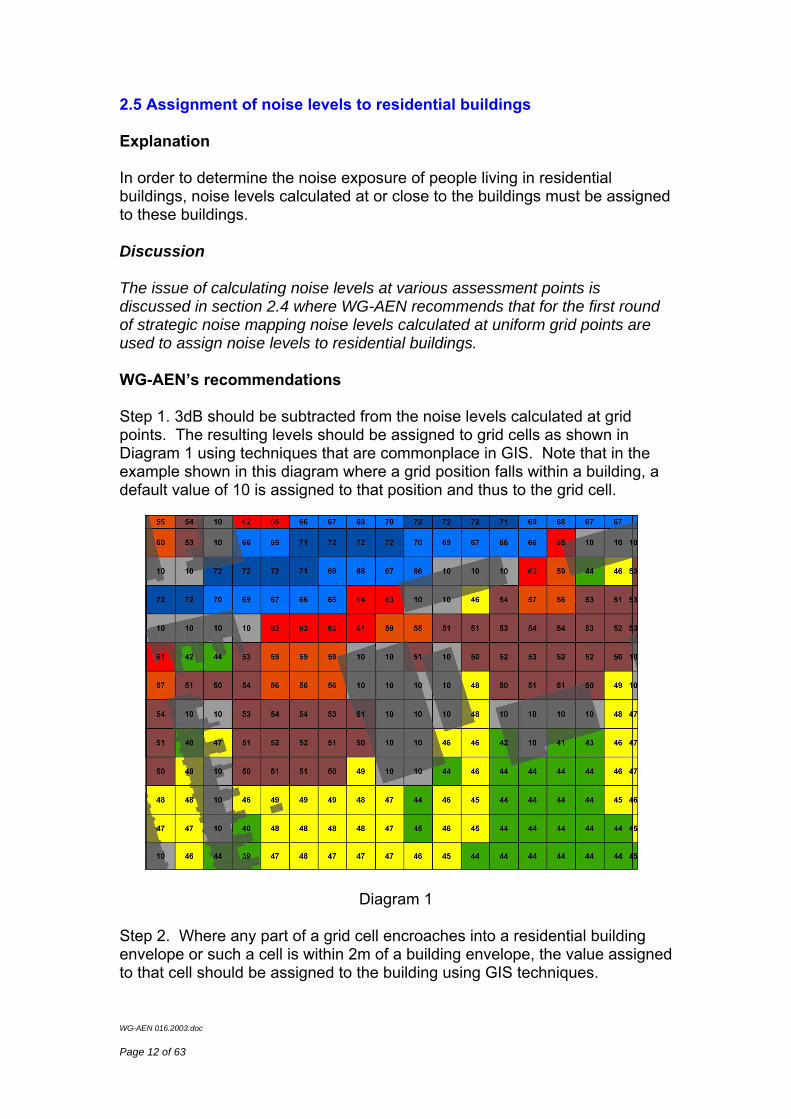
2.5 Assignment of noise levels to residential buildings Explanation In order to determine the noise exposure of people living in residential buildings, noise levels calculated at or close to the buildings must be assigned to these buildings. Discussion The issue of calculating noise levels at various assessment points is discussed in section 2.4 where WG-AEN recommends that for the first round of strategic noise mapping noise levels calculated at uniform grid points are used to assign noise levels to residential buildings. WG-AEN’s recommendations Step 1. 3dB should be subtracted from the noise levels calculated at grid points. The resulting levels should be assigned to grid cells as shown in Diagram 1 using techniques that are commonplace in GIS. Note that in the example shown in this diagram where a grid position falls within a building, a default value of 10 is assigned to that position and thus to the grid cell.
Diagram 1
Step 2. Where any part of a grid cell encroaches into a residential building envelope or such a cell is within 2m of a building envelope, the value assigned to that cell should be assigned to the building using GIS techniques.
WG-AEN 016.2003.doc
Page 13 of 63
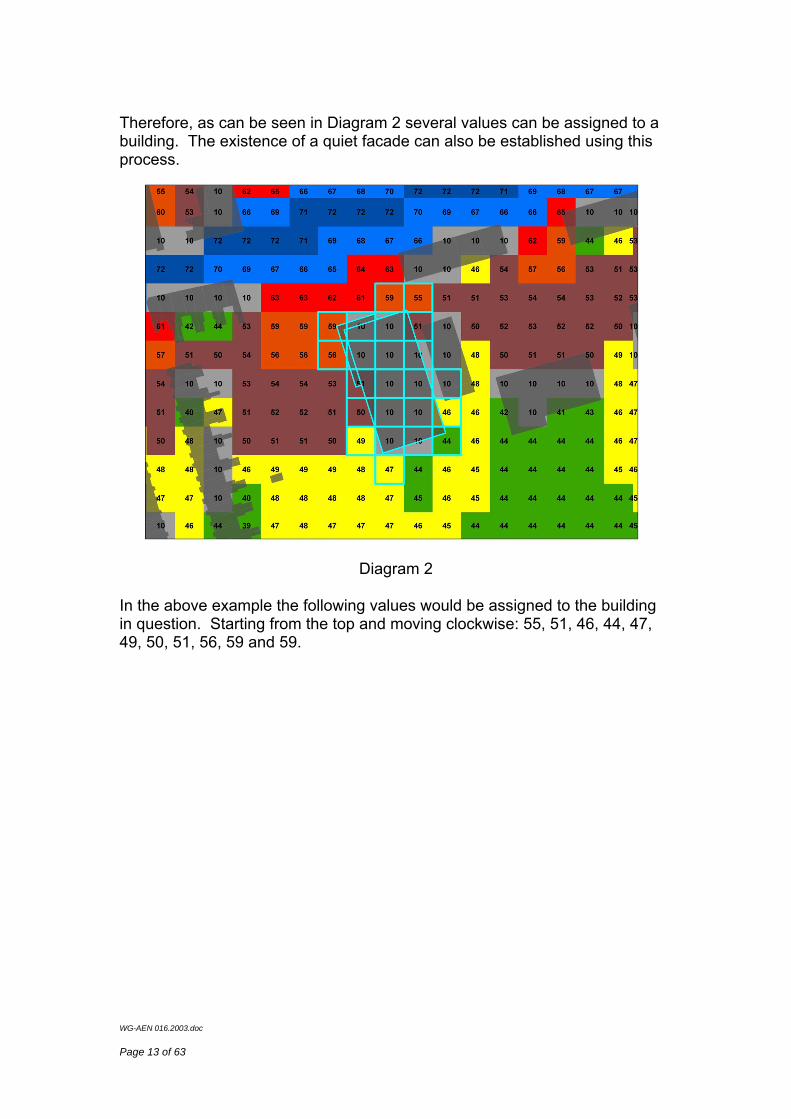
Therefore, as can be seen in Diagram 2 several values can be assigned to a building. The existence of a quiet facade can also be established using this process.
Diagram 2
In the above example the following values would be assigned to the building in question. Starting from the top and moving clockwise: 55, 51, 46, 44, 47, 49, 50, 51, 56, 59 and 59.
WG-AEN 016.2003.doc
Page 14 of 63
2.6 Assignment of population to residential buildings Explanation Annex VI of the END requires that the Commission is provided with estimates of the number of people living in dwellings exposed to noise levels that fall into specific noise bands. Discussion Some Member States may not have detailed data on population distribution. WG-AEN’s recommendations If a Member State does not have data that can be used to satisfactorily estimate the number of people living in individual residential buildings Toolkit 12 may be used. This toolkit provides a number of options for producing such estimates. 2.7 Assignment of noise exposure levels to the population Explanation Section 2.5 and Toolkit 12 provide methods for assigning noise levels and population estimates to residential buildings. This section deals with assigning the population living in a multi-occupied residential building to the different noise levels that will be assigned to that building. Discussion Whichever method of assigning noise levels to buildings is adopted (as discussed in section 2.4) this may result in several noise values being assigned to multi-occupied residential buildings. The question remains as to how to distribute the population living in these multi-occupied residential buildings to the assigned noise levels. WG-AEN’s recommendations The recommended method for distributing noise exposure to the population of a residential building in multi-occupation is best demonstrated by way of the example shown in Diagram 3. This example uses grid-based noise levels but would be equally applicable to directly calculated façade noise levels.
WG-AEN 016.2003.doc
Page 15 of 63
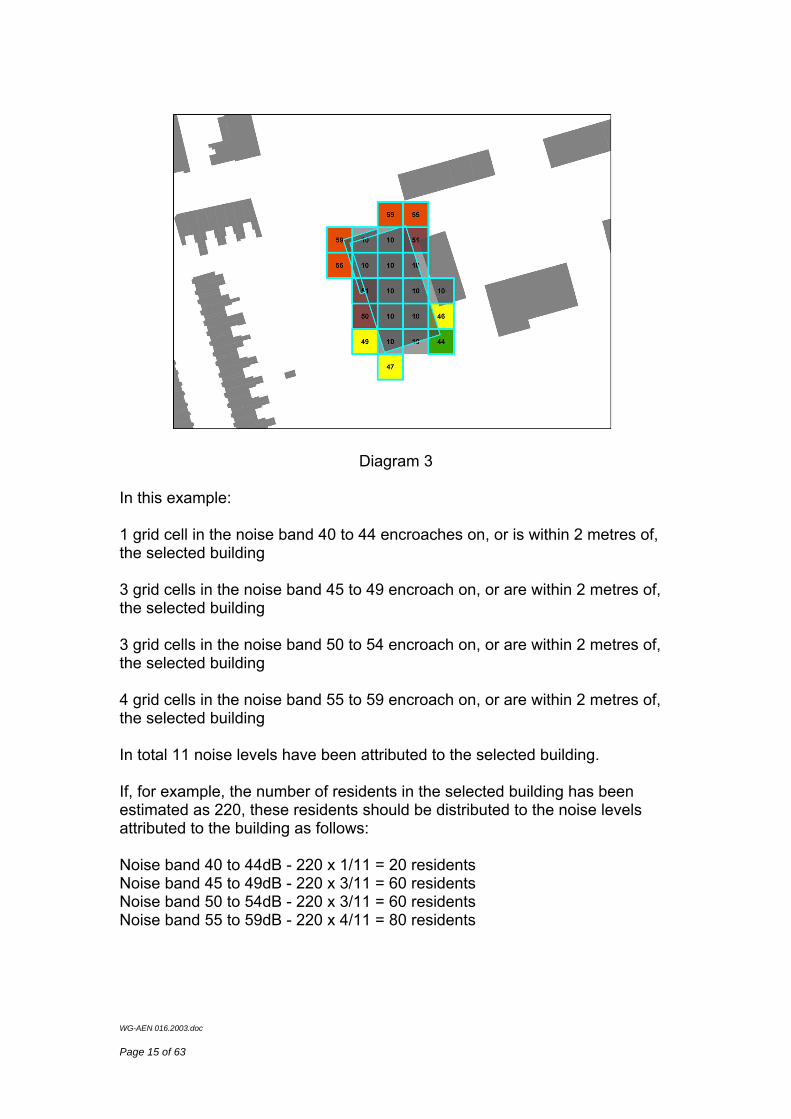
Diagram 3
In this example:
1 grid cell in the noise band 40 to 44 encroaches on, or is within 2 metres of, the selected building 3 grid cells in the noise band 45 to 49 encroach on, or are within 2 metres of, the selected building 3 grid cells in the noise band 50 to 54 encroach on, or are within 2 metres of, the selected building 4 grid cells in the noise band 55 to 59 encroach on, or are within 2 metres of, the selected building In total 11 noise levels have been attributed to the selected building. If, for example, the number of residents in the selected building has been estimated as 220, these residents should be distributed to the noise levels attributed to the building as follows: Noise band 40 to 44dB - 220 x 1/11 = 20 residents Noise band 45 to 49dB - 220 x 3/11 = 60 residents Noise band 50 to 54dB - 220 x 3/11 = 60 residents Noise band 55 to 59dB - 220 x 4/11 = 80 residents
WG-AEN 016.2003.doc
Page 16 of 63
2.8 Dwelling Occurrences in the END: Article 3 (q) Annex I (1) Annex III Annex IV (1) Annex VI (1.5), (1.6) Discussion Unfortunately, a degree of confusion has arisen as some translations of the END refer to dwellings in the context of buildings (D: Gebäude or F: bâtiment). Other translations refer to dwellings in the context of “dwelling units”. WG-AEN’s recommendations In the case of buildings, refer to the English version of the END text. In all cases where the term ‘dwelling’ is used in the END, this should be interpreted as meaning ‘dwelling unit’ – i.e. as far as practicable calculations and estimates should be made for each individual dwelling unit. 2.9 Determination of the number of dwelling units per residential building and population per dwelling unit Explanation Annex VI of the END requires that Member States provide information to the Commission on the estimated number of dwellings, and people that live in dwellings, that are in areas where the values of Lden are higher than 55, 65 and 75. Discussion If WG-AEN’s recommended method for assigning noise exposure levels to the population living in multi-occupied residential buildings (section 2.7) is used, the estimation of population per dwelling unit is not needed. However, numbers of dwelling units will still be needed to satisfy the reporting requirements of Annex VI of the END. WG-AEN’s recommendation To determine or estimate the number of dwelling units and, if necessary, the population per dwelling unit refer to Toolkit 13.
WG-AEN 016.2003.doc
Page 17 of 63
2.10 Agglomeration Formal END Definition: Article 3 (k) ‘agglomeration’ shall mean part of a territory, delimited by the Member State, having a population in excess of 100,000 persons and a population density such that the Member State considers it to be an urbanised area; Other occurrences in the END:
Article 7 (1), (2)
Article 8 (1), (2)
Annex IV (3)
Annex V (1)
Annex VI (1), (2.2), (2.5), (2.6), (2.7)
Discussion The END provides insufficient information to interpret the general term ‘agglomeration’. The use of a density criterion may be required for practical purposes. In this case the definition provided in Article 2, Paragraph 9 of the European Union Directive 1999/30/EC (ref. 3) may be of help and is as follows: ‘a zone with a population concentration in excess of 250,000 inhabitants or, where the population concentration is 250,000 or less, a population density per km2 for which the Member States justifies the need for ambient air quality to be assessed and managed.’ However, in both the END and 1999/30/EC the final decision on how to identify agglomerations is left to Member States.
WG-AEN’s recommendations If a Member State has an established definition of an agglomeration or an urbanised area, this definition may be applied as long as it does not infringe the definition of agglomeration provided in the END. If a Member State does not have an established definition of an agglomeration, that Member State should consider adopting one of the definitions used by another Member State as long as it does not infringe the definition in the END. This course of action may be most appropriate where the Member States are neighbours with similar geography and infrastructure. Also see Toolkit 14.
WG-AEN 016.2003.doc
Page 18 of 63
2.11 Area to be mapped Explanation In the case of agglomerations the area to be noise mapped depends on the Member States definition of an agglomeration. In the case of major roads, railways and airports the situation is unclear. Discussion In the case of major roads, railways and airports, both inside and outside agglomerations, strategic noise mapping has to be carried out in all areas where the Lden is equal to or greater than 55dB and in all areas where the Lnight is equal to or greater than 50dB. WG-AEN’s recommendation To determine the area to be mapped around major roads, railways and airports, refer to Toolkit 15. 2.12 Area outside area to be mapped Explanation When noise mapping an agglomeration some noise sources outside the agglomeration boundary may have significant noise impacts within the agglomeration. Discussion Some roads, railways, airports and industrial sites outside the boundary of an agglomeration will contribute significantly to noise levels within an agglomeration. Such sources need to be considered when noise mapping an agglomeration. WG-AEN’s recommendation To determine the area outside an agglomeration where there are noise sources that need to be considered within the agglomeration, refer to Toolkit 16. 2.13 Places near major roads, major railways and major airports Explanation Article 8 (1) requires that action plans should be drawn up for places near the major roads (major railways, major airports).
WG-AEN 016.2003.doc
Page 19 of 63
Discussion This is the only use of this terminology in the END (explicitly for the first phase of the implementation of the END i.e. action planning for 2008). The issue is, what is the definition of ‘near’. WG-AEN’s recommendations The definition of ‘near’ should be based on the requirements for data to be sent to the Commission (see Annex VI (1.5), (1.6), (2.5), (2.6) of the END). Therefore, places near major roads, major railways and major airports should be taken to be places where an Lden of 55 dB or an Lnight of 50 dB is exceeded. Refer also to Toolkit 15 (Area to be mapped).
2.14 Quiet areas in an agglomeration and in open country
Formal END Definitions: Article 3 (l) ‘quiet area in an agglomeration’ shall mean an area, delimited by the competent authority, for instance which is not exposed to a value of Lden or of another appropriate noise indicator greater than a certain value set by the Member State, from any noise source; Article 3 (m) ‘quiet area in open country’ shall mean an area, delimited by the competent authority, that is undisturbed by noise from traffic, industry or recreational activities; Other occurrences in the END: Preliminary remarks (8) Article 2 (1) Article 8 (1b) Article 11(2c) Annex I (3) Annex V (1) Discussion There are differences between quiet areas in an agglomeration and in the open country. While both require the areas to be delimited by the competent authority:
• in agglomerations, it is suggested that ‘quiet’ could be described by a value of Lden (or by another appropriate noise indicator), which has to be defined by the Member States. This would be more or less a quantitative acoustical definition.
WG-AEN 016.2003.doc
Page 20 of 63
• in the open country, ‘quiet’ is required to be ‘undisturbed by noise from traffic, industry or recreational activities’. This is a more qualitative acoustical definition.
With regard to the second bullet point, it should be noted that the END does not require the acquisition of data on recreational noise. Furthermore, in the open country there is no requirement to acquire data on industrial noise and data on non-major roads, railways and airports. Recently, an EC sponsored study was carried out on the definition, identification and preservation of urban and rural quiet areas (ref. 4).
WG-AEN’s recommendations WG-AEN needs to fully evaluate the report on the EC sponsored study on the definition, identification and preservation of urban and rural quiet areas before making any formal recommendations in relation to these areas.
2.15 Quiet façade
Explanation According to Annex VI (1.5), (1.6) of the END, a façade is ‘quiet’ if its value of Lden is more than 20 dB lower than at the façade having the highest Lden level. Other occurrences in the END: Annex III Discussion According to the above explanation a quiet façade could be exposed to relatively high levels of noise. For example, a façade exposed to an Lden of 60dB would be considered quiet if the noise level on the most exposed façade of the same dwelling unit was an Lden of 81dB. Therefore, it would seem sensible to identify an upper noise limit for a quiet façade. WG-AEN’s recommendation It is recommended that to be ‘quiet’ a façade should not be exposed to an Lden of 55 dB or more. 2.16 Relevant year as regards the emission of sound Explanation Annex I (1) states that ‘a year is a relevant year as regards the emission of sound and an average year as regards meteorological circumstances’. Other occurrences in the END Annex I (2)
WG-AEN 016.2003.doc
Page 21 of 63
Discussion The above explanation indicates that all emission data shall relate to the continuous period of twelve months of a calendar year (January to December). It should be borne in mind that the relevant year for the first round of strategic noise mapping required by the END is 2006. As Member States may need to start noise mapping before 2006 in order to complete by June 2007, 2006 emission data may have to be predicted based on earlier years actual emission data, bearing in mind the three year rule (see Article 5 (1) of the END). This means that the earliest emission data that can be used as a base for the first round of strategic noise mapping is that from 2003. WG-AEN’s recommendation No recommendation is needed.
2.17 Average year as regards the meteorological circumstances
Explanation Annex I (1) states that ‘a year is a relevant year as regards the emission of sound and an average year as regards meteorological circumstances’. Other occurrences in the END: Annex I (2)
Discussion The meteorological year is a continuous 12-month period comprising all 4 seasons but excluding periods when weather conditions that are considered particularly extreme for a specific area occur in that area. An average year has to be determined by averaging several meteorological years. The question is how many? WG-AEN’s recommendations Ideally, the required meteorological data should be acquired from site measurements e.g. within the agglomeration to be mapped. If this is not possible, measurements from a nearby site that is meteorologically representative2 of the site of interest may be used. To minimize the effect of temporary weather extremes, it is recommended that the typical meteorological year is described by taking a ten-year average of the occurrence of the different types of weather conditions. To determine the long-term equivalent sound level, measurements of meteorological data should comply with ISO 1996-2:1987 (ref. 5). 2 ‘Representative’ has been used because a nearby site may not be representative in meteorological terms. It must be emphasised that ‘representative’ is a much more stringent criterion than ‘nearby’: a measurement site can be ‘nearby’ without necessarily being representative, i.e. meteorological measurements on top of a rock face are not representative for the bottom of the valley.
WG-AEN 016.2003.doc
Page 22 of 63
Refer also to Toolkit 10. This Toolkit provides suggested default values for meteorological conditions. However, as with some other toolkits, (see section 2.1) WG-AEN strongly recommends that every effort should be made to obtain real data.
2.18 Reviewing strategic noise maps
Explanation Article 7 (5) of the END requires that noise maps shall be reviewed, and revised if necessary, at least every five years after the date of their preparation. Discussion The Directive does not define when a review and possible revision of strategic noise maps is necessary other than at least every five years. However, if a major development takes place during this five-year period, some maps or parts thereof (and action plans) may need to be reviewed and revised. WG-AEN’s recommendations Member States should develop their own criteria for reviewing and revising strategic noise maps over and above that specifically required by the Directive (i.e. every five years). 2.19 Special insulation against noise Explanation In Annex VI (1.5) it is stated that special insulation against the noise in question means ‘special insulation of a building against one or more types of environmental noise, combined with such ventilation or air conditioning facilities that high values of insulation against environmental noise can be maintained’. Other occurrences in the END Annex III Annex VI (2.5) Discussion
It is not a mandatory requirement of the END to provide the number of persons living in dwellings with special insulation against noise. In Annex VI (1.5) the END states ‘…where appropriate and where such information is available’. However, there is a need to define what constitutes ‘special insulation’ as this can have a different meaning in different Member States.
WG-AEN 016.2003.doc
Page 23 of 63
For example, in the Nordic countries high levels of insulation are routinely provided in residential buildings for thermal, not acoustic purposes. Nevertheless, this thermal insulation may also have excellent noise insulation properties. WG-AEN’s recommendations It is recommended that Member States should only identify that special noise insulation has been installed in dwelling units if glazed (and, if appropriate, roofed) areas have been specially treated to improve the sound insulation to external noise. Furthermore, suitable sound insulated air conditioning or ventilation units should also have been installed. All this work should have been undertaken either:
• to satisfy a requirement of a planning consent for the construction of the dwelling unit; or
• as part of a special noise insulation programme/scheme which has been undertaken to reduce the impact of external noise in an existing dwelling unit.
It is also recommended that dwelling units designed so that windows to habitable rooms do not face onto a nearby noise source, should be counted as having special insulation for the purpose of END reporting. 2.20 Action plans Formal END Definition: Article 3 (t) ‘action plans’ shall mean plans designed to manage noise issues and effects, including noise reduction if necessary; Other occurrences in the END: Article 4 (1) Article 8 Article 10 (4) Annex IV (4), (6) Annex V Annex VI (1.8), (2.8) Discussion Strategic noise mapping as discussed in section 2.1 is likely to produce data on noise exposure that is sufficiently accurate and robust for it to be used for the evaluation of possible international or national strategic noise
WG-AEN 016.2003.doc
Page 24 of 63
management or reduction initiatives. However, at a local level strategic noise mapping is only likely to produce an indication of where local action may be required. In order to identify whether or not there is a real need to take local action, and what this local action should be in order to reduce noise where necessary without increasing it elsewhere, more detailed and in-depth noise modelling/mapping may need to be undertaken. WG-AEN’s recommendations One of the first elements of any action plan should be to examine the results of strategic noise mapping, carried out for the global assessment of noise exposure, to identify specific areas where more detailed noise modelling/mapping and noise exposure assessment should be undertaken.
WG-AEN 016.2003.doc
Page 25 of 63
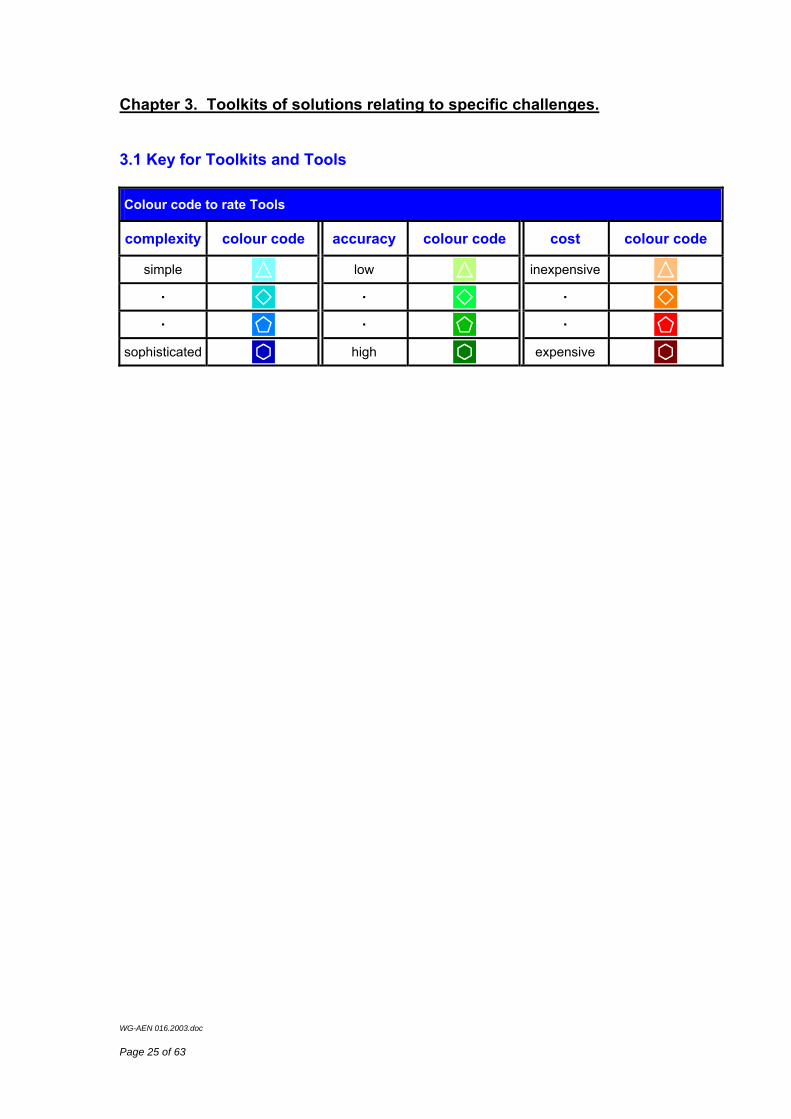
Chapter 3. Toolkits of solutions relating to specific challenges. 3.1 Key for Toolkits and Tools Colour code to rate Tools
3.2 Toolkits for input data - source related issues
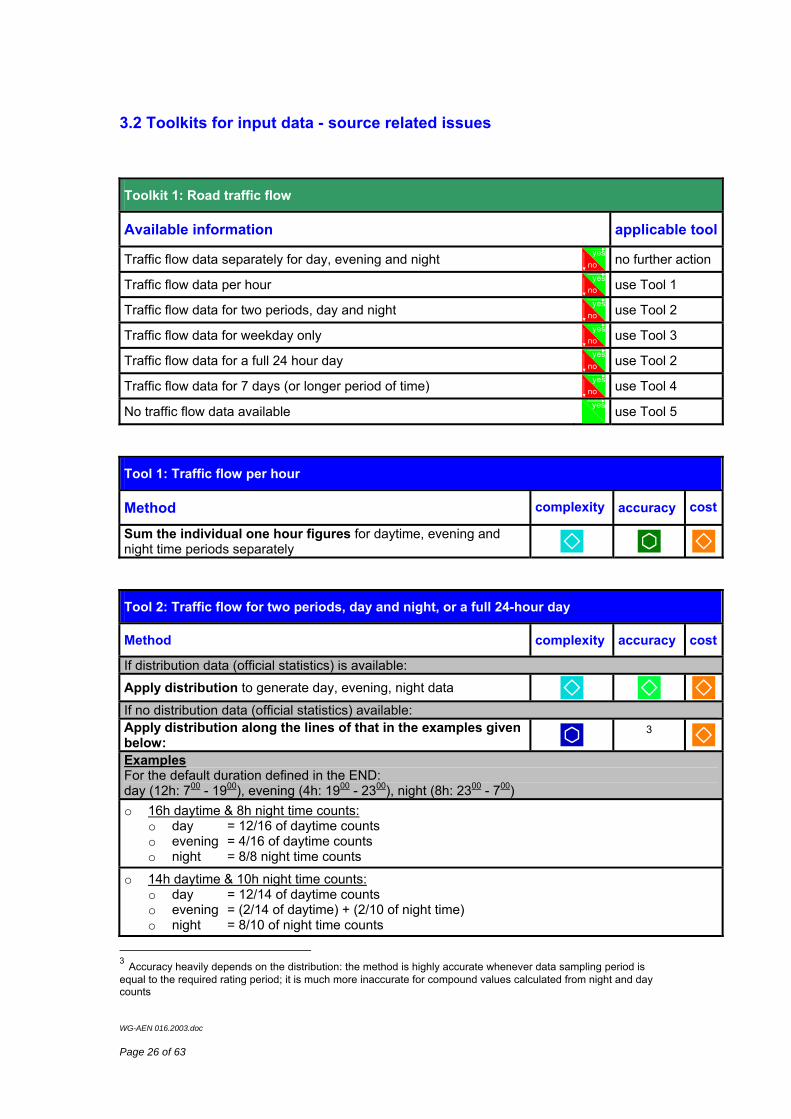
Toolkit 1: Road traffic flow
Available information applicable tool
Traffic flow data separately for day, evening and night yesno no further action
Traffic flow data per hour yesno use Tool 1
Traffic flow data for two periods, day and night yesno use Tool 2
Traffic flow data for weekday only yesno use Tool 3
Traffic flow data for a full 24 hour day yesno use Tool 2
Traffic flow data for 7 days (or longer period of time) yesno use Tool 4
No traffic flow data available yes
use Tool 5
Tool 1: Traffic flow per hour
Method complexity accuracy cost
Sum the individual one hour figures for daytime, evening and night time periods separately
Tool 2: Traffic flow for two periods, day and night, or a full 24-hour day
Method complexity accuracy cost
If distribution data (official statistics) is available: Apply distribution to generate day, evening, night data If no distribution data (official statistics) available: Apply distribution along the lines of that in the examples given below:
3 Examples For the default duration defined in the END: day (12h: 700 - 1900), evening (4h: 1900 - 2300), night (8h: 2300 - 700) o 16h daytime & 8h night time counts:
o day = 12/16 of daytime counts o evening = 4/16 of daytime counts o night = 8/8 night time counts
o 14h daytime & 10h night time counts: o day = 12/14 of daytime counts o evening = (2/14 of daytime) + (2/10 of night time) o night = 8/10 of night time counts
3 Accuracy heavily depends on the distribution: the method is highly accurate whenever data sampling period is equal to the required rating period; it is much more inaccurate for compound values calculated from night and day counts
WG-AEN 016.2003.doc
Page 27 of 63
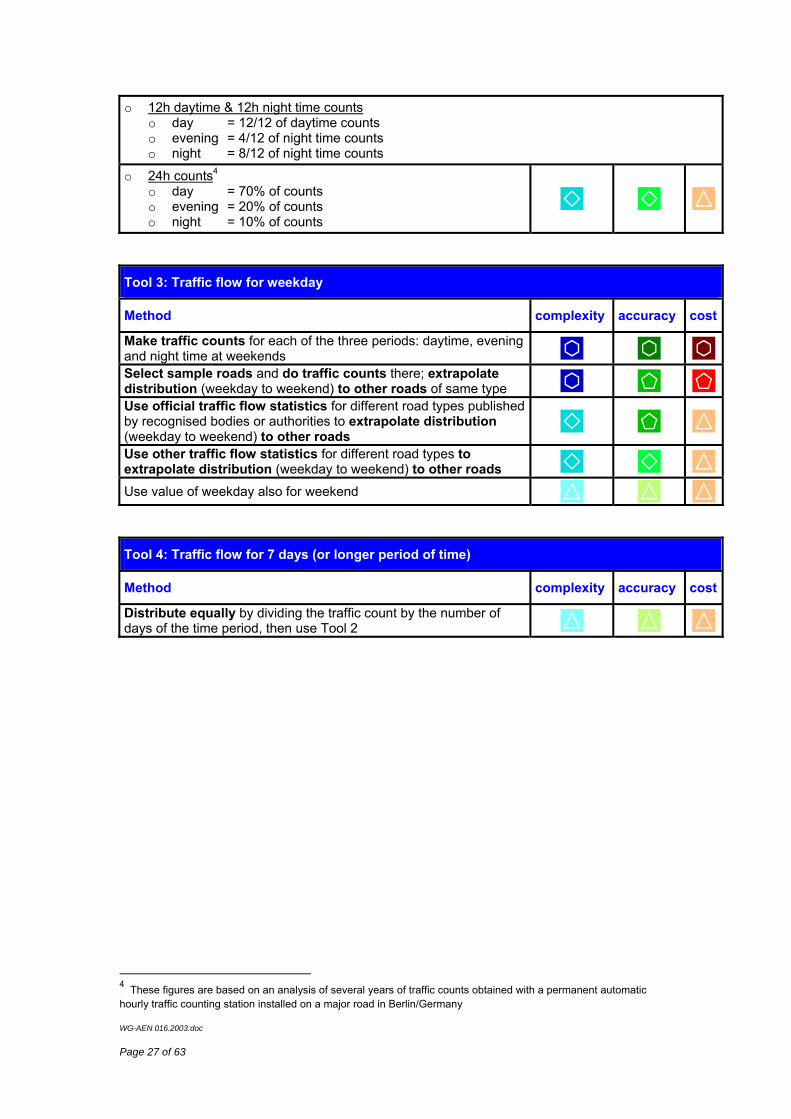
o 12h daytime & 12h night time counts o day = 12/12 of daytime counts o evening = 4/12 of night time counts o night = 8/12 of night time counts
o 24h counts4 o day = 70% of counts o evening = 20% of counts o night = 10% of counts
Tool 3: Traffic flow for weekday
Method complexity accuracy cost
Make traffic counts for each of the three periods: daytime, evening and night time at weekends Select sample roads and do traffic counts there; extrapolate distribution (weekday to weekend) to other roads of same type Use official traffic flow statistics for different road types published by recognised bodies or authorities to extrapolate distribution (weekday to weekend) to other roads
Use other traffic flow statistics for different road types to extrapolate distribution (weekday to weekend) to other roads Use value of weekday also for weekend
Tool 4: Traffic flow for 7 days (or longer period of time)
Method complexity accuracy cost
Distribute equally by dividing the traffic count by the number of days of the time period, then use Tool 2
4 These figures are based on an analysis of several years of traffic counts obtained with a permanent automatic hourly traffic counting station installed on a major road in Berlin/Germany
WG-AEN 016.2003.doc
Page 28 of 63
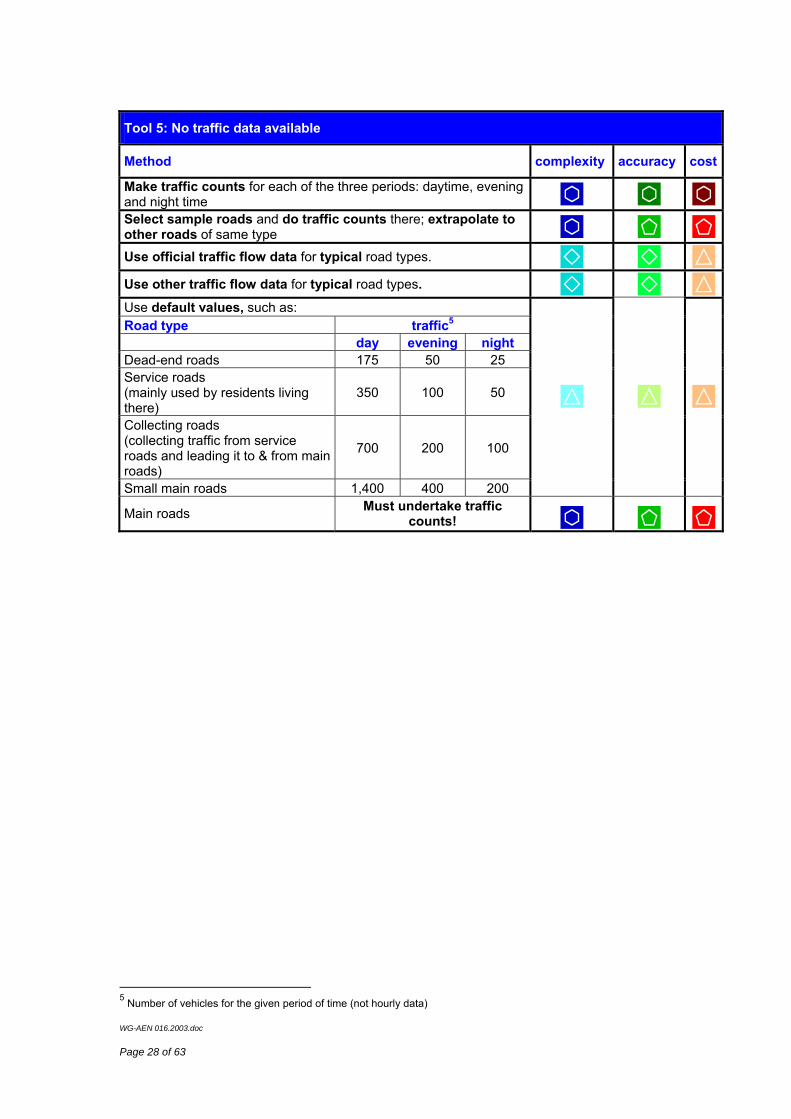
Tool 5: No traffic data available
Method complexity accuracy cost
Make traffic counts for each of the three periods: daytime, evening and night time Select sample roads and do traffic counts there; extrapolate to other roads of same type Use official traffic flow data for typical road types. Use other traffic flow data for typical road types. Use default values, such as: Road type traffic5 day evening night Dead-end roads 175 50 25 Service roads (mainly used by residents living there)
350 100 50
Collecting roads (collecting traffic from service roads and leading it to & from main roads)
700 200 100
Small main roads 1,400 400 200
Main roads Must undertake traffic counts!
5 Number of vehicles for the given period of time (not hourly data)
WG-AEN 016.2003.doc
Page 29 of 63
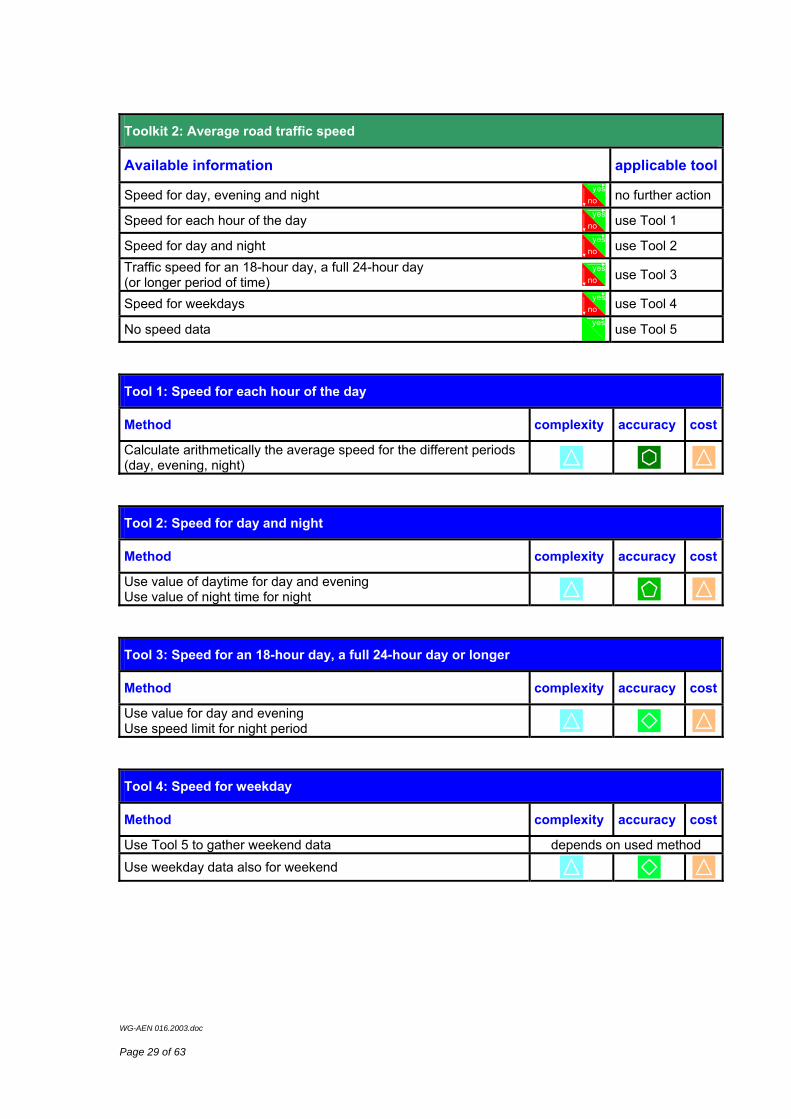
Toolkit 2: Average road traffic speed
Available information applicable tool
Speed for day, evening and night yesno no further action
Speed for each hour of the day yesno use Tool 1
Speed for day and night yesno use Tool 2
Traffic speed for an 18-hour day, a full 24-hour day (or longer period of time)
yesno use Tool 3
Speed for weekdays yesno use Tool 4
No speed data yes
use Tool 5
Tool 1: Speed for each hour of the day
Method complexity accuracy cost
Calculate arithmetically the average speed for the different periods (day, evening, night)
Tool 2: Speed for day and night
Method complexity accuracy cost
Use value of daytime for day and evening Use value of night time for night
Tool 3: Speed for an 18-hour day, a full 24-hour day or longer
Method complexity accuracy cost
Use value for day and evening Use speed limit for night period
Tool 4: Speed for weekday
Method complexity accuracy cost
Use Tool 5 to gather weekend data depends on used method Use weekday data also for weekend
WG-AEN 016.2003.doc
Page 30 of 63
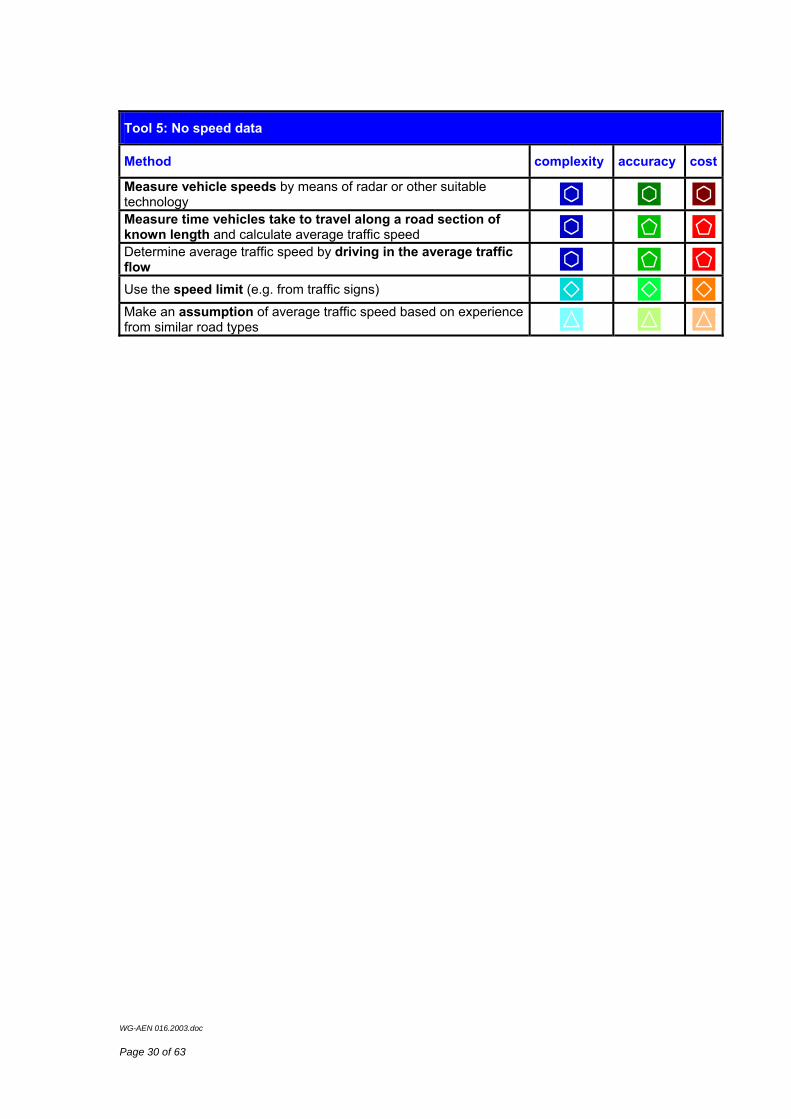
Tool 5: No speed data
Method complexity accuracy cost
Measure vehicle speeds by means of radar or other suitable technology Measure time vehicles take to travel along a road section of known length and calculate average traffic speed Determine average traffic speed by driving in the average traffic flow Use the speed limit (e.g. from traffic signs) Make an assumption of average traffic speed based on experience from similar road types
WG-AEN 016.2003.doc
Page 31 of 63
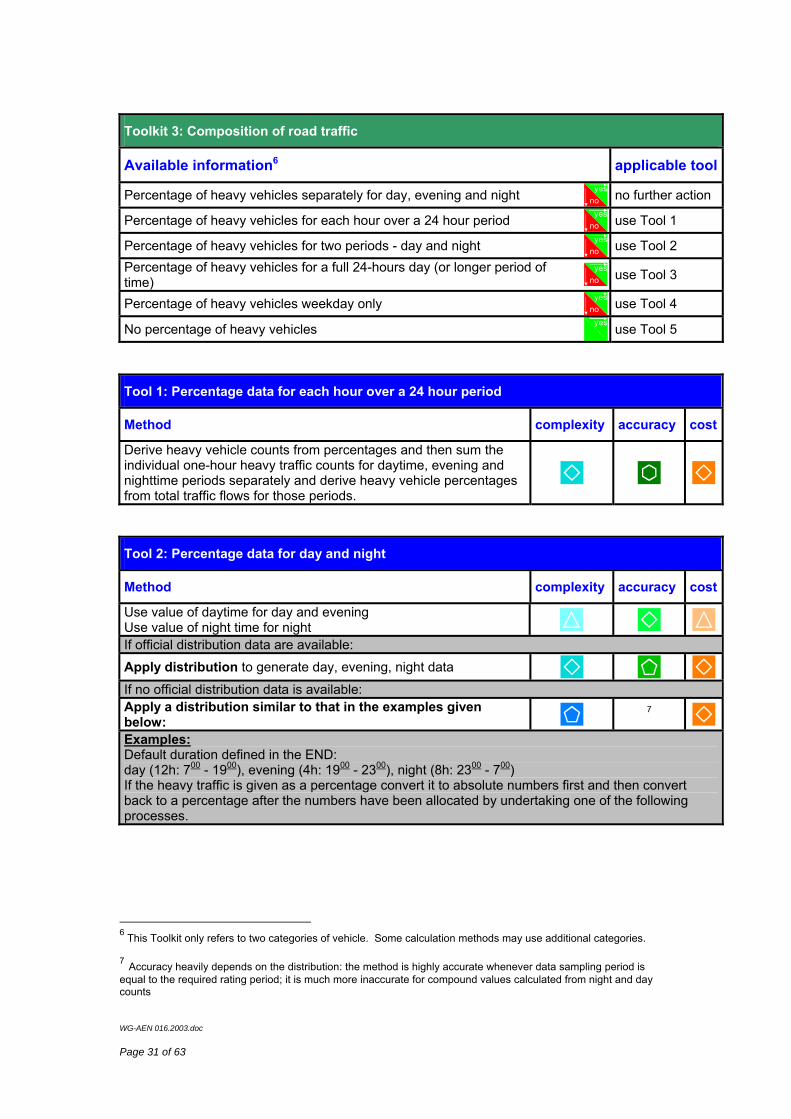
Toolkit 3: Composition of road traffic
Available information6 applicable tool
Percentage of heavy vehicles separately for day, evening and night yesno no further action
Percentage of heavy vehicles for each hour over a 24 hour period yesno use Tool 1
Percentage of heavy vehicles for two periods - day and night yesno use Tool 2
Percentage of heavy vehicles for a full 24-hours day (or longer period of time)
yesno use Tool 3
Percentage of heavy vehicles weekday only yesno use Tool 4
No percentage of heavy vehicles yes
use Tool 5
Tool 1: Percentage data for each hour over a 24 hour period
Method complexity accuracy cost
Derive heavy vehicle counts from percentages and then sum the individual one-hour heavy traffic counts for daytime, evening and nighttime periods separately and derive heavy vehicle percentages from total traffic flows for those periods.
Tool 2: Percentage data for day and night
Method complexity accuracy cost
Use value of daytime for day and evening Use value of night time for night If official distribution data are available: Apply distribution to generate day, evening, night data If no official distribution data is available: Apply a distribution similar to that in the examples given below:
7
Examples: Default duration defined in the END: day (12h: 700 - 1900), evening (4h: 1900 - 2300), night (8h: 2300 - 700) If the heavy traffic is given as a percentage convert it to absolute numbers first and then convert back to a percentage after the numbers have been allocated by undertaking one of the following processes.
6 This Toolkit only refers to two categories of vehicle. Some calculation methods may use additional categories.
7 Accuracy heavily depends on the distribution: the method is highly accurate whenever data sampling period is equal to the required rating period; it is much more inaccurate for compound values calculated from night and day counts
WG-AEN 016.2003.doc
Page 32 of 63
o 16h daytime & 8h night time counts: o day = 12/16 of daytime counts o evening = 4/16 of daytime counts o night = 8/8 night time counts
o 14h daytime & 10h night time counts: o day = 12/14 of daytime counts o evening = (2/14 of daytime) + (2/10 of night time) o night = 8/10 of night time counts
o 12h daytime & 12h night time counts o day = 12/12 of daytime counts o evening = 4/12 of night time counts o night = 8/12 of night time counts
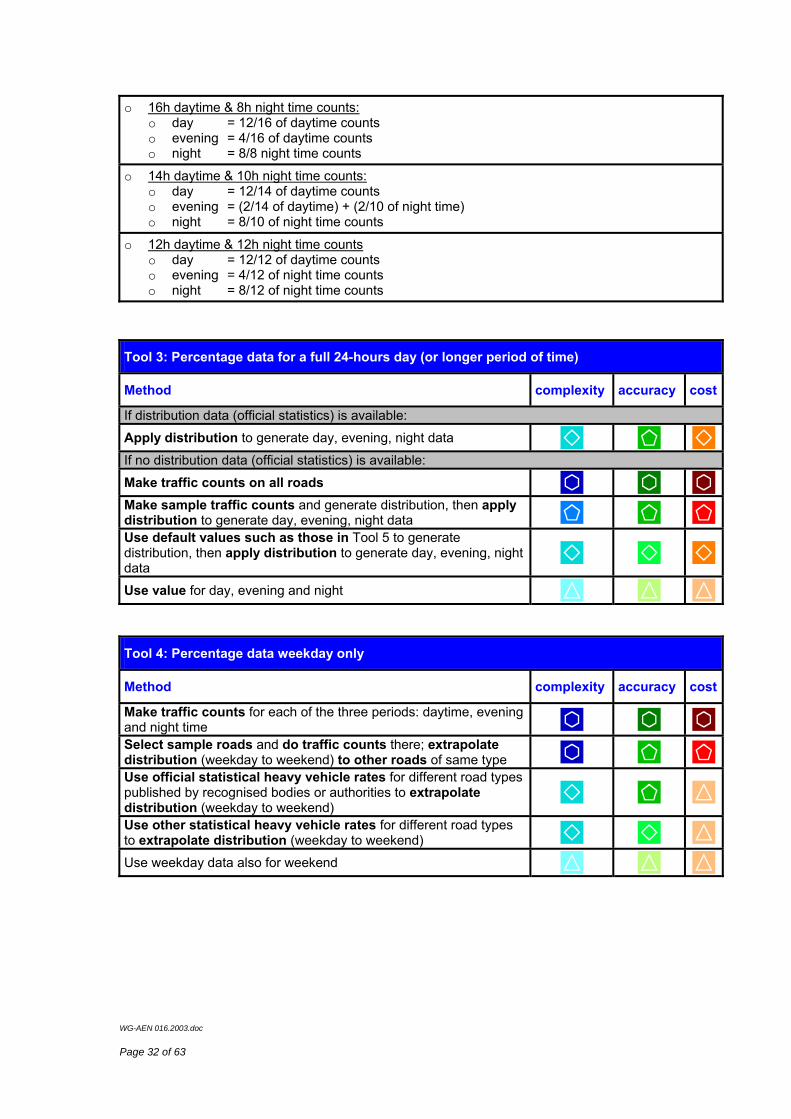
Tool 3: Percentage data for a full 24-hours day (or longer period of time)
Method complexity accuracy cost
If distribution data (official statistics) is available: Apply distribution to generate day, evening, night data If no distribution data (official statistics) is available: Make traffic counts on all roads Make sample traffic counts and generate distribution, then apply distribution to generate day, evening, night data Use default values such as those in Tool 5 to generate distribution, then apply distribution to generate day, evening, night data
Use value for day, evening and night
Tool 4: Percentage data weekday only
Method complexity accuracy cost
Make traffic counts for each of the three periods: daytime, evening and night time Select sample roads and do traffic counts there; extrapolate distribution (weekday to weekend) to other roads of same type Use official statistical heavy vehicle rates for different road types published by recognised bodies or authorities to extrapolate distribution (weekday to weekend)
Use other statistical heavy vehicle rates for different road types to extrapolate distribution (weekday to weekend) Use weekday data also for weekend
WG-AEN 016.2003.doc
Page 33 of 63
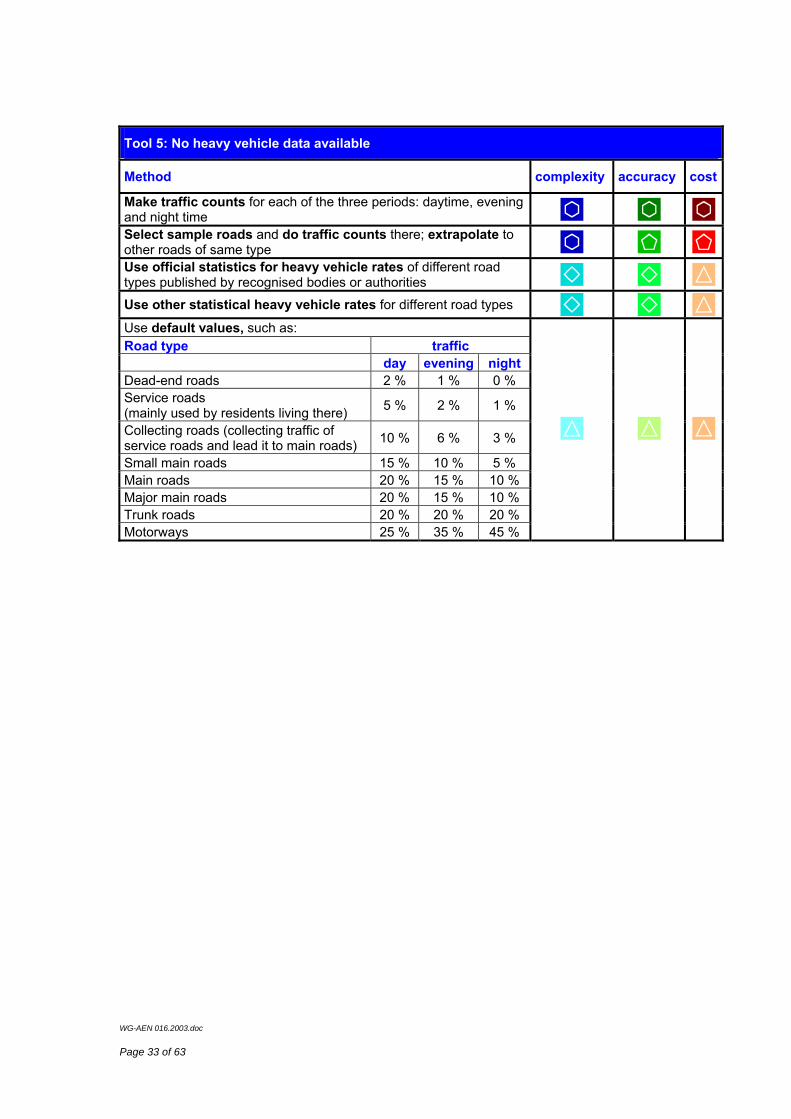
Tool 5: No heavy vehicle data available
Method complexity accuracy cost
Make traffic counts for each of the three periods: daytime, evening and night time Select sample roads and do traffic counts there; extrapolate to other roads of same type Use official statistics for heavy vehicle rates of different road types published by recognised bodies or authorities Use other statistical heavy vehicle rates for different road types Use default values, such as: Road type traffic day evening night Dead-end roads 2 % 1 % 0 % Service roads (mainly used by residents living there) 5 % 2 % 1 %
Collecting roads (collecting traffic of service roads and lead it to main roads) 10 % 6 % 3 %
Small main roads 15 % 10 % 5 % Main roads 20 % 15 % 10 % Major main roads 20 % 15 % 10 % Trunk roads 20 % 20 % 20 % Motorways 25 % 35 % 45 %
WG-AEN 016.2003.doc
Page 34 of 63
Toolkit 4: Train speed
Method complexity accuracy cost
Reliable train speeds are available from the owner of the tracks Reliable train speeds are available from the operators of the trains Measure train speeds Use timetables and distances to calculate an average speed (may not be possible for freight trains) Take the minimum of the following two values: • maximum train speed • maximum track speed
WG-AEN 016.2003.doc
Page 35 of 63
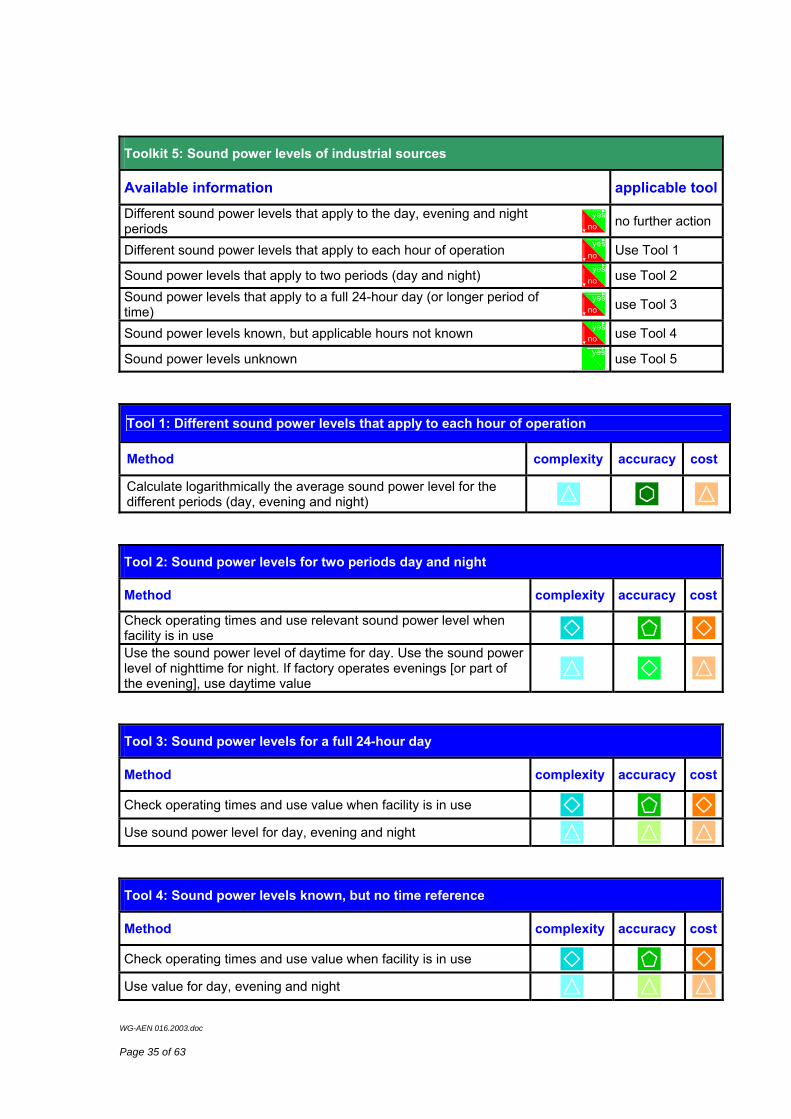
Toolkit 5: Sound power levels of industrial sources
Available information applicable toolDifferent sound power levels that apply to the day, evening and night periods
yesno no further action
Different sound power levels that apply to each hour of operation yesno Use Tool 1
Sound power levels that apply to two periods (day and night) yesno use Tool 2
Sound power levels that apply to a full 24-hour day (or longer period of time)
yesno use Tool 3
Sound power levels known, but applicable hours not known yesno use Tool 4
Sound power levels unknown yes
use Tool 5
Tool 1: Different sound power levels that apply to each hour of operation
Method complexity accuracy cost
Calculate logarithmically the average sound power level for the different periods (day, evening and night)
Tool 2: Sound power levels for two periods day and night
Method complexity accuracy cost
Check operating times and use relevant sound power level when facility is in use Use the sound power level of daytime for day. Use the sound power level of nighttime for night. If factory operates evenings [or part of the evening], use daytime value
Tool 3: Sound power levels for a full 24-hour day
Method complexity accuracy cost
Check operating times and use value when facility is in use Use sound power level for day, evening and night
Tool 4: Sound power levels known, but no time reference
Method complexity accuracy cost
Check operating times and use value when facility is in use Use value for day, evening and night
WG-AEN 016.2003.doc
Page 36 of 63
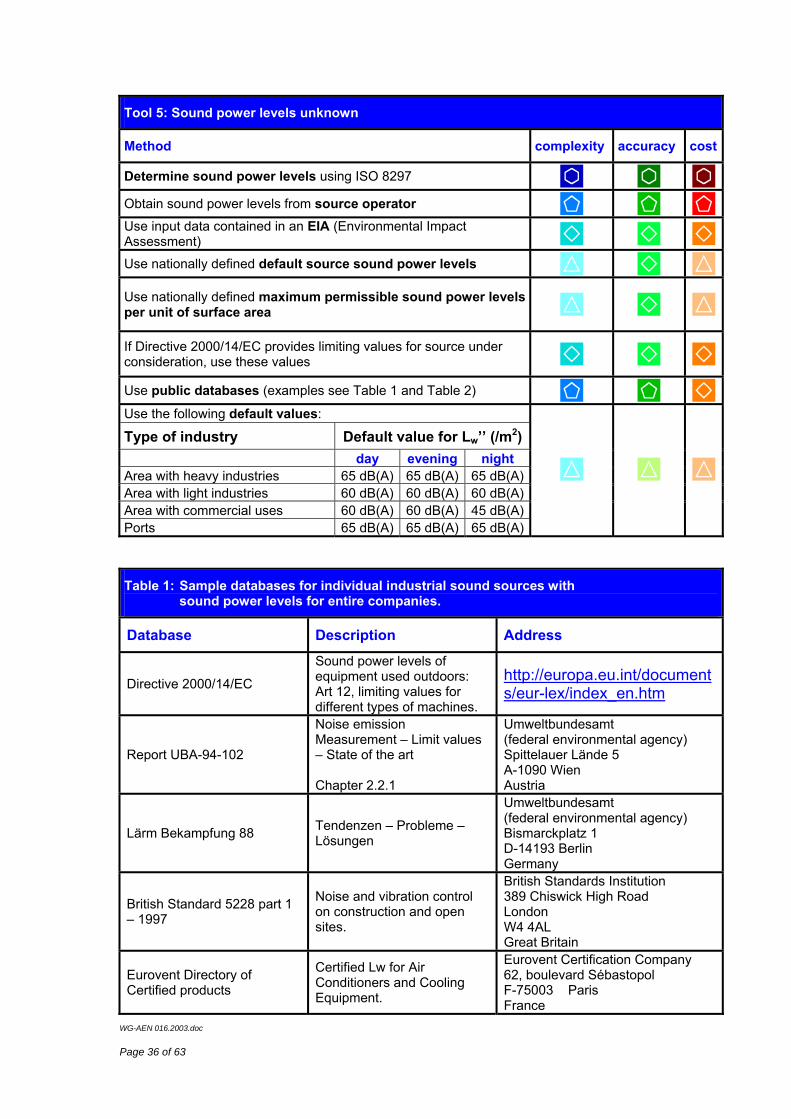
Tool 5: Sound power levels unknown
Method complexity accuracy cost
Determine sound power levels using ISO 8297 Obtain sound power levels from source operator Use input data contained in an EIA (Environmental Impact Assessment) Use nationally defined default source sound power levels
Use nationally defined maximum permissible sound power levels per unit of surface area
If Directive 2000/14/EC provides limiting values for source under consideration, use these values
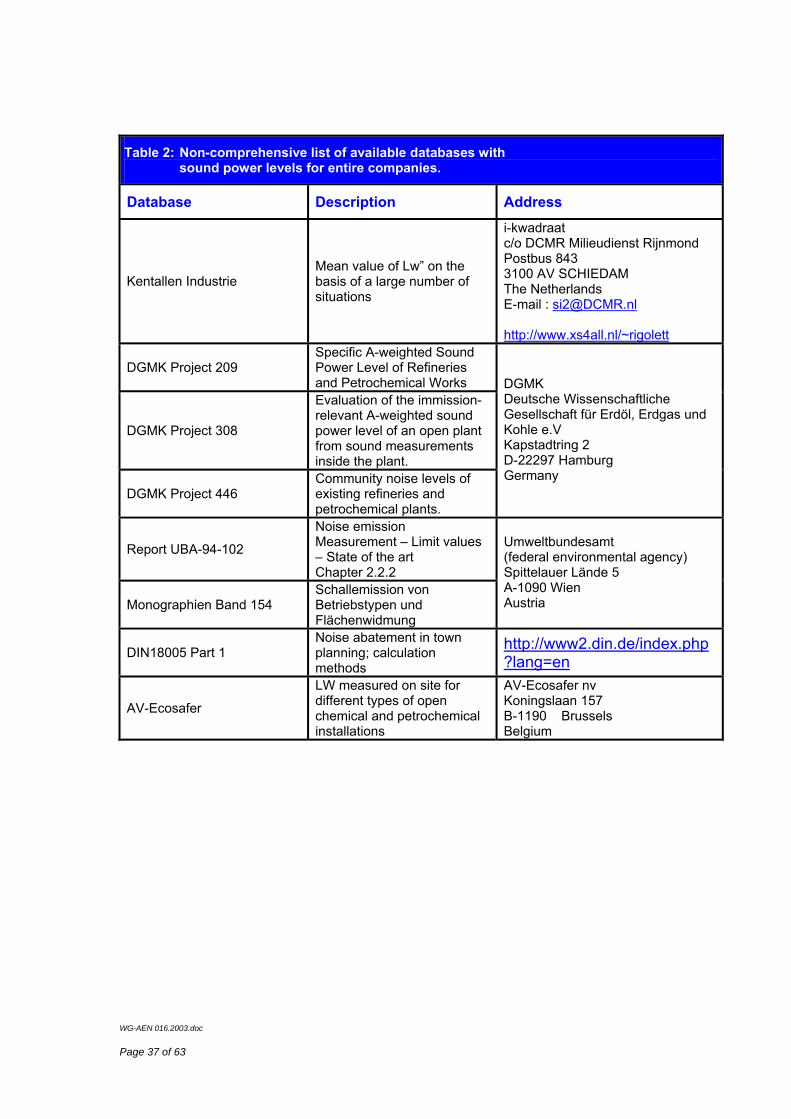
Use public databases (examples see Table 1 and Table 2) Use the following default values:
Type of industry Default value for Lw’’ (/m2) day evening night Area with heavy industries 65 dB(A) 65 dB(A) 65 dB(A)Area with light industries 60 dB(A) 60 dB(A) 60 dB(A)Area with commercial uses 60 dB(A) 60 dB(A) 45 dB(A)Ports 65 dB(A) 65 dB(A) 65 dB(A)
Table 1: Sample databases for individual industrial sound sources with sound power levels for entire companies.
Database Description Address
Directive 2000/14/EC
Sound power levels of equipment used outdoors: Art 12, limiting values for different types of machines.
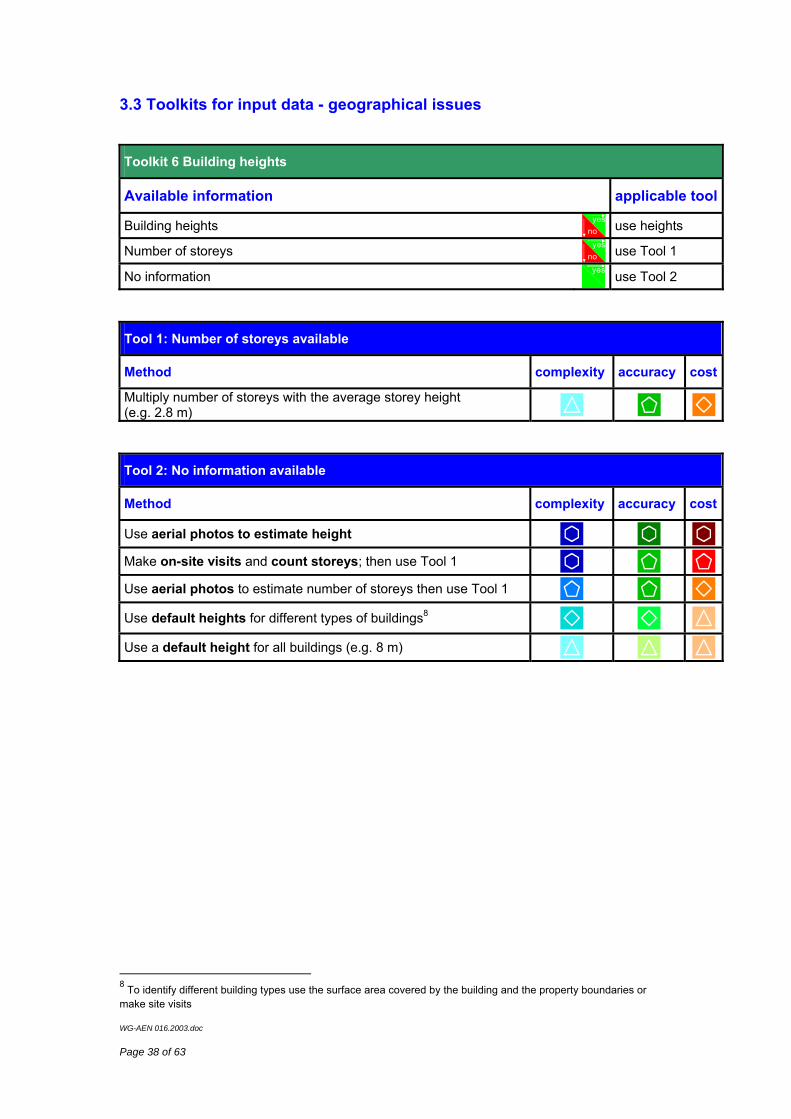
Multiply number of storeys with the average storey height (e.g. 2.8 m)
Tool 2: No information available
Method complexity accuracy cost
Use aerial photos to estimate height Make on-site visits and count storeys; then use Tool 1 Use aerial photos to estimate number of storeys then use Tool 1 Use default heights for different types of buildings8 Use a default height for all buildings (e.g. 8 m)
8 To identify different building types use the surface area covered by the building and the property boundaries or make site visits
WG-AEN 016.2003.doc
Page 39 of 63
Toolkit 7: Obstacles
Available information applicable tool
Digital information yesno use Tool 1
Paper maps or aerial photos yes
use Tool 2 or 3
Tool 1: Digital information
If digital information e.g. from a GIS system is available the following size of objects should be included in any noise calculation model (smaller objects are unlikely to have a significant impact in calculating noise levels but are likely to significantly increase the calculation time).
Object in question Include in the calculation model if ...
Building the area of the ground covered by building is at least 10 m² and the height is at least 2 m
Wall, barrier or embankment the length of the obstacle is at least 3 m and the height 9 is at least 2 m
Embankments the height is at least 2 m
Tool 2: Paper maps or aerial photos - buildings
Dimension include in the scheme if ...
Vertical the height is at least 2 m, and…
Horizontal the largest dimension of the building is at least 50% of the calculation grid spacing
Tool 3: Paper maps or aerial photos - walls, barriers or embankments
Parameter include in the scheme if ...
Vertical the height 9 is at least 2 m, and… Horizontal the length is at least twice the grid point distance
9 ‘Height’ is the height of the top edge of an obstacle above the local ground level. However, if an obstacle is positioned on an embankment or any other kind of elevated terrain, ‘height’ is the sum of the obstacle height and the embankment height. Additionally, in the case of railways, where a barrier may be located very close to the wheels and rail, barriers with heights less than 2 metres may need to be taken into account.
WG-AEN 016.2003.doc
Page 40 of 63
Toolkit 8: Cuttings and embankments in the site model
Available information applicable tool
Digital information on cuttings and embankments. yesno use Tool 1
The location and height of cuttings and embankments but these are not in the digital site model
yesno use Tool 2
The location and height of cuttings and embankments are unknown yes
use Tool 3
Tool 1: Digital information on cuttings and embankments
Incorporate information on cuttings and embankments in digital site model and then use 3D visualising tools to carefully check for inconsistencies and discontinuities.
Tool 2: The location and height of cuttings and embankments but are not in the digital site model
Approach for cuttings: Digitise contour lines along the top of the cutting, on both sides, to model the nearby area. Digitise contour lines along the bottom of the cutting, on both sides, to model the railway or road area.
Approach for embankments: Digitise contour lines along the top of the embankment, on both sides, to model the railway or road area. Digitise contour lines along the bottom of the embankment, on both sides, to model the nearby area.
Tool 3: The location and height of cuttings and embankments are unknown
Method complexity accuracy cost
In all cases Make site visits to locate embankments and cuttings Then either Use surveying techniques to obtain the necessary position & height data Check with official bodies to see if they can provide paper maps of embankments and cuttings Continue with tool 2 Estimate the height from the site visit then digitise the position from aerial photos: Continue with tool 2 Estimate the position and height from the site visit: Continue with tool 2 Ignore cuttings if no relevant sources are located in these cuttings.
WG-AEN 016.2003.doc
Page 41 of 63
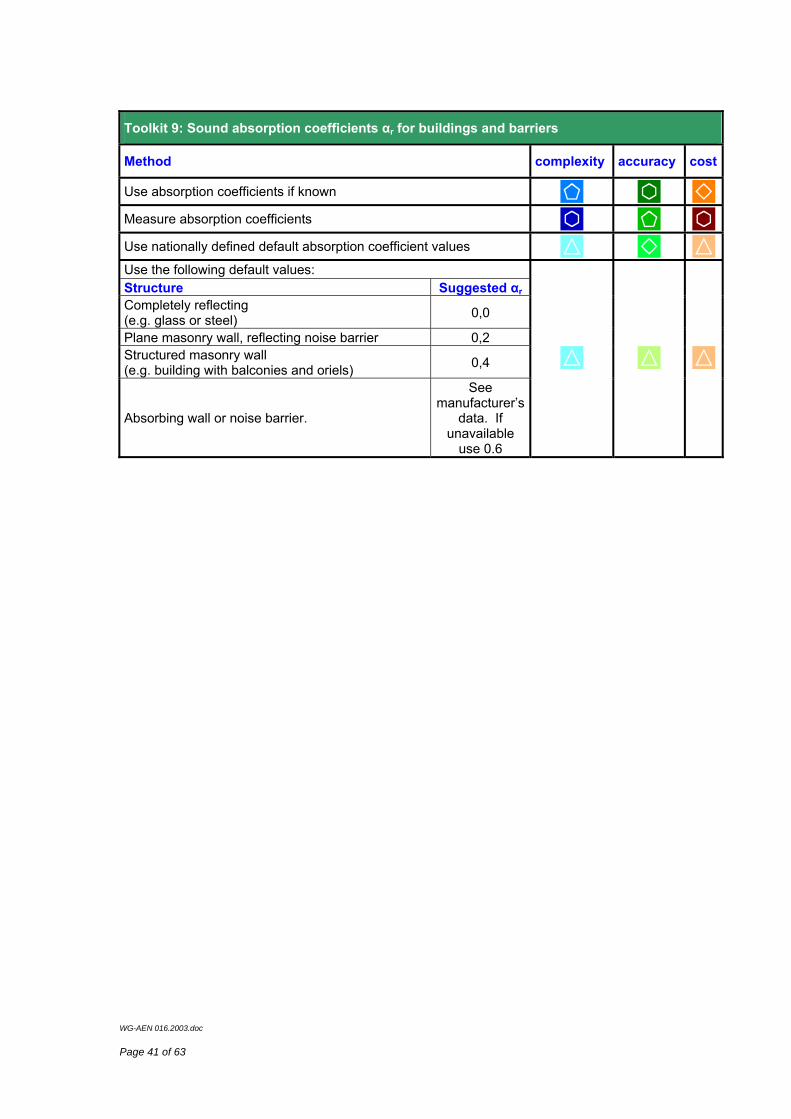
Toolkit 9: Sound absorption coefficients αr for buildings and barriers
Method complexity accuracy cost
Use absorption coefficients if known Measure absorption coefficients Use nationally defined default absorption coefficient values Use the following default values: Structure Suggested αrCompletely reflecting (e.g. glass or steel) 0,0
Plane masonry wall, reflecting noise barrier 0,2 Structured masonry wall (e.g. building with balconies and oriels) 0,4
Absorbing wall or noise barrier.
See manufacturer’s
data. If unavailable
use 0.6
WG-AEN 016.2003.doc
Page 42 of 63
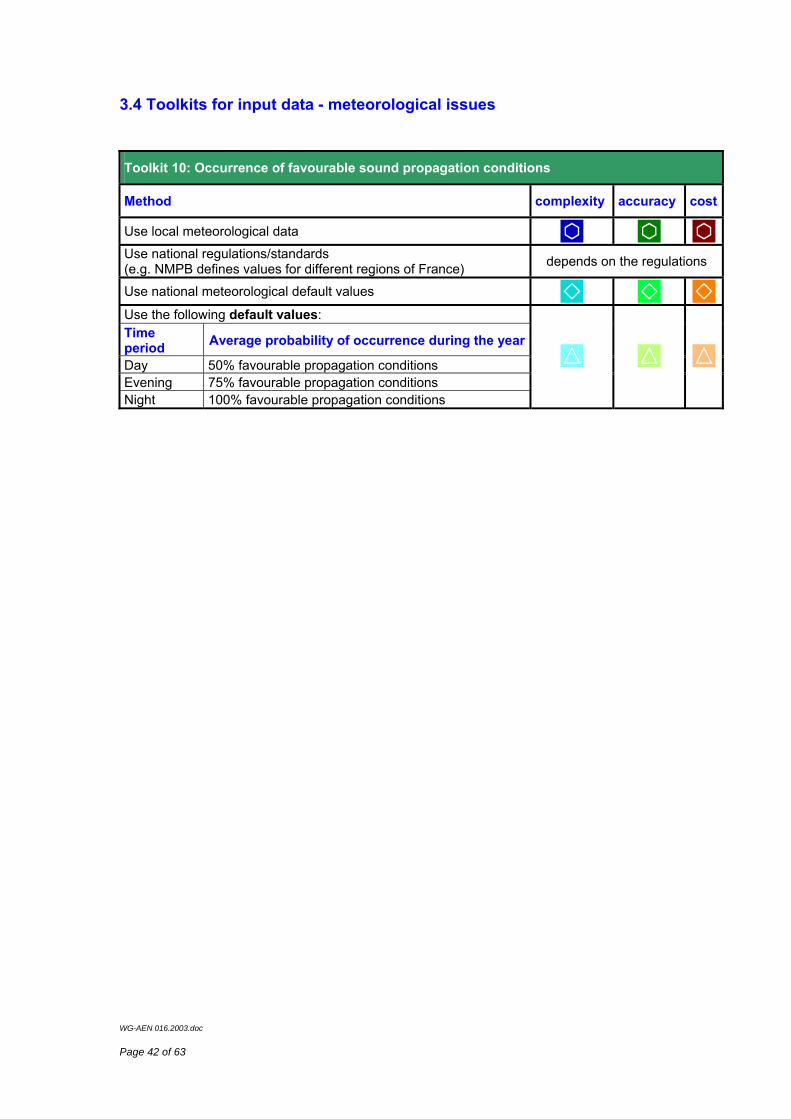
3.4 Toolkits for input data - meteorological issues Toolkit 10: Occurrence of favourable sound propagation conditions
Method complexity accuracy cost
Use local meteorological data Use national regulations/standards (e.g. NMPB defines values for different regions of France) depends on the regulations
Use national meteorological default values Use the following default values: Time period Average probability of occurrence during the year
Day 50% favourable propagation conditions Evening 75% favourable propagation conditions Night 100% favourable propagation conditions
WG-AEN 016.2003.doc
Page 43 of 63
Toolkit 11: Humidity and temperature 10
Method complexity accuracy cost
Use actual humidity and temperature values if available Acquire humidity and temperature data Use nationally defined default values e.g. the French XP S 31-133 standard permits the use of the default values of 15° C and 70% relative humidity.
10 Humidity and temperature only has a small influence on noise levels compared to the influence of other parameters (e.g. prevailing wind, temperature inversions and quality of source data).
WG-AEN 016.2003.doc
Page 44 of 63
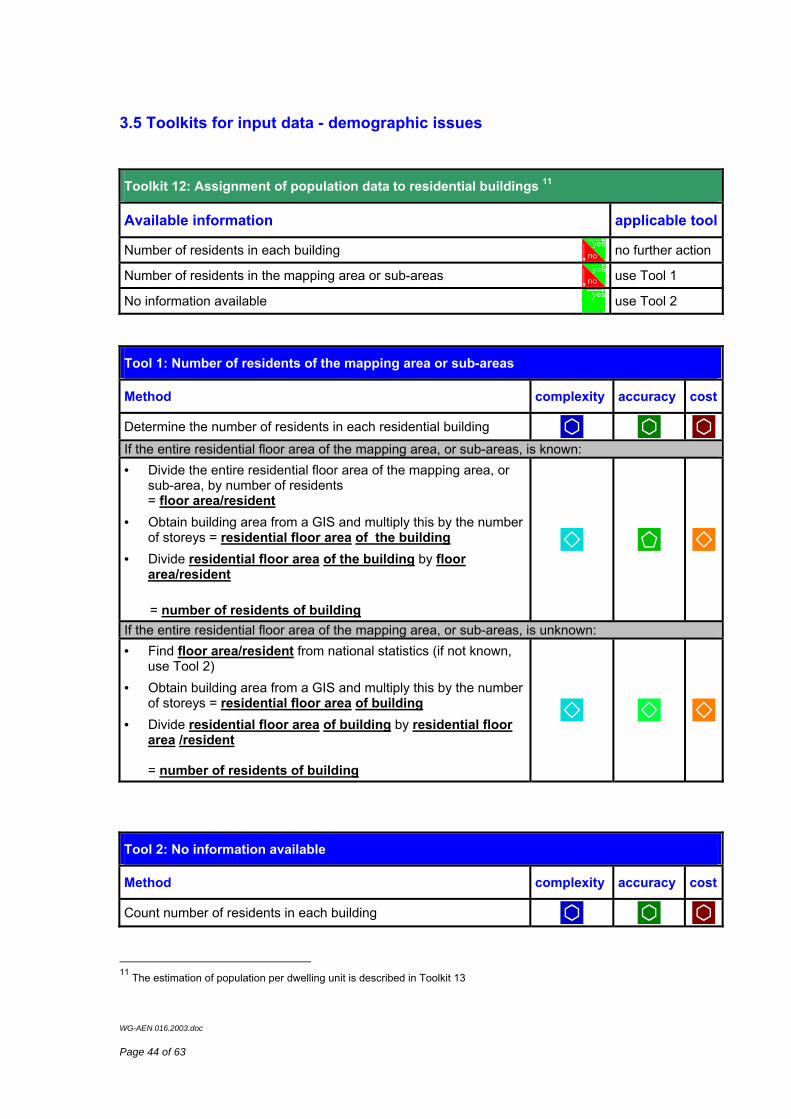
3.5 Toolkits for input data - demographic issues Toolkit 12: Assignment of population data to residential buildings 11
Available information applicable tool
Number of residents in each building yesno no further action
Number of residents in the mapping area or sub-areas yesno use Tool 1
No information available yes
use Tool 2
Tool 1: Number of residents of the mapping area or sub-areas
Method complexity accuracy cost
Determine the number of residents in each residential building If the entire residential floor area of the mapping area, or sub-areas, is known: • Divide the entire residential floor area of the mapping area, or
sub-area, by number of residents = floor area/resident
• Obtain building area from a GIS and multiply this by the number of storeys = residential floor area of the building
• Divide residential floor area of the building by floor area/resident
= number of residents of building
If the entire residential floor area of the mapping area, or sub-areas, is unknown: • Find floor area/resident from national statistics (if not known,
use Tool 2) • Obtain building area from a GIS and multiply this by the number
of storeys = residential floor area of building • Divide residential floor area of building by residential floor
area /resident = number of residents of building
Tool 2: No information available
Method complexity accuracy cost
Count number of residents in each building
11 The estimation of population per dwelling unit is described in Toolkit 13
WG-AEN 016.2003.doc
Page 45 of 63
• Make estimates of the average number of residents living in different types of buildings12 (such as detached houses, blocks with different numbers of storeys, etc.)
• Conduct limited surveys and prepare list with building types and estimated numbers of residents
12 To identify different building types use surface covered by the building and the property boundaries or make site visits
WG-AEN 016.2003.doc
Page 46 of 63
Toolkit 13: Determination of the number of dwelling units per residential building and the population per dwelling unit
Information required applicable tool
Number of dwelling units per residential building yesno use Tool 1
Population per dwelling unit yes
use Tool 2
Tool 1: Number of dwellings per residential building
Method complexity accuracy cost
Count all dwelling units in all buildings Use existing digital register Make estimates from the following information: Size and location • building height, • number of floors • floor space • land-use Building type13 • detached house, • semi-detached house, • terraced house • multi-story building
Extrapolate from samples of different building types13 Use statistical data to make estimations of dwellings units per building based on the following information: • living space per resident, • living space per dwelling unit • number of residents in a given area • number of dwellings in a given area
Tool 2: Population per dwelling
Method complexity accuracy cost
Count all residents in all dwelling units • acquire number of dwelling units per building using Tool 1 • acquire number of residents per building using Toolkit 12 • distribute equally per building (divide residents by dwelling
units)
14 14 14
13 To identify different building types use surface covered by the building and the property boundaries or make site visits
14 The complexity, accuracy and cost depend on the methods used in Tool 1 and Toolkit 12
WG-AEN 016.2003.doc
Page 47 of 63
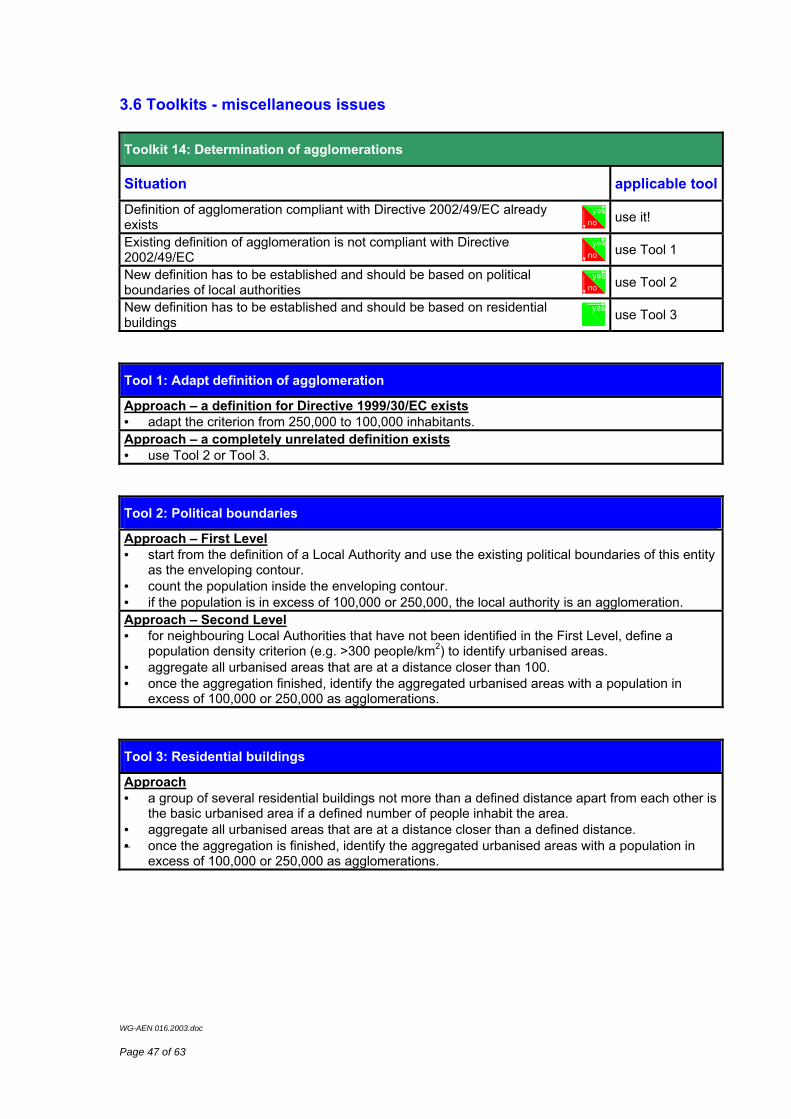
3.6 Toolkits - miscellaneous issues Toolkit 14: Determination of agglomerations
Situation applicable toolDefinition of agglomeration compliant with Directive 2002/49/EC already exists
yesno use it!
Existing definition of agglomeration is not compliant with Directive 2002/49/EC
yesno use Tool 1
New definition has to be established and should be based on political boundaries of local authorities
yesno use Tool 2
New definition has to be established and should be based on residential buildings
yes
use Tool 3
Tool 1: Adapt definition of agglomeration
Approach – a definition for Directive 1999/30/EC exists • adapt the criterion from 250,000 to 100,000 inhabitants. Approach – a completely unrelated definition exists • use Tool 2 or Tool 3.
Tool 2: Political boundaries
Approach – First Level • start from the definition of a Local Authority and use the existing political boundaries of this entity
as the enveloping contour. • count the population inside the enveloping contour. • if the population is in excess of 100,000 or 250,000, the local authority is an agglomeration. Approach – Second Level • for neighbouring Local Authorities that have not been identified in the First Level, define a
population density criterion (e.g. >300 people/km2) to identify urbanised areas. • aggregate all urbanised areas that are at a distance closer than 100. • once the aggregation finished, identify the aggregated urbanised areas with a population in
excess of 100,000 or 250,000 as agglomerations.
Tool 3: Residential buildings
Approach • a group of several residential buildings not more than a defined distance apart from each other is
the basic urbanised area if a defined number of people inhabit the area. • aggregate all urbanised areas that are at a distance closer than a defined distance. • once the aggregation is finished, identify the aggregated urbanised areas with a population in
excess of 100,000 or 250,000 as agglomerations.
WG-AEN 016.2003.doc
Page 48 of 63
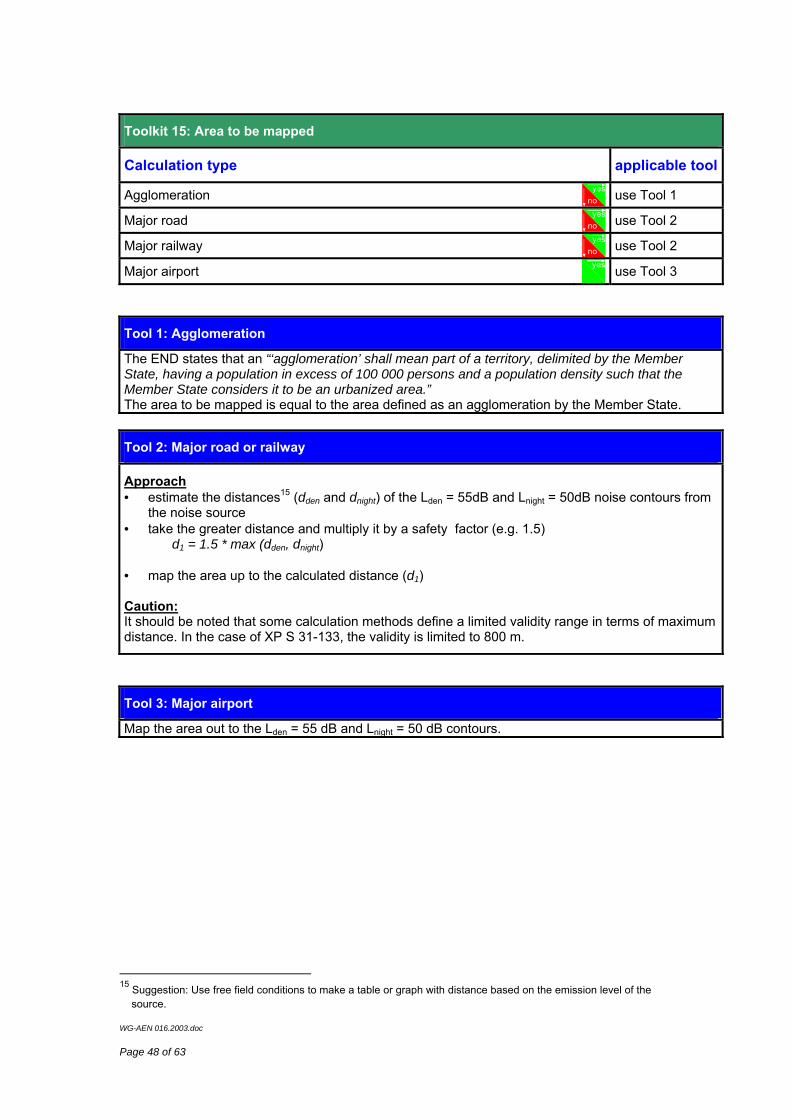
Toolkit 15: Area to be mapped
Calculation type applicable tool
Agglomeration yesno use Tool 1
Major road yesno use Tool 2
Major railway yesno use Tool 2
Major airport yes
use Tool 3
Tool 1: Agglomeration
The END states that an “‘agglomeration’ shall mean part of a territory, delimited by the Member State, having a population in excess of 100 000 persons and a population density such that the Member State considers it to be an urbanized area.” The area to be mapped is equal to the area defined as an agglomeration by the Member State.
Tool 2: Major road or railway
Approach • estimate the distances15 (dden and dnight) of the Lden = 55dB and Lnight = 50dB noise contours from
the noise source • take the greater distance and multiply it by a safety factor (e.g. 1.5)
d1 = 1.5 * max (dden, dnight)
• map the area up to the calculated distance (d1)
Caution: It should be noted that some calculation methods define a limited validity range in terms of maximum distance. In the case of XP S 31-133, the validity is limited to 800 m.
Tool 3: Major airport
Map the area out to the Lden = 55 dB and Lnight = 50 dB contours.
15 Suggestion: Use free field conditions to make a table or graph with distance based on the emission level of the
source.
WG-AEN 016.2003.doc
Page 49 of 63
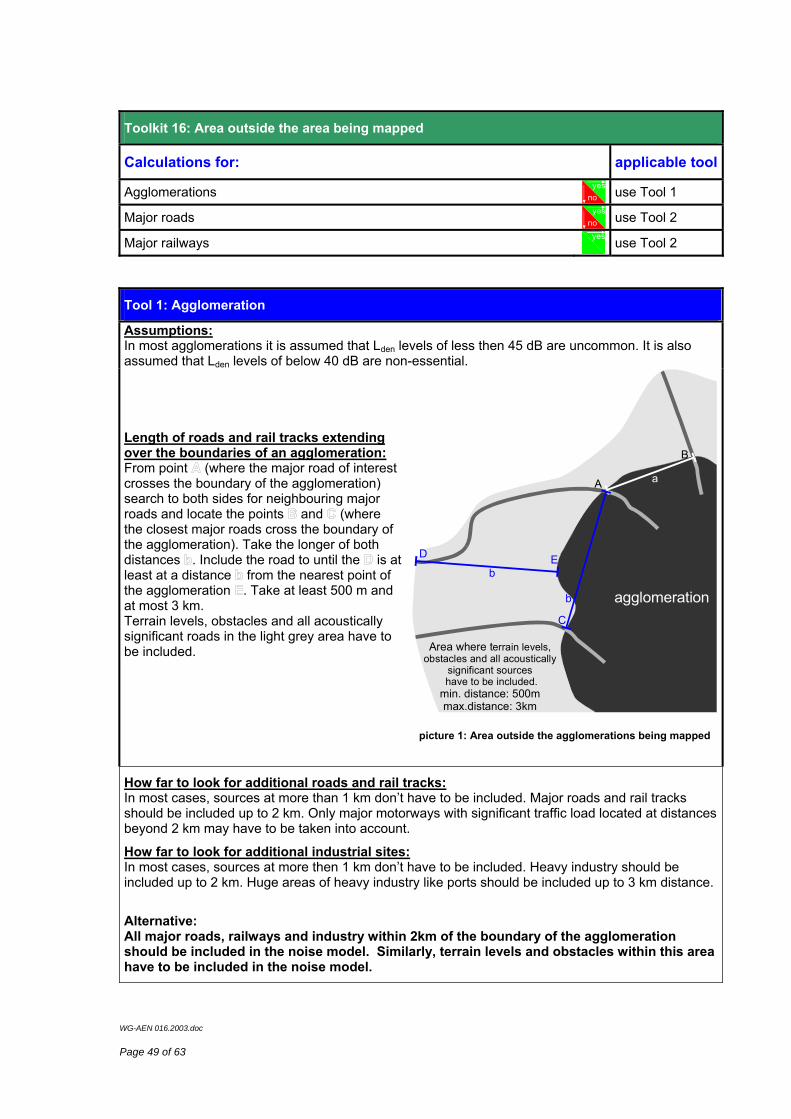
Toolkit 16: Area outside the area being mapped
Calculations for: applicable tool
Agglomerations yesno use Tool 1
Major roads yesno use Tool 2
Major railways yes
use Tool 2
Tool 1: Agglomeration
Assumptions: In most agglomerations it is assumed that Lden levels of less then 45 dB are uncommon. It is also assumed that Lden levels of below 40 dB are non-essential.
Length of roads and rail tracks extending over the boundaries of an agglomeration: From point (where the major road of interest crosses the boundary of the agglomeration) search to both sides for neighbouring major roads and locate the points and (where the closest major roads cross the boundary of the agglomeration). Take the longer of both distances . Include the road to until the is at least at a distance from the nearest point of the agglomeration . Take at least 500 m and at most 3 km. Terrain levels, obstacles and all acoustically significant roads in the light grey area have to be included.
agglomeration
Area where t
min. distance: 500mmax.distance: 3km
errain levels, obstacles and all acoustically
significant sources have to be included.
b
b
aA
B
C
D E
picture 1: Area outside the agglomerations being mapped
How far to look for additional roads and rail tracks: In most cases, sources at more than 1 km don’t have to be included. Major roads and rail tracks should be included up to 2 km. Only major motorways with significant traffic load located at distances beyond 2 km may have to be taken into account.
How far to look for additional industrial sites: In most cases, sources at more then 1 km don’t have to be included. Heavy industry should be included up to 2 km. Huge areas of heavy industry like ports should be included up to 3 km distance.
Alternative: All major roads, railways and industry within 2km of the boundary of the agglomeration should be included in the noise model. Similarly, terrain levels and obstacles within this area have to be included in the noise model.
WG-AEN 016.2003.doc
Page 50 of 63
Tool 2: Major road or railway
Outside agglomerations, only the major roads or railways have to be calculated. No additional sources are to be taken into account.
WG-AEN 016.2003.doc
Page 51 of 63
References
1. The Identification & Development of Good Practice in the Field of Noise Mapping and the Determination of Associated Information on the Exposure of People to Environmental Noise. Study contract 1. Wölfel Meßsysteme & LARMKONTOR GmbH, October 2002. Available from http://forum.europa.eu.int/Public/irc/env/noisedir/library
2. Identification & Development of Good Practice Toolkit for Noise Mapping and the Determination of Associated Information on the Exposure of People to Environmental Noise. Study contract 2. Wölfel Meßsysteme & LARMKONTOR GmbH, 4 April 2003. Available from http://forum.europa.eu.int/Public/irc/env/noisedir/library
3. Council Directive 1999/30/EC of 22 April 1999 relating to limit values for sulphur dioxide, nitrogen dioxide and oxides of nitrogen, particulate matter and lead in ambient air. Available from http://europa.eu.int/eur-lex/pri/en/oj/dat/1999/l_163/l_16319990629en00410060.pdf
4. Definition, Identification and Preservation of Urban & Rural Quiet Areas. Final report July 2003. http://forum.europa.eu.int/Public/irc/env/noisedir/library
5. ISO 1996-2:1987 Acoustics -- Description and measurement of environmental noise -- Part 2: Acquisition of data pertinent to land use.
WG-AEN 016.2003.doc
Page 52 of 63
Appendix 1
MEMBERSHIP OF WG-AEN Name Organisation Country HINTON, John (chair) Birmingham City Council UK IRMER, Volker (co-chair) Umweltbundesamt Germany ALSINA DONADEU, Ricardo Ayuntamiento de Spain Barcelona BLOOMFIELD, Alan Greater London Authority UK BOURBON, Christine Institut Bruxellois pour la Belgium
Gestion de l’Environnement
COELHO, J L Bento Universidade Tècnica de Portugal
Lisboa - CAPS DASSEN, Ton RIVM - Amsterdam Netherlands DOLAN, Tony Environmental Protection Ireland
Agency FÜRST, Nathalie CERTU - Lyon France PAQUE, Gilles European Commission EU DG Environment PSYCHAS, Kyriakos Ministry of Environment Greece RASMUSSEN, Søren COWI - Odense Denmark
WG-AEN 016.2003.doc
Page 53 of 63
Appendix 2 Introduction to the use of Geographical Information Systems
(GIS) in noise mapping
A GIS may be described as a system of computer software, hardware and data, and personnel to manipulate, analyse and present information that is geo-referenced (i.e. tied to a spatial location):
• system linking software, hardware, data
• personnel a thinking explorer who is key to the power of GIS
• information data are cross-referenced for visualization or analysis
• spatial location data are linked to a geographic location
Figure 1 – GIS basic structure
WG-AEN 016.2003.doc
Page 54 of 63
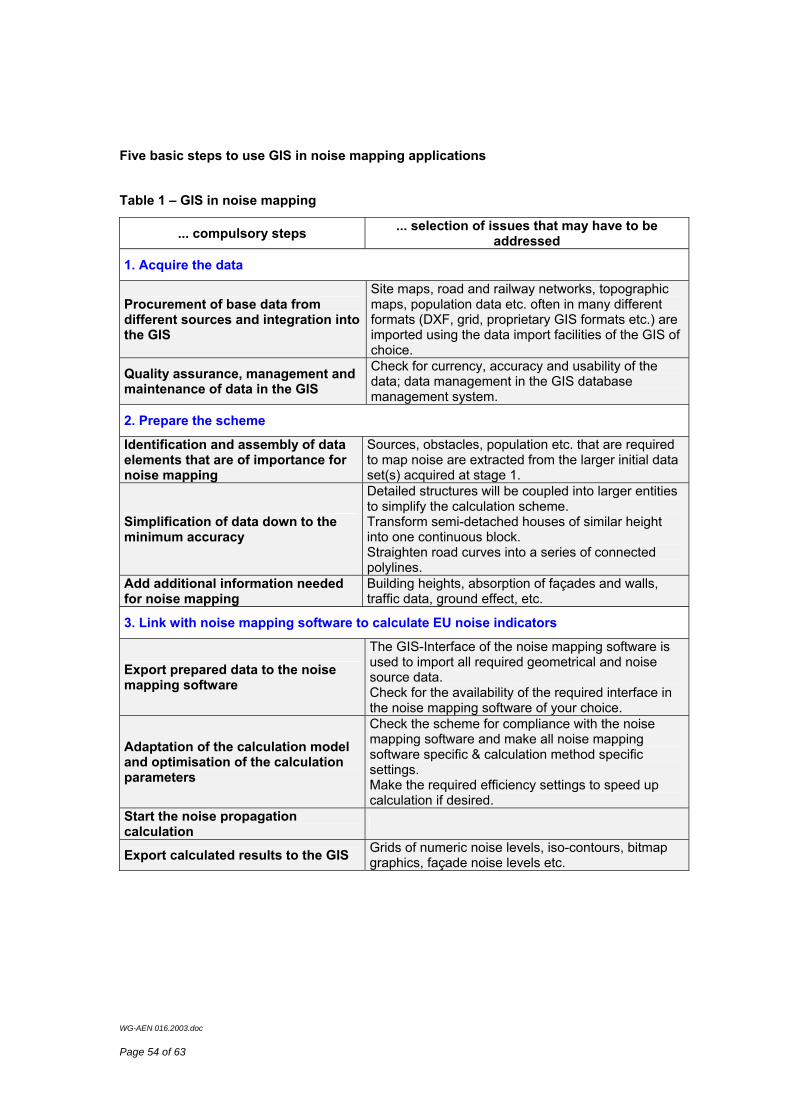
Five basic steps to use GIS in noise mapping applications
Table 1 – GIS in noise mapping
... compulsory steps ... selection of issues that may have to be addressed
1. Acquire the data
Procurement of base data from different sources and integration into the GIS
Site maps, road and railway networks, topographic maps, population data etc. often in many different formats (DXF, grid, proprietary GIS formats etc.) are imported using the data import facilities of the GIS of choice.
Quality assurance, management and maintenance of data in the GIS
Check for currency, accuracy and usability of the data; data management in the GIS database management system.
2. Prepare the scheme
Identification and assembly of data elements that are of importance for noise mapping
Sources, obstacles, population etc. that are required to map noise are extracted from the larger initial data set(s) acquired at stage 1.
Simplification of data down to the minimum accuracy
Detailed structures will be coupled into larger entities to simplify the calculation scheme. Transform semi-detached houses of similar height into one continuous block. Straighten road curves into a series of connected polylines.
Add additional information needed for noise mapping
Building heights, absorption of façades and walls, traffic data, ground effect, etc.
3. Link with noise mapping software to calculate EU noise indicators
Export prepared data to the noise mapping software
The GIS-Interface of the noise mapping software is used to import all required geometrical and noise source data. Check for the availability of the required interface in the noise mapping software of your choice.
Adaptation of the calculation model and optimisation of the calculation parameters
Check the scheme for compliance with the noise mapping software and make all noise mapping software specific & calculation method specific settings. Make the required efficiency settings to speed up calculation if desired.
Start the noise propagation calculation
Export calculated results to the GIS Grids of numeric noise levels, iso-contours, bitmap graphics, façade noise levels etc.
WG-AEN 016.2003.doc
Page 55 of 63
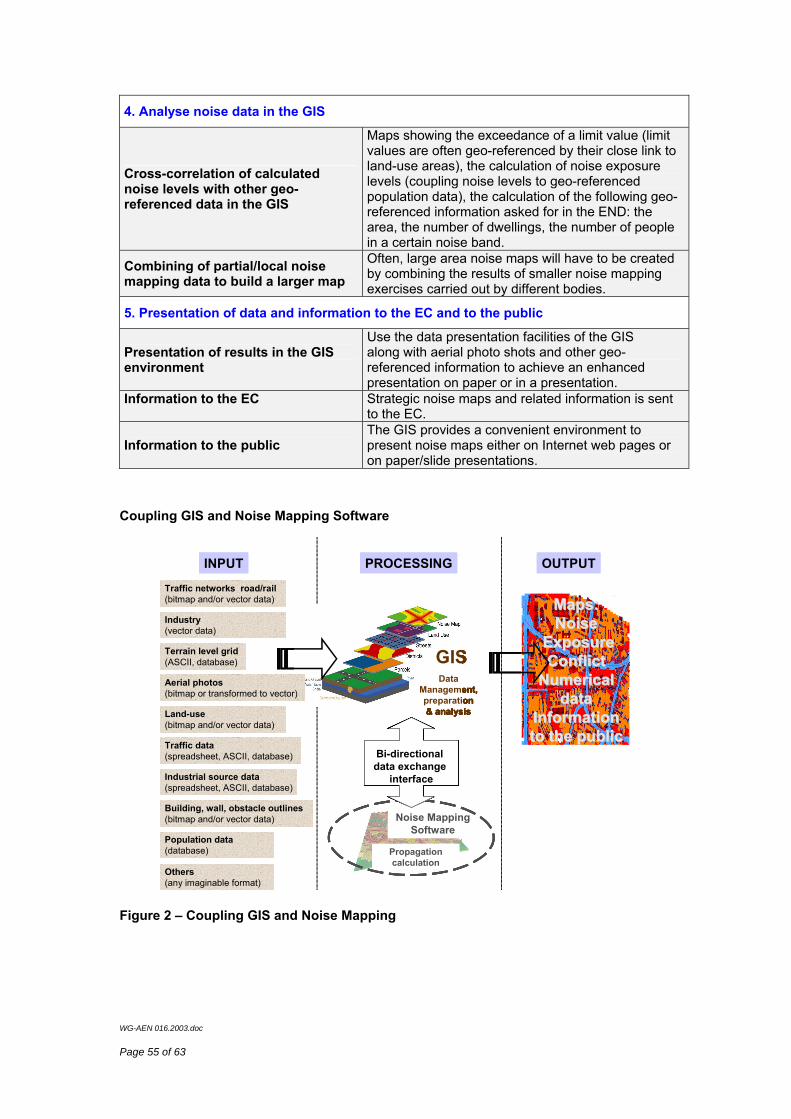
4. Analyse noise data in the GIS
Cross-correlation of calculated noise levels with other geo-referenced data in the GIS
Maps showing the exceedance of a limit value (limit values are often geo-referenced by their close link to land-use areas), the calculation of noise exposure levels (coupling noise levels to geo-referenced population data), the calculation of the following geo-referenced information asked for in the END: the area, the number of dwellings, the number of people in a certain noise band.
Combining of partial/local noise mapping data to build a larger map
Often, large area noise maps will have to be created by combining the results of smaller noise mapping exercises carried out by different bodies.
5. Presentation of data and information to the EC and to the public
Presentation of results in the GIS environment
Use the data presentation facilities of the GIS along with aerial photo shots and other geo-referenced information to achieve an enhanced presentation on paper or in a presentation.
Information to the EC
Strategic noise maps and related information is sent to the EC.
Information to the public The GIS provides a convenient environment to present noise maps either on Internet web pages or on paper/slide presentations.
Coupling GIS and Noise Mapping Software
Propagation calculation
Noise Mapping Software
MapsMaps::NoiseNoise
Exposure Exposure ConflictConflict
Numerical Numerical datadata
Information Information to to the publicthe public
o The GIS is the central database management engine.
o Data are imported into the GIS where the quality is checked and the data is managed, maintained and prepared for export to the noise mapping software.
o The GIS and the noise mapping software share a common data exchange interface, i.e. the noise mapping software must be able to read and write data formats compatible with the GIS.
o All final maps and all information for the EC and to the public are produced from within the GIS environment, including the generation of web-based services to access and disseminate data over the Internet.
Factors influencing cost
o The most important cost factor in noise mapping is the procurement of base data and the digitising of maps.
o Final costs depend heavily upon both the type of data already available and the ability and willingness of stakeholders to contribute to the creation of the database.
o Bitmap data formats may be useful for illustration but are of limited use in large-scale strategic noise mapping.
o The development density, the terrain structure and other elements are important cost factors in the acquisition of geographical data.
o The required accuracy of the final results is a major factor in cost estimation.
o A cost study commissioned by DG XI D.3 Urban Environment in 199916, shows a wide variability in cost estimates for the different E.U. Member Sates (M.S.): the lowest cost is estimated for Germany and the highest cost for Spain, Portugal and Italy. The wide spread of costs can be explained by the obvious difference in experience and availability of suitable data between M.S. and the size difference of the M.S. or their “agglomerations” as defined in Directive 2002/49/EC.
Data sharing
o In any type of database, the data should be available in a form that will allow its use in flexible and shared ways. The initial high cost of data-acquisition for its principal use is more easily justified if the data can eventually be shared with other users.
o To achieve a high level of data sharing the involvement of analysts and database programmers at an early stage in the process should be ensured.
o Data can be made available and stored in many different formats. The most useful formats are flexible and supported by different software applications. If the requirement of shared data use is added, isolated data files and file management programs must be replaced by a Database Management System that manages
16 COWI: Cost Study on Noise Mapping and Action Planning, EC DGXI D.3 Urban Environment, 1999
WG-AEN 016.2003.doc
Page 57 of 63
related data to form databases. Integrity and consistency of data are ensured and redundancy reduced. Databases are accessed by multiple users for different purposes. This concept has been extended over the past years by adding the visual mapping level to enhance information content of geo-referenced data. These software tools are called Geographic Information Systems (GIS).
o Strategic noise mapping data must be integrated into GIS in order to be used most effectively. The easier the process of integrating data into GIS, the lower the barrier to use the strategic noise mapping data. Streamlining the process of integrating noise mapping results into GIS ensures its active use and thereby helps to develop action plans and to eventually to implement them.
o Both the noise maps and the associated base data must be made available in common digital formats. Both must be geo-referenced in the same co-ordinate system. Note: Directive 2002/49/EC requires neighbouring Member States to co-operate on both strategic noise mapping near borders (Article 7, 4.) and on action plans for border regions (Article 8, 6.) adds another level of complexity, namely the transformation of different national co-ordinate systems.
o Member State
Features and advantages of using GIS for strategic noise mapping
o The centralisation of large amounts of acoustically relevant data from different administrations and authorities acting at different levels of decisional power into one geo-referenced database.
o Enhanced control and better understanding of the quality of the data (accuracy, completeness, etc.).
o Management of the data in a GIS environment providing a single unified standardised source of data.
o The centralised maintenance improves continuity in data management if data- and information-flow are well organised.
o The usability of the data is increased because of the geo-referencing of all elements of data within the GIS.
o Scalability is a system feature.
o The interconnection of GIS with noise mapping software provides for the fast and accurate assessment of the environmental impact of noise.
o The coupling between GIS and noise mapping software implements a planning and information system for noise-triggered decision-making.
o The data presentation facilities of a GIS provide options for making information available to the public in a most effective manner.
WG-AEN 016.2003.doc
Page 58 of 63
GIS - Towards a European dimension17
The need to handle an ever larger number of geo-referenced databases and to link them across borders (in the current context see Directive 2002/49/EC, Article 7, 4.) led the EU to develop the INSPIRE18 initiative. INSPIRE aims at sharing and linking geo-referenced data throughout EU Member States through “a distributed network of databases linked by common standards and protocols”, accessible through interoperable services that will help to produce and publish, find and deliver, and eventually use and understand geographic information over the Internet across European Union and Accession Countries.
Figure 3 – INSPIRE Vision
The architecture of INSPIRE is built upon the following elements: metadata (information on data) organised in distributed catalogues, basic reference data, thematic data and services to make data available (publish), view, access and trade data. INSPIRE envisages to develop guidelines on how to implement this architecture. These guidelines will, of course, build upon existing international standards such as ISO 19100, ETRS89, the Dublin Core Metadata Initiative, etc. In addition to data management and documentation, INSPIRE also addresses data exchange, sharing and viewing. This would make INSPIRE well suited to support Directive 2002/49/EC, which requires that data must be collected and managed to produce noise maps, which are nothing but another type of thematic geo-referenced data. Parts of this data must be shared at least between each Member State and the European Commission. For noise maps near borders, also data sharing between Member States is crucial for the successful implementation of Directive 2002/49/EC. Finally, there is the aspect of public access to information and again INSPIRE could provide support by addressing the issues of data policy.
17 All figures and technical information in this chapter from: INSPIRE Architecture and Standards Position Paper, INSPIRE Architecture and Standards Working Group/JRC-Institute for Environment and Sustainability, ISPRA, 2002-10-03
18 INSPIRE: INfrastructure for SPatial InfoRmation in Europe http://inspire.jrc.it/
WG-AEN 016.2003.doc
Page 59 of 63
Figure 4 – Data and uses
Strategic noise mapping of major roads, major railways, major airports and agglomerations defined in Directive 2002/49/EC puts a significant burden on Member States in terms of collection, procurement, harmonisation and management of data. It makes, therefore, economic sense to include from the outset the principles of data sharing and suitable access for all stakeholders in all GIS applications set up for noise mapping. All the input data for noise mapping and the products of strategic noise mapping are geo-referenced information entities that can be handled in GIS systems. All this data, including noise maps, noise levels at or near buildings, maps of the exceedance of limit values and all other types of maps as identified in Annex 4 of Directive 2002/49/EC can be managed as individual thematic data groups with all other thematic groups like buildings, road centrelines, terrain level information, walls, etc. The challenge that EU Member States and Accession Countries face for the implementation of Directive 2002/49/EC can be regarded as an opportunity to build coherent decentralised information systems and GIS applications in line with the forthcoming INSPIRE initiative.
WG-AEN 016.2003.doc
Page 60 of 63
Appendix 3
Dates and Deadlines Relating to the Implementation of the END
2002
Article 15 Entry into force This Directive shall enter into force on the day of its publication in the Official Journal of the European Communities.
Note:
The Directive was published in the Official Journal of the European Communities (L 189/12) on the 18 July 2002
2003
Article 12
Adaptation The Commission shall adapt Annex I, point 3, Annex II and Annex III hereto to technical and scientific progress in accordance with the procedure provided for in Article 13(2).
Annex II, section 2.2, last paragraph:
Those methods must be adapted to the definitions of Lden and Lnight. No later than 1 July 2003, the Commission will publish guidelines in accordance with Article 13(2) on the revised methods and provide emission data for aircraft noise, road traffic noise and railway noise on the basis of existing data.
2004
Article 10
Collection and publication of data by Member States and the Commission 1. No later than 18 January 2004, the Commission will submit a report to the European Parliament and the Council containing a review of existing Community measures relating to sources of environmental noise.
Article 14
Transposition 1. Member States shall bring into force the laws, regulations and administrative provisions necessary to comply with this Directive no later than 18 July 2004. They shall inform the Commission thereof.
2005
Article 7
Strategic noise mapping 1. Paragraph 2. No later than 30 June 2005, and thereafter every five years, Member States shall inform the Commission of the major roads which have more than six million vehicle passages a year, major railways which have more than 60 000 train passages per year, major airports and the agglomerations with more than 250 000 inhabitants within their territories.
WG-AEN 016.2003.doc
Page 61 of 63
Article 5
Noise indicators and their application 4. No later than 18 July 2005, Member States shall communicate information to the Commission on any relevant limit values in force within their territories or under preparation, expressed in terms of Lden and Lnight and where appropriate, Lday and Levening, for road-traffic noise, rail-traffic noise, aircraft noise around airports and noise on industrial activity sites, together with explanations about the implementation of the limit values.
Article 4
Implementation and responsibilities 1. Member States shall designate at the appropriate levels the competent authorities and bodies responsible for implementing this Directive, including the authorities responsible for:
(a) making and, where relevant, approving noise maps and action plans for agglomerations, major roads, major railways and major airports;
(b) collecting noise maps and action plans.
2. The Member States shall make the information referred to in paragraph 1 available to the Commission and to the public no later than 18 July 2005.
2006
Article 1
Objectives 2. This Directive shall also aim at providing a basis for developing Community measures to reduce noise emitted by the major sources, in particular road and rail vehicles and infrastructure, aircraft, outdoor and industrial equipment and mobile machinery. To this end, the Commission shall submit to the European Parliament and the Council, no later than 18 July 2006, appropriate legislative proposals. Those proposals should take into account the results of the report referred to in Article 10(1).
2007
Article 7
Strategic noise mapping 1. Member States shall ensure that no later than 30 June 2007 strategic noise maps showing the situation in the preceding calendar year have been made and, where relevant, approved by the competent authorities, for all agglomerations with more than 250 000 inhabitants and for all major roads which have more than six million vehicle passages a year, major railways which have more than 60 000 train passages per year and major airports within their territories.
Article 10
Collection and publication of data by Member States and the Commission 2. The Member States shall ensure that the information from strategic noise maps and summaries of the action plans as referred to in Annex VI are sent to the Commission within six months of the dates laid down in Articles 7 and 8 respectively.
Note: This means data from strategic noise maps have to be sent to the Commission by 30 December 2007 at the latest.
WG-AEN 016.2003.doc
Page 62 of 63
2008
Article 8
Action plans 1. Member States shall ensure that no later than 18 July 2008 the competent authorities have drawn up action plans designed to manage, within their territories, noise issues and effects, including noise reduction if necessary for:
(a) places near the major roads which have more than six million vehicle passages a year, major railways which have more than 60 000 train passages per year and major airports;
(b) agglomerations with more than 250 000 inhabitants. Such plans shall also aim to protect quiet areas against an increase in noise.
Article 7
Strategic noise mapping No later than 31 December 2008, Member States shall inform the Commission of all the agglomerations and of all the major roads and major railways within their territories.
2009
Article 10
Collection and publication of data by Member States and the Commission 2. The Member States shall ensure that the information from strategic noise maps and summaries of the action plans as referred to in Annex VI are sent to the Commission within six months of the dates laid down in Articles 7 and 8 respectively.
Note: This means that summaries of the action plans have to be sent to the commission by 18 January 2009 at the latest.
4. Every five years the Commission shall publish a summary report of data from strategic noise maps and action plans. The first report shall be submitted by 18 July 2009.
Article 11
Review and reporting 1. No later than 18 July 2009, the Commission shall submit to the European Parliament and the Council a report on the implementation of this Directive.
2012
Article 7
Strategic noise mapping 2. Member States shall adopt the measures necessary to ensure that no later than 30 June 2012, and thereafter every five years, strategic noise maps showing the situation in the preceding calendar year have been made and, where relevant, approved by the competent authorities for all agglomerations and for all major roads and major railways within their territories.
Article 10
Collection and publication of data by Member States and the Commission 2. The Member States shall ensure that the information from strategic noise maps and summaries of the action plans as referred to in Annex VI are sent to the Commission within six months of the dates laid down in Articles 7 and 8 respectively.
Note: This means data from strategic noise maps have to be sent to the Commission by 30 December 2012 at the latest.
WG-AEN 016.2003.doc
Page 63 of 63
2013
Article 8
Action plans 2. Member States shall ensure that, no later than 18 July 2013, the competent authorities have drawn up action plans notably to address priorities which may be identified by the exceeding of any relevant limit value or by other criteria chosen by the Member States for the agglomerations and for the major roads as well as the major railways within their territories.
2014
Article 10
Collection and publication of data by Member States and the Commission 2. The Member States shall ensure that the information from strategic noise maps and summaries of the action plans as referred to in Annex VI are sent to the Commission within six months of the dates laid down in Articles 7 and 8 respectively.
Note: This means that summaries of the action plans have to be sent to the commission by 18 January 2014 at the latest.