POST-IMPLEMENTATION EVALUATION OF ENTERPRISE RESOURCE PLANNING (ERP) SYSTEMS ArunKumar Madapusi, B.E., M.B.A. Dissertation Prepared for the Degree of DOCTOR OF PHILOSOPHY UNIVERSITY OF NORTH TEXAS May 2008 APPROVED: Richard E. White, Major Professor Lewis A. Taylor III, Committee Member Grant E. Miles, Committee Member Chang E. Koh, Committee Member D. Krishna Sundar, Committee Member Anat BarNir, Department Program Coordinator Nancy Boyd-Lillie, Chair of the Department of Management O. Finley Graves, Dean of the College of Business Administration Sandra L. Terrell, Dean of the Robert B. Toulouse School of Graduate Studies
Transcript
POST-IMPLEMENTATION EVALUATION OF ENTERPRISE
RESOURCE PLANNING (ERP) SYSTEMS
ArunKumar Madapusi, B.E., M.B.A.
Dissertation Prepared for the Degree of
DOCTOR OF PHILOSOPHY
UNIVERSITY OF NORTH TEXAS
May 2008
APPROVED: Richard E. White, Major Professor Lewis A. Taylor III, Committee Member Grant E. Miles, Committee Member Chang E. Koh, Committee Member D. Krishna Sundar, Committee Member Anat BarNir, Department Program Coordinator Nancy Boyd-Lillie, Chair of the Department of
Management O. Finley Graves, Dean of the College of Business
Administration Sandra L. Terrell, Dean of the Robert B. Toulouse
School of Graduate Studies
Madapusi, ArunKumar, Post-Implementation Evaluation of Enterprise Resource Planning
(ERP) Systems. Doctor of Philosophy (Management), May 2008, 295 pp., 41 tables, 9
illustrations, references, 174 titles.
The purposes of this dissertation were to define enterprise resource planning (ERP)
systems, assess the varying performance benefits flowing from different ERP system
implementation statuses, and investigate the impact of critical success factors (CSFs) on the ERP
system deployment process. A conceptual model was developed and a survey instrument
constructed to gather data for testing the hypothesized model relationships. Data were collected
through a cross-sectional field study of Indian production firms considered pioneers in
understanding and implementing ERP systems. The sample data were drawn from a target
population of 900 firms belonging to the Confederation of Indian Industry (CII). The production
firms in the CII member directory represent a well-balanced mix of firms of different sizes,
production processes, and industries.
The conceptual model was tested using factor analysis, multiple linear regression analysis
and univariate Anova. The results indicate that the contributions of different ERP system
modules vary with different measures of changes in performance and that a holistic ERP system
contributes to performance changes. The results further indicate that the contributions of CSFs
vary with different measures of changes in performance and that CSFs and the holistic ERP
system influences the success achieved from deployments. Also, firms that emphasize CSFs
throughout the ERP implementation process achieve greater performance benefits as compared
to those that focus on CSFs during the initial ERP system deployment. Overall, the results of the
study support the relationships hypothesized in the conceptual model.
Copyright 2008
by
ArunKumar Madapusi
ii
TABLE OF CONTENTS
Page
LIST OF TABLES........................................................................................................................ vii LIST OF ILLUSTRATIONS...........................................................................................................x Chapter
ERP System Implementation Status and Changes in Performance ......................................................................................................125
Influencers of ERP System Implementation Success ..................126
Summary ..................................................................................................127 3. RESEARCH METHODOLOGY.........................................................................129
A. PRE-NOTICE LETTER ......................................................................................261 B. FIRST WAVE MAILING PACKET...................................................................263
v
C. FIRST WAVE THANK YOU/REMINDER NOTE ...........................................277 D. SECOND WAVE INTRODUCTORY LETTER ................................................279 E. SECOND WAVE THANK YOU/REMINDER NOTE ......................................281
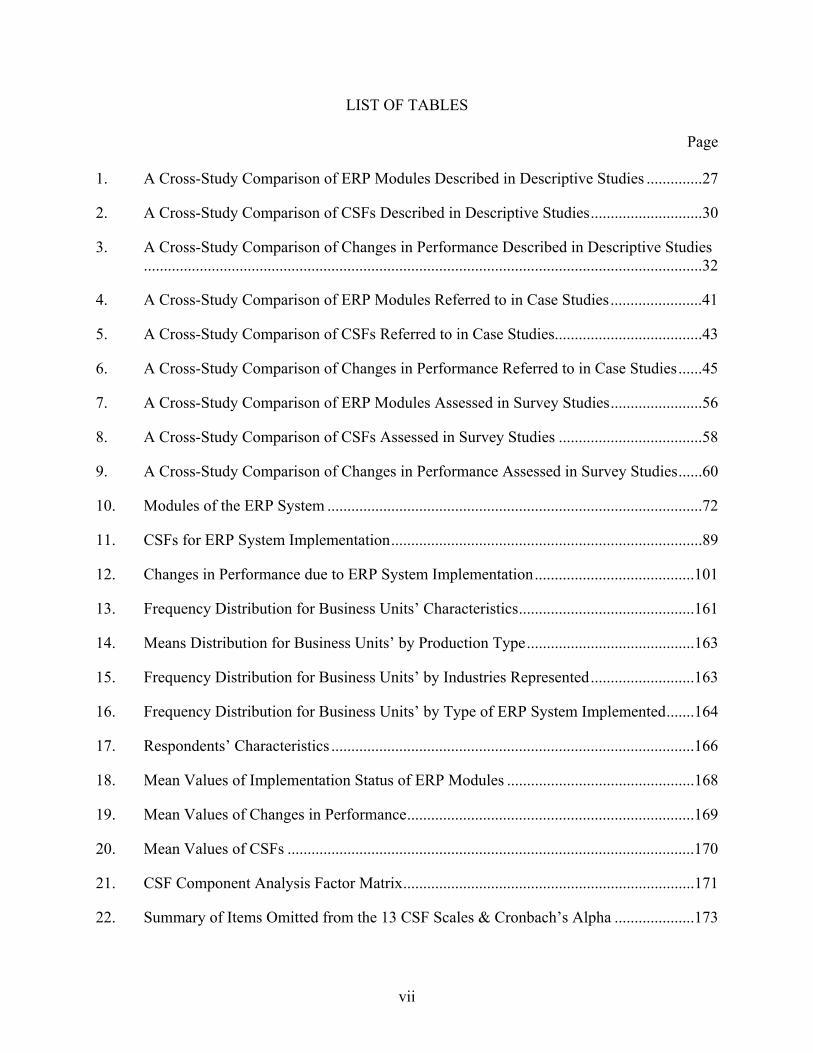
1. A Cross-Study Comparison of ERP Modules Described in Descriptive Studies ..............27
2. A Cross-Study Comparison of CSFs Described in Descriptive Studies............................30
3. A Cross-Study Comparison of Changes in Performance Described in Descriptive Studies ............................................................................................................................................32
4. A Cross-Study Comparison of ERP Modules Referred to in Case Studies.......................41
5. A Cross-Study Comparison of CSFs Referred to in Case Studies.....................................43
6. A Cross-Study Comparison of Changes in Performance Referred to in Case Studies......45
7. A Cross-Study Comparison of ERP Modules Assessed in Survey Studies.......................56
8. A Cross-Study Comparison of CSFs Assessed in Survey Studies ....................................58
9. A Cross-Study Comparison of Changes in Performance Assessed in Survey Studies......60
10. Modules of the ERP System ..............................................................................................72
11. CSFs for ERP System Implementation..............................................................................89
12. Changes in Performance due to ERP System Implementation........................................101
13. Frequency Distribution for Business Units’ Characteristics............................................161
14. Means Distribution for Business Units’ by Production Type..........................................163
15. Frequency Distribution for Business Units’ by Industries Represented..........................163
16. Frequency Distribution for Business Units’ by Type of ERP System Implemented.......164
22. Summary of Items Omitted from the 13 CSF Scales & Cronbach’s Alpha ....................173
vii
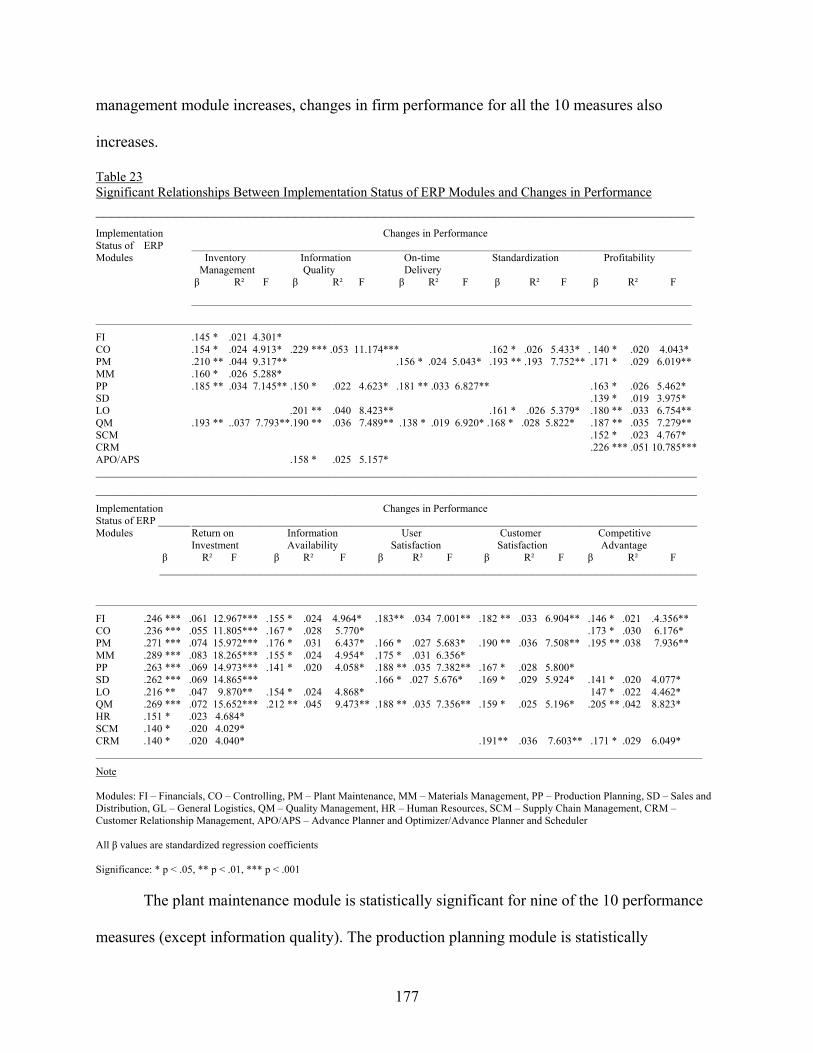
23. Significant Relationships Between Implementation Status of ERP Modules and Changes in Performance .................................................................................................................177
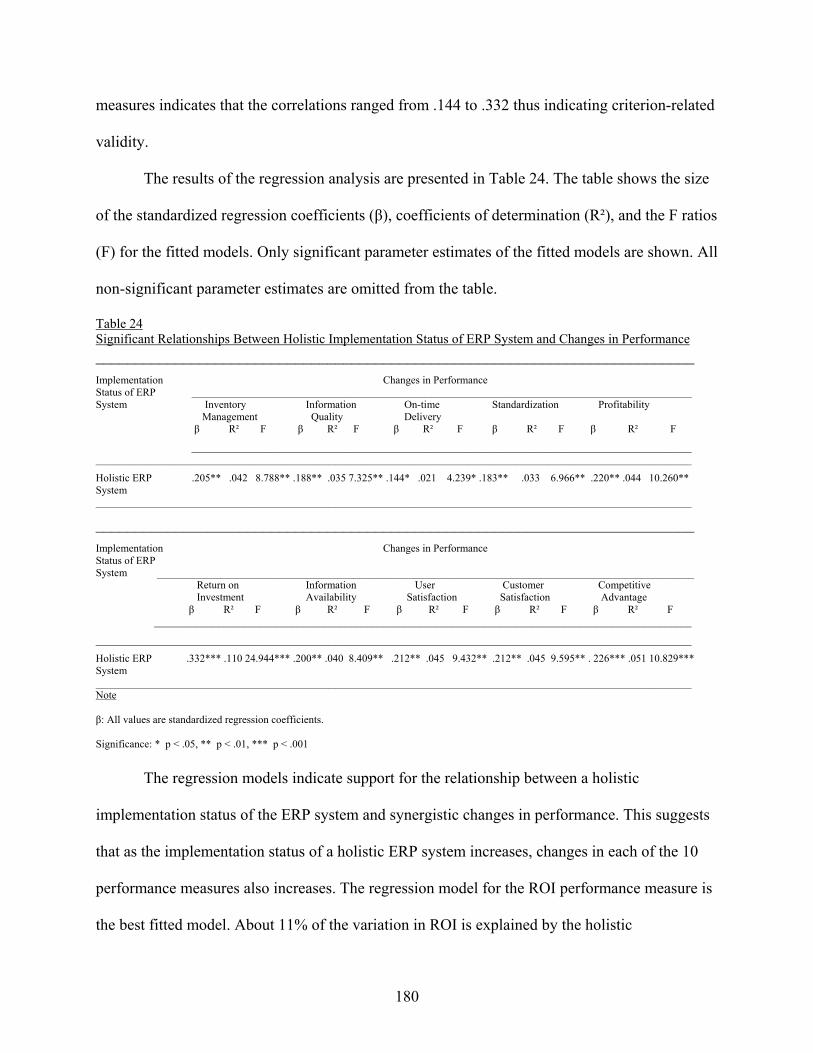
24. Significant Relationships Between Holistic Implementation Status of ERP System and Changes in Performance ..................................................................................................180
25. Significant Relationships Between Holistic Implementation Status of ERP System and Changes in Performance (ANOVA) ................................................................................181
26. Significant Relationships Between Different Holistic Implementation Statuses of ERP System and Changes in Performance...............................................................................184
27. Significant Relationships Between Different Holistic Implementation Statuses of ERP System and Overall Change in Performance ...................................................................185
28. Significant Interaction Relationships Between Implementation Status of ERP Modules and Changes in Performance ...........................................................................................186
29. Significant Interaction Relationships Between Implementation Status of ERP Modules and Changes in Performance (ANOVA) .........................................................................196
30. Significant Interaction Relationships Between Holistic Implementation Status of ERP System and Changes in Performance...............................................................................201
31. Significant Interaction Relationships Between Holistic Implementation Status of ERP System and Changes in Performance (ANOVA).............................................................203
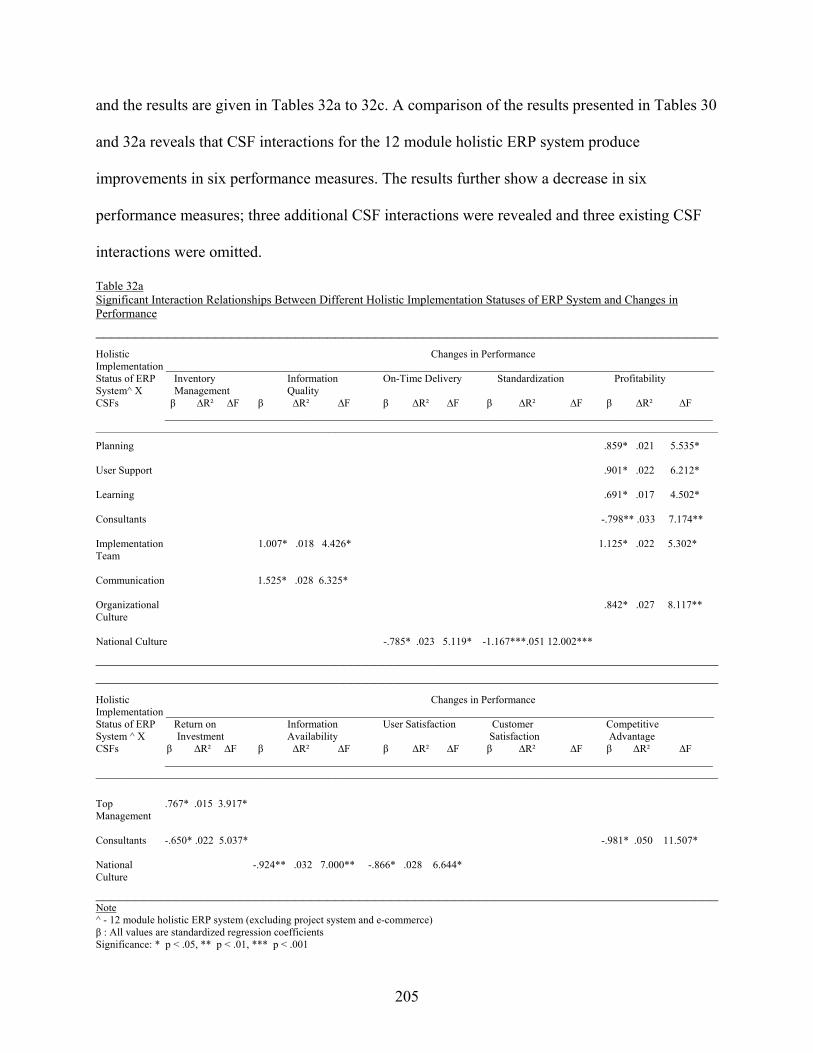
32. Significant Interaction Relationships Between Different Holistic Implementation Statuses of ERP System and Changes in Performance ..................................................................205
33. Significant Interaction Relationships Between Different Holistic Implementation Statuses of ERP System and Overall Change in Performance.......................................................209
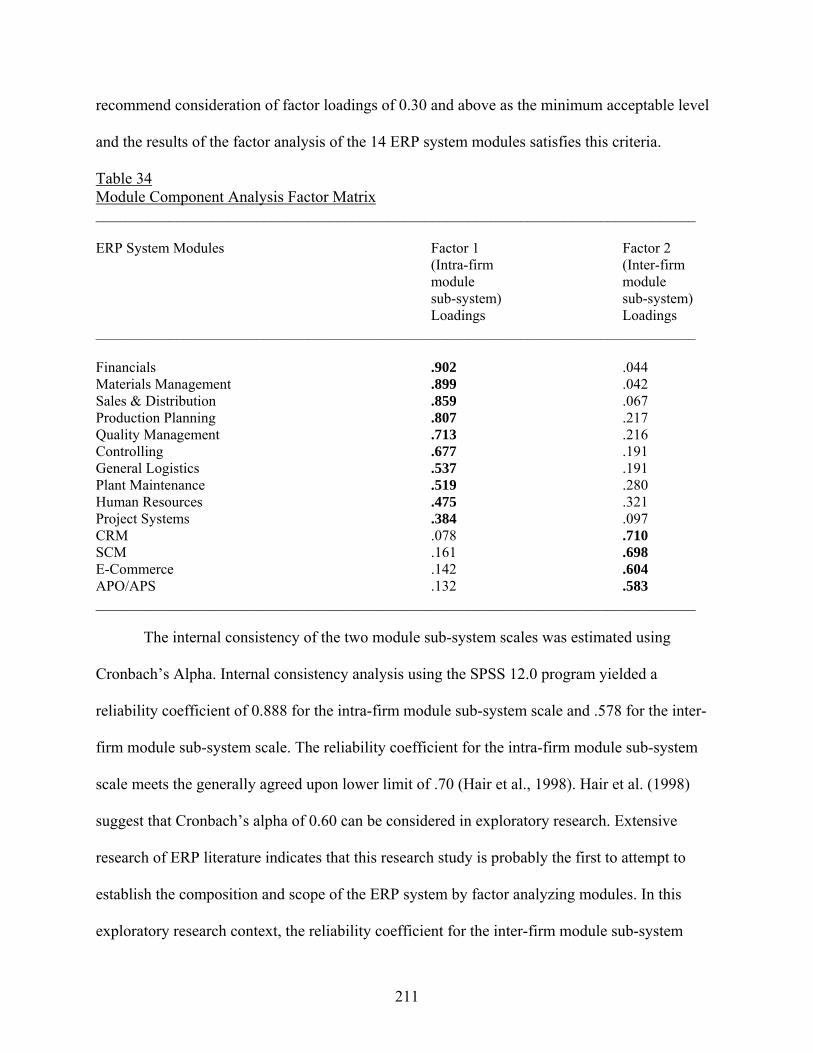
37. Ten CSF Factor Analysis .................................................................................................215
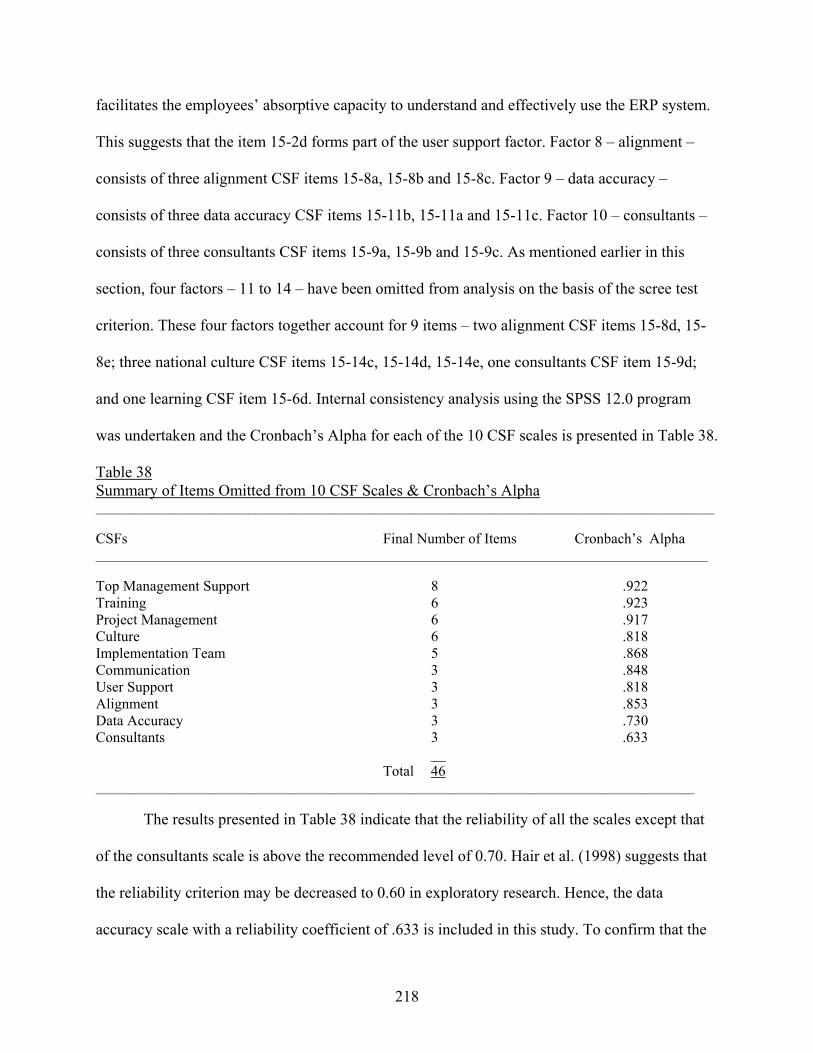
38. Summary of Items Omitted from 10 CSF Scales & Cronbach’s Alpha ..........................218
39. Item-to-Scale Correlations for 10 CSFs...........................................................................219
40. Significant Relationships Between Two Holistic ERP Module Sub-systems and Overall Change in Performance....................................................................................................220
viii
41. Significant Interaction Relationships Between Two Holistic ERP Module Sub-systems and Overall Change in Performance ................................................................................222
ix
x
LIST OF ILLUSTRATIONS
Page
1. General Model of ERP System Implementation................................................................12
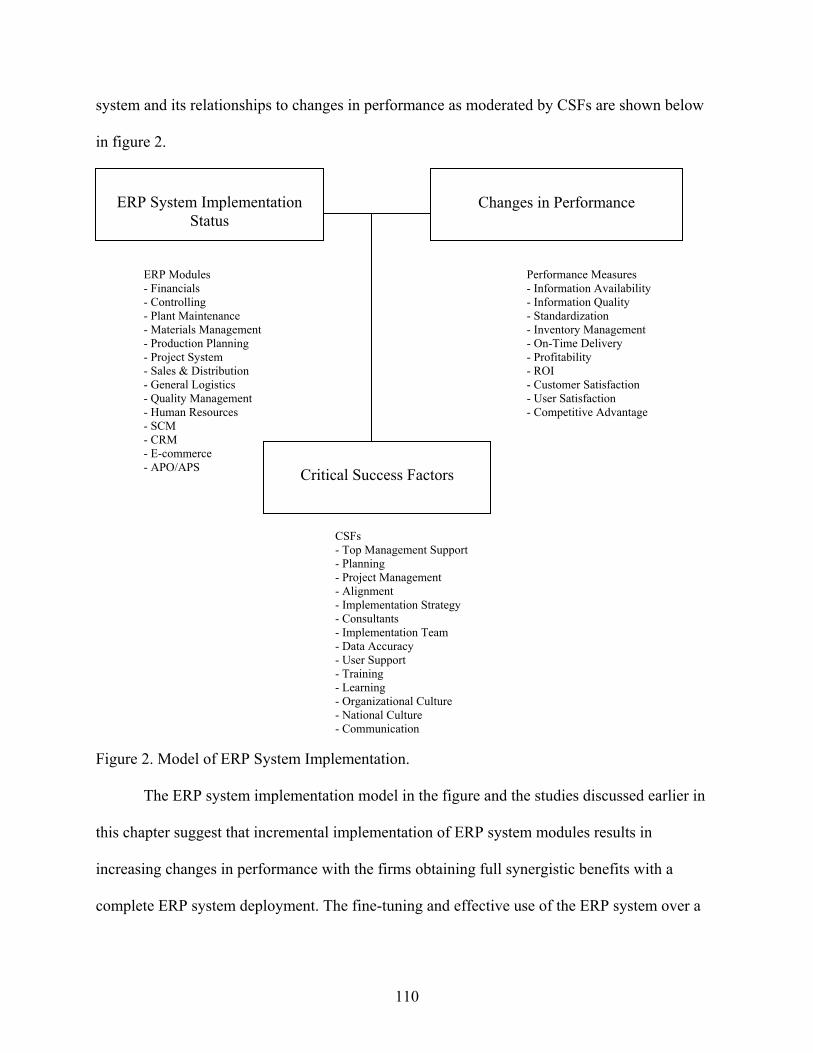
2. Model of ERP System Implementation ...........................................................................110
3. Galbraith’s Model of Organizational Design...................................................................112
4. Research Methodology to Test the Relationships Between ERP System Implementation Status, Changes in Performance, and CSFs .....................................................................130
5. Frequency Distribution Based on Percentage of Sales Generated from Manufacturing .156
6. Significant Effects Between Holistic Implementation Status of ERP System and Changes in Performance .................................................................................................................182
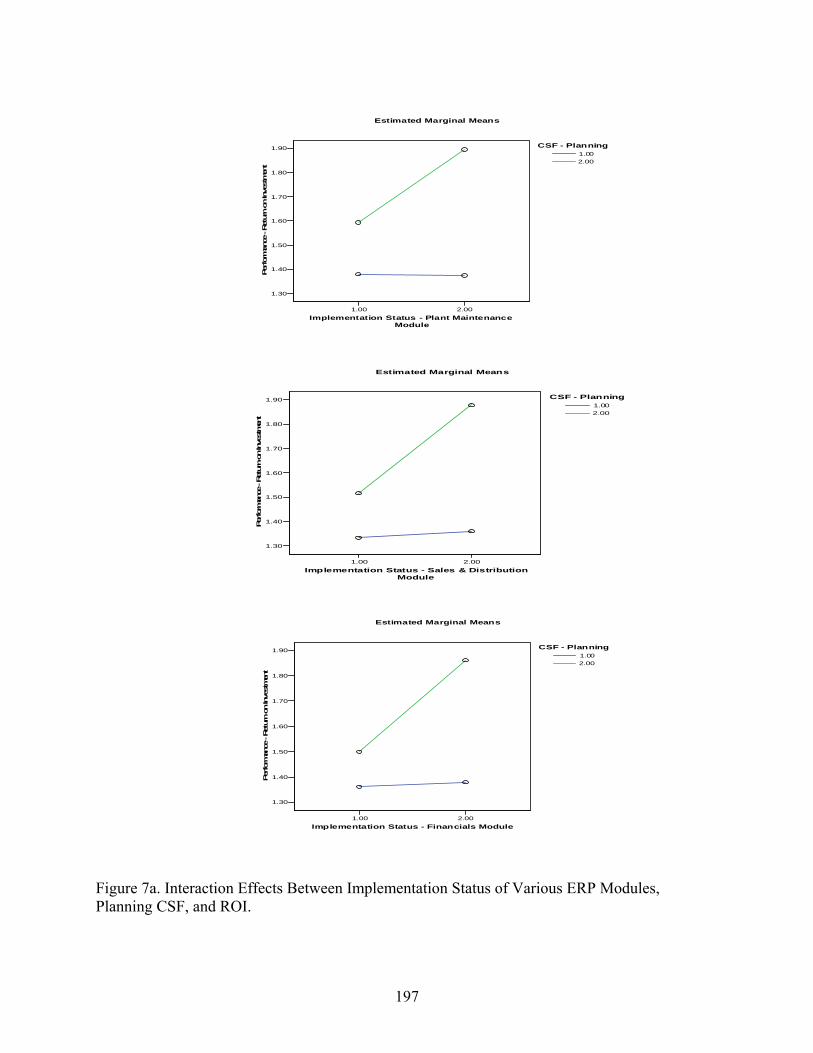
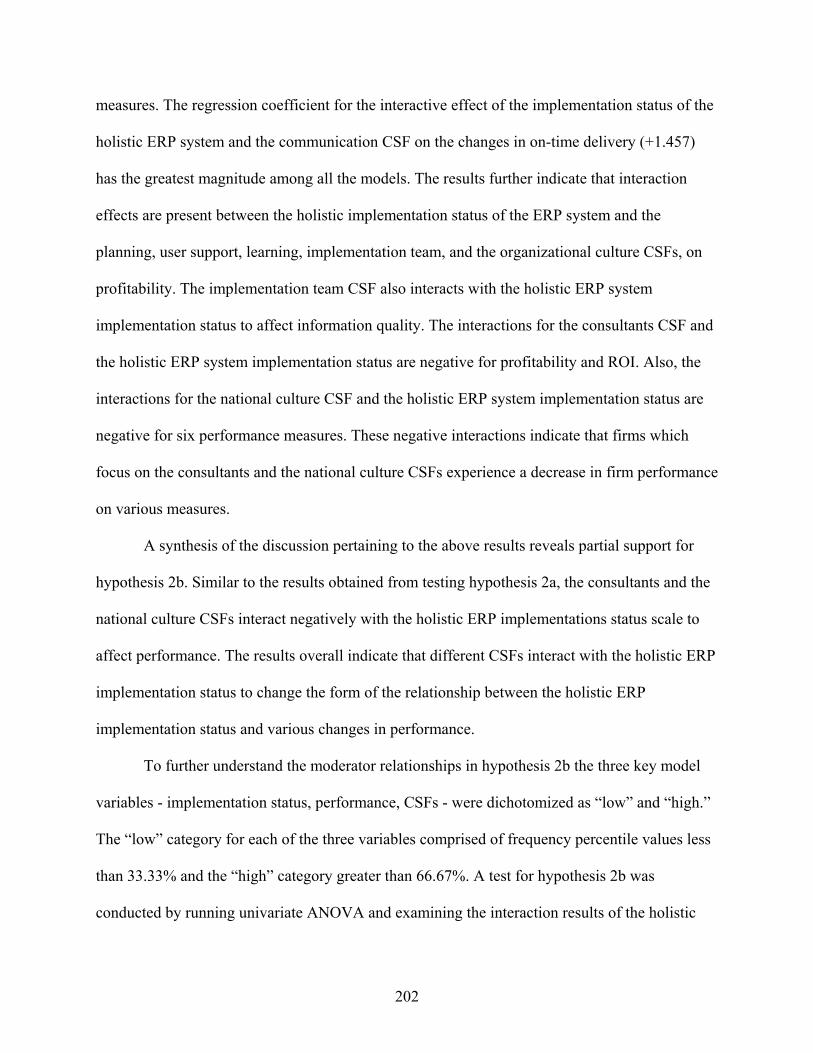
7. Interaction Effects Between Implementation Status of Various ERP Modules, Planning CSF, and ROI...................................................................................................................197
8. Interaction Effects Between Implementation Status of Various ERP Modules, Alignment CSF, and Competitive Advantage....................................................................................200
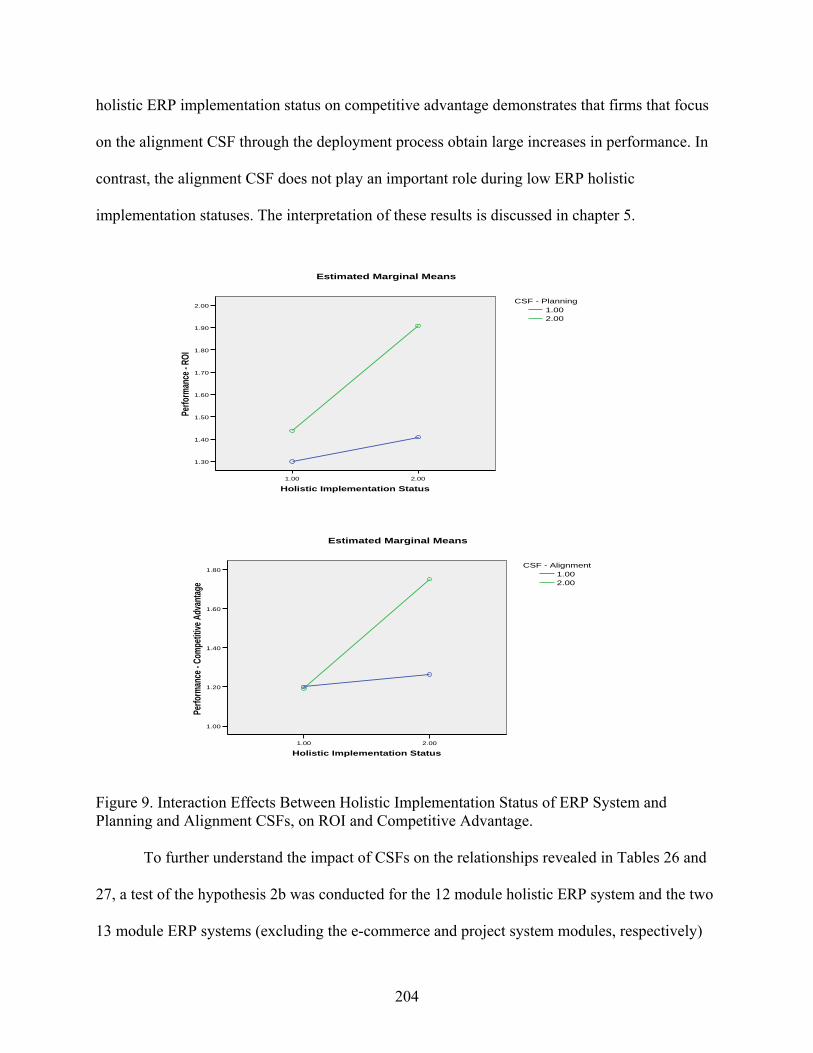
9. Interaction Effects Between Holistic Implementation Status of ERP System and Planning and Alignment CSFs, on ROI and Competitive Advantage ............................................204
1
CHAPTER 1
INTRODUCTION
Introduction Information management is a powerful driver of business performance and sustainable
organizational growth. Increased globalization over the past decade has forced firms worldwide
to face unprecedented levels of competition and operate in a dynamic business environment.
Firms seek to manage such competitive pressures and environmental uncertainties by adopting
best business practices, engaging in continuous design improvements, speeding up the product
development cycle, ensuring manufacturing flexibility, streamlining sourcing arrangements, and
managing myriad logistics channels. Firms are investing heavily in information technology (IT)
systems to effectively integrate and coordinate these activities across their supply chains as well
as shape the way they conduct business. In particular, more and more firms around the world are
implementing packaged software called enterprise resource planning (ERP) systems.
The global ERP market has registered explosive growth over the past decade increasing
from $1 billion in 1990 (Mabert, Soni, & Venkataramanan, 2000) to over $ 350 billion in 2004
(AMR Research, 2000; 2005; Gartner, 2003a; IDC, 2003; 2004). An overview of the global ERP
market by Datamonitor (2005) indicates that North America accounted for the bulk of ERP
system deployments (46%), Europe (28%), Asia-Pacific (20%), and South America (6%). A
similar market share distribution pattern has been forecast till 2008.
The ERP market’s high growth rates through much of the 1990s were mainly driven by
the year 2000 (Y2K) issue. Most ERP system implementers were firms belonging to the
developed countries from the North American, European, and the Asia-Pacific regions. The high
incidence of ERP system implementations in the developed markets during the 1990s was
2
facilitated by factors such as the presence of excellent infrastructure facilities, a strong economic
base, supportive government policies, high IT maturity and computer culture, and process-
oriented management (Huang & Palvia, 2001). The top five ERP system vendors (SAP, Oracle,
PeopleSoft, Baan, JD Edwards) accounted for about 59% of the global ERP market in 1999
(AMR Research, 2005).
In the early 2000s there was a slump in the ERP market as the Y2K-compliant ERP
system implementers in developed countries consolidated and leveraged their deployments to
maximize ERP system benefits. This period was marked by market consolidation among ERP
system vendors as they sought to improve their product lines by Web-enabling their products and
introducing add-ons to extend the ERP system across the supply chain. Most major ERP system
vendors also introduced ERP systems targeted at industry verticals and small and medium
enterprises (SMEs).
In contrast to the stagnant growth rates in the developed ERP markets in the early 2000s,
during this period there was increasing penetration of ERP systems in the underdeveloped ERP
markets in countries such as Asia, Africa, Middle East, and South America. The building up of
basic IT and complementary infrastructure to support IT related investments and global
competitive pressures resulted in an increasing number of ERP system deployments in the
emerging markets. Most firms in these markets are yet to consolidate and leverage their
implementations to obtain the full potential benefits from their ERP system.
In the past few years there has been a recovery in the ERP market (14% in 2004
according to AMR Research, 2005) marked by expanding implementation scope among firms in
the developed markets as well as new and expanded implementations in the developing markets.
In 2004, the Asia-Pacific region posted the highest growth rate (19%), followed by the North
3
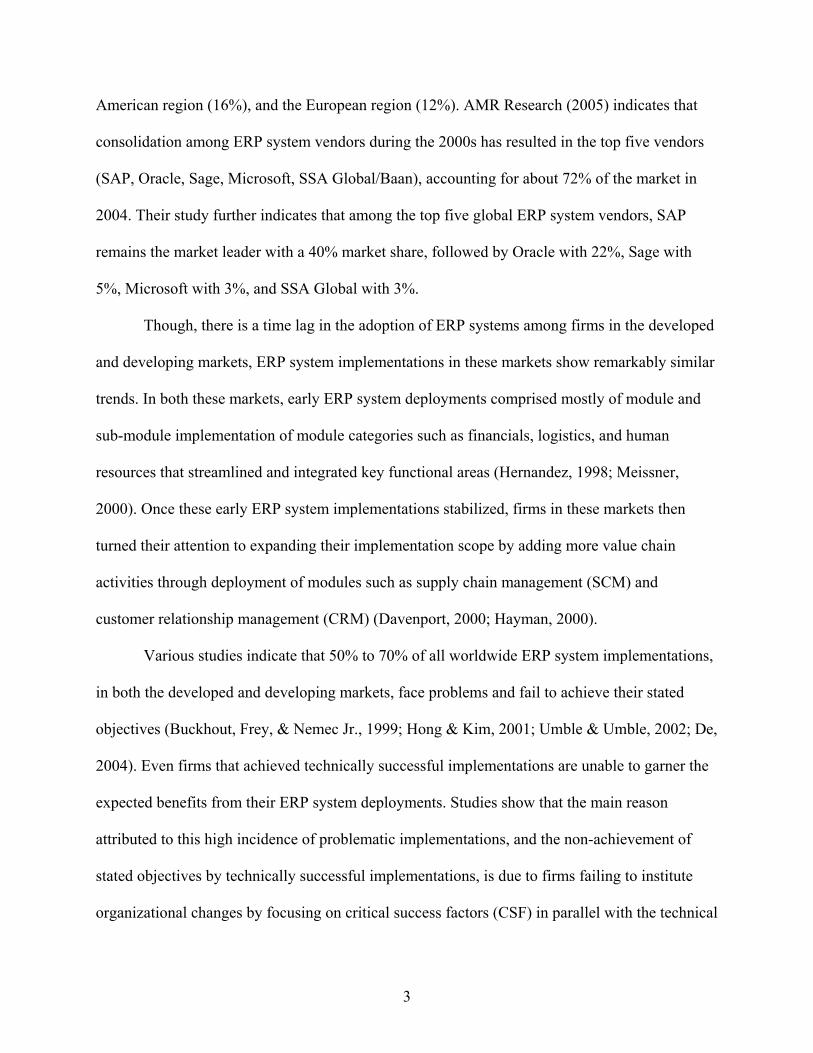
American region (16%), and the European region (12%). AMR Research (2005) indicates that
consolidation among ERP system vendors during the 2000s has resulted in the top five vendors
(SAP, Oracle, Sage, Microsoft, SSA Global/Baan), accounting for about 72% of the market in
2004. Their study further indicates that among the top five global ERP system vendors, SAP
remains the market leader with a 40% market share, followed by Oracle with 22%, Sage with
5%, Microsoft with 3%, and SSA Global with 3%.
Though, there is a time lag in the adoption of ERP systems among firms in the developed
and developing markets, ERP system implementations in these markets show remarkably similar
trends. In both these markets, early ERP system deployments comprised mostly of module and
sub-module implementation of module categories such as financials, logistics, and human
resources that streamlined and integrated key functional areas (Hernandez, 1998; Meissner,
2000). Once these early ERP system implementations stabilized, firms in these markets then
turned their attention to expanding their implementation scope by adding more value chain
activities through deployment of modules such as supply chain management (SCM) and
As firms stabilized their intra-firm deployments, they then extended their
implementations with the addition of modules that addressed inter-firm activities across the
supply chain. Typically firms deployed modules such as SCM, CRM, E-Commerce, product data
management (PDM), and EDI (Ayers, 2001; Tyler, 2002; Yen et al., 2002). Each of these
modules in turn comprises of numerous sub-modules that accessed the firm’s common database.
Critical Success Factors for ERP System Implementation
Though, firms generally reported success in their ERP system deployments, there are
many failures or near failures in implementing these systems (Buckhout et al., 1999; Hong &
Kim, 2001; Umble & Umble, 2002). Firms faced difficulties in completing their implementations
and achieving effective integration due to numerous technical, managerial, and organizational
challenges. Most firms adopted a CSF-based implementation approach to overcome these
difficulties.
Early CSF research identified individual CSFs and indicated that firms which focus on
these factors will achieve implementation success (Davenport, 1998; Bingi, Maneesh, & Jayanth,
10
1999; Padmanabhan, 1999). Researchers later realized that these CSFs are interdependent and
hence later CSF research focused on developing CSF frameworks to aid the ERP system
implementation process (Al-Mashari & Zairi, 2000; Sousa & Collado, 2000). Realizing that
different CSFs are important in different phases of the ERP project, recent literature prioritized
and classified CSFs, according to the ERP life cycle implementation process (Kraemmergaard &
Rose, 2002; Kumar, Maheshwari, & Kumar, 2003).
Changes in Performance due to ERP System Implementation
Firms collect, generate, and store huge quantities of data that are spread across divisions,
functions, regions, and databases. Though invaluable, this fragmented data represents one of the
main drags on business productivity and performance (Davenport, 1998). The early intra-firm
ERP system deployments enabled firms to standardize, integrate, and streamline their data and
process flows to provide seamless information for effective decision-making (Davenport, 1998;
Mabert et al., 2001a). Firms leveraged this information output to effect efficiency improvements
in functional areas such as inventory management, procurement, and order management (Mabert
et al., 2000; Madhavan, 2000). Once their early intra-firm ERP system deployments stabilized,
firms fine-tuned their systems and added modules to extend their ERP systems across the supply
chain. Firms then leveraged their early efficiencies to obtain strategic benefits such as increased
profitability, higher return on investment (ROI), and increased customer satisfaction (Johnson,
2000; Willis & Willis-Brown, 2002).
Systems Approach to ERP
Studies indicate that single module or sub-module implementations result in increased
efficiency benefits accruing to firms (Klaus et al., 2000; Hitt, Wu, & Zhouo, 2002). Most ERP
system studies, however, indicate that firms derive enhanced benefits by implementing all the
11
modules of the ERP system (Johnson, 2000; Mabert et al., 2001a; Poston & Grabski, 2001).
These studies also suggest that effective integration of modules over a number of years enhances
business performance. Firms facilitate the implementation process by instituting continuous
organizational changes in parallel with their technical implementations. The focus on managing
both the ERP system implementation as well as the larger environment further helps firms
maximize the benefits from their ERP systems. The above discussion suggests that firms which
adopt a systemic view of their system implementations derive optimal performance benefits.
Need for Research
Due to the relative newness of the ERP field, rapid advances in ERP technologies, and
the high incidences of implementation delays and failures, practitioner-oriented articles to a large
extent dominate literature. Descriptive and case studies form the bulk of academic research with
survey studies gaining prominence in the past four to five years. These studies, to a large extent,
adopted a short-term focus by stressing the effective management of the ERP system
implementation process. Only recently researchers have shifted their attention to the long-term
analysis of specific operational and usage issues.
Overall, empirical work on ERP systems is limited. Several modules that form part of the
ERP system have been identified, specific CSFs associated with effective implementations have
been examined, and the early benefits that firms obtain from their ERP systems have been listed.
Most of these studies, however, examined the above issues separately and systematic studies
with scientific rigor are by and large absent. The absence of theory-driven ERP models in
literature also provides a weak foundation for empirical work.
12
General Model of ERP System Implementation
This research study attempts to fill the literature gaps identified in the preceding
paragraphs by evaluating the varying performance benefits flowing from different ERP system
implementations as well as investigating the impact of CSFs on the ERP system deployment
process. A perusal of the discussion earlier in this chapter indicated that ERP systems comprise
of a number of modules. The systemic concept that underlies ERP systems suggests that
increasing changes in performance accrue to firms as they implement more and more modules of
the ERP system. Firms enhance their performance benefits by fine-tuning their ERP systems
through effective integration of modules over a number of years. Studies further show that CSFs
play a crucial role in facilitating ERP system deployments. A general model of ERP system
implementation based on the above discussion and elaborated further in chapter 2 is given in
Figure 1.
Figure 1. General Model of ERP System Implementation.
The model in the figure relates the ERP system implementation status to changes in
performance with the moderation of this relationship by CSFs. The theoretical underpinnings of
this model are based on the use of Galbraith’s information processing theory (Galbraith, 1977;
ERP System Implementation
Status
Changes in Performance
Critical Success Factors
13
Galbraith, Lawler III, & Associates, 1993; Mohrman, Galbraith, Lawler III, & Associates, 1998;
Galbraith, Downey, & Kates, 2002) discussed later in chapter 2.
The plateauing of the ERP market in developed countries and rising competitive and
global pressures has resulted in high ERP growth rates in the developing markets. An analysis of
literature in chapter 2 indicates that most ERP system research is focused on developed countries
and there is limited coverage of ERP issues in developing markets. Studies also show that the
ERP markets in both the developed and the developing countries face similar problematic
implementation issues. The paucity of theoretical ERP system research and the high rate of
implementation delays in the developing countries suggest that field testing the ERP system
implementation model in a developing country would be of immense benefit for researchers and
practitioners in the ERP arena. The Indian ERP market, described later in chapter 3, represents a
good market to test the ERP system implementation model. This research study is important as it
builds and tests a globally applicable, literature-based, and theory-driven ERP system
implementation model to enhance our understanding of ERP system concepts and associated
implementation issues and benefits. This understanding would enable firms to optimally leverage
their ERP systems and successfully face the increasing demands of globalization.
Research Questions
The first phase of this research study comprises of a literature review of ERP systems as
well as other relevant systems studies. A synthesis of literature led to the identification of the
various modules comprising the ERP system, the CSFs associated with ERP system
implementations, and the changes in performance that accrue from ERP system deployments.
Firms enhance their performance benefits with holistic ERP system deployment. Holistic ERP
systems in this study refer to complete ERP system deployment and fine-tuning the system
14
through effective module integration over a number of years. The relationship between each of
the ERP modules and changes in performance are first examined. Then, the relationship between
holistic ERP systems and changes in performance is investigated. Finally, the impact of CSFs on
the above relationships is examined to obtain a better understanding of the ERP system concept.
The following research questions are addressed in the first phase of this study:
(1) What are the modules that comprise an ERP system? (2) Does a holistic ERP system provide changes in performance? (3) What are the CSFs that impact ERP system implementations? (4) What are the changes in performance that result from ERP system implementations?
The second phase of this research study involves the development of a literature-based
and theory-driven ERP system implementation model with testable hypotheses. The modules,
CSFs, and performance changes identified in the first phase of the study constitute the model
variables. The model was tested through a cross-sectional survey of Indian firms that are
representative of the Indian production industry. Data were collected through a survey
instrument developed from literature. The data were analyzed through factor and regression
analyses as well as univariate analysis of variance (ANOVA) to test the relationship between the
relative contributions of ERP system modules and differential changes in firm performance as
moderated by CSFs. The following research questions are addressed in the second phase of this
research work:
(5) Does a relationship exist between the implementation status of the ERP system and changes in performance? (6) Do CSFs influence the relationship between the implementation status of the ERP system and changes in performance?
Summary
This chapter provided an overview of the global ERP market, examined the concept of
ERP systems, highlighted areas where there is a paucity of ERP system research, and formulated
15
research questions to address the imbalances in these research areas in the context of this study’s
objectives. In the ensuing chapters, a literature-driven and theory-based ERP system
implementation model to enhance our understanding of ERP systems is developed and
operationalized. The model was tested through a survey study using a sample of production firms
in India. Data collected from the survey were analyzed and evaluated to test the relationship
between ERP system implementation status and changes in firm performance as moderated by
CSFs.
The following outline is used to describe the research study: Chapter 1 gives an overall
view of the purpose of the study. It describes and defines ERP systems and traces their evolution.
The chapter further defines the research problem, derives research questions, and provides a
foundation for the following chapters. Chapter 2 reviews literature pertinent to the identified
research issues in this study. A synthesis of descriptive, case, and survey studies identifies the
modules of the ERP system, the CSFs associated with ERP system implementations, and
changes in firm performance resulting from ERP system deployments. Then the modules, CSFs,
and the changes in performance are grouped into categories based on literature. Galbraith’s
(1973, 1977) information processing model is used as a theoretical framework for the research
model of ERP system implementation suggesting linkages between the variables identified in the
literature review. Hypotheses derived from the model are postulated.
Chapter 3 reports the methodology used to conduct this research study and includes
issues concerning survey instrument development and data collection procedures. Chapter 4
presents the results of the analysis. Analysis includes factor analysis for summarization and data
reduction, and multiple regression analyses and univariate ANOVA for testing the postulated
hypotheses. Chapter 5 provides an overall summary of the findings of the study and discusses the
16
implications of the findings. The chapter also discusses the limitations of this research study and
suggests directions for future research.
This study contributes to the body of scientific knowledge by identifying the relationship
between ERP system implementation status and changes in firm performance. CSFs associated
with the facilitation of the ERP system implementation process and their impacts on the above
relationship were identified. Academicians and practitioners can leverage the information
presented in this research study to enhance their understanding of conceptual and system-
oriented ERP system issues, optimize their ERP system implementations, and hence maximize
the returns from their ERP systems.
17
CHAPTER 2
LITERATURE REVIEW
Introduction There is a lot of interest and discussion in enterprise resource planning (ERP) systems
over the past decade in the international arena. Firms belonging to the developed countries in
North America, Europe, and Asia-Pacific dominated the ERP market throughout most of the
1990s. Most firms in these developed markets have stabilized and extended their ERP system
and shifted their focus from implementation to effective system utilization and integration.
During the late 1990s and the early 2000s, ERP vendors turned their attention to the developing
countries in Asia, Africa, Middle East, and South America. The focus of most firms in these
developing markets is on the successful implementation and obtainment of early benefits from
their ERP system. This chapter, which represents a synthesis of ERP research and other relevant
studies, addresses the six research questions of this study, derives a theory driven ERP system
implementation model, and develops hypotheses for empirical testing.
The first part of this chapter consists of a timeline-based review of ERP system literature
consisting of descriptive studies, case studies, survey studies, and modeling and simulation
studies. Other relevant studies are also discussed to provide additional support to the findings
obtained from the ERP system studies. This is followed by a discussion of ERP system research
pertinent to the development of this study’s survey instrument.
The second part of this chapter represents a synthesis of the literature discussed in the
first part and identifies modules comprising the ERP system, the critical success factors (CSFs)
associated with the implementation process, and the changes in performance due to the ERP
system deployment. The systemic concept underlying ERP is also discussed to provide a
18
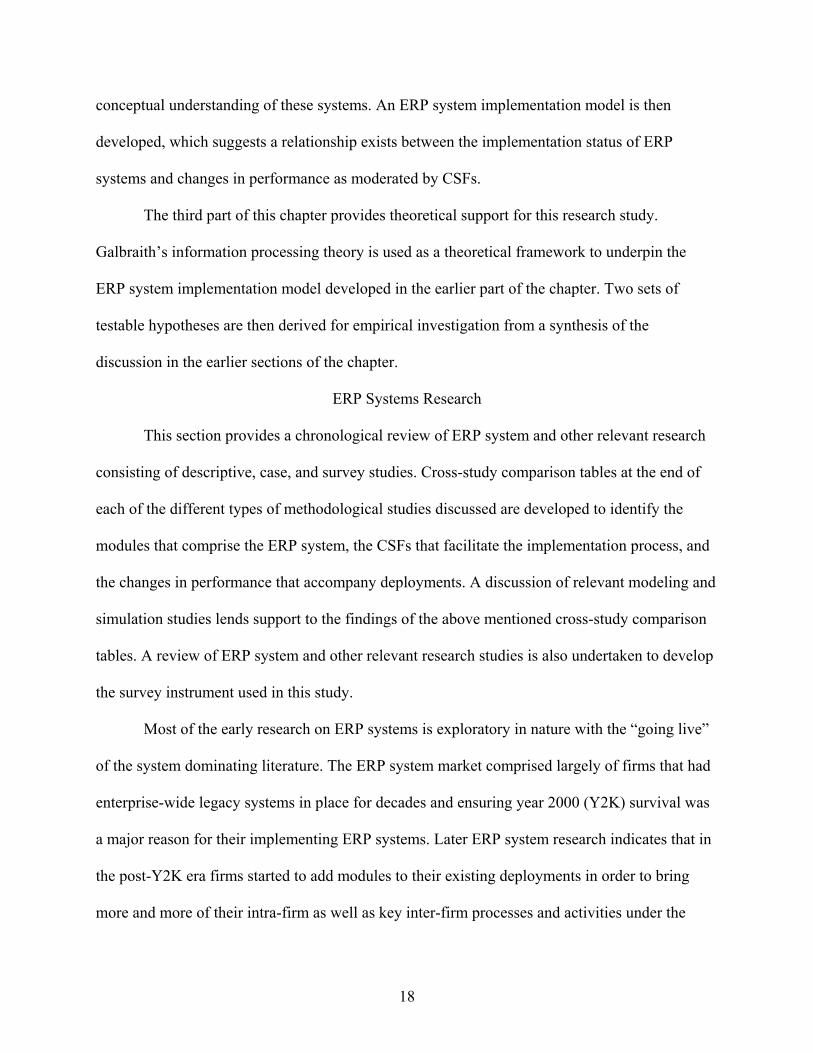
conceptual understanding of these systems. An ERP system implementation model is then
developed, which suggests a relationship exists between the implementation status of ERP
systems and changes in performance as moderated by CSFs.
The third part of this chapter provides theoretical support for this research study.
Galbraith’s information processing theory is used as a theoretical framework to underpin the
ERP system implementation model developed in the earlier part of the chapter. Two sets of
testable hypotheses are then derived for empirical investigation from a synthesis of the
discussion in the earlier sections of the chapter.
ERP Systems Research
This section provides a chronological review of ERP system and other relevant research
consisting of descriptive, case, and survey studies. Cross-study comparison tables at the end of
each of the different types of methodological studies discussed are developed to identify the
modules that comprise the ERP system, the CSFs that facilitate the implementation process, and
the changes in performance that accompany deployments. A discussion of relevant modeling and
simulation studies lends support to the findings of the above mentioned cross-study comparison
tables. A review of ERP system and other relevant research studies is also undertaken to develop
the survey instrument used in this study.
Most of the early research on ERP systems is exploratory in nature with the “going live”
of the system dominating literature. The ERP system market comprised largely of firms that had
enterprise-wide legacy systems in place for decades and ensuring year 2000 (Y2K) survival was
a major reason for their implementing ERP systems. Later ERP system research indicates that in
the post-Y2K era firms started to add modules to their existing deployments in order to bring
more and more of their intra-firm as well as key inter-firm processes and activities under the
19
ERP system. Firms focused on managing CSFs to facilitate their implementation process in an
attempt to achieve quicker benefits. Recent ERP system research indicates that firms are fine-
tuning their existing implementations and extending their ERP systems across the supply chain
to include front-office and back-office activities. In addition, firms have started to focus on the
effective utilization and integration of their ERP modules to derive synergistic benefits.
Due to the relative newness of the ERP field, research on ERP systems during the 1990s
was mostly dominated by descriptive and case studies. In the past four to five years, researchers
have started using survey methodologies to examine ERP system implementations. There is,
however, still a paucity of rigorous empirical studies on ERP systems as most of these survey
studies did not use validated survey instruments.
Descriptive Studies
Most early studies on ERP system implementations are descriptive in nature as firms
struggled to understand the nature of ERP systems, and the best way to deploy these systems to
realize potential benefits. Only recently have researchers started to address conceptual issues
such as the operational and strategic use of these systems. Other relevant studies discussed in this
section include material requirements planning (MRP), electronic data interchange (EDI), and
integration of multiple systems deemed relevant to ERP system implementing firms.
The various descriptive studies in this section have been chosen for discussion based on
their pertinence to this research study’s objectives. These studies are representative of ERP
descriptive literature and are described using a timeline-based approach. A cross-descriptive
study comparison is undertaken at the end of this section to build support for a theory-driven
ERP system implementation model.
20
ERP System Studies
Early descriptive literature discussed the initial issues confronting implementing firms
such as the composition of the ERP system, the CSFs to ensure implementation success, and the
early benefits that accrue to firms from their deployments. Typically these studies focused on
implementation activities and there is minimal coverage of system integration and usage issues.
This is due to the implementing firms’ focus on ensuring Y2K compliance.
Studies indicate that firms generally deploy a few modules and sub-modules that
automate key functional areas such as finance, human resources, and logistics (Hernandez, 1998;
Plant Maintenance Desc Desc Desc Desc Desc LS E-Commerce Desc Desc Desc LS Advanced Planning Optimization/Advanced Planning Scheduling
Desc Desc Desc Desc Desc LS
Management Information System
Desc Desc LS
Product Data Management
Desc Desc Desc LS
Studies Referenced
(1) Hernandez (1998) (2) Miller (1999) (3) Raghuraman (1999) (4) Sadagopan (1999) (5) Sastry (1999) (6) Appelrath and Ritter (2000) (7) Boss Corporation et al. (2000) (8) Meissner (2000) (9) Siriginidi (2000) (10) Ayers (2001) (11) Chen (2001 (12) Shields (2001) (13) Dataquest (2003) Note Desc = Described as a module of the ERP system. Imp = Implied as a module of the ERP system (not directly described). GS = Good support for inclusion as a module of the ERP system (module referenced in 50% or more of studies in the table). LS = Low support for inclusion as a module of the ERP system (module referenced in less than 50% of studies in the table).
28
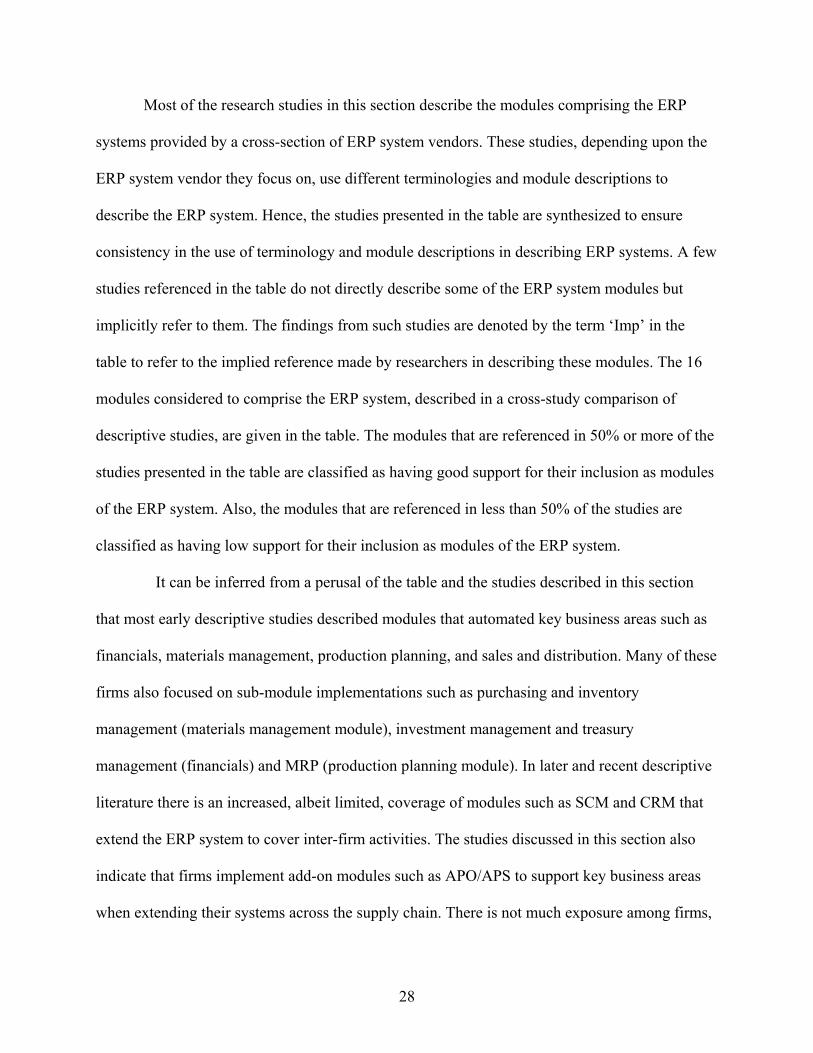
Most of the research studies in this section describe the modules comprising the ERP
systems provided by a cross-section of ERP system vendors. These studies, depending upon the
ERP system vendor they focus on, use different terminologies and module descriptions to
describe the ERP system. Hence, the studies presented in the table are synthesized to ensure
consistency in the use of terminology and module descriptions in describing ERP systems. A few
studies referenced in the table do not directly describe some of the ERP system modules but
implicitly refer to them. The findings from such studies are denoted by the term ‘Imp’ in the
table to refer to the implied reference made by researchers in describing these modules. The 16
modules considered to comprise the ERP system, described in a cross-study comparison of
descriptive studies, are given in the table. The modules that are referenced in 50% or more of the
studies presented in the table are classified as having good support for their inclusion as modules
of the ERP system. Also, the modules that are referenced in less than 50% of the studies are
classified as having low support for their inclusion as modules of the ERP system.
It can be inferred from a perusal of the table and the studies described in this section
that most early descriptive studies described modules that automated key business areas such as
financials, materials management, production planning, and sales and distribution. Many of these
firms also focused on sub-module implementations such as purchasing and inventory
management (materials management module), investment management and treasury
management (financials) and MRP (production planning module). In later and recent descriptive
literature there is an increased, albeit limited, coverage of modules such as SCM and CRM that
extend the ERP system to cover inter-firm activities. The studies discussed in this section also
indicate that firms implement add-on modules such as APO/APS to support key business areas
when extending their systems across the supply chain. There is not much exposure among firms,
29
however, to add-on modules like PDM as these are relatively firm-specific and are deployed
once firms stabilize their partial ERP system deployments.
Table 2 represents a cross-study comparison of CSFs considered crucial in facilitating
the implementation of ERP systems. Most of the research studies in this section describe CSFs
that are essential for achieving ERP system implementation success. Many of the studies in the
table limit their discussion to a few specific CSFs. Hence, the studies referenced in the table have
been chosen for their wide exposition of the CSFs essential for facilitating successful ERP
system deployment. Also, most studies explicitly describe the CSFs that firms should focus on to
ensure ERP system deployment success. A few studies referenced in the table, however, do not
explicitly discuss some of the CSFs but imply that their management is crucial for
implementation success. The findings from such studies are denoted by the term ‘Imp’ in the
table to refer to the implied reference made by researchers in describing these CSFs.
The 14 CSFs considered essential for ensuring ERP system implementation success,
described in a cross-study comparison of descriptive studies, are given in the table. The CSFs
that are referenced in 50% or more of the studies presented in the table are classified as having
good support for their inclusion as CSFs in ERP system implementations. Also, the CSFs that are
referenced in less than 50% of the studies are classified as having low support for their inclusion
as CSFs in ERP system implementations. A review of the table and the studies discussed in this
section reveals that most descriptive studies focused on CSFs emphasizing managerial issues
such as top management support, planning, project management, and alignment. Some firms
partially focus on certain CSFs like business case (planning), and steering committee (top
management). Firms also stress CSFs that emphasize organizational issues like user support,
training, learning, communication, user support, and organizational culture.
30
Table 2 A Cross-Study Comparison of CSFs Described in Descriptive Studies Critical Success Factors
Descriptive Studies
ERP Studies
1 2 3 4 5 6 7 8 9 10 11 12 13 14 15 16 Summary Top Management Support
Communication Desc Desc Imp Desc Desc Desc Desc Imp Desc Desc GS National Culture
Desc Imp LS
Studies Referenced
(1) Bingi et al. (1999) (2) Karakanian (1999) (3) Kochan (1999) (4) Padmanabhan (1999) (5) Raghuraman (1999) (6) Sastry (1999) (7) Sweat (1999) (8) Al-Mashari and Zairi (2000) (9) Comerford (2000) (10) Sousa and Collado (2000) (11) Chen (2001) (12) Nah et al. (2001) (13) Romeo (2001) (14) Weston Jr. (2001) (15) Lall (2003) (16) Satyan (2003) Note Desc = Described as a CSF in ERP system implementation. Imp = Implied as a CSF in ERP system implementation (not directly described). GS = Good support for inclusion as a CSF in ERP system implementation (CSF referenced in 50% or more of studies in the table). LS = Low support for inclusion as a CSF in ERP system implementation (CSF referenced in less than 50% of studies in the table).
The table indicates that there is good support for technical issues such as implementation
strategy, implementation team, data accuracy, and consultants. The table further reveals that
31
most studies do not address implementation challenges arising out of cross-border rollouts of the
ERP system.
Table 3 represents a cross-study comparison of changes in performance that result from
successful ERP system deployments. Most of the research studies in this section describe the
changes in performance that are essential for achieving ERP system implementation success. As
many of these studies limit their discussion to a few specific performance changes, the studies
referenced in the table have been chosen for their wide coverage of the changes in performance
experienced by firms that had successfully deployed ERP systems. Besides the changes in
performance obtained from a review of ERP studies, changes in performance from other relevant
studies deemed pertinent to ERP system implementing firms have also been included in the
table. Also, most studies listed in the table explicitly describe the performance changes that firms
obtain from their ERP system deployment. Many of these studies, however, do not explicitly
discuss some of the performance changes but imply that these are benefits that firms obtain from
their ERP systems. The findings from such studies are denoted by the term ‘Imp’ in the table to
refer to the implied reference made by researchers in describing these performance changes.
The 11 performance measures for assessing ERP system implementation success,
described in the cross-study comparison of descriptive studies, are given in the table. The
performance measures referenced in 50% or more of the studies presented in the table are
classified as having good support for their inclusion as performance measures in ERP system
implementations. Also, the performance measures referenced in less than 50% of the studies are
classified as having low support for their inclusion as performance measures in ERP system
implementations.
32
Table 3 A Cross-Study Comparison of Changes in Performance Described in Descriptive Studies Performance
(1) Caldwell (1998) (2) Bingi et al. (1999) (3) Menezes (1999) (4) Rajani (1999) (5) Chen (2001) (6) Adams (2002) (7) Drayer and Wight (2002) (8) Evgeniou (2002) (9) Wyatt (2002) (10) Dataquest (2003) (11) Miller and Sprague (1975) (12) Gupta and Neel (1992) (13) Hseih and Kleiner (1992) Note. Desc = Described as a performance measure in ERP system implementation. Imp = Implied as a performance measure in ERP system implementation (not directly described). GS = Good support for inclusion as a performance measure in ERP system implementation (performance measure referenced in 50% or more of studies in the table). LS = Low support for inclusion as a performance measure in ERP system implementation (performance measure referenced in less than 50% of studies in the table). Case Studies
From an analysis of the table as well as studies discussed in this section it can be inferred
that most studies focused on informational benefits such as standardization and information
availability. Firms consolidate these informational benefits and streamline their operations thus
realizing transactional improvements in areas like inventory management and on-time delivery.
The table as well as the studies discussed further show that firms obtained benefits such as
33
customer satisfaction, profitability, and competitive advantage. Firms also obtained partial
benefits throughout their implementation process like cost savings, personnel, and productivity,
all of which can be classified under the profitability performance measure.
Most empirical work in the area of ERP systems is limited to case studies. Early and later
case studies typically examine implementation issues to identify specific CSFs and also classify
them into frameworks. Recent literature indicates that firms have shifted their focus from
implementation issues to effective system usage and module integration in order to leverage the
full potential benefits of their ERP systems. Other relevant studies discussed in this section
include MRP, EDI, and integration of multiple application systems. These studies are relevant to
ERP system implementing firms and pertinent in the context of this research study’s objectives.
The analysis of case studies in this section is guided to the extent possible by
Eisenhardt’s (1989) study on theory building from case studies. The case studies in this section
were largely selected based on their ERP system implementation focus and pertinence to the
study’s research questions. These studies are representative of ERP case study literature and are
discussed using a time-based outline. A cross-case study comparison is undertaken at the end of
this section to build support for a theory-driven ERP system implementation model.
ERP System Studies
Early case study literature identified and classified the CSFs for implementation success
and listed early benefits by analyzing specific cases of firms that had deployed ERP systems. As
firms realized that their implementations involved changes in organizational structures,
processes, and work designs, they focused on CSFs that addressed these issues to obtain early
benefits.
34
Davenport (1998) examines the strategic implications of deploying a complete ERP
system. In a case study analysis of a multinational ERP system implementation, he indicates that
a planned top management driven and user supported implementation strategy is crucial for
ensuring technical and organizational changes as well as ERP system-business alignment. His
study demonstrates that benefits from successful implementations include the standardization
and integration of processes, increase in customer satisfaction and gaining of competitive
advantage due to leveraging of real-time accurate information, and increase in profitability
owing to savings in costs due to reduced levels of inventory, receivables, and labor.
Dataquest (1998) analyzes the implementation of an ERP system in a textile firm. The
key CSFs for a successful deployment include project management, customization to suit
industry and firm specific needs, continuous training programs, communication, change
management programs, top management support, project steering committee, and external
consultants. The firm used the real-time and accurate information available from the ERP system
to strength its supply chain activities, improve customer order planning and execution, and
standardize and integrate its business processes.
Cameron and Meyer (1998) investigate two ERP system deployments – one a failure and
the other a success. Their study suggests that CSFs can make or break implementations; the key
CSFs for successful deployment being planning, top management commitment, business process
skills, information technology (IT) skills, project management, training, and change readiness.
Holland and Light (1999) also use cross-study comparisons to identify CSFs for successful ERP
system deployment. They develop a general CSF model comprised of two components. The first
Supply Chain Management Imp Impl Impl Imp Impl Imp GS Project System Impl Impl Impl Impl Impl LS General Logistics Impl Imp Imp Imp Impl LS Quality Management Impl Impl Impl Impl Impl LS
Customer Relationship Management Imp Impl Imp LS E-Commerce Impl Impl Imp Impl LS Advanced Planning Optimization/Advanced Planning Scheduling
Imp LS
Studies Referenced
(1) Davenport (1998) (2) Madhavan (2000) (3) Parr and Shanks (2000a) (4) Koch (2001) (5) Barker and Frolick (2002) (6) Legare (2002) (7) Nandhakumar et al. (2002) (8) Teltumbde et al. (2002) (9) Worthen (2002) (10) Pasha (2003) (11) Sarkis and Sundarraj (2003) Note Impl = Implemented as a module of the ERP system. Imp = Implied as a module of the ERP system (not directly identified). GS = Good support for inclusion as a module of the ERP system (module referenced in 50% or more of studies in the table). LS = Low support for inclusion as a module of the ERP system (module referenced in less than 50% of studies in the table).
Most of the research studies in this section identify the modules comprising the ERP
systems provided by a cross-section of ERP vendors. These studies, depending upon which ERP
42
system vendor they focus on, use different terminologies and module descriptions to identify the
ERP system. Hence, the studies presented in the table are synthesized to ensure consistency in
the use of terminology and module descriptions in identifying ERP systems. A few studies
referenced in the table do not directly identify some of the ERP system modules but implicitly
refer to them. The findings from such studies are denoted by the term ‘Imp’ in the table to refer
to the implied reference made by researchers in identifying these modules.
The 14 modules considered to comprise the ERP system, identified in a cross-study
comparison of case studies, are given in the table. The modules that are referenced in 50% or
more of the studies presented in the table are classified as having good support for their inclusion
as modules of the ERP system. Also, the modules that are referenced in less than 50% of the
studies are classified as having low support for their inclusion as modules of the ERP system.
It can be inferred from a perusal of the table and studies discussed in this section that
most firms implemented the following modules - financials, materials management, and sales
and distribution - that automated key business areas of the firm. There is limited implementation
of modules such as quality management, project system, and general logistics. Many of the case
study firms also implemented sub-modules like order management and marketing (sales and
distribution module), payroll (human resources module), and purchasing and inventory
management (materials management module). The findings from the table further suggest that
firms initially extend their ERP systems to cover their supply chain activities before considering
customer-targeted activities.
Table 5 represents a cross-study comparison of CSFs considered essential for
facilitating the implementation of ERP systems. The studies referenced in the table have been
chosen for their wide coverage of the CSFs identified in specific case study firms.
43
Table 5 A Cross-Study Comparison of CSFs Referred to in Case Studies
(1) Cameron and Meyer (1998) (2) Dataquest (1998) (3) Davenport (1998) (4) Holland and Light (1999) (5) Kharbanda (1999) (6) Markus et al. (2000) (7) Parr and Shanks (2000a) (8) Soh et al. (2000) (9) Legare (2002) (10) Nandhakumar et al. (2002) (11) Sarker and Lee (2002) (12) Teltumbde et al. (2002) (13) Kumar et al. (2003) (14) Sarkis and Sundarraj (2003) (15) Zhang et al. (2005) (16) Anderson and Schroeder (1984) (17) Sheldon (1994) Note Iden = Identified as a CSF in ERP system implementation. Imp = Implied as a CSF in ERP system implementation (not directly identified). GS = Good support for inclusion as a CSF in ERP system implementation (CSF referenced in 50% or more of studies in the table). LS = Low support for inclusion as a CSF in ERP system implementation (CSF referenced in less than 50% of studies in the table).
44
Most studies in the table explicitly identify the CSFs that firms focus on to ensure ERP
system deployment success. A few studies referenced in the table do not explicitly identify some
of the CSFs but imply that their management is essential for implementation success. The
findings from such studies are denoted by the term ‘Imp’ in the table to refer to the implied
reference made by researchers in identifying such CSFs. Besides the CSFs identified from ERP
system studies, CSFs from other relevant studies deemed pertinent to ERP system implementing
firms have also been included in the table.
The 14 CSFs considered essential for ensuring ERP implementation success identified in
a cross-study comparison of case studies are given in the table. The CSFs that are referenced in
50% or more of the studies presented in the table are classified as having good support for their
inclusion as CSFs in ERP system implementation. Also, the CSFs that are referenced in less than
50% of the studies are classified as having low support for their inclusion as CSFs in ERP
system implementation. A review of the table as well as studies discussed earlier in this section
reveals that most firms accorded attention to managerial factors such as top management support,
planning, and project management as well as organizational factors such as user support,
communication, and organizational culture. The table further indicates that firms paid limited
attention to factors such as learning.
Table 6 represents a cross-study comparison of changes in performance that result from
the successful implementation of ERP systems. Many studies in this section discuss only a few
performance changes identified among the case study firms. Hence, the studies referenced in the
table have been chosen for their wide exposition of the changes in performance experienced by
the chosen case study firms. Besides the changes in performance obtained from a review of ERP
45
system studies, changes in performance from other relevant studies deemed pertinent to ERP
system implementing firms have also been included in the table.
Table 6 A Cross-Study Comparison of Changes in Performance Referred to in Case Studies Performance
Iden Iden Iden Iden Iden LS Cycle Times Iden Imp Iden Iden Iden Iden LS Monitoring Iden Iden LS Capacity Utilization
Iden Iden Iden Iden LS Competitive Advantage
Iden Iden Imp LS
Studies Referenced
(1) Dataquest (1998) (2) Davenport (1998) (3) Kharbanda (1999) (4) Madhavan (2000) (5) Markus et al. (2000) (6) Parr and Shanks (2000a) (7) Kennerley and Neely (2001) (8) Koch (2001) (9) Nandhakumar et al. (2002) (10) Teltumbde et al. (2002) (11) Ash and Burn (2003) (12) Sarkis and Sundarraj (2003) (13) Anderson and Schroeder (1984) (14) Harold (1997) Note Iden = Identified as a performance measure in ERP system implementation. Imp = Implied as a performance measure in ERP system implementation (not directly identified). GS = Good support for inclusion as a performance measure in ERP system implementation (performance measure referenced in 50% or more of studies in the table). LS = Low support for inclusion as a performance measure in ERP system implementation (performance measure referenced in less than 50% of studies in the table).
46
Most studies listed in the table explicitly identify a few of the performance changes that
firms obtain from their ERP system deployment. Many of these studies, however, do not
explicitly identify some of the performance changes but imply that these are benefits that firms
obtain from their ERP systems. The findings from such studies are denoted by the term ‘Imp’ in
the table to refer to the implied reference made by researchers in identifying these performance
changes. The 14 performance measures considered necessary for measuring ERP implementation
success identified in the cross-study comparison of case studies are given in the table. The
performance measures that are referenced in 50% or more of the studies presented in the table
are classified as having good support for their inclusion as performance measures in ERP system
implementation. Also, the performance measures that are referenced in less than 50% of the
studies are classified as having low support for their inclusion as performance measures in ERP
system implementation.
An analysis of the results in the table as well as the studies discussed in this section
indicates that most case studies focused on visible benefits such as standardization, integration,
and information availability. Some firms also indicate limited obtainment of benefits such as
information visibility (information availability) and forecast accuracy (information quality). As
these visible benefits result in the streamlining of operational areas, firms realize efficiency gains
in inventory management, on-time delivery, and productivity.
It can be further inferred from the table that only few studies address benefits such as
ROI, and profitability; though some firms report increases in cost savings, personnel and
productivity that contribute to increases in profitability. The changes in performance obtained
from other relevant studies pertaining to MRP and EDI system implementations suggest that
these firms leveraged their early visible gains to attain long-term benefits.
47
Survey Studies
Survey studies on ERP system implementations generally indicate that firms accorded
high priority to effectively managing their implementation process. Most firms used a CSF-based
approach and carried out organizational changes in parallel with their technical implementations.
As firms fine-tuned and expanded the scope of their implementations, they explored the use of
various performance metrics to measure the benefits accruing from their ERP systems.
This section also examines other relevant studies that address the implementation of
MRP, MRP II, JIT, EDI, and total quality management (TQM) systems. The findings from these
studies suggest that they are relevant to ERP system implementers. The survey studies discussed
in this section were largely selected based on their ERP system focus and pertinence to the
study’s research questions. These studies are representative of survey literature and follow a
time-based outline. A cross-survey study comparison is undertaken at the end of this section to
build support for a theory-driven ERP system implementation model.
ERP System Studies
Early survey research focused mainly on ERP system implementation issues. Various
studies analyzed the implementation and usage experiences of firms. A number of researchers
also investigated CSFs deemed important by firms in their implementation process as well as the
benefits obtained from their ERP systems.
Mabert et al. (2000), Mabert et al. (2001a), and Mabert, Soni, and Venkataramanan
(2001b) examine ERP system implementations among US manufacturing firms. Their studies
suggest that significant performance benefits accrue to firms that focus on CSFs while deploying
their ERP system. Mabert et al. (2000) collected data from 479 companies (response rate of 9.6%
- 479/5000) using a validated instrument from respondents in managerial positions. Their
48
findings suggest that the deployment time for ERP systems is about a year and is tied closely to
the implementation methodology used and the amount of customization undertaken. The
common modules implemented by firms were financial accounting, materials management,
production planning, order entry, purchasing, financial control, distribution and logistics, asset
management, quality management, personnel and human resources, maintenance, and research
and development. A small number of firms also extend and Web-enable their ERP systems to
cover supply chain partners as well as customers. Most firms leverage the information from their
ERP systems to attain early benefits and hence realize quicker ROI and profits.
Various studies examined the performance impact of CSFs on ERP system deployments
Petroni, 2002). White et al. (1982) examine the relationship between MRP system
implementation problems and the success or failure of MRP system deployments. Data were
gathered from respondents in managerial positions in 679 companies (response rate of 40% -
679/1700; effective sample size of 422) that had implemented MRP systems. The independent
variables assessed were company/environmental, and system features; the intervening variables
were implementation process, problems with data accuracy, and problems with management
support; and the dependent variables were improved performance, and user satisfaction.
The findings of the White et al. (1982) study suggest that the main factors that differentiate
successful and unsuccessful implementations were data accuracy, computerization, use of
outside expertise, management support, and implementation approach. Firms mostly faced
problems in areas such as education of employees, top management support, communications,
expertise, overcoming resistance, forecasting accuracy, and data accuracy. Firms realized
operational and organizational benefits from successful implementations. Validation of the
survey instrument would have added more validity to the study’s findings.
In another study, Duchessi, Schaninger, Hobbs, and Pentak (1988) identify the factors
that determine the successful implementation of MRP II systems. Data were gathered through a
validated instrument from the top management personnel of 352 firms (response rate of 7% -
352/4770, effective sample size of 272) that had implemented MRP systems. The independent
variables assessed were organizational/behavioral determinants, and manufacturing
54
determinants. The dependent variables were manufacturing planning and control, manufacturing
performance, and business/financial performance.
The findings of the Duchessi et al. (1988) study suggest that most firms had basic MRP II
functionality installed. Successful implementers, however, implemented more complete MRP II
functionality than less successful firms. Firms focused on key CSFs such as planning, control,
data accuracy, education, implementation team, and software and hardware characteristics. Firms
were aware that they could consolidate their early benefits and achieve greater performance with
full system functionality implementation and long-term system usage. The main concern about
the validity of the study’s findings is the low survey response rate.
In one of the few rigorous instrument development studies, Mirani and Lederer (1998)
use a two-stage survey to identify and operationalize the performance benefits that firms obtain
from their IT system implementations. In the first stage, their study identified nine performance
measures as well as items to measure these variables from a synthesis of IT and information
systems (IS) literature. The nine performance measures identified are competitive advantage,
alignment, customer relations, information access, information quality, information flexibility,
communications efficiency, systems development efficiency, and business efficiency. In the
second stage, data were gathered from a sample of 936 IS managers (response rate of 22% -
200/936). The data were analyzed using confirmatory factor analysis (CFA). Their findings
suggest support for the nine performance measures identified. The findings further suggest that
the instrument developed to capture data on the performance measures is a reliable and valid one.
The main limitation of this study is that respondents were not drawn from diverse functional
areas.
55
Summary
A review of ERP system and other relevant studies discussed in this section reveals that
most firms accorded high priority to effectively managing the implementations of their partial as
well as complete ERP systems. A few firms that deployed the holistic ERP system, however,
focused on operational and usage rather than implementation issues to obtain synergistic
benefits. Firms that accorded importance to instituting organizational changes along with their
technical implementations achieved smoother implementations and also obtained quicker accrual
of ERP system benefits.
Table 7 represents a cross-study comparison of ERP system modules assessed in the
survey studies discussed. The survey studies referenced in the table have been chosen for their
coverage of the modules comprising the ERP system. Most of the research studies in this section
assess the modules comprising the ERP system provided by a cross-section of ERP system
vendors. These studies, depending upon which ERP system vendor they focus on, use different
terminologies and module descriptions to describe the ERP system. Hence, the studies presented
in the table are synthesized to ensure consistency in the use of terminology and module
descriptions in assessing ERP systems. A few studies referenced in the table do not directly
assess some of the ERP system modules but implicitly refer to them. The findings from such
studies are denoted by the term ‘Imp’ in the table to refer to the implied reference made by
researchers in assessing these modules. The 16 modules comprising the ERP system, assessed in
a cross-study comparison of survey studies, are given in the table. The modules referenced in
50% or more of the studies presented in the table are classified as having good support for their
inclusion as modules of the ERP system. Also, the modules referenced in less than 50% of the
studies are classified as having low support for their inclusion as modules of the ERP system.
56
Table 7 A Cross-Study Comparison of ERP Modules Assessed in Survey Studies
Modules
Survey Studies
ERP Studies
1 2 3 4 5 6 7 8 9 10 11 Summary Financials A A A A A A A GS Controlling A Imp A A A A GS Materials Management A A Imp A A A A A A GS Production Planning A A A A A A GS Sales and Distribution A A A A Imp A A A A GS Inventory Management A A Imp A A A GS Supply Chain Management
A A Imp A Imp A A A GS
Customer Relationship Management
A
A Imp Imp A A A A A GS
E-Commerce A Imp A Imp A A A GS Plant Maintenance A A A LS General Logistics A A A A A LS Quality Management A Imp A A LS Human Resources A A A A A LS Advanced Planning Optimization/Advanced Planning Scheduling
A A A A A LS
Electronic Data Interchange
A A A LS
Knowledge Management
Imp Imp Imp Imp A LS
Studies Referenced
(1) Mabert et al. (2000) (2) Ross and Vitale (2000) (3) Bradford and Roberts (2001) (4) Francalanci (2001) (5) Mabert et al. (2001a) (6) Gefen and Ridings (2002) (7) Mabert et al. (2003b) (8) Olhager and Selldin (2003) (9) Tarafdar and Roy (2003) (10) Hawking and Stein (2004) (11) Gefen and Ragowsky (2005) Note
A = Assessed as a module of the ERP system. Imp = Implied as a module of the ERP system (not directly assessed). GS = Good support for inclusion as a module of the ERP system (module referenced in 50% or more of studies in the table). LS = Low support for inclusion as a module of the ERP system (module referenced in less than 50% of studies in the table).
It can be inferred from a perusal of the table as well as the studies discussed in this
section that there is a paucity of rigorous empirical studies on ERP system implementations as
compared to descriptive and case study literature. Most firms implemented modules such as
financials, materials management, and sales and distribution, which automated a few of their key
57
business activities. Some firms also undertook sub-module implementations such as
manufacturing (part of production planning) and order entry (part of sales and distribution). The
table’s findings suggest that most firms Web-enabled extensions to include their suppliers and
customers. This early integration of primary business activities results in quicker accrual of
benefits to firms. The limited coverage of modules like human resources, quality management,
and plant maintenance shows that firms stabilize their early module deployments as well as a few
key extension module implementations and then bring these support activities under the purview
of the ERP system.
Table 8 represents a cross-study comparison of CSFs considered necessary in ensuring
the successful implementation of ERP systems. Most of the literature in this section assesses
CSFs considered essential for facilitating ERP system deployments. Many of the studies limit
their discussion to a few CSFs assessed among the surveyed firms. Hence, the survey studies in
the table have been chosen for their wide coverage of the CSFs for the respondent firms. A few
studies referenced in the table do not explicitly assess CSFs but implicitly refer to them as
essential for implementation success. The findings from such studies are denoted by the term
‘Imp’ in the table to refer to the implied reference made by researchers in assessing the CSFs.
Besides the CSFs synthesized from ERP system studies, CSFs from other relevant studies
deemed relevant to ERP system implementing firms have also been included in the table. The 15
CSFs considered essential for ensuring ERP system deployment success assessed in a cross-
study comparison of survey studies are given in the table.
58
Table 8 A Cross-Study Comparison of CSFs Assessed in Survey Studies Critical Success Factors
Planning A A A A A A A A Imp Imp Imp A A A A GS Project Management
Imp Imp A Imp A Imp Imp Imp A Imp Imp GS Alignment (BPR & Customization)
A A A A Imp A A A A A A Imp Imp A A GS
Implementation Strategy
Imp A A A A A Imp A A Imp Imp GS Consultants A A A Imp A Imp A A A A GS Implementation Team
Imp A Imp A A A A A Imp A A Imp Imp A A Imp GS Data Accuracy A A A A Imp Imp Imp A A A A A A GS User Support A Imp A Imp A Imp Imp A A A Imp A GS Training A A A A A A A Imp A A A Imp A A A GS Learning Imp A Imp A A A A A A A A GS Organizational Culture
A A Imp Imp Imp Imp Imp A Imp A GS Communication A Imp A Imp A A A Imp A Imp GS National Culture
Imp A Imp Imp Imp A A LS IT Readiness A A A LS
Studies Referenced
(1) Kanungo and Bagchi (2000) (2) Ross and Vitale (2000) (3) Besson and Rowe (2001) (4) Mabert et al. (2001a) (5) Mabert et al. (2001b) (6) Stratman and Roth (2002) (7) Mabert et al. (2003a) (8) Mabert et al. (2003b) (9) Olhager and Selldin (2003) (10) Tarafdar and Roy (2003) (11) Hawking and Stein (2004) (12) Schroeder et al. (1981) (13) White et al. (1982) (14) Duchessi et al. (1988) (15) Li et al. (2001) (16) Lau et al. (2002) (17) Petroni (2002) Note A = Assessed as a CSF in ERP system implementation. Imp = Implied as a CSF in ERP system implementation (not directly assessed). GS = Good support for inclusion as a CSF in ERP system implementation (CSF referenced in 50% or more of studies in the table). LS = Low support for inclusion as a CSF in ERP system implementation (CSF referenced in less than 50% of studies in the table).
59
The CSFs referenced in 50% or more of the studies presented in the table are classified as
having good support for their inclusion as CSFs in ERP system implementations. Also, the CSFs
referenced in less than 50% of the studies are classified as having low support for their inclusion
as CSFs in ERP system implementations. A review of the table as well as studies discussed in
this section reveals that most firms judiciously managed their CSFs by emphasizing managerial
and technical factors such as top management support, planning, alignment, implementation
team, and data accuracy. There is limited focus on IT readiness or the impact of different
national cultures on ERP system implementations. The findings from the table further suggest
that in contrast to the ERP system implementers, firms that have implemented other application
systems focused on most of the CSFs assessed in the survey studies. ERP system implementing
firms can leverage the findings from these other system application studies to enhance their
implementation success.
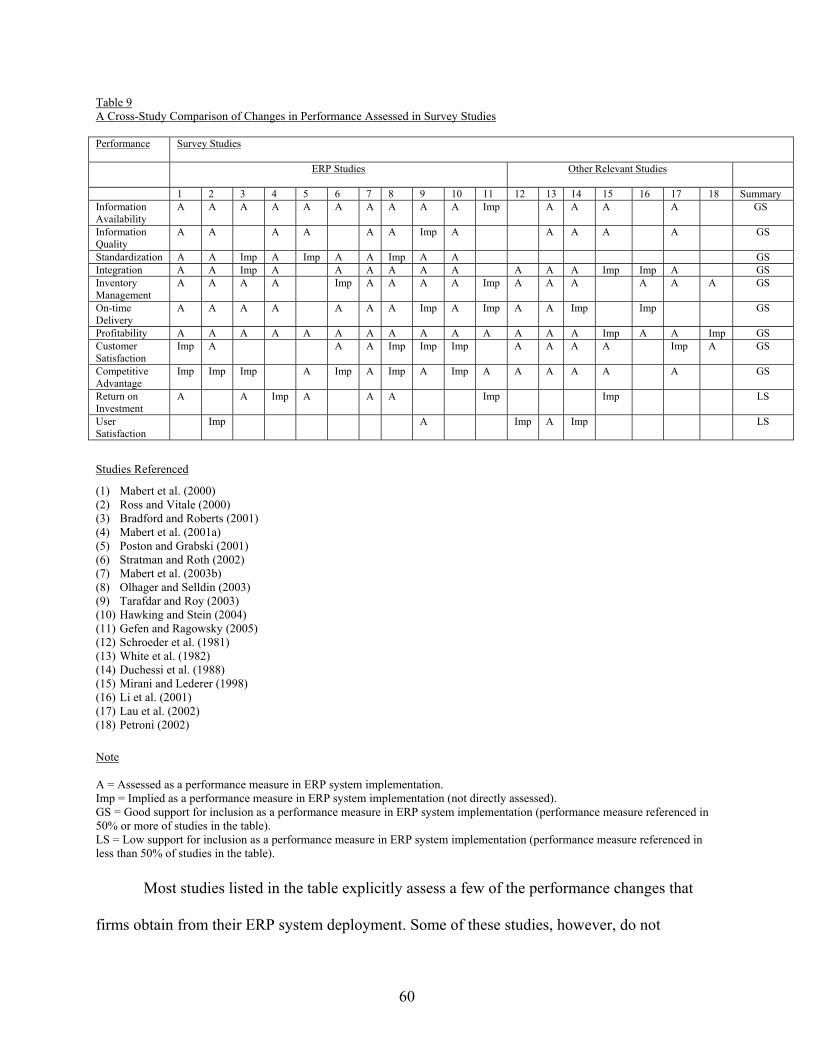
Table 9 represents a cross-study comparison of changes in performance resulting from
the successful implementation of ERP systems. Most of the studies in this section assess the
changes in performance that are essential for achieving ERP system implementation success.
Many of these studies in the table limit their discussion to a few assessed performance changes in
their study samples. Hence, the studies referenced in the table have been chosen for their wide
coverage of the changes in performance in the surveyed firms. Besides the changes in
performance obtained from a review of ERP system studies, changes in performance from other
relevant studies deemed pertinent to ERP system implementing firms have also been included in
the table.
60
Table 9 A Cross-Study Comparison of Changes in Performance Assessed in Survey Studies Performance
A A A A A A Imp A A A A A GS Standardization A A Imp A Imp A A Imp A A GS Integration A A Imp A A A A A A A A A Imp Imp A GS Inventory Management
A A A A Imp A A A A Imp A A A A A A GS On-time Delivery
A A A A A A A Imp A Imp A A Imp Imp GS Profitability A A A A A A A A A A A A A A Imp A A Imp GS Customer Satisfaction
Imp A A A Imp Imp Imp A A A A Imp A GS Competitive Advantage
Imp Imp Imp A Imp A Imp A Imp A A A A A A GS Return on Investment
A A Imp A A A Imp Imp LS User Satisfaction
Imp A Imp A Imp LS
Studies Referenced
(1) Mabert et al. (2000) (2) Ross and Vitale (2000) (3) Bradford and Roberts (2001) (4) Mabert et al. (2001a) (5) Poston and Grabski (2001) (6) Stratman and Roth (2002) (7) Mabert et al. (2003b) (8) Olhager and Selldin (2003) (9) Tarafdar and Roy (2003) (10) Hawking and Stein (2004) (11) Gefen and Ragowsky (2005) (12) Schroeder et al. (1981) (13) White et al. (1982) (14) Duchessi et al. (1988) (15) Mirani and Lederer (1998) (16) Li et al. (2001) (17) Lau et al. (2002) (18) Petroni (2002) Note A = Assessed as a performance measure in ERP system implementation. Imp = Implied as a performance measure in ERP system implementation (not directly assessed). GS = Good support for inclusion as a performance measure in ERP system implementation (performance measure referenced in 50% or more of studies in the table). LS = Low support for inclusion as a performance measure in ERP system implementation (performance measure referenced in less than 50% of studies in the table).
Most studies listed in the table explicitly assess a few of the performance changes that
firms obtain from their ERP system deployment. Some of these studies, however, do not
61
explicitly assess some of the performance changes but imply that these are benefits that firms
obtain from their ERP systems. The findings from such studies are denoted by the term ‘Imp’ in
the table to refer to the implied reference made by researchers in assessing these performance
changes. The 11 performance measures considered necessary for measuring ERP system
implementation success assessed in the cross-study comparison of survey studies are given in the
table. The performance measures referenced in 50% or more of the studies presented in the table
are classified as having good support for their inclusion as performance measures in ERP system
implementations. Also, the performance measures referenced in less than 50% of the studies are
classified as having low support for their inclusion as performance measures in ERP system
implementations.
An analysis of the table as well as studies discussed in this section reveals that most of
the surveyed firms used real-time accurate information from their ERP systems to obtain benefits
such as improved inventory management, and on-time delivery. Firms then leveraged these
benefits into financial improvements as evidenced by good support for the profitability measure.
This shows that firms were able to consolidate their early financial gains arising out of cost
savings, personnel, and productivity to increase their profitability. It can be inferred from the
table as well as the studies discussed that firms were able to increase their customer satisfaction
levels and derive competitive advantage. A similar trend is also evident from the findings of
other system implementation studies. Many ERP system as well as other system implementers,
however, were not able to increase their ROI. The limited support for user satisfaction suggest
that firms have not effectively managed their organizational change management programs to
ensure employee buy-in. ERP system, as well as other system implementation literature, states
62
that greater benefits accrue to firms, which fine-tune their systems with effective feedback and
usage by users.
Modeling & Simulation Studies
Many studies used modeling and simulation techniques to examine ERP system
deployments. Early research focused on implementation issues; however, recent studies indicate
that firms have shifted their attention to measuring the benefits that flow from their ERP systems.
This section also examines other relevant studies that address the implementation of SCM and
multiple systems that are pertinent to ERP system implementers. The various modeling and
simulation studies, discussed in this section using a timeline approach, were chosen for the
relevance of their findings to ERP system implementing firms.
ERP System Studies
Early studies stressed the effective management of the ERP system implementation
process. Recent research indicates that firms are paying increasing attention to operational and
usage issues as they seek to examine post-implementation activities and evaluate the impact of
their ERP systems on performance.
Scheer and Habermann (2000), and Gulla and Brasethvik (2002) advocate the use of
business process modeling to facilitate ERP system deployments. Gulla and Brasethvik (2002)
suggest that user-tailored views of business models serve as simplified process-oriented user
interfaces and can be used to communicate project status throughout the firm. Their study
advocates information integration across the firms’ transaction, workflow, and management tiers.
Various studies indicate that firms could use models and simulations to handle
training), 0.84 (change readiness), and 0.94 (business performance).
Stratman and Roth (2002) used literature review and input from expert ERP practitioners
to establish the content validity of their scales. CFA resulted in fit indices of 0.90 or greater for
all the scales thus establishing the unidimensionality of the instrument. Convergent validity was
established by comparing the manual sort and mailed surveys, as well as by examining the factor
loadings of the items onto their respective latent constructs in the CFA measurement models. All
factor loadings were in the anticipated direction and magnitude and were statistically significant
at p < 0.05. Discriminant validity was assessed using a series of chi-square difference tests
between the nested CFA models for all construct pairs. All of the chi-square differences were
significant at p < 0.001. Pearson’s correlations of the factor weighted items with Compustat
metrics provided support for the criterion validity of the scale. The final measurement scales and
items for the independent constructs and the dependent construct in the Stratman and Roth
(2002) study were strategic IT planning (6 items), executive commitment (7 items), project
management (8 items), IT skills (11 items), business process skills (9 items), ERP training (8
items), learning (8 items), change readiness (8 items), and business performance (16 items). The
69
overall results indicate that the instrument developed to measure the ERP competence constructs
is a reliable and valid one.
Besides Stratman and Roth (2002), there are many other ERP system studies that
examine specific variables pertinent to this research study. Some of these other ERP system
studies used for developing items to measure the variables in this study are implementation
strategy (Mabert et al., 2000; 2003b), alignment (Hong & Kim, 2001), data accuracy (Vosburg &
Kumar, 2001), organizational and national culture (Krumbholz & Maiden, 2001; Sia, Tang, Soh,
& Boh, 2002), communication (Tarafdar & Roy, 2003), and top management, communication,
consultants (Teltumbde et al., 2002), besides others.
Other Relevant Studies
A number of other relevant studies use validated instruments to measure variables that
are relevant to this research study’s objectives. The discussion below is, however, limited to
White’s (1990) study, which developed a rigorously validated instrument, and is deemed most
pertinent to the measurement of some of this research study’s variables. White (1990) developed
a survey instrument to measure varying changes in performance due to different implementation
statuses of JIT systems. The instrument was initially derived from literature and consisted of a
total of 72 items. The instrument pre-test involved focus groups comprised of experts in the areas
of survey methodologies and JIT literature. Then a field test was conducted with eight JIT
practitioners to clarify and revise ambiguous questionnaire items. The questionnaire was further
pre-tested by a panel of academicians and practitioners active in the JIT field and suggested
revisions were made to finalize the questionnaire for mailing. The sample survey population
consisted of members of the Association for Manufacturing Excellence (AME). The survey
procedures followed Dillman’s (1978) TDM method and consisted of two series of mailings to
70
2460 firms (response rate of 44.1% - 1165/2640). The sample was representative of firms from
various industries and of different sizes. The respondents were middle and upper level managers
knowledgeable about the firms’ JIT implementation and had a broad perspective on overall firm
activities.
Each of the 10 JIT techniques identified in the White (1990) study formed an item and
data were obtained for each item using an ordinal scale with the following ranges: not
implemented, implementation started within the last year, implementation started 1 to 3 years
back, implementation started 3 to 5 years back, and implementation started more than 5 years
back. Data were scored using the mid-point of the assessment scale: not implemented (0),
implementation started within last year (0.5), implementation started 1-3 years ago (2),
implementation started 3-5 years ago (4), and implementation started more than 5 years ago (6).
The measures of implementation status for each of the JIT technique were then collectively used
to develop a measure for the overall JIT system status. Ten measures of changes in performance
and three influencing variables were also identified and 5-point Likert type scales were used to
collect data on each of them. White’s (1990) findings are pertinent as the scales used to measure
the JIT implementation status are relevant to the measurement of the ERP system
implementation status in this research study.
Summary
A synthesis of instrument development research discussed above reveals that there are
not many studies that use rigorously validated instruments in ERP as well as other systems
research that are pertinent to this research study. The discussion also briefly mentioned a few
ERP system as well as other relevant studies that have used non-validated measures to evaluate
variables of interest to this research study. The development of the measuring instrument
71
discussed in chapter 3 includes items mainly drawn from the above validated instruments;
however, a few of the items developed from non-validated questionnaires were used.
The first part of the chapter discussed so far comprised of a timeline-based review of
ERP system and other relevant literature consisting of descriptive, case, survey, and modeling
and simulation studies. A cross-study comparison at the end of each of the different types of
methodological studies analyzed yielded tables that identified the modules that comprise the ERP
system, the CSFs that facilitate the ERP implementation process, and the changes in performance
that accompany ERP system deployments. Modeling and simulation studies also contribute to a
better understanding of ERP systems. Due to a paucity of such relevant studies in the context of
this research study’s objectives, the findings from the modeling and simulation studies are only
used to provide additional support to the findings of the other types of methodological studies.
A synthesis of studies in the first part of this chapter broadly suggests that with effective
usage over time (long-term usage of the system spread over a number of years), and with the
implementation of more and more modules of the ERP system (the more complete the system is)
firms will obtain increased synergistic performance benefits. These studies further suggest that
effective management of CSFs will maximize and quicken the accrual of ERP performance
benefits to firms. The second part of this chapter that follows builds on the synthesis of the
literature discussed in the first part to identify the modules comprising the ERP system, the CSFs
associated with ERP system implementations, and the changes in performance due to ERP
system deployments. The outcome of this part of the chapter is the development of an ERP
system implementation model.
72
Modules of the ERP System
This part of the research study addresses the first of the six research questions identified
in chapter 1: What are the modules that comprise an ERP system? Changes in the ERP field are
dynamic as ERP system vendors offer a wide array of modules, generic as well as tailored, that
address all sections of a firm’s business and information domains (Davenport, 2000; Hayman,
2000; Markus, Tanis, & Fenema, 2000). In this section, the cross-study comparison of modules
resulting out of a synthesis of the different types of methodological studies is given in table 10.
Table 10 Modules of the ERP System Modules
Methodological Studies
Descriptive Studies
Case Studies
Survey Studies
ERP System Vendors
Summary
Financials GS GS GS GS C Controlling GS GS GS GS C Materials Management GS GS GS GS C Production Planning GS GS GS GS C Sales and Distribution GS GS GS GS C Supply Chain Management GS GS GS GS C General Logistics GS LS LS GS M Project System GS LS NS GS M Plant Maintenance LS GS LS GS M Quality Management GS LS LS GS M Human Resources GS GS LS GS M Customer Relationship Management
LS LS GS GS M
E-Commerce LS LS GS GS M APO/APS LS LS LS GS M Management Information System
LS NS NS NS L
Product Data Management LS NS NS GS L Electronic Data Interchange NS NS LS NS L Knowledge Management NS NS LS GS L Inventory Management NS NS GS NS L
Note GS = Good support for inclusion as a module of the ERP system (module referenced in 50% or more of studies in each of the different types of methodological study tables). LS = Low support for inclusion as a module of the ERP system (module referenced in less than 50% of studies in each of the different types of methodological study tables). NS = No support for inclusion as a module of the ERP system. C = there is consensus of agreement among researchers and ERP system vendors for inclusion as a module of the ERP system. M = there is majority agreement among researchers and ERP system vendors for inclusion as a module of the ERP system. L = there is lack of agreement among researchers and ERP system vendors for inclusion as a module of the ERP system.
It can be inferred from the table that most firms implement a finite set of ERP system
modules that comprise the ERP system. The table also compares this research-based set of ERP
73
system modules to the modules comprising the ERP systems offered by major global ERP
system vendors to establish face validity. These global vendors whose ERP system modules are
chosen for comparison with those obtained from ERP system literature (SAP, Oracle/PeopleSoft,
Sage, Microsoft, SSA Global/Baan) account for about 70% of the global ERP market (IDC,
2003; Gartner, 2003a; AMR Research, 2005).
An analysis of the major ERP system global vendor Websites reveals broad support for
the research based set of modules comprising the ERP system (www.sap.com; www.oracle.com;
www.ssaglobal.com; www.microsoft.com). Among the ERP system vendors there are, however,
minor differences in the terminologies used, the functionalities available under the modules, and
the module descriptions under different ERP system versions. SAP in its various R/3 product
versions lists materials management as a separate module comprised of purchasing, warehouse
management and other sub-modules. In its recent mySAP ERP Web-enabled version, SAP,
however, classifies materials management and warehouse management under supply chain
management, purchasing under supplier relationship management. SAP in its R/3 versions lists
quality management as a separate module, but under its mySAP ERP version this is classified
under product life cycle management. In another example, SAP and SSA Global refer to the
module that addresses purchasing activities as supplier relationship management, whereas Oracle
terms it the procurement module. Oracle refers to the module that takes care of project
management activities as the project module, whereas Microsoft terms it the project management
and accounting module.
The findings from the module comparison between research studies and ERP system
vendors are indicated in Table 10 through a three-part summary classification. Those modules
that have good support across research studies as well as among ERP system vendors suggest
74
that there is a consensus agreement regarding their inclusion as modules that comprise the ERP
system. Some modules have majority support (a mix of good support, low support, and no
support) across research studies and ERP system vendors. Such modules are classified as having
majority agreement for their inclusion as modules comprising the ERP system. Research studies
and ERP system vendors that do not provide majority support for modules (i.e. have two or more
no support) suggest a lack of agreement in considering such modules as being part of the ERP
system.
A review of table 10 reveals consensual agreement regarding six modules, majority
agreement for eight modules, and lack of agreement on five modules. The table indicates that the
14 modules, identified through consensual and majority agreement by researchers and ERP
system vendors, comprise the ERP system. These 14 modules are financials, controlling, plant
maintenance, materials management, production planning, project system, sales and distribution,
general logistics, quality management, human resources management, SCM, CRM, E-
Commerce, and APO/APS. The table also shows that there is a lack of agreement among
researchers and ERP system vendors regarding five modules (management information systems
(MIS), PDM, KM, EDI, Inventory Management). Hence, in this research study, these five
modules are not considered to be part of the ERP system.
Research suggests that once firms stabilize their ERP systems, they implement additional
modules such as KM and PDM (Miller, 1999; Ayers, 2001; Hawking and Stein, 2004). The KM
module helps firms capture and leverage firm-wide business knowledge for effective decision-
making. The PDM module helps firms bring innovative and profitable products to market more
effectively. Modules such as KM and PDM represent the tapping and leveraging of information
from extended ERP system functionalities. Hence, these are considered as modules that firms
75
optionally implement to enhance their ERP system’s performance. Firms that have well
entrenched legacy EDI systems in place would integrate their EDI systems with their ERP
systems. The advent of Web-enabled ERP systems and the increasing use of the Internet for B2B
transactions, however, obviate the need for non-EDI users to implement a separate EDI module.
The built-in enterprise controlling functions in the controlling module of most ERP systems also
renders unnecessary the need for firms to deploy a separate MIS module. Research indicates that
the inventory management module forms part of the materials management module and thus this
is a redundant module to implement. The above discussion lends support to the earlier contention
that, in the context of this research study, these five modules do not constitute a part of the finite
set of modules comprising the ERP system.
The description and categorization of the 14 modules comprising the ERP system in this
research study varies widely in literature depending upon the specific ERP system focused by
researchers in their studies. This ambiguity is a result of the different descriptions and
categorizations that ERP system vendors use to describe the modular structure of their ERP
systems. Each of the 14 modules identified in table 10 as comprising the ERP system are
discussed below in order to obtain clear generic module descriptions and hence resolve
ambiguity in their descriptions in literature and practice. These discussions are based on a
synthesis of ERP literature and major ERP global vendors’ module descriptions (www.sap.com,
Johnson (2000), Kennerley and Neely (2001), and Satyan (2003) examine issues
regarding the implementation of ERP systems. Johnson (2000) suggests that the real benefits
from ERP systems accrue to firms about two to five years from the start of the ERP system
project and nearly a year after the system goes live. In another study, Poston and Grabski (2001)
suggest that ERP system deployments are associated with a significant decrease in
COGS/Revenues about 3 years after implementation as benefits accrue to firms with effective
usage of the system over a number of years. They further suggest that higher levels of benefits
accrue as more and more ERP modules and extensions are implemented and hence the 3-year
87
time frame adopted in the study may not be a sufficiently long period to measure implementation
results.
Al-Mashari et al. (2003) attempt to tie CSFs to implementation time and improved
performance benefits. Their study’s findings suggest that those firms which effectively manage
their CSFs can shorten their implementation time and garner substantial early benefits from their
ERP systems. Further, the benefits of ERP system deployment are maximized when CSFs are
leveraged to facilitate the relationship between ERP system implementation and changes in
business performance. The findings of other system studies are also pertinent to the systems
concept underlying ERP systems. Schroeder et al. (1981), White et al. (1982), and Duchessi et al.
(1988) in their survey studies on MRP and MRP II system implementations, demonstrate that the
time since implementation significantly increases the chances of successful implementation. The
findings from their studies suggest that the MRP system implementation process should be
viewed as a continuous process and that enhanced benefits are likely to reward a long-term focus
on CSFs.
Studies that examined the integration of multiple systems indicate that enhanced benefits
accrue to successful implementers. Hsieh and Kleiner (1992) examine the benefits of integration
of MRP and JIT systems. The findings reveal that both MRP and JIT emphasize the integration
and the coordination of manufacturing and various interfacing activities though they differ in
terms of how this is achieved. Though the JIT system approach is physical and the MRP system
approach is informational, both emphasize vendor management and teamwork. MRP supports
JIT and by linking these two together it is possible to achieve zero inventories.
A synthesis of studies discussed above as well as in the earlier section of this chapter
indicates that a systemic concept underlies ERP systems. These systems are integrated modular
88
systems. Firms that implement one or a few modules of an ERP system may derive benefits
mainly restricted to the functional areas and business activities to which these modules are
targeted. The more modules that firms implement, greater will be the benefits that they derive,
owing to the integrated linkages among different modules that address cross-functional business
needs. When all the modules of the ERP system are fully implemented, firms maximize their
performance benefits. This is due to the linkages among all the modules of the ERP system,
which results in the integration of all of a firm’s front-office and back-office operations. Firms
engage in a continuous process of fine-tuning their systems to better serve their business needs.
The results of this ongoing process, arising from the effective use of the system, is spread over a
number of years and results in further enhanced gains accruing to firms over the long-term.
Critical Success Factors for ERP System Implementation
This section addresses the third of the six research questions identified in chapter 1: What
are the CSFs that impact ERP system implementations? Most ERP system literature over the past
decade focused on implementation issues as “getting the system to run” dominated the
deployment process. Recent studies indicate that firms have realized that ERP system
implementations are never complete but represent long run, continual processes. To handle the
organizational changes that accompany ongoing ERP system deployments, most firms adopted a
CSF based approach.
Table 11 provides the summary details from each of the different types of methodological
studies described in the first part of this chapter. The findings from the cross-study comparison
of CSFs are indicated through a three-part summary classification. Those CSFs that have good
support across research studies indicate a consensus agreement regarding their role as crucial
factors in ERP system implementations. Some CSFs have majority support (a mix of good
89
support and low support) across research studies and such CSFs are classified as having majority
agreement for their inclusion as key factors for facilitating the implementation process. Research
studies that do not provide majority support for modules (i.e. have two or more ‘no support’)
indicate lack of agreement among researchers regarding the criticality of such factors in
implementations.
Table 11 CSFs for ERP System Implementation
Critical Success Factors
Methodological Studies
Descriptive Studies Case Studies Survey Studies Summary Top Management Support GS GS GS C Planning GS GS GS C Project Management GS GS GS C Alignment (BPR & Customization) GS GS GS C Implementation Strategy GS GS GS C Consultants GS GS GS C Implementation Team GS GS GS C Data Accuracy GS GS GS C User Support GS GS GS C Training GS GS GS C Organizational Culture GS GS GS C Communication GS GS GS C National Culture LS GS LS M Learning GS LS GS M IT Readiness NS NS LS L
Note GS = Good support for inclusion as a CSF in ERP system implementation (CSF referenced in 50% or more of studies in each of the different types of methodological study tables). LS = Low support for inclusion as a CSF in ERP system implementation (CSF referenced in less than 50% of studies in each of the different types of methodological study tables). NS = No support for inclusion as a CSF in ERP system implementation. C = there is consensus of agreement among researchers for inclusion as a CSF in ERP system implementation. M = there is majority agreement among researchers for inclusion as a CSF in ERP system implementation. L = there is lack of agreement among researchers for inclusion as a CSF in ERP system implementation. .
A perusal of the cross-study comparison of CSFs in the table reveals that there is a
consensus agreement for 12 CSFs, majority agreement for 2 CSFs, and lack of agreement for 1
CSF. The 12 CSFs identified through consensual agreement by researchers are top management
Mashari et al., 2003). Al-Mashari et al. (2003) develop a CSF taxonomy and classify CSFs into
broad categories to facilitate ERP system implementations. In the setting-up category, the CSFs
are management and leadership, and visioning and planning. The CSFs in the implementation
98
grouping are ERP system selection, training and education, systems integration, communication,
project management, systems testing, process management, legacy systems management, and
cultural and structural changes. In the evaluation category, the CSFs are performance evaluation
and management. The CSFs in the ERP success grouping are correspondence success, process
success, interaction success, and expectation success.
The above discussion indicates that researchers largely concur on the need for classifying
CSFs into categories. Two broad streams of research, however, have emerged. The first one
classified and prioritized CSFs into categories based on the ERP life cycle; whereas the second
one classified CSFs into categories but accorded equal importance to all CSFs throughout the
ERP life cycle. A synthesis of the two broad research streams coupled with this study’s
objectives, however, reveals that all the 14 CSFs form a single category. Research, discussed in
the earlier part of this chapter, indicates that ERP system implementations are ongoing processes.
The above suggests that various modules in the same site or various sites, in the same business
unit or across different business units of a firm, within a country or across different countries,
would be under different implementation statuses at any given point in time. Also, firms could be
engaged in upgrading and fine-tuning any of their above deployments at any point in time thus
resulting in a continuously changing implementation status. Thus, firms typically will focus on
all the 14 CSFs, identified in Table 11, throughout the ERP implementation life cycle.
The 14 CSFs represent a well represented mix of managerial, technical, and
organizational factors. Managerial activities pertaining to the ERP implementation process are
represented by CSFs such as top management support, planning, project management, and
alignment. The implementation of an ERP system radically transforms the way business is
conducted throughout the firm. CSFs such as top management support, adequate planning, and
99
good project management facilitate effective change management and hence are key to ensuring
successful deployments. ERP systems are generic business solutions that reflect a series of
assumptions based on a synthesis of best practices on how firms should operate. Hence, ERP
system fit with business processes is essential for achieving anticipated deployment benefits.
CSFs such as user support, training, learning, communication, organizational culture, and
national culture support a firm’s various organizational activities. Research suggests that ERP
systems have more to do with organizational change rather than technology per se. User
participation and user involvement, bolstered by open and honest communication as well as
ongoing training and learning initiatives foster user commitment. A culture-ERP system fit helps
firms effectively leverage the full capabilities of the ERP system to obtain sustained long-term
benefits.
Technical activities pertaining to ERP deployment are represented by CSFs such as
implementation strategy, consultants, implementation team, and data accuracy. Studies suggest
that a well-planned implementation strategy, driven by competent consultants and a skilled
implementation team, would facilitate smooth system roll-out, and hence ensure quick
attainment of potential ERP system benefits. Data integrity can mar or facilitate ERP system
success. As ERP systems afford single-point data capture, data inaccuracies can have disastrous
effects on effective decision-making.
A review of the above discussion reveals that effective management of the aggregate
CSF, which represents a complete application of CSFs, will maximize the benefits that firms
obtain from their ERP systems. A synthesis of descriptive, case, survey, and modeling and
simulation studies suggests that effective management of CSFs also shortens the ERP
deployment cycle, results in rapid implementation of the complete ERP system, and quickens the
100
accrual of performance benefits to firms. The parallel and effective management of the 14 CSFs,
along with the technical implementation of the ERP system, thus impacts positively on the
relationship between ERP implementation system status and changes in performance.
Changes in Performance due to ERP System Implementation
This section addresses the fourth of the six research questions: What are the changes in
performance that result from ERP system implementations? A synthesis of research studies in
the earlier part of this chapter indicates that firms can significantly improve their business
performance with ERP system implementations. Researchers also generally concur that effective
management of CSFs shortens the time required for the maximization of benefits from ERP
systems.
Table 12 provides the summary details from each of the different types of methodological
studies described in the first part of this chapter. The findings from the cross-study comparison
of performance changes are indicated through a three-part summary classification. Those
performance changes that have good support across research studies indicate consensus
agreement regarding their role as key benefits in ERP system implementations. Some
performance changes have majority support (a mix of good support and low support) across
research studies and are hence classified as having majority agreement for their inclusion as
important benefits accruing to firms from their ERP systems. Research studies that do not
provide majority support for performance changes (i.e. have two or more no support) indicate
lack of agreement among researchers in considering these as ERP system benefits.
A perusal of the cross-study comparison of performance changes in the table suggests
that there is a consensus agreement for seven performance changes, majority agreement for three
performance changes, and lack of agreement for three performance changes. The seven
101
performance changes identified through consensual agreement by researchers are information
availability, information quality, standardization, inventory management, on-time delivery,
profitability, and customer satisfaction. Analysis of these seven performance changes indicate
that these benefits represent a well-balanced mix of informational, transactional, and
organizational improvements that accrue to firms from successful ERP system deployments. The
implementation of ERP system modules, however, by default results in integration of business
activities across the firm. The implementation of the complete ERP system results in integration
of both intra and inter-firm business activities. As ERP systems are integrative by nature, they
directly and indirectly influence all of a firm’s performance measures. Hence, as integration is a
characteristic of the ERP system package, it is not considered part of the benefits resulting from
the deployment of the ERP system.
Table 12 Changes in Performance Due to ERP System Implementation
Performance
Methodological Studies
Descriptive Studies Case Studies Survey Studies Summary Information Availability GS GS GS C Information Quality GS GS GS C Standardization GS GS GS C Inventory Management GS GS GS C On-time Delivery GS GS GS C Profitability GS GS GS C Customer Satisfaction GS GS GS C Return on Investment GS LS LS M User Satisfaction LS GS LS M Competitive Advantage GS LS GS M Capacity Utilization NS LS NS L Monitoring NS LS NS L Cycle Times NS LS NS L
Note GS = Good support for inclusion as a performance measure in ERP system implementation (performance measure referenced in 50% or more of studies in each of the different types of methodological study tables). LS = Low support for inclusion as a performance measure in ERP system implementation (performance measure referenced in less than 50% of studies in each of the different types of methodological study tables). NS = No support for inclusion as a performance measure in ERP system implementation. C = there is consensus of agreement among researchers for inclusion as a performance measure in ERP system implementation. M = there is majority agreement among researchers for inclusion as a performance measure in ERP system implementation. L = there is lack of agreement among researchers for inclusion as a performance measure in ERP system implementation.
102
Successful implementers use high quality information from their ERP systems for speedy
and effective decision-making. The ERP system captures data at a single entry point and then
makes it available throughout the firm after stringent data quality checks. The standardization of
business processes are benefits that result from the deployment of the process-oriented ERP
system. The streamlining of operational areas results in firms deriving transactional benefits such
as improved inventory management and on-time delivery. Organizational benefits accrue from
the cost savings that result from an increase in efficiencies. These cost savings are then passed to
the customer in the form of high quality and effective services at lowered prices and hence
results in increased customer satisfaction.
User satisfaction, ROI, and competitive advantage are three performance changes that are
identified as having majority agreement among researchers. Studies indicate that firms
consolidate, extend, and continually fine-tune their ERP systems to enhance the accrual of
benefits from their implementations. This ongoing process is based to a large extent on user
feedback and occurs over a number of years of effective system usage. Also, firms that deploy
complete ERP system functionality will increase the ROI from their implementations. The
consolidation of short-term benefits and the leveraging of long-term benefits will result in
sustained competitive advantage to successful implementers. The above suggests that user
satisfaction, ROI, and competitive advantage accrue to firms in the long run over a number of
years. The majority agreement among researchers on these three performance changes is due to
the paucity of long run benefits evaluation studies. These in turn are due to the fact that there are
not many complete ERP system implementations that have been in effective use for a number of
years.
103
The table further indicates that there are three performance changes characterized by lack
of agreement among the different types of methodological studies. These three changes in
performance are capacity utilization, monitoring, and cycle times. Studies discussed earlier in
this chapter suggest that the 10 consensual and majority agreement performance changes
discussed in the preceding paragraphs subsume performance changes resulting from capacity
utilization and cycle times. The real-time insight into production planning enables firms to
optimally use their production capacity by steering inventory stocks across sites thus leading to
improved inventory management and on-time delivery. Reduction in cycle times arise as a result
of increased information visibility into functional activities and is hence reflected in early
benefits to the firm such as higher inventory turnover and on-time delivery. The integrated nature
of the ERP system improves the monitoring capacity of the firm. ERP systems are highly
configurable with regard to user profiles, parameters, and business processes. This in turns
renders the monitoring of performance changes highly firm-specific. This is the reason for the
lack of agreement among researchers with regard to monitoring being a key performance change
measure.
It can be inferred from a synthesis of the above discussion that the 10 performance
changes, identified by consensual and majority agreement, are essential for evaluating the
benefits that flow from ERP system implementations. The description of these 10 performance
changes varies widely in literature as a result of different interpretations by researchers
examining ERP system implementations among firms across a cross-section of industries.
Hence, each of the 10 performance changes identified in table 12 as being key performance
changes in ERP system deployments are discussed below in order to obtain clear generic
104
performance change descriptions and hence resolve ambiguity in their descriptions among
researchers.
Performance Measures
Information Availability
Information availability refers to the changes in the availability of integrated real-time
information from the ERP system. Firms leverage the information flowing through the seamless
integration of the various modules of the ERP system to obtain greater insights into supply chain
activities thus resulting in better decision-making (Davenport, 1998; Mabert et al., 2000; Adams,
2002; Mabert et al., 2003b).
Information Quality
Information quality refers to the changes in the availability of consistent and reliable
information from the ERP system. The ERP system captures data at a single point and this data is
then made available across the firm. Stringent data entry checks from streamlined operational
areas and automated transactions ensure that data integrity is maintained thus ensuring high
quality output from the ERP system (Dataquest, 1998; Rajani, 1999; Mabert et al., 2000; 2003b).
Standardization
Standardization refers to the streamlining and rationalization of business processes as
well as information flowing through the firm. ERP systems impose discipline and consistency on
the business processes of the firm. This results in uniform ERP system information outputs
available across the firm (Dataquest, 1998; Menezes, 1999; Mabert et al., 2001a).
Inventory Management
Inventory management refers to changes in the inventory management processes that lead
to sizeable reductions in inventory holdings, increased inventory turnover, and better control
105
over inventories. Various studies indicate that ERP system implementers can gain sizable
inventory reduction and increased inventory turnover benefits by standardizing their inventory
management processes and improving performance to industry benchmark levels (Madhavan,
2000; Drayer & Wight, 2002; Mabert et al., 2003b).
On-time Delivery
On-time delivery refers to changes in the order management/order cycle that result from
successful ERP system implementations. Improvements in on-time delivery facilitate on-time
delivery of products/services to customers. These benefits are enhanced when the ERP system is
put to effective use over a number of years (Mabert et al., 2003b; Hawking & Stein, 2004).
Profitability
Profitability refers to changes in profits that accrue to firms from their ERP systems.
Firms obtain early cost savings as a result of streamlining of operational areas such as inventory,
receivables, distribution as well as reduced information cost across the firm’s supply chain
(Davenport, 1998; Madhavan, 2000). As the system is put to effective use, firms obtain increased
productivity levels for their various resources such as labor and capital (Hitt et al., 2002;
Hawking & Stein, 2004). This in turn leads to rationalization of manpower (Davenport, 1998;
Poston & Grabski, 2001). Firms obtain sustained profitability increases over the long run (greater
than 3 years after implementation) with effective use of full system functionality (Poston &
Grabski, 2001; Hawking & Stein, 2004).
Customer Satisfaction
Customer satisfaction refers to the changes in satisfaction levels experienced by the
customers of ERP system implementers. Various studies indicate that firms increase their
customer satisfaction by meeting parameters such as improved quality, shorter delivery times,
106
quicker customer response, and expanded customer base. This in turn creates a self-propagating
structure through deepening customer links with several layers of customers (Davenport, 1998;
Ash & Burn, 2003; Watanabe & Hobo, 2003).
Return on Investment (ROI)
ROI refers to changes in the returns (technical as well as business) that firms obtain from
their ERP system implementations. Most firms closely monitor and obtain increased ROIs at
different unit of analysis levels (division, function, module) from their ERP systems. Successful
implementers plan their implementation strategies so as to obtain faster and early ROIs from
their ERP systems. This in turn enables them to sustain and increase stakeholder commitment to
User satisfaction refers to the satisfaction levels resulting from the use of the ERP
system. . Researchers such as Caldwell (1998), Kanunga and Bagchi (2000), and Tarafdar and
Roy (2003) indicate that user participation, user involvement, and user commitment are the key
to increased user satisfaction. This in turn leads to more effective usage of the implemented ERP
system and thus results in greater implementation benefits.
Competitive Advantage
Competitive advantage refers to the ability of the firm to meet competitive challenges and
enhance its market position. Firms can take advantage of the thousands of different
configurations available in the ERP system and strategically plan and implement their ERP
systems so as to obtain seamless ERP system-business alignment. This alignment in turn enables
firms to leverage the full functionality of their ERP systems across the supply chain and enhance
107
their competitive positions vis-à-vis their competitors (Caldwell, 1998; Davenport, 1998;
Tarafdar & Roy, 2002).
Overall Performance
Various studies examined ERP as well as other system deployments classify
performance measures into various categories in different ways. Researchers classify
performance changes into categories based on a timeline accrual of benefits (Rajani, 1999;
Satyan, 2002). Rajani (1999) classifies changes in performance due to ERP systems into 3 time-
based categories. In the short-term, firms streamline their operational areas, automate
transactions, and ensure data integrity. The next level of benefits occurs over the medium term.
Firms use data from their ERP system for meaningful analysis and planning for major resources
such as material, capacity, and manpower. At this stage, the firm realizes benefits in terms of
reduced working capital, better financial forecasts, reduced cycle time for order fulfillment, and
improved coordination between processes. The real benefit of ERP systems accrues to firms in
the long-term when they are in a position to apply best business practices by integrating ERP
system extensions and other application systems and enhance their competitive advantage.
Studies also classify performance measures into broad performance categories (Mirani &
Lederer, 1998; Al-Mashari et al., 2003). Al-Mashari et al. (2003) classifies changes in
performance measures due to ERP system implementations into five categories. The operational
category concerns improvements in functional areas leading to cost reductions, cycle time
reductions, and productivity improvements. Benefits such as better resource management,
improved decision-making and planning, and performance improvements fall into the managerial
grouping. Strategic benefits help firms to innovate, build cost leadership, generate product
differentiation, and build external links in the supply chain. The firm’s IT infrastructure benefits
108
through IT cost reductions and increased IT capacity. Organizational benefits such as business
learning and successful organizational changes also accrue to firms.
The above discussion indicates that researchers largely concur on the need for classifying
performance changes into performance categories. Two broad streams of research, however,
have emerged. The first one uses a time-based approach to classify and evaluate performance
changes arising from ERP system deployments. The second approach classifies and evaluates
benefits using broad performance change categories. ERP system implementations are ongoing
processes. In consonance with their expanding implementation scope, firms continuously fine-
tune their systems over time to maximize the benefits from their implementations. This suggests
that differential benefits accrue to firms due to the different implementation statuses of the ERP
system and thus at any point in time firms would be using all the 10 performance measures
identified in Table 12 to evaluate their deployments. Hence, in the context of this research
study’s objectives, it is appropriate to consider changes in performance as one overall category
comprising of all the 10 performance measures. These represent a well balanced mix of
informational, transactional, and organizational performance elements as described below.
Changes in informational performance measures include information availability,
information quality, and standardization. ERP systems force firms to adopt a process approach to
their business activities. This coupled with data captured through a comprehensive database
enables firms to obtain standardization benefits. The availability of accurate information output
from the ERP system enhances user decision-making capabilities. Firms evaluate improvements
in their transactional activities with the help of performance measures such as inventory
management, and on-time delivery. Firms leverage the informational benefits from their ERP
systems to streamline and improve the efficiency of their operational areas. This results in
109
improvement in business activities such as improved inventory management, and on-time
delivery of products and/or services. Organizational performance change measures include
profitability, ROI, user satisfaction, customer satisfaction, and competitive advantage. The
transactional cost savings combined with effective usage of the complete ERP system over the
long run increases ROI as well as firm profitability. These cost savings as well as high quality
service, when passed onto customers’, results in increased customer satisfaction levels. The
above performance improvements when sustained and enhanced over the long run through
effective leveraging of the ERP system capabilities provide competitive advantages to firms.
A review of the above discussions indicates that all the 10 performance items are
differentially impacted depending upon the ERP implementation status of firms. Early benefits
from partial implementations give way to overall benefits as more number of modules and
extensions comprising the module sub-systems are implemented. The fine-tuning and effective
usage of the ERP system over a number of years further enhances the overall performance
benefits obtained by firms.
Model of ERP System Implementation
A synthesis of literature in the preceding sections of this chapter that addressed the first
four research questions posed in chapter 1 resulted in the identification of two ERP module sub-
systems consisting of 14 modules that comprise the ERP system. Also, one overall change in
performance comprising of 10 performance changes resulting from holistic ERP system
deployments was identified. Further, all 14 CSFs were found to facilitate ERP system
implementations.
An analysis of literature further indicates that a systemic concept underlies ERP systems and that
a complete ERP system deployment results in overall benefits accruing to firms. The ERP
110
system and its relationships to changes in performance as moderated by CSFs are shown below
in figure 2.
ERP Modules Performance Measures - Financials - Information Availability
- Controlling - Information Quality - Plant Maintenance - Standardization - Materials Management - Inventory Management - Production Planning - On-Time Delivery - Project System - Profitability - Sales & Distribution - ROI - General Logistics - Customer Satisfaction - Quality Management - User Satisfaction - Human Resources - Competitive Advantage - SCM - CRM
- E-commerce - APO/APS
CSFs - Top Management Support - Planning - Project Management - Alignment - Implementation Strategy - Consultants - Implementation Team - Data Accuracy - User Support - Training - Learning - Organizational Culture - National Culture
- Communication
Figure 2. Model of ERP System Implementation.
The ERP system implementation model in the figure and the studies discussed earlier in
this chapter suggest that incremental implementation of ERP system modules results in
increasing changes in performance with the firms obtaining full synergistic benefits with a
complete ERP system deployment. The fine-tuning and effective use of the ERP system over a
ERP System Implementation
Status
Changes in Performance
Critical Success Factors
111
number of years further enhances the benefits from ERP systems. CSFs further moderate the
relationship between ERP implementation status and changes in performance.
Theoretical Model
An overall review of literature on ERP systems discussed in the earlier sections of this
chapter indicates that there is a lack of theoretical development in ERP systems research. This
section of the study establishes the theoretical perspective that underlies the ERP system
implementation model developed in the previous section.
Galbraith’s Model
The theoretical framework for investigating the relationships between the implementation
status of ERP systems and changes in performance as moderated by CSFs is developed from
Galbraith’s information processing theory (Galbraith, 1973; Galbraith et al., 1993; Galbraith et
al., 2002; Mohrman et al., 1998). Galbraith’s earlier research (1973; 1974; 1977) uses a
contingency theory-based, open-rational system approach to argue that performance is enhanced
when there is a fit between the information processing requirements and capacities of firms. In
his later research (Galbraith et al., 1993; Galbraith, 1994; 2000; 2002; Galbraith et al., 2002),
Galbraith incorporates the open-natural system approach also by emphasizing that the
management of organizational, management, and technical factors maximizes performance
benefits. Galbraith’s model of organizational design is given in figure 3.
Galbraith (1973; 1974; 1977) bases his information processing theory on the limited
ability of organizations to process information. The basic proposition that underlies the
information processing theory is that the greater the task uncertainty, the greater the amount of
information that must be processed among decision makers during task execution to achieve a
given level of performance. Galbraith defines uncertainty as the difference between the amount
112
of information required to perform a task and the amount of information already possessed by
the organization. Thus, there is a relationship between the amount of uncertainty faced by
organizations and the amount of information processing done in organizations.
Hierarchy of Authority Rules and Programs
Planning and Goal Setting Narrowing Span of Control
Environmental Creation of Slack Creation of Self-Contained Investment in Vertical Creation of Lateral Management Resources Tasks Information Systems Relations
Reduce the Need for Information Increases the capacity for Information Processing Processing
Figure 3. Galbraith’s Model of Organizational Design. Adapted from Galbraith, J.R. (1977). Organization Design. Addison-Wesley Publishing Company Inc: Philippines.
Galbraith (1973; 1974; 1977) uses a mechanistic approach to explain his information
processing approach as business environments were relatively stable in the 1970s. In his later
works (Galbraith et al., 1993; Galbraith, 1994; 2000; Mohrman et al., 1998; Galbraith et al.,
2002), however, Galbraith incorporates a social system approach to handle greater complexities
that are characteristic of the dynamic business environments of the 2000s.
Galbraith (1977) suggests that firms can use four mechanisms to increase coordination
among interdependent organizational tasks. The hierarchy of authority mechanism suggests that
hierarchies preserve legitimacy by identifying clear lines of authority and by economizing on
information processing capacity. The rules and programs mechanism are employed in addition to
the hierarchy and their overall effect is to move routine and repetitive decisions to the lower
113
levels of the organization. The planning and goal setting mechanism suggests that as the use of
rules and programs increases discretion at lower organizational levels, organizations face
potential behavior control challenges. To handle these behavior control challenges, organizations
institute planning processes to set goals, and this goal setting increases coordination between
interdependent tasks and at the same time allows local discretion. The narrowing span of control
mechanism indicates that a decrease in span of control in the hierarchy of authority increases the
capacity to process more information.
The ability of organizations to utilize these four coordination mechanisms depends on the
combination of the frequency of exceptions and the capacity of the hierarchy to handle them. As
the task uncertainty increases, the number of exceptions increases until the hierarchy is
overloaded (Galbraith, 1977). Galbraith suggests that firms can handle this in either of two
general ways; they can act to reduce the amount of information that is processed, or they can
increase the capacity to process information.
Galbraith (1977) elaborates further on the different ways that firms can either reduce or
increase the capacity of information processed to handle increasing amounts of task uncertainty.
He suggests that there are three ways in which firms can act to reduce the amount of information
that is processed. Firms can modify their environment by trying to reduce uncertainty about
critical events. Firms can create slack resources by reducing the number of exceptions by
reducing their levels of performance. Firms can also create self-contained tasks by changing the
way tasks are decomposed into sub-tasks. Alternately, he suggests that firms can increase their
capacity to process information in two ways. Firms can invest in vertical information systems
that allow them to process information without overloading hierarchical channels. Firms can also
114
create lateral relations through decentralizing decisions, which involves moving the level of
decision-making to where the information exists.
Analysis of the above discussion indicates that the first mode (reducing the amount of
information that is processed) decreases overloads on the hierarchy by reducing the number of
exceptions that occur by lowering performance levels and hence the amount of information that
needs to be processed. In contrast, the second mode (increasing the capacity to process
information) takes the level of information as given and attempts to acquire and process the
requisite information during task execution. Galbraith’s (1977) findings indicate that the overall
effect of both these modes is to reduce the number of cases referred upward into the organization
through hierarchal channels.
Theoretical Framework for ERP System Implementation
Galbraith’s (1973; 1974; 1977) information processing model broadly addresses the
different ways in which firms can reduce uncertainty and improve their performance. His studies
outline the role of IS as one of the options available to firms to increase their capacity to process
large amounts of information while reducing the number of exceptions that overload the
hierarchy. Galbraith’s later studies (Galbraith et al., 1993; Galbraith, 1994; 2000; 2002;
Mohrman et al., 1998; Galbraith et al., 2002), however, acknowledge the pervasive role played
by IS in both reducing the need for information processing as well as increasing the capacity of
firms to process information. These later research studies also highlight the importance of
managing CSFs in IS implementations.
The discussion in the following paragraphs ties the ERP system implementation model
developed in the previous section to Galbraith’s theoretical framework. A perusal of the ERP
system implementation model suggests that four of Galbraith’s five approaches to managing
115
uncertainty are relevant to this study. These four approaches span both the broad approaches to
managing uncertainty – reducing as well as increasing the capacity to process information. These
four approaches are environmental management, creation of self-contained tasks, investment in
vertical information systems, and creation of lateral relations. The use of the slack resources
approach is not consistent with ERP system implementations and is also discussed below.
Reducing the Need for Information Processing
The creation of slack resources as an approach to reducing the need for information
processing is not consistent with the implementation and usage of ERP systems. Slack resources
indicate that the firm does not have the information processing capacity to deal with coordination
requirements of interdependence and instead creates additional resources by reducing
performance standards (Galbraith, 1973; 1974; 1977). The creation of these additional resources
takes the form of increased delivery time, accumulation of inventory, lower productivity levels
due to under-utilized resources, increase in personnel, increased machine time and incurring of
higher costs.
The implementation of ERP systems obviates the need for firms to augment their
resources in order to deal with the information processing needs associated with the increased
coordination requirements for managing interdependencies. This is because ERP systems
standardize and integrate enterprise-wide business processes resulting in the automation of
transactions and the availability of accurate information for decision-making. For example, the
implementation of the financial modules and the logistics modules results in quick financial
close cycles and streamlined operational areas respectively. This results in transactional benefits
such as improved inventory management and improved on-time delivery, and organizational
level benefits such as operational costs savings that translate into increased profitability. The
116
proper planning of the ERP system deployment, the ensuring of ERP system-business alignment
by internal and external stakeholders, and enforcing data integrity procedures facilitates the
above process. The implementation of extension modules such as SCM and CRM further
increases real-time information availability and visibility across the supply chain and hence
increase a firm’s coordination capacities across inter-firm activities. This translates into
increased transactional benefits such as decrease in costs and better utilization of resources as
well as organizational level benefits such as increased customer satisfaction. The effective use of
the ERP system by ensuring end-user support through established communication channels and
training programs, and continuous top management monitoring enhances the performance
benefits obtained from these complete ERP systems.
Galbraith (1973; 1974; 1977) indicates that firms can create self-contained tasks as
another approach to reducing their information processing needs. This approach shifts the basis
of authority structure from one based on input to one based on output. The creation of self-
contained units around projects, products, processes, customers, or purchases eliminates the use
of shared resources, reduces division of labor, and results in the point of decision moving closer
to the source of information (Mohrman et al., 1998). Higher costs result due to a reduction in
skills specialization and division of labor. The benefits, however, outweigh the costs and include
greater local discretion, and ensuring ERP system-business fit by tailoring of systems and
procedures to firm-specific needs.
ERP systems can support the use of self-contained tasks by configuring employees’
decision-making responsibility levels according to organizational requirements. For example,
firms that implement human resource modules and logistics modules, such as materials
management, can use self-service features to provide greater discretion to employees’ at all
117
organizational levels to handle activities such as benefits entitlements and purchases. This is
facilitated by firms paying adequate attention to factors such as national and organizational
culture characteristics, changes in job design, communication, training, and learning programs
(Mohrman et al., 1998; Galbraith, 2002). Also, the availability of enterprise-wide information
from a single database requires employees to develop multi-tasking capabilities. These multi-
skilled employees in turn contribute to a reduction in the costs associated with the division of
labor and lack of specialization that are traditionally associated with the adoption of the self-
contained tasks approach. Firms benefit by improved inventory management, increased user
satisfaction, increased cost savings through improved productivity and hence higher profitability.
ERP systems can also be configured to a firm’s specific world-wide requirements such as
products, regions, and customers. This configurational flexibility enables the firm to match its
ERP system configuration to its varying requirements of self-containment and hence
decentralization. For example, under conditions of moderately diverse and moderately
unpredictable tasks, firms may centralize their configurations so that modules such as financials,
materials management, and human resources management are concentrated at the corporate
headquarters; while logistics modules, such as sales and distribution, plant maintenance, and
production planning, are distributed to their local locations. Under conditions of diversity and
uncertainty, firms may decentralize their configurations so that only their financials modules are
concentrated at the corporate headquarters, while distributing logistics, human resources, and
extension modules to local locations. Firms may also strive to strike a balance between the
demands of centralization and decentralization by adopting a hybrid configuration that falls in-
between the two approaches outlined above. These flexible configurational options help firms
maintain ERP system-business alignment.
118
Firms can also reduce their information processing needs by changing their environment,
reducing uncertainty, and managing their dependence on others so that their present structure and
processes are adequate. Firms can handle the uncertainty of their task environments by changing
any or all of its constituent elements – strategy, technology, and location (Galbraith, 1977).
Galbraith’s study further suggests that firms can use independent mechanisms such as
competitive response, public relations response and voluntarism as well as cooperative
mechanisms such as implicit cooperation, contracting, co-opting, and coalescing to relate to their
environment. The choice of mechanisms adopted depends largely on organizational requirements
for balancing autonomy and flexibility needs, with the exchange of commitments to reduce
uncertainty through cooperation and coordination.
ERP systems help firms balance their contrasting needs of autonomy and flexibility with
cooperation and coordination through configuration of the system at four levels. These four
levels are the overall design of the enterprise, design of business activities – user profiles,
parameters, business processes, and customization through supplementary programming (Koch,
2001). The configuration flexibility of ERP systems enables firms to change any or all of its
constituent elements such as strategy, technology, and location. For example, firms can configure
their systems using financials, logistics, and human resource modules to handle their
centralization, decentralization, and hybrid organizational needs across customers, regions and
products.
Besides leveraging the autonomy and flexibility benefits that flow from intra-firm
configurations, firms can also handle the complexity and the uncertainty of their task
environments by implementing common supply chain processes across their front-office and
back-office operations. Mohrman et al. (1998), Galbraith (2000; 2002), and Galbraith et al.
119
(2002) term such firms that build coordination and cooperation into their inter-firm value chains
as using a front-back hybrid organizational arrangement. Their studies indicate that the use of
enterprise systems, which encompasses separate applications such as e-procurement, e-human
resources management, ERP, CRM, and SCM results in the seamless integration and
management of critical events such as for example a disruption in the availability of supplies or
uncertain and fluctuating customer demand.
The facilitation of the above configurations requires firms to focus on factors like fine-
tuning ERP system-business alignment, continued user support, training and learning programs,
and efficient project management. The efficacy of the above factors involves ongoing top
management support and planning to confront and convert the conflict that may result from
national and organizational culture characteristics of the supply chain partners into
communication and coordination (Mohrman et al., 1998; Galbraith, 2000). Firms’ benefit by
increased streamlined transactions resulting from standardized and integrated processes and
hence enhanced intra-firm performance. The increased information visibility across the supply
chain results not only in increased transactional benefits but also in organizational and intra-
organizational benefits thus increasing revenues and providing competitive advantages to all the
supply chain partners.
Increasing the Capacity for Information Processing
In contrast to the approaches discussed above which help firms manage uncertainty by
reducing their information processing needs, Galbraith (1973; 1974; 1977) indicates that firms
can invest in vertical information systems to increase the capacity of existing channels of
communication, create new channels, and introduce new decision mechanisms. These result in
an increase in the capacity of firms to make use of information acquired during task execution
120
without overloading the hierarchical channels as fewer exceptions would be referred up the
hierarchy. Their studies further indicate that firms should consider four variables or dimensions
while using vertical information systems to increase their information processing capacity to
handle uncertainties. These are decision frequency or timing, scope of the database, degree of
formalization, and the decision mechanism. Galbraith’s later works (Galbraith et al., 1993;
Galbraith, 1994; 2000; 2002; Mohrman et al., 1998; Galbraith et al., 2002) incorporate CSFs to
illustrate each of the four dimensions suggested by his earlier studies.
The first dimension, decision frequency or timing, refers to the length of time between
decisions. The length of time between decisions is dichotomized into periodic and continuous
information flows. This timing or frequency dimensions affects the number of decisions that are
referred upwards in the hierarchy. Galbraith (1977) suggests that as uncertainty increases
frequent changes in plans need to be made as the interval between plans grows shorter and leads
to fewer exceptions. ERP systems fall under the continuous information flow end of the decision
frequency and timing dichotomy as they make available a continuous stream of intra and inter-
firm real-time information for decision-making. The implementation of financials, logistics,
human resource modules as well as extensions such as SCM and CRM result in increased
information availability and visibility across the supply chain. Firms that pay attention to factors
like accuracy of their data, and alignment between their ERP system and business processes,
would benefit from increased transactional efficiencies as well as increased revenues and
customer satisfaction due to quick information leveraging for effective decision-making.
The second dimension, the scope of the database, is dichotomized into two types - local
and global. Local databases provide information for decision-making pertaining only to their
immediate location whereas global databases provide access to information across locations. The
121
choice of an appropriate database scope is determined by the interdependence between locations
or subunits. The greater the interdependence between subunits, the greater the need for a global
database (Galbraith, 1977). ERP systems use a single, integrated, and comprehensive database to
consolidate enterprise-wide data and provide local and global information for effective decision-
making. The databases of these systems can be configured according to firm-specific strategies
as local or global, and users granted access according to roles that are parameter configurable
(Markus et al., 2000; Clemmons & Simon, 2001; Koch, 2001). The efficacy of decisions taken
with the information available at decision points, using global or local databases, depends on the
management of appropriate managerial and organizational factors. As firms are affected by
cognitive as well as goal factors by the use of either local or global databases, they should pay
adequate attention to factors such as proper planning with top management input and support;
user support through training, learning, communication programs, national and organizational
culture characteristics. The resulting leveraging of the informational flow benefits translates into
operational and financial improvements.
The third dimension refers to the degree of formality of the collection and reporting
processes. The formalization of categories for collecting and reporting permits the transmission
of standard information through expanded communication channels. Galbraith (1977) suggests
that firms are, however, limited in their ability to standardize qualitative information and hence
non-formal channels may be required to handle such type of information. ERP systems result in
standardization and integration of business processes throughout the firm. For example, the
implementation of financial modules ensures that the same type of accounting and controlling
information is available throughout the firm. Further, the automation of transactions results in the
ERP systems handling all routine and predictable events. These systems can also be configured
122
to capture data on unique and non-routine events and raise exceptions up the hierarchy for
problem solving. Firms needs to plan the categorization of events as routine and non-routine with
top management input so that they can leverage such information to make quick decisions and
obtain enhanced performance benefits.
The fourth dimension refers to the capacity of the decision mechanism to process
information and select alternatives. Galbraith (1977) ties the capacity of the decision mechanism
to decision frequency or timing and the scope of the database. He suggests that firms can choose
from four prototype IS based on these two dimensions as well as cost. These are local-periodic,
local-continuous, global-periodic, and global-continuous. ERP systems continually collect
information and make it available for decision-making as needed. Also, these systems can be
configured to capture information on local or global databases depending upon the specific needs
of the firm. Thus, ERP systems can fall into two categories – local-continuous or global-
continuous – based upon organizational requirements. Galbraith (2002) and Galbraith et al.
(2002) suggest that ERP systems are process driven and global-real time information systems
that are based on complete workflows with people given responsibility for whole processes.
They suggest that successful deployments would, however, require firms stressing factors such
as national and organizational characteristics and continued top management driven user support.
Firms leverage the continuous real-time information from their ERP systems to achieve
operational efficiencies and accrue organizational benefits.
Besides investing in vertical information systems, Galbraith (1973; 1977; 2002) and
Galbraith et al. (2002) also suggest the creation of lateral relations to handle uncertainty by
increasing the information processing capacity of the firm. This in turn reduces the number of
decisions being referred up the hierarchy. Their studies show that lateral relations accomplish
123
this by increasing discretion at the lower organizational levels of the firm thereby moving the
level of decision-making to where the information exists rather than bringing the information up
to the points of decision-making. The studies also suggest that coordination through lateral
processes has become increasingly important with the current trend towards network and
process-oriented organizational designs.
ERP systems facilitate the formation of lateral relations through their inherent process-
oriented and modular structures that are configurable according to varied firm requirements.
These integrated systems allow coordination of all partner firms along the value chain by
removing space and time barriers to communication. Galbraith (2000) suggests that modular and
component-oriented information systems, with embedded best practices in them, have replaced
traditional managerial roles of communication and coordination. His other studies (Galbraith,
1994; 2002) suggest that firms use e-coordination to link processes to coordination needs
through use of technologies such as integrated databases, email, groupware, teams, and intranets.
This is supported by current ERP market trends wherein firms have transformed their ERP
systems into Web-enabled systems that incorporate the above coordination mechanisms to
provide standardized and integrated intra and inter-firm information availability and visibility for
effective decision-making.
The creation of lateral processes, which involves links between the financial, logistics,
human resources, and extension modules, is influenced and facilitated by people and change
management issues. Galbraith (1993; 1994; 2000; 2002) and Galbraith et al. (2002) suggest that
people and change management practices are essential for creating a congenial climate for the
development and maintenance of lateral relations. Their studies also show that the move towards
lateral relations is driven by top management and includes management development and
124
training programs, action learning, use of teams and groups, use of change champions and
outside consultants to ensure change readiness and deployment of change management
programs, and the use of reward systems to increase user support. Firms’ benefit by increased
integration of activities, user satisfaction, and increased profitability.
It can be inferred from a synthesis of the discussion in this section that Galbraith’s
information processing approach serves as an appropriate framework to evaluate ERP system
implementations. Each of the four approaches to handle uncertainty that is relevant to the
implementation of ERP systems has been presented above. Firms can choose one or a
combination of the four approaches depending upon their implementation strategies. Firms
should ensure that irrespective of their chosen approach(s), there should be a match between
their task information requirements and their capacity to process information.
Hypotheses
This section addresses the last two research questions of this study. They are: Does a
relationship exist between the implementation status of the ERP system and changes in
performance? Do CSFs influence the relationship between the implementation status of the ERP
system and changes in performance? This research study, from a synthesis of literature, and
supported by theoretical frameworks, suggests that the implementation status of ERP systems
contributes to changes in performance. Firms derive synergistic benefits from complete ERP
system deployments and further enhance their performance benefits through usage of the system
over a number of years. This research model further suggests that CSFs play a critical role in
moderating the relationship between ERP system implementation status and changes in
performance.
125
ERP System Implementation Status and Changes in Performance
The association between ERP system implementation status and changes in performance
was discussed earlier in this chapter. The discussion below reiterates the key points discussed in
the earlier sections. Various studies suggest that firms that have implemented one module or a
few modules are considered to have implemented ERP systems. These studies further suggest
that benefits accrue to firms as a result of effective usage of a single ERP system module or a
few ERP system modules (Klaus et al., 2000; Bradford & Roberts, 2001; Hitt et al., 2002; Gefen
& Ragowsky, 2005). Most ERP system research, however, supported by other relevant studies,
indicate that firms can leverage their ERP systems and enhance their business performance with
complete ERP system deployment as well as through effective system use over a number of
years (Schroeder et al., 1981; Duchessi et al., 1988; White, 1990; Johnson, 2000; Mabert et al.,
(Galbraith, 1973; 1974; 1977; 1994; 2000; 2002; Galbraith et al., 1993; Mohrman et al., 1998;
Galbraith et al., 2002) on managing uncertainty, using an information processing approach, also
underscore the systemic concepts that underlie ERP systems.
Galbraith’s (1973; 1974; 1977) studies suggest IS as one of the options that firms can use
to meet their information requirements. Galbraith’s (1994; 2002) and Galbraith et al’s (2002)
later studies acknowledge the pervasive influence of IS and suggest that appropriate IS’s could
be leveraged to adopt any or a combination of approaches to handle uncertainty. Using this latter
approach, this research study discussed the use of four of Galbraith’s (1977) five approaches to
reducing uncertainty. It can be inferred from a synthesis of these discussions that ERP systems
can be used to manage uncertainty. Firms implement those ERP modules that they believe will
contribute to changes in performance. Accordingly, the first linkage in the ERP system
126
implementation model suggests that a relationship exists between ERP system implementation
status and changes in firm performance.
Galbraith et al. (1993) and Galbraith (2000; 2002) suggest that firms should integrate
their front-office and back-office operations through IS extensions in order to derive enhanced
performance benefits. Mohrman et al. (1998) also suggest that the implementation of modular
systems and their integration over time will result in enhanced performance benefits accruing to
firms. The findings of these studies, in the context of this research study’s objectives, suggest
that firms can derive synergistic benefits from the complete deployment of their ERP systems.
Also, the implementation and the usage of these ERP systems over time would further result in
enhanced performance benefits accruing to firms. The first linkage in the ERP system model is
investigated by testing the first set of hypotheses – 1a and 1b – in this research study.
H1a: The implementation status of individual ERP system modules contributes to changes in performance. H1b: The implementation status of a holistic ERP system contributes to changes in performance. Influencers of ERP System Implementation Success
A number of variables have been identified as influencers of the relationship between
ERP system implementation status and changes in performance. The impact of these variables on
the ERP system implementation status and changes in performance has been discussed earlier in
this chapter. The discussion below seeks to emphasize key points addressed in the earlier
sections. A synthesis of ERP system research, supported by other relevant studies, indicates that
firms that effectively manage their CSFs can successfully implement their ERP systems. Also, a
CSF based approach enables firms to effectively integrate all the modules of the ERP system and
effectively use the ERP system over a number of years. This results in enhanced performance
benefits accruing to firms from their ERP systems (Duchessi et al., 1988; Holland & Light, 1999;
127
Ang, Sum, & Yeo, 2000; Al-Mashari & Zairi, 2000; 2003; Markus et al., 2000; Parr & Shanks,
2000a). Galbraith’s various studies (Galbraith, 1993; 1994; 2002; Mohrman et al., 1998;
Galbraith et al., 2002) also suggest that the technical implementation of IS in organizations
should be accompanied in parallel by appropriate people and organizational changes.
Galbraith et al. (1993) suggest that firms focus on factors such as top management,
planning, employee involvement, training, project management, and change management to
achieve IS implementation success. Mohrman et al. (1998) support the findings of the Galbraith
et al. (1993) study by suggesting that firms should also focus on managing external relationships
with partners so that IS could be successfully deployed across the supply chain. Their study
suggests that firms should also focus on factors such as communication, learning, national and
organizational culture changes in order to achieve IS implementation success. Galbraith et al.
(2002) provides further support by suggesting that firms leverage technologies such as e-
coordination to manage the factors that are critical to IS deployment success. The findings of
these studies, in the context of this research study’s objectives, suggest that CSFs influence the
relationship between ERP system implementation status and changes in firm performance. This
second linkage in the ERP system implementation model is investigated by testing the second set
of hypotheses – 2a and 2b – in this research study.
H2a: CSFs moderate the relationship between the implementation status of individual ERP system modules and changes in performance. H2b: CSFs moderate the relationship between the implementation status of a holistic ERP system and changes in performance.
Summary
ERP systems have received increasing worldwide attention in the past decade. These
systems transform the way firms do businesses and their implementation has become a business
necessity. Issues such as their implementation, key factors for successful deployment, and
128
benefits that accrue to firms have become increasingly important. A synthesis of research studies
in this chapter identified 14 modules grouped into two module sub-systems that comprise the
ERP system, 14 CSFs grouped into one aggregate CSF that impacts the implementation process,
and 10 changes in performance grouped into one overall performance category. These studies
overall support the research idea that the systemic implementation of ERP systems results in
improved performance changes for firms, albeit necessary attention being paid to managing
CSFs. An ERP system implementation model was then developed to represent the relationship
between ERP system implementation status and changes in performance taking into account the
moderating influence of CSFs on this relationship. Galbraith’s information processing approach,
based on a synthesis of open-rational and open-natural theories, provided the theoretical
underpinnings for the ERP system implementation model. Two sets of hypotheses were then
postulated for empirical testing. In chapter 3, the methodology used for examining the
relationships suggested in the ERP system implementation model is discussed.
129
CHAPTER 3
RESEARCH METHODLOGY
Introduction
This research was a cross-sectional field study that involved the use of survey
methodology to obtain data from firms across a variety of production environments. A model
was developed in Chapter 2 to include key variables and their relationships in the
implementation of enterprise resource planning (ERP) systems. A questionnaire was developed
to collect data from Indian production firms for testing these relationships. The survey was
implemented using a mixed-mode method wherein postal mail procedures were mixed with
email delivery. Choices of multivariate techniques for analyzing the data include factor and
regression analyses as well as univariate analysis of variance (ANOVA). An overview of this
study’s research methodology is shown in Figure 4.
Measuring Instrument
This section first addresses the questionnaire development process and construction
method. Then, the items and scales used to measure the variables and the relationships in the
ERP system implementation model are described. This is followed by a discussion on the
structure of the questions used to gather data on the respondent and business unit characteristics.
The last part of the section describes the reliability and validity of the survey instrument.
Questionnaire Development
The data collection instrument was primarily developed from a synthesis of ERP system
as well as other relevant research considered pertinent to this study’s objectives. The
questionnaire development involved a four-step process as detailed in the following paragraphs.
130
Literature Review and identification of independent, dependent, moderating variables
Figure 4. Research Methodology to Test the Relationships Between ERP System Implementation Status, Changes in Performance, and CSFs.
Development of a General ERP System Implementation Model depicting relationships between the independent, dependent, and moderating variables
Questionnaire Development Selection of questionnaire items from literature to measure variables and model relationships
Questionnaire review by international focus group of academicians (N = 8) Questionnaire review by international focus group of ERP consultants (N = 8)
Questionnaire review by graduate MBA (ERP) class (N = 30) Questionnaire review by pilot study firm (N = 72)
Purposive sampling method to extract names of production firms, identified as having implemented ERP, from the Confederation of Indian Industry (CII) member directory as well as other media sources
Pre-notice Letter sent to firms that have implemented ERP (N = 900)
First wave postal mailing to firms that have implemented ERP (N = 900) one week after the pre-notice letter
Thank you/Reminder Note sent by postal mail as well as email one week after the first wave mailing date
Second wave mailing (N = 773) sent to all the nonrespondents by courier six weeks after the first wave mailing
Thank you/Reminder Note as well as questionnaire attachment sent by email one week after the second wave mailing date
Telephone Reminders made to all the second wave respondents two weeks after the second mailing date
Review of returned questionnaires for accuracy and completeness
Data Analyses using factor and regression analyses as well as univariate ANOVA
131
First, the questionnaire was submitted to an international focus group consisting of eight
academicians (four each in the United States (US) and India) acknowledged as experts in the
areas of survey methodologies and ERP system research. The inputs from the focus group of
academicians led to the addition and deletion as well as the restructuring of certain items in the
questionnaire. Follow-up discussions with four of these academicians helped in further
clarification of certain ambiguous questionnaire items. The questionnaire was then submitted for
review to an international focus group of eight consultants (two in the US, one in Australia, one
in the United Kingdom (UK), four in India) with diverse functional backgrounds and extensive
techno-functional experience in information technology (IT) and more specifically in ERP
consulting (average consulting experience of over 10 years). Modifications and changes were
made to specific questionnaire items as a result of inputs from this focus group. Follow-up calls
to gain additional information were made to four of these consultants, which helped streamline
the structure and layout of the questionnaire.
The questionnaire was then administered to a graduate MBA (ERP) class at the Indian
Institute of Management Bangalore (IIMB) in India. The majority of the respondents possessed
an engineering background and had worked with ERP systems in course projects involving
industry-academia interactions. Twenty nine out of thirty students responded to the survey. Most
changes to the questionnaire, as a result of inputs from this class, related to the layout of the
questionnaire and the specific wordings of various items. Follow-up interviews with two of the
respondents helped to further simplify the construction of certain questionnaire items.
The final step in the questionnaire development process involved conducting a pilot study
in a public sector Indian mining firm, Orissa Mining Corporation (OMC), which had
implemented a 100 user license ERP system. OMC is India’s largest mining firm with a 2004-05
132
sales turnover of $165 million and operational profit of $99 million (www.orissamining.com).
The ERP project manager for this firm was the contact person for administering the
questionnaire to the 100 ERP system users in the firm. Seventy two responses were received and
two responses containing missing data were discarded (effective response rate of 70/100). The
pilot study respondents had an average work experience of twenty years and a majority of them
worked in managerial positions in diverse areas such as finance and engineering. The inputs
from these ERP system users resulted in more modification and restructuring of a few
questionnaire items.
Feedback from the respondent groups was incorporated at each step of the four-step
questionnaire development process that allowed for an incremental and comprehensive
development of the survey instrument. Follow-up calls and interviews, with a cross-section of
the respondents at various steps in the questionnaire development process, indicated that most
respondents were knowledgeable about ERP systems and were in a position to understand the
impact of the ERP system on firm performance as well as the interplay of critical success factors
(CSFs) that influences the implementation process.
Questionnaire Construction
Dillman’s (1978; 2000) time design method (TDM) and tailored design methods for
constructing the questionnaire were followed to the extent possible. No changes were made to
the questionnaire design to ensure that equivalent data were obtained across the mixed-mode
survey methods used in this study. The questionnaire was printed on five 8 ½” x 11” sheets back
to back. The questionnaire comprised of twenty questions and took about thirty minutes of the
respondents’ time to complete. Most questionnaire items focused on obtaining information on
the key variables and relationships in the ERP system implementation model. A few items were
133
also included in the questionnaire to gather demographic information. The terminology used in
the construction of the items was altered where relevant to refer to a “business unit” in order to
be consistent with this study’s unit of analysis. The items and scales used to measure the
variables and their relationships are discussed in the following paragraphs.
Operational Definitions
Independent Variables
In this study, the 14 modules identified as comprising the ERP system are
financials, controlling, plant maintenance, materials management, production planning, project
management, sales and distribution, general logistics, quality management, human resources,
2000). Content validity was assessed in this study using the 2 methods enunciated by Nunnally
and Bernstein (1994) and Flynn et al. (1990): a representative collection of items and sensible
methods of test construction. An extended literature search and a synthesis of research with an
emphasis on recurring concepts, discussed in chapter 2, confirm that a representative collection
of items was used. The earlier discussion in this chapter – using to the extent possible the TDM
and the tailored design methods of Dillman (1978; 2000) – demonstrates that sensible methods of
survey instrument construction were used.
Construct validity measures whether a scale measures the theoretical construct that it
was designed to measure (Flynn et al., 1990; Kerlinger & Lee, 2000). In this study, factor
analysis was used to establish construct validity. A principal components factor analysis was
conducted on each scale to verify whether all the items loaded onto their respective factors. The
results of this factor analysis and the results of the item-to-scale analysis, which indicates that the
items were properly assigned to each of the theoretical constructs, are discussed in chapter 4.
Criterion-related validity concerns the extent to which a survey instrument is related to a relevant
criterion variable (Flynn et al., 1990; Huck, 2000). In this study, the criterion-related validity was
evaluated by examining the multiple correlation coefficients computed for the 14 modules
comprising the ERP system and each of the 10 measures of business unit performance. The
146
analysis of the results discussed in chapter 4 indicates that the implementation status of the ERP
system was positively correlated with each of the 10 performance measures thus demonstrating
criterion-related validity.
Data Collection
This section provides details on the target population and the survey implementation procedures
used in this research study.
Target Population
The global ERP market has registered high growth rates over the past decade. Though,
the market witnessed a post-Y2K slump during the late 1990s and the early 2000s; it has since
recovered in the past few years to post double-digit growth rates. Mabert et al. (2003b) indicate
that over 30,000 firms worldwide have implemented ERP systems and the vast majority of these
deployments have taken place in the period between the mid-1990s and 2000. Most of these
implementations were concentrated in the developed countries and the bulk of ERP system
research focuses on deployments in these developed markets.
The saturation of the deployment of ERP systems in the developed countries resulted in
increasing penetration rates of ERP system implementations from the late 1990s in other markets
comprised of developing countries such as India. The Indian ERP market was valued at $2.6
million in new license revenues in 1995-96 (De, 2004) and faced languishing growth rates
through much of the mid-to-late 1990s. From the early 2000s, however, the Indian ERP market is
on a high growth trajectory, clocking compounded annual growth rates of more than 17% over
the past four to five years (new license revenues for 2006 estimated at $173 million by IDC
India, 2003).
147
Similar to the trend among ERP system implementers in the developed countries,
however, there is a high incidence of problematic and delayed implementations among Indian
firms. This is despite global ERP system vendors (SAP itself accounted for about 54% of the
Indian ERP market in 2004) and consultants dominating the Indian ERP market and using
proven implementation methodologies to implement ERP systems. De (2004) indicates that the
average cost overrun among Indian ERP system implementers is 178 %, the average schedule
overrun is 230% percent of original expectations, and the average decline in functional
improvements is 59%. His study further indicates that 90% of ERP system deployments in India
are problematic implementations.
Most Indian ERP system research remains descriptive in nature or is confined to case
analysis of ERP system deployments in individual firms. Due to the relative newness of the
Indian ERP market, there are very few rigorous empirical studies that have systematically
examined ERP system implementations. Thus, India, which has evolved into a high growth ERP
market, represents an excellent target market for this research study. As ERP systems have
evolved from materials requirements planning (MRP) and manufacturing resource planning
(MRP II) systems, research indicates that most ERP system implementations worldwide have
occurred initially in production firms. This suggests that production firms would account for
most of the ERP system implementations in India. Studies such as Dataquest (2004) indicate that
90% of all large firms in India (with turnover greater than $100 million) have implemented ERP
systems. Gartner (2003b) estimates the ERP penetration levels in the Indian manufacturing
industry to be about 37%, with this sector alone accounting for about 10% of total IT spending in
India for the year 2003-04 (a 40% increase over the previous year). These findings from the
148
Dataquest (2004) and the Gartner (2003b) studies lend further support to the identification of
production firms as the sample population for this study.
To obtain data on the implementation of ERP systems, the Confederation of Indian
Industry (CII) member directory was identified as the population for this study. The CII is
India’s premier business association with a direct membership of about 5,995 firms, and indirect
membership of over 90,000 firms from around 336 national and regional sectoral associations.
About 2,937 production firms represented in the CII can be considered as leaders in the use of IT
systems such as ERP and hence serve as the sampled population for this research study. The
production firms are from diverse industries such as machinery and equipment, metals, electrical
and electronic machinery and equipment, chemicals, rubber and plastics, automotive, computer
and telecommunications, apparel and textiles, paper, and oil and gas (www.ciionline.org). Also,
the CII member directory indicates that these production firms represent a well-balanced mix of
firms with different types of manufacturing processes, belonging to the private and the public
sectors, being of national and multinational origin, comprising of large as well as SMEs, and
hence can be considered as representative of India’s production industry.
The CII, founded in 1885, is a non-governmental, not-for-profit, industry-led, and
industry-managed organization. The stated vision of the CII is to identify and strengthen the role
of Indian industry in the economic development of the country while working towards its
globalization and integration into the world economy. The CII functions as a facilitator and
works closely with the government as well as industry on policy issues, enhancing efficiency,
competitiveness, and expanding business opportunities. The CII organizes business conferences,
economic summits, trade fairs, and workshops, in partnership with local and world organizations,
in India and abroad, to facilitate assimilation of global practices in Indian firms and to
149
disseminate information on global opportunities to Indian as well as foreign firms. The CII has
about fifty seven offices in India, seven overseas offices, and has institutional partnerships with
two hundred and forty counter-part organizations in one hundred and one countries, thus serving
as a reference point for the Indian industry as well as the international business community
(www.ciionline.org). Hence, as India’s apex business organization, the CII member directory
represents an excellent choice for this study’s target population.
Design
The research design used was survey methodology. The research issues considered in this
study can be investigated through controlled non-experimental inquiry only. This is because the
variables in this study are non-manipulable and also random respondent assignment is not
possible. Since the implementation of ERP systems has already occurred in the sampled firms,
this research study infers ex post-facto. The survey questionnaire captures a wide range of data
through the assessment of respondents’ perceptions. The data gathered are quantitatively
analyzed in chapter 4 and the study’s findings are interpreted and generalized in chapter 5.
Sampling Method
A purposive sampling method was used to extract the names of firms from the list of
2,937 production firms forming part of the CII member directory. Many ERP system-
implementing firms may not be direct members of the CII but could belong to one or more of the
CII-affiliated associations. Also, some recent CII members may not have been updated in the
CII’s mailing list. Hence, besides the CII member directory, about 240 production firms,
identified as having implemented ERP systems from major ERP vendor Websites as well as
academic and practitioner/trade journals, also formed part of the sample. The main inclusion
150
criterion was that the sample firms should be predominantly engaged in production activities and
should belong to the CII and/or any of its affiliated associations.
Telephone calls were made to all the 3,177 firms (2,937 production firms from the CII
member directory and 240 production firms from a variety of media sources) to ascertain
whether the firm had implemented an ERP system, whether the firm was willing to participate in
the survey, and who would be the best person in the firm to send the survey instrument to and
their contact details. This approach resulted in the selection of the names of 900 firms from the
target population. Besides the 900 firms, 20 holding company ERP divisions, who requested a
copy of all survey material sent to their respective corporate groups’ business units’, were
identified.
Survey Procedures
The survey procedures for this study were developed from Dillman’s (1978; 2000) TDM
and tailored design methods and were followed to the extent possible. Research studies, such as
that of Chandra and Sastry (1998; 2002), that used survey methodologies suggest that the
concept of mail surveys in India is in its infancy compared to the developed countries and hence
the responses to mail surveys are extremely poor (with a 8 to 9% response rate being considered
the norm). In situations where mail surveys may not garner adequate response rates, Dillman
(2000) suggests that mixed-mode surveys can be implemented to compensate for the situational
weaknesses in the mail survey method. Researchers may tailor their survey implementations to
specific situations by using different modes to reach respondents besides mail surveys
(telephone, emails, Web surveys, interviews, and fax). A cross-section of the respondents (N =
90; about 10% of the target population of production firms) chosen at random indicated that a
majority of them preferred postal mail and courier, and to a lesser extent email delivery
151
procedures. Accordingly, this research study uses a mixed mode survey consisting of postal mail,
courier, and email delivery mechanisms.
Based on Dillman’s (1978; 2000) TDM and tailored design methods, one week before the
first mailing date, a one page pre-notice letter was sent to all the 900 firms by postal mail (see
Appendix 1). The pre-notice letter gave a brief introduction to the research study and requested
the respondents’ participation in the survey. The first wave survey mailing consisted of a
personalized cover letter, a general instructions page, the questionnaire, a definitions page for the
14 ERP modules, and a pre-stamped reply envelope (see Appendix 2). The cover letter described
the purpose of the study and explained why participation in this study was useful and important
to the respondents. The letter also mentioned that the questionnaire has been reviewed and
approved by the University of North Texas’s (UNT’s) Institutional Review Board (IRB). The
letter further contained assurances that respondents will remain anonymous, explained that only
aggregate data will be reported, and offered a summary of the study’s results.
One week after the first wave mailing date, a thank you/reminder note was sent to all the
900 firms by postal as well as email (see Appendix 3). Dillman (2000) suggests that the use of
this follow-up contact, which supplements as well as contrasts with the initial mailing mode,
would not only increase coverage but also encourage response quality. About 70 firms sent email
replies and/or called indicating non-receipt of the questionnaire as well as the pre-notice letter.
Replacement questionnaires were couriered to all the 70 firms (five of the firms had requested
that the questionnaire be sent by email and the same was accordingly done). The courier delivery
procedure was chosen due to the vagaries of the Indian postal system as the contact details for all
the 70 firms were verified to be correct but the postal mailings did not reach the respondents.
Seventeen questionnaires were returned undelivered with the reason cited by the postal
152
department being that the respondents’ were not available. It was ascertained through follow-up
calls that these 17 respondents had left their respective firms and the contact details of their
replacements were obtained. Replacement questionnaires were then couriered to these 17 firms.
127 responses were received from the first wave mailing (response rate of 14.11% -127/900).
Out of the 127 responses, 122 were received by postal mail and 5 were received by email.
Following Dillman’s (1978; 2000) survey procedures, six weeks after the initial mailing
date, a second mailing with a new personalized cover letter (see Appendix 4), a replacement
general instructions page, questionnaire, and definitions page for the 14 ERP modules, and a pre-
stamped reply envelope was couriered to the non-respondents. This new personalized cover letter
stressed the important contribution of each completed questionnaire to the overall survey results
and solicited the non-respondents’ cooperation in completing and returning the questionnaire.
The letter also included a note requesting the members to discard this mailing if they had already
completed and returned the questionnaire from the first mailing.
One week after the second mailing date, a thank you/reminder note (see Appendix 5)
along with the replacement questionnaire, general instructions page, and the definitions page for
the 14 ERP modules was emailed to all the non-respondents of the first wave. The email delivery
procedure was adopted as an alternate to the courier delivery approach to forestall the possibility
of non-delivery of the couriered second wave questionnaires due to the vagaries of the Indian
postal system (the courier firm chosen is part of the Indian postal system; selection of this
courier firm was influenced by cost considerations). In addition, Dillman (2000) suggests that the
use of alternative questionnaire delivery methods can lead to substantial increases in response
rates. In the emailed thank you note/reminder note, the respondents were requested to complete
and return either the couriered or the emailed questionnaire.
153
A final contact, designed to contrast with the previous contacts, was made by telephone
two weeks after the second mailing to non-respondents. Dillman (2000) suggests that this final
special contact improves overall response to surveys. During these telephone call contacts, 43
respondents confirmed that they had completed and mailed back the questionnaires. These 43
responses, however, were not received. When a request was made to these 43 respondents to
resend a copy of their completed questionnaires, most of them mentioned that they did not have a
copy of their completed and mailed questionnaires. As most of these respondents were reluctant
to complete another questionnaire mailing, these 43 responses were considered lost in transit.
The second wave mailing generated a return of an additional 104 responses. Out of the 104
responses, 88 were received via postal mail and 16 by email. Of the surveys mailed in the two
waves, a total of 231 responses were returned for a response rate of 25.67% (210 by postal mail
and 21 by email). Once a satisfactory response rate was obtained all additional mailings/contacts
were discontinued.
Nonresponse Bias
Many business units in the sample surveyed were not publicly traded firms and hence not
much public information is available to distinguish respondents from and non-respondents and
thereby assess the extent of non-response bias. In an attempt to assess non-response bias,
however, follow-up calls were made to a random sample of non-respondents (N = 34; about 5%
of the nonrespondents) to determine why they did not participate in the survey. The most
common reason given by the non-respondents was that they did not have the time to complete
the survey questionnaire.
154
Sample
After completion of the two-wave mixed-mode survey, each returned questionnaire was
initially reviewed to analyze the response to the questionnaire item that assessed whether the
responding business units were members of the CII or any of the CII affiliated associations. All
the responses obtained were from members of the CII or CII affiliated associations and hence
were considered part of the sample. Then, each of the returned questionnaires was then reviewed
to identify any omissions, ambiguities, and irregularities committed by the respondents while
completing the survey so as to arrive at the effective sample to be used for analysis. Out of the
231 completed questionnaires received, 12 respondents mentioned they were yet to go live with
their ERP systems and their responses were discarded. Three questionnaires had most of the data
on the key model variables missing and these were also discarded. The data from the remaining
216 completed questionnaires were then input into the SPSS 12.0 program and the information
verified to ensure accuracy.
A review of the dataset indicated that out of the 216 responses, 111 had varied amounts
of missing data for the independent, moderating, and the dependent variables. Emails were sent
to all the 111 respondents requesting them to provide information on the missing data in their
questionnaire responses. Most of the missing data pertained to question 11 on the
implementation status of the each ERP module in the respondent’s business unit. Forty nine
responses were received by email with the missing data details completed. Telephone calls were
made to the remaining 62 respondents and information with regard to the missing data was
obtained. The most common answer received from respondents was that they had completed
question 11 with respect to only those ERP modules that had been implemented in their business
unit; the assumption being that those ERP modules that were not marked on the questionnaire
155
have not been implemented. A further perusal of the questionnaires revealed that 43 responses
had varying amounts of missing data on the demographic variables in the questionnaire.
Telephone calls were made to these 43 respondents to obtain information on the missing data.
The accuracy of the demographic information obtained was verified by comparing the
information obtained through the questionnaire against the information provided on the Websites
of a random selection of firms (N = 22; about 10% of the sample size). The final dataset
consisted of 216 firms (effective response rate of 24% - 216/900).
The 216 responses were then evaluated based on the business unit’s level of
manufacturing activities. This is because this study focuses on production firms as they represent
the early users of ERP systems and account for most of the ERP system implementations in
India. In the questionnaire, respondents indicated the percentage of their business unit’s sales
that comes from manufacturing activities and the percentage that comes from service activities.
A frequency distribution based on the percentage of the business unit’s sales generated from
manufacturing is shown in figure 5.
A review of the data shown in figure 5 reveals that business units with 70% or more of
their sales coming from manufacturing activities is a logical cut-off point to categorize business
units as a majority of sales coming from manufacturing activities. This approach resulted in the
omission of an additional 13 responses that represent primarily service firms. Only business units
that realized 70% or more of their sales from manufacturing activities were included in the
sample and thus the final dataset for analysis comprised of 203 responses.
To aid in understanding the basic characteristics of the underlying data and relationships,
the data were graphically examined through construction of a histogram and a stem and leaf
diagram. The nature of the relationships between the key study variables were next examined
156
Figure 5. Frequency Distribution Based on Percentage of Sales Generated From Manufacturing.
through scatter plot and box plot diagrams. To assess the ability of the data to meet the statistical
assumptions underlying multivariate techniques, the data were tested for normality,
homoscedasticity, linearity, and the absence of correlations in prediction errors. The testing of
these assumptions and their results are discussed in detail in chapter 4.
Power Analysis
Seventy two responses were obtained from the pilot study conducted at OMC (response
rate of 72% - 72/100). Out of the 72 responses, two had most of the data on the key model
variables missing and were discarded. The data from the remaining 70 responses were entered
into the SPSS 12.0 program and then reviewed to identify any omissions, ambiguities, and
irregularities committed by the respondents while completing the survey. Mean responses were
substituted for the missing data. The data were assessed for linearity of the phenomena
measured, constant variance of the error terms, independence of the error terms, and normality of
the error term distribution. It was ascertained that there were no major violations of any of the
statistical assumptions underlying multivariate techniques. Summated scales were constructed
for the implementation status of the ERP system (five modules implemented at OMC) and the 10
performance measures. The SPSS 12.0 program was used to obtain the internal consistency of
.00 10.0025.00
30.0046.00
50.0060.00
70.0075.00
80.0085.00
90.0092.00
95.0097.00
98.0099.00
100.00
Percentage Sales - Manufacturing
0
20
40
60
80
100
120
140
Freq
uenc
y
157
the two summated scales: Cronbach’s Alpha for the ERP implementation status scale was .814
and that for the performance scale was .767.
A test of whether the holistic implementation status of OMC’s ERP system would result
in synergistic changes in performance was conducted by running standard multiple linear
regression analyses. The results indicate that the model fit was significant at the .10 level (F =
3.899). The correlation coefficient obtained was .235 and the coefficient of determination R²
.055. The regression coefficient (-.235), however, indicates a negative relationship between the
ERP system’s implementation status and firm performance. This negative association is due the
fact that the pilot study was conducted within a year after the firm had gone live with its ERP
system. ERP researchers such as Caldwell (1998) and Sarkis and Sundarraj (2003) indicate that
most ERP firms experience a dip in firm performance the first year of going live; once the
system stabilizes, firm performance picks up in the subsequent years.
Power analysis of the pilot study data using the proc power program in SAS 9.1.2 reveals
that with an alpha level of .05 and an effect size of .235 {between small (0.10) to medium (0.30)
effect size as per Cohen & Cohen, 1975} the power of the test was .504. Extrapolating the above
power calculations, the power to sample size graph in the proc power program in SAS 9.1.2
indicates that at an alpha level of .05 and an effect size of .235 to achieve a desired power level
of .80, the sample size required is around 160 (to achieve a desired power level of .90 the sample
size required is 200). Also, researchers such as Hair, Anderson, Tatham, and Black (1998)
suggest that a sample size equivalent to 15 times the number of independent variables (the
minimum being 5 times the number of independent variables) is excellent for the type of analysis
used in this study. Using this approach to determine the minimum sample size, a meaningful
sample size is 210 (14 x 15) for a study with 14 independent variables. The number of responses
158
received from the mailings broadly satisfies both the approaches to determine the required
sample size.
Common Method Bias
Podsakoff and Organ (1986) attribute common method bias due to the same source bias
that results when information is gathered using self-reports. The recommendations of Podsakoff
and Organ (1986) for avoidance of common method bias problems were followed to the extent
possible. This involved the use of scale re-ordering wherein the design of the questionnaire was
altered so that the items used to measure the implementation status of ERP systems were placed
before the items used to measure the changes in performance. Other steps involved the use of a
purposive sampling technique to improve the representativeness of the sample and the adoption
of a multi-mode survey method to increase the survey response rate.
Problems associated with the common method bias, however, cannot all be addressed
before survey administration. Hence, post-hoc techniques were also used to assess the possible
effects of common method variance (Podsakoff & Organ, 1986). Accordingly, Harmon’s one-
factor test was used to assess whether common method bias is a problem in this study. Seven
factors with Eigen values greater than one were extracted from all the measures in this study and
in total accounted for 63.34% of the total variance. The first factor accounted for 30.11% of the
variance. Since a single factor did not emerge from the factor analysis and one factor did not
account for most of the variance, this indicates that the results of the study are not due to
common method bias.
Summary
This chapter examined in detail the rigorous design methodology used in this study. The
development, modification, and validation of the survey instrument have been extensively
159
discussed in this chapter. The target population, the survey implementation process, and the
sample selection procedure have been described. The process of cleaning the data and testing for
common method bias were also discussed. The analysis of results is presented in the next
chapter.
160
CHAPTER 4
ANALYSIS OF RESULTS
Introduction
The results of the statistical procedures used to test the hypotheses are discussed in this
chapter. First, data pertaining to the demographic profile for the business units as well as the
respondents’ characteristics are presented. Then, the results of the factor and regression analyses
as well as univariate analysis of variance (ANOVA) are discussed.
Sample
The effective sample for this study consists of 203 production firms which derive more
than 70% of their revenue from manufacturing activities. In this section of the chapter, the
characteristics of the sampled business units are first discussed followed by a brief overview of
the profile of the survey respondents.
Business Unit Characteristics
The survey questionnaire gathered demographic data pertaining to the size of the business
unit, the extent of union involvement, firm type and origin, industry type, and the type of
enterprise resource planning (ERP) system implemented. The data pertaining to the business unit
characteristics are shown in Table 13. The first part of Table 13 indicates that the sample is a
good representation of the Indian production sector comprising of firms of different sizes. The
size of the business units were assessed in terms of both the number of employees as well as the
annual sales turnover. The number of employees over 1,000 is the category most frequently
represented and accounts for 41.4% of the sample (N = 84). This, together with the number of
employees in the 500 to 999 category, represents 66% of the sample (N = 134). The number of
161
employees in the two categories 0 to 99 and 100 to 249 have the lowest frequencies (N = 4 and N
= 25 respectively) and account for 14.3% of the sample.
Table 13 Frequency Distribution for Business Units’ Characteristics ____________________________________________________________________________________ Characteristics Frequency Percent ____________________________________________________________________________________ Number of Employees 0-99 4 2.0 100-249 25 12.3 250-499 40 19.7 500-999 50 24.6 Over 1000 84 41.4 Annual Rupee Sales Greater than 5 crores but less than 100 crores 57 28.1 Greater than 100 crores but less than 250 crores 32 15.8 Greater than 250 crores but less than 500 crores 35 17.2 Greater than 500 crores but less than 1000 crores 29 14.3 Greater than 1000 crores 50 24.6 Union Status Unionized 45 22.2 Non-Unionized 47 23.2 Both 111 54.7 Sector Private 167 82.3 Public 32 15.8 Joint 4 2.0 Origin Multinational 40 19.7 Indian 157 77.3 Joint 6 3.0 ___________________________________________________________________________________
The second part of Table 13 provides information regarding annual sales. The category
with the highest frequency consists of 57 business units with annual sales between Rs. 5 and 100
162
crores and represents 28.1% of the sample. The category with the second highest frequency (N =
50) reported sales greater than Rs. 1,000 crores and forms 24.6% of the sample. The remaining
firms in the sample (N = 96) are more or less evenly distributed across the three annual sales
categories ranging from greater than Rs.100 crores to less than Rs. 1000 crores. More than half
the firms in the sample (N = 111) have a mix of both unionized and non-unionized environments
and represent 54.7% of the sample. The third part of Table 13 indicates that firms constituting
the remaining part of the sample (N = 92) are more or less evenly distributed between unionized
(22.2%) and non-unionized (23.2%) environments.
The fourth part of Table 13 indicates that a majority of firms (N = 167) belong to the
private sector and represent 82.3% of the sample. Thirty two public sector firms responded to the
survey and form 15.8% of the sample. Joint sector firms (N = 4) account for 2% of the sample.
The last part of Table 13 indicates that a majority of firms (N = 157) are of Indian origin and
comprise 77.3% of the sample. Multinational firms of foreign origin (N = 40) represent 19.7% of
the sample while joint ventures (N = 6) constitute 6% of the sample.
The frequency distribution for business units by production type is presented in Table 14.
Make-to-order was the primary production system used by firms in the sample. The mean
percentage of products produced with a make-to-order system was 61.79%; 38.18% of the
products were produced with a make-to-stock system. The sample data indicates that most firms
employed a mix of different production processes; however, many firms also employed only one
production process. Firms using the repetitive production process (26.37%) formed the largest
mean percentage of the sample. Firms were more or less evenly distributed between the batch
process (mean percentage of 21.97%) and the project process (mean percentage of 20.01%)
types. The flow process type had a mean percentage of 17.74% and the job shop type 13.91%.
163
Table 14 Means Distribution for Business Units’ by Production Type __________________________________________________________________________________
Industries Mean __________________________________________________________________________________
Make-to-Order 61.79 Make-to-Stock 38.18 Production Flow Type Project 20.01 Job Shop 13.91 Batch 21.97 Repetitive 26.37 Flow 17.74 __________________________________________________________________________________
A wide variety of industries are represented in the sample. Table 15 shows the frequency
distribution for business units by industry type. The majority of industries (67%) fall into one of
10 major industry groups. Business units in the automotive industry (N = 44) are the most
frequently represented group accounting for 21.7% of the sample. The next most frequently
represented group is machinery and equipment (N = 20) representing 9.9% of the sample.
Table 15 Frequency Distribution for Business Units’ by Industries Represented __________________________________________________________________________________
Industries Frequency Percent __________________________________________________________________________________
Automotive 44 21.7 Machinery and Equipment 20 9.9 Basic Metal/Coal/Lignite/Uranium/Thorium/Others 13 6.4 Electronic/Telecommunication Equipment 11 5.4 Apparel and Textiles 11 5.4 Food Products & Beverages 11 5.4 Coke/Crude/Petroleum/Natural Gas/Others 9 4.4 Fabricated Metal Products 7 3.4 Rubber/Plastic Products 5 2.5 Paper and Paper Products 5 2.5 Others 67 33.0 __________________________________________________________________________________
164
Table 16 provides the frequency distribution for firms by the type of ERP system
implemented. The table indicates that the majority of the firms (N = 132) implemented a single
vendor ERP system representing 65% of the sample. SAP (N = 60) is the dominant ERP system
implemented by 29.6% of the sampled firms. This is followed by Oracle/PeopleSoft (N = 21)
accounting for 10.3% of the sample, SSA Global/Baan and Microsoft (N = 9 each) representing
4.4% of the sample each, and Ramco (N = 8) forming 3.9% of the sample. The other major ERP
vendors are QAD and ESS (N = 5 each), representing 5.0% of the sample. A small number of
firms (N = 14) have implemented two or more (BoB) ERP systems accounting for 6.9% of the
sample. In-house developed ERP systems (N = 57) represent the second most dominant ERP
system implemented among the sampled firms accounting for 28.1% of the sample.
Table 16 Frequency Distribution for Business Units’ by Type of ERP System Implemented __________________________________________________________________________________
Type of ERP System Implemented Frequency Percent __________________________________________________________________________________
Single Vendor ERP System SAP 60 29.6 Oracle/PeopleSoft 21 10.3 SSA Global/Baan 9 4.4 Microsoft 9 4.4 Ramco 8 3.9 QAD 5 2.5 ESS 5 2.5 Others 15 7.4 Best of Breed ERP System SAP & Oracle/PeopleSoft 2 1.0 SAP & SSA Global/Ban 2 1.0 Others 10 4.9 In-House Developed ERP System In-House Developed ERP 57 28.1 _________________________________________________________________________________
165
Respondent Characteristics
The respondents’ characteristics are given in Table 17. The respondents to the survey
provided both their total number of years of work experience as well as years of work experience
in the present firm. For ease of presentation, however, as shown in the first two parts of the table,
responses were grouped into one of three categories: less than 5 years, 5 to 10 years, and over 10
years. The first part of Table 17 shows the frequencies for the respondents’ total number of years
of work experience. The majority of the respondents (N = 187) possess more than 10 years of
work experience accounting for 92.1% of the sample. The second part of Table 17 shows the
frequencies for the number of years the respondents have been with the present firm. The most
frequently reported category is that of respondents with more than 10 years of work experience
(N = 115) accounting for 56.7% of the sample. The next highest category is respondents with
less than 5 years of experience (N = 60) forming 29.5% of the sample. Twenty eight respondents
have been with the same firm between 5 to 10 years and account for 13.8% of the sample.
The third part of table 17 depicts information provided by respondents with respect to
their current position in the firm. About half the respondents (N = 103) belong to the top
management category and constitute 50.7% of the sample. The next highest category of
respondents (N = 81) is middle management and represents 39.9% of the sample. Lower
management (N = 8) and team leaders (N = 7) account for 3.9% and 3.4% of the sample
respectively. The fourth part of table 17 presents information pertaining to the respondents’
current area of work. A majority of the respondents (N = 175) work in the information
technology/information systems (IT/IS) area and represent 86.2% of the sample. Finance (N =
15) is the next highest work area reported and accounts for 7.4% of the sample.
Total Experience Frequency Percent __________________________________________________________________________________
Less than 5 years 6 3.0 5 to 10 years 10 4.9 Over 10 years 187 92.1 __________________________________________________________________________________
Experience with Present Organization Frequency Percent __________________________________________________________________________________
Less than 5 years 60 29.5 5 to 10 years 28 13.8 Over 10 years 115 56.7 __________________________________________________________________________________
Current Position Frequency Percent __________________________________________________________________________________
Top Management 103 50.7 Middle Management 81 39.9 Lower Management 8 3.9 Team Leaders 7 3.4 Others 4 2.0 __________________________________________________________________________________
Current Work Area Frequency Percent __________________________________________________________________________________
Finance 15 7.4 Production 2 1.0 Marketing 4 2.0 Information Technology/Systems 175 86.2 Others 7 3.4 __________________________________________________________________________________
Level of Education Frequency Percent __________________________________________________________________________________
A summary of items omitted from the scales and the number of items retained is
presented in Table 22. Internal consistency analysis using the SPSS 12.0 program was conducted
for each of the 13 CSFs and their Cronbach’s Alpha is also presented in the table. The results
presented in the table indicate that the Cronbach’s Alpha increased for five of the 13 CSFs when
compared to literature. Items for six of the 13 CSFs were drawn from multiple studies and this
precludes a direct comparison of their Cronbach’s Alpha values with those drawn from literature.
A detailed discussion of the above is given in Chapter 5.
Table 22 Summary of Items Omitted from the 13 CSF Scales & Cronbach’s Alpha ____________________________________________________________________________________
CSFs Original Number Final Cronbach’s Cronbach’s Number of Items Number Alpha Alpha
of Items Omitted of Items (Literature) ____________________________________________________________________________________
An examination of the reliability analysis results for each of the 13 CSF scales indicates
that removal of items with low factor loadings did not result in any significant improvement of
scale reliabilities and hence no items were deleted based on this criterion. The reliability
174
coefficients of the alignment, consultants, and the organizational culture CSFs before deletion of
items were .642, .493, and .703 respectively.
Regression Analysis
The data were first examined to check their suitability for conducting multiple regression
analyses. A test on whether demographic data influences the relationships hypothesized in this
research study was conducted. The data were then subject to regression analyses and univariate
ANOVA and the results are discussed in this section of the chapter.
Regression Assumptions
Research studies indicate that most empirical ERP system studies use multiple regression
analyses to analyze data (Francalanci, 2001; Hong & Kim, 2001; Gefen & Ridings, 2002; Mabert
et al., 2003a; Gefen & Ragowsky, 2005). The findings from these studies suggest that the type of
regression analyses used depends on the way in which the moderator changes the effect of the
independent variables on the dependent variables (linear, quadratic, or step). In this research
study, multiple linear regression analysis was chosen to test the ERP system implementation
model. This regression technique was chosen based on the a priori assumption that the effect of
the independent variables on the dependent variables changes linearly with respect to the
moderators.
Hair et al. (1998) indicate that problems due to multicollinearity need to be addressed
when correlations between the independent variables exceed 0.90. A perusal of the correlation
matrix between the independent variables in this study revealed that the correlations ranged from
.111 to .858, which is well below the Hair et al’s recommended criteria of 0.90. Lewis-Beck
(1980) and Hair et al. (1998) indicate that multiple variable collinearities can also be examined
by regressing each independent variable on all the other independent variables. The regression of
175
each independent variable on all the other independent variables resulted in a R² ranging from
.210 to .818 showing some intercorrelation exists but none exceeded the threshold value of 0.90.
Further, the variance inflation factor (VIF) values were also examined to assess multicollinearity.
The VIF values ranged from 1.199 to 5.496, which is well below the threshold value of 10 (Hair
et al., 1998). The above tests indicate that multicollinearity is not a major problem in this study.
Next, the regressions assumptions of linearity of the phenomena measured, constant
variance of the error terms, independence of the error terms, and normality of the error term
distribution were examined. The assumption of linearity was assessed through an analysis of
residuals and partial regression plots. Scatter plots of residuals plotted against predicted values
showed that there was no non-linear pattern to the residuals thus ensuring that the assumptions of
linearity are met. An examination of the partial regression plots also confirmed the linearity of
the model relationships.
A perusal of the scatter plots confirmed that there were no patterns of increasing or
decreasing residuals thus indicating constancy of the residuals across values of the independent
variables. To assess the independence of the error terms the residuals were plotted against a
sequencing variable, the respondent number, which represents the order in which the responses
were collected. A perusal of the plot of the residuals against the respondent number indicated no
consistent pattern thus confirming the independence of the residuals.
Several methods were used to check the normality of the error term distribution - an
examination of the histograms of residuals, a visual check on whether the distributions
approximate normal distributions, and the use of normal probability plots. The results indicated
that there were no major problems associated with non-normality of the variables. A perusal of
the residuals and the partial regression plots also did not indicate the presence of significant
176
residuals that can be classified as outliers and hence no observation was excluded from the
analysis.
Control for Demographic Variables
A test on whether demographic data influences the relationships hypothesized in this
research study was conducted by running standard linear regression analyses and developing
regression models to analyze the effects of each of the 18 control variables. The 18 control
variables tested were business unit size in terms of the number of employees and Rupee sales;
percentage of business unit’s sales generated from manufacturing and service; business unit
characteristics in terms of unionization, sector, and origin; percentage of business from make-to-
order (MTO) to make-to-stock (MTS); percentage of business unit sales by type of production
flow (project, job shop, batch, repetitive, flow); type of industry; and type of ERP system (single
vendor, BoB, in-house developed). The results indicate that no model was fitted for any of the
control variables.
Regression Models
A test for hypothesis 1a – the implementation status of individual ERP system modules
contribute to changes in performance – was conducted by running standard linear regression
analyses and developing separate regression models to analyze each of the 10 performance
measures. The results of the regression analysis are presented in Table 23. The table shows the
size of the standardized regression coefficients (β), coefficients of determination (R²), and the F
ratios (F) for the fitted models. Only significant parameter estimates of the fitted models are
shown. All non-significant parameter estimates are omitted from the table. The regression
models indicate that the quality management module is statistically significant for all the 10
performance measures. This suggests that as the status of implementation of the quality
177
management module increases, changes in firm performance for all the 10 measures also
increases.
Table 23 Significant Relationships Between Implementation Status of ERP Modules and Changes in Performance ___________________________________________________________________________ Implementation Changes in Performance Status of ERP ______________________________________________________________________________________________ Modules Inventory Information On-time Standardization Profitability Management Quality Delivery β R² F β R² F β R² F β R² F β R² F
Implementation Changes in Performance Status of ERP ______ _______________________________________________________________________________________________ Modules Return on Information User Customer Competitive
Investment Availability Satisfaction Satisfaction Advantage β R² F β R² F β R² F β R² F β R² F _____________________________________________________________________________________________________
Note Modules: FI – Financials, CO – Controlling, PM – Plant Maintenance, MM – Materials Management, PP – Production Planning, SD – Sales and Distribution, GL – General Logistics, QM – Quality Management, HR – Human Resources, SCM – Supply Chain Management, CRM – Customer Relationship Management, APO/APS – Advance Planner and Optimizer/Advance Planner and Scheduler All β values are standardized regression coefficients Significance: * p < .05, ** p < .01, *** p < .001
The plant maintenance module is statistically significant for nine of the 10 performance
measures (except information quality). The production planning module is statistically
178
significant for eight out of the 10 performance measures (except standardization and competitive
advantage) and the controlling module for seven of the 10 performance measures (except on-
time delivery, user satisfaction, and customer satisfaction). Two of the modules – financials and
general logistics – are statistically significant for six of the 10 performance measures.
Information quality, on-time delivery, standardization, and profitably are the performance
measures not significant for the financials module; whereas, inventory management, on-time
delivery, user satisfaction, and customer satisfaction are non-significant for the general logistics
module.
The sales and distribution module is statistically significant for five of the 10
performance measures (except inventory management, information quality, on-time delivery, and
information availability) and the CRM module for four of the 10 performance measures (except
inventory management, information quality, on-time delivery, standardization, information
availability, user satisfaction). The supply chain management (SCM) module is significant for
two performance measures – profitability and return on investment (ROI). The human resources
and the APO/APS model are statistically significant for one performance measure, ROI and
information quality respectively. No model was fitted for the E-commerce and the project system
modules.
The regression model for the ROI performance measure is the best fitted model and
shows that 11 of the 14 modules are statistically significant (except the project system, E-
commerce, and the APO/APS modules). The status of the implementation of the materials
management module is the most important variable tested for predicting ROI. The size of the
β, R², and the F values for seven of the 13 modules, besides the materials management module,
further indicates that these modules are important variables for predicting ROI. The β values for
179
the controlling and the general logistics modules indicate that they are the most important
variables for predicting information quality. The β values for the plant maintenance module
indicate that it is the most important variable for predicting inventory management. Also, the β
values for the quality management module indicate that it is an important variable for predicting
information availability, user satisfaction, and competitive advantage. The CRM module is the
most important variable for predicting profitability.
A synthesis of the discussion pertaining to the above results indicates that 12 of the 14
modules were supported in the test for hypothesis 1a. Except for the project system and the E-
Commerce modules, all the other modules made a significant contribution to one or more of the
10 performance measures even though the contribution of each module varied with each of the
performance measures. The interpretations of these results are discussed in detail in chapter 5.
A test for hypothesis 1b – the implementation status of a holistic ERP system contributes
to changes in performance – was conducted by running standard linear regression analyses and
developing regression models to analyze the synergistic changes in performance resulting from
the implementation of a holistic ERP system. Summated scales were constructed to measure the
holistic implementation status of the ERP system comprising of all the 14 modules. Hair et al.
(1998) indicates that the use of summated scales helps portray complex concepts in a single
measure while reducing measurement error and are appropriate for research studies where
generalizability of results is important. The internal consistency of the holistic implementation
status scale was estimated using Cronbach’s Alpha. Internal consistency analysis using the SPSS
12.0 program yielded a reliability coefficient of 0.876 for the holistic implementation status
scale. Further, an examination of the bivariate correlations between the multiple correlation
coefficient calculated for the holistic ERP implementation status and each of the 10 performance
180
measures indicates that the correlations ranged from .144 to .332 thus indicating criterion-related
validity.
The results of the regression analysis are presented in Table 24. The table shows the size
of the standardized regression coefficients (β), coefficients of determination (R²), and the F ratios
(F) for the fitted models. Only significant parameter estimates of the fitted models are shown. All
non-significant parameter estimates are omitted from the table.
Table 24 Significant Relationships Between Holistic Implementation Status of ERP System and Changes in Performance ___________________________________________________________________________ Implementation Changes in Performance Status of ERP ______________________________________________________________________________________________ System Inventory Information On-time Standardization Profitability Management Quality Delivery β R² F β R² F β R² F β R² F β R² F
___________________________________________________________________________ Implementation Changes in Performance Status of ERP System _____________________________________________________________________________________________________ Return on Information User Customer Competitive
Investment Availability Satisfaction Satisfaction Advantage β R² F β R² F β R² F β R² F β R² F _____________________________________________________________________________________________________
Holistic ERP .332*** .110 24.944*** .200** .040 8.409** .212** .045 9.432** .212** .045 9.595** . 226*** .051 10.829*** System ________________________________________________________________________________________________________________ Note β: All values are standardized regression coefficients. Significance: * p < .05, ** p < .01, *** p < .001
The regression models indicate support for the relationship between a holistic
implementation status of the ERP system and synergistic changes in performance. This suggests
that as the implementation status of a holistic ERP system increases, changes in each of the 10
performance measures also increases. The regression model for the ROI performance measure is
the best fitted model. About 11% of the variation in ROI is explained by the holistic
181
implementation status scale. The F value of 24.944 indicates that there is a less than .1% chance
that an F value this large for ROI would happen by chance alone. The size of the β values for the
other performance measures also indicates a good fit for the regression models. A synthesis of
the discussion pertaining to the above results indicates support for the first hypothesis 1b.
To further understand the relationships hypothesized in hypothesis 1b, the holistic
implementation status variable was dichotomized as “low” and “high.” The “low” category
comprised of frequency percentile values less than 33.33% and the “high” category greater than
66.67%. A test for hypothesis 1b was conducted by running univariate ANOVA and the results
are presented in Table 25.
Table 25 Significant Relationships Between Holistic Implementation Status of ERP System and Changes in Performance (ANOVA) ___________________________________________________________________________________________________________________
Implementation Changes in Performance Status of ERP ________________________________________________________________________________________________________ System Inventory Information On-Time Delivery Standardization Profitability Management Quality
SS MS F SS MS F SS MS F SS MS F SS MS F ________________________________________________________________________________________________________ ___________________________________________________________________________________________________________________
Implementation Changes in Performance Status of ERP________________________________________________________________________________________________________ System Return on Investment Information User Satisfaction Customer Competitive Availability Satisfaction Advantage
SS MS F SS MS F SS MS F SS MS F SS MS F ________________________________________________________________________________________________________
___________________________________________________________________________________________________________________ Note Significance: * p < .05, ** p < .01, *** p < .001
182
Figure 6 presents the profile plots for three high performing measures (ROI, profitability,
competitive advantage) and three low performing measures (on-time delivery, standardization,
information availability).
Figure 6. Significant Effects Between Holistic Implementation Status of ERP System and Changes in Performance.
2.001.00
Holistic Implementation Status
6
5.75
5.5
5.25
5
4.75
Perf
orm
ance
- R
OI
Estimated Marginal Means
2.001.00
Holistic Implementation Status
5.8
5.6
5.4
5.2
5
Perf
orm
ance
- Pr
ofita
bilit
y
Estimated Marginal Means
2.001.00
Holistic Implementation Status
5.5
5.25
5
4.75
Perf
orm
ance
- C
ompe
titiv
e A
dvan
tage
Estimated Marginal Means
2.001.00
Holistic Implementation Status
6.2
6.1
6
5.9
5.8
5.7
5.6
Perf
orm
ance
- O
n-tim
e D
eliv
ery
Estimated Marginal Means
2.001.00
Holistic Implementation Status
6.3
6.2
6.1
6
5.9
5.8
5.7
Perf
orm
ance
- St
anda
rdiz
atio
n
Estimated Marginal Means
2.001.00
Holistic Implementation Status
6.6
6.5
6.4
6.3
6.2
6.1
6
Perf
orm
ance
- In
form
atio
n A
vaila
bilit
y
Estimated Marginal Means
183
The effect size and statistical power for ROI, profitability, and competitive advantage are
.070, .081, .168 and .888, .928, .999 respectively. The effect size and statistical power for on-
time delivery, standardization, and information availability are .038, .044, .060 and .633, .695,
.832 respectively. A perusal of the profile plots in Figure 6 indicates a linear relationship
between the holistic ERP implementation status and changes in performance. The profile plots
for the other four performance measures not shown in Figure 6 also exhibit a similar relationship.
These profile plots suggest that performance increases with increases in holistic ERP
implementation status. The slope of the profile plots indicate that for the same holistic ERP
implementation statuses, increases in ROI, profitability, and competitive advantage are greater
than increases in on-time delivery, standardization, and information availability. The
interpretations of these results are discussed in detail in chapter 5.
The results in Table 23 indicate that the project system and the e-commerce modules
individually do not make a significant contribution to any of the 10 performance measures. The
results in Table 24, however, reveal that a holistic ERP system contributes significantly to all the
10 performance measures. To further understand these relationships, three holistic
implementation status scales were constructed – a 12 module summated scale (excluding the
project system and e-commerce modules) and two 13 module summated scales (excluding the e-
commerce and project system modules, respectively). A test for hypothesis 1b was conducted by
running standard linear regression analysis and the results are presented in Table 26. The results
in Table 26 indicate that the implementation of the 13 module holistic ERP system (excluding
the e-commerce module) results in higher benefits when compared to the 12 module ERP system
(excluding the project system and e-commerce modules), the 14 module ERP system, and the 13
module ERP system (excluding the project system module).
184
Table 26 Significant Relationships Between Different Holistic Implementation Statuses of ERP System and Changes in Performance ___________________________________________________________________________ Implementation Changes in Performance Status of ERP ______________________________________________________________________________________________ System Inventory Information On-time Standardization Profitability Management Quality Delivery β R² F β R² F β R² F β R² F β R² F
___________________________________________________________________________ Implementation Changes in Performance Status of ERP System ______________________________________________________________________________________________ Return on Information User Customer Competitive
Investment Availability Satisfaction Satisfaction Advantage β R² F β R² F β R² F β R² F β R² F ______________________________________________________________________________________________
A test of the hypothesis 1b using the four holistic ERP implementation status scales and a
summated scale as a measure of overall performance was conducted and the results are shown in
Table 27. Analysis of the table reveals additional support to the findings that the 13 module
holistic ERP system (excluding the e-commerce module) provides higher benefits to firms. The
interpretations of these findings are discussed in Chapter 5.
Table 27 Significant Relationships Between Different Holistic Implementation Statuses of ERP System and Overall Change in Performance ________________________________________________________________________________________________________________ Implementation Status Overall Change in Performance of ERP System (10 Performance Measures) β R² F ________________________________________________________________________________________________________________ Holistic ERP System .285 *** .081 17.823*** (14 modules) Holistic ERP System .288 *** .083 18.227*** (12 modules excluding project system and e-commerce) Holistic ERP System .290*** .084 18.502*** (13 modules excluding e-commerce) Holistic ERP System .283*** .080 17.562*** (13 modules excluding project system) _______________________________________________________________________________________________________________ Note β: All values are standardized regression coefficients. Significance: * p < .05, ** p < .01, *** p < .001
A test for hypothesis 2a – CSFs moderate the relationship between the implementation
status of individual ERP system modules and changes in performance – was conducted by
running standard linear regression analyses and developing separate regression models to
analyze the moderator effects of each of the 13 CSF measures. Summated scales were
constructed for each of the 13 CSF measures. The results of the regression analysis are presented
in Tables 28a to 28d.
186
Table 28a Significant Interaction Relationships Between Implementation Status of ERP Modules and Changes in Performance _____________________________________________________________________________________________________________________
Implementation Changes in Performance Status ____________________________________________________________________________________________________________ X CSFs Inventory Management Information Quality On-Time Delivery Standardization Profitability β ∆R² ∆F β ∆R² ∆F β ∆R² ∆F β ∆R² ∆F β ∆R² ∆F
Top Management X SD .661* .018 4.524* .670 * .018 4.789* EC -.616 * .017 4.132 * Planning X CO .780* .024 6.070* PP -.688** .026 6.992** SD .728** .026 6.744** QM -.978** .029 7.767** SCM .888* .020 5.034* APO/APS 1.430* .018 4.067* User Support X FI .749* .022 5.170* . 814** .026 6.798** .848** .028 7.685** MM .675* .016 4.256* .806* .023 6.359* PP .768* .024 6.159* SD .920* .035 8.416* .863** .031 8.184** .983*** .04 11.238*** QM -.894* .020 4.783* SCM .873* .015 4.119* CRM -1.426* .021 5.916* Project Management X PS -.765* .017 4.255* SD .699** .016 4.015** QM -.757* .017 3.904* HR .718* .019 4.395* Training X FI .578* .018 4.275* .686* .026 6.036* .600* .020 4.663* PP .611* .019 4.446* PS 1.033* .025 6.235* SD .624* .019 4.342* .616* .018 4.275* HR .712* .022 5.122* .671* .020 4.531* .711* .022 5.172* SCM -.609* .016 3.963* Learning X FI .539* .015 3.888* CO .706* .022 5.866* PP .538* . 016 4.015* SD .632* .021 5.393* Data Accuracy X SCM -.891* .019 4.190* ____________________________________________________________________________________________________________________
Note Modules: FI – Financials, CO – Controlling, PM – Plant Maintenance, MM – Materials Management, PP – Production Planning, SD – Sales and Distribution, GL – General Logistics, QM – Quality Management, HR – Human Resources, SCM – Supply Chain Management, CRM – Customer Relationship Management, APO/APS – Advance Planner and Optimizer/Advance Planner and Scheduler β: All values are standardized regression coefficients Significance: * p < .05, ** p < .01, *** p < .001
187
Table 28b Significant Interaction Relationships Between Implementation Status of ERP Modules and Changes in Performance _____________________________________________________________________________________________________________________
Implementation Changes in Performance Status ____________________________________________________________________________________________________________ X CSFs Inventory Management Information Quality On-Time Delivery Standardization Profitability β ∆R² ∆F β ∆R² ∆F β ∆R² ∆F β ∆R² ∆F β ∆R² ∆F
Alignment X CO .701* .016 3.876* PP .694* .017 4.004 * .841* .026 6.032* .740 .020 4.797* HR .848* .025 5.685* Consultants X
FI -.708* .030 6.690* -.702* .030 6.204* CO -.696* .029 6.198* MM - 675* .021 4.407* SD -.785* .035 7.296* QM -.655* .020 4.379* -.642* .020 4.292* HR -.590* .019 3.932* -.677* .025 5.494* Implementation Team X FI .987* .023 5.308* .916* .020 4.921* 1.227* .027 6.374* CO 1.265* .029 6.654* 1.160* .024 6.174* .950* .022 5.049* PP 1.002* .024 5.543* 1.059* .027 6.673* . 919* .023 5.259* SD .824* .018 4.450* QM -1.068* .019 4.633* Communication X
FI 1.646* .047 10.588* CO 1.119* .020 4.448* PP 1.086* .019 3.935* 1.565* .039 8.703* SD 1.379* .028 6.113* Organizational Culture X FI 1.001*** .040 11.701*** CO .794** .026 7.595** MM .930** .033 9.695** PP .673* .020 5.904* SD .823** .028 7.994** QM -.632* .016 4.031* HR .582* .015 4.335* SCM .692* .017 4.912* National Culture X FI -.692* .019 4.026* -.916** .033 7.390** CO -.772* .027 5.795* -.701* .022 4.764* -.867** .034 7.695** PS -.848*** .049 10.558*** -.524* .019 4.020* MM -.885* .029 6.518* PP -.680* .020 4.44* -1.214***.063 14.772*** SD -.792* .025 5.482* QM -.759* .026 5.912* ____________________________________________________________________________________________________________________
Note Modules: FI – Financials, CO – Controlling, PM – Plant Maintenance, MM – Materials Management, PP – Production Planning, SD – Sales and Distribution, GL – General Logistics, QM – Quality Management, HR – Human Resources, SCM – Supply Chain Management, CRM – Customer Relationship Management, APO/APS – Advance Planner and Optimizer/Advance Planner and Scheduler β: All values are standardized regression coefficients Significance: * p < .05, ** p < .01, *** p < .001
188
Table 28c Significant Interaction Relationships Between Implementation Status of ERP Modules and Changes in Performance _____________________________________________________________________________________________________________________
Implementation Changes in Performance Status ____________________________________________________________________________________________________________ X CSFs Return on Investment Information Availability User Satisfaction Customer Satisfaction Competitive Advantage β ∆R² ∆F β ∆R² ∆F β ∆R² ∆F β ∆R² ∆F β ∆R² ∆F ___________________________________________________________________________________________________________ _____________________________________________________________________________________________________________________ Top Management X PP .656 * .018 4.081 * HR 1.094*** .055 13.919 *** .888 * .036 8.394 * Planning X SCM 1.114** .031 7.740** 1.014** .026 7.362** APO/APS User Support X FI .833** .027 7.285** .687* .018 4.476* MM .652* .015 4.205* PP .676* .018 4.408* .170** .001 .312** SD .672* .019 5.024* .652* .018 4.273* QM -1.023** .026 7.352** HR .639* .018 4.631* SCM 1.336** .036 8.779** Project Management X FI .932** .033 8.531** .784* .023 5.789* SD .832* .022 5.526* HR . 1.011** .037 9.351** SCM 1..334***.052 13.327*** Training X FI .626* .022 5.237* HR .708* .022 5.192* .955* .040 9.418* .607* .016 3.929* SCM -.628* .017 4.251* Learning X LO .670* .017 4.449* QM -.598* .014 3.878* SCM .773* .022 4.943*
Alignment X LO -.651* .014 4.079* QM -.849* .020 6.280* SCM .670* .019 5.034* APO/APS -1.087* .020 6.245* ____________________________________________________________________________________________________________________
Note Modules: FI – Financials, CO – Controlling, PM – Plant Maintenance, MM – Materials Management, PP – Production Planning, SD – Sales and Distribution, GL – General Logistics, QM – Quality Management, HR – Human Resources, SCM – Supply Chain Management, CRM – Customer Relationship Management, APO/APS – Advance Planner and Optimizer/Advance Planner and Scheduler β: All values are standardized regression coefficients Significance: * p < .05, ** p < .01, *** p < .001
189
Table 28d Significant Interaction Relationships Between Implementation Status of ERP Modules and Changes in Performance _____________________________________________________________________________________________________________________
Implementation Changes in Performance Status ____________________________________________________________________________________________________________ X CSFs Return on Investment Information Availability User Satisfaction Customer Satisfaction Competitive Advantage β ∆R² ∆F β ∆R² ∆F β ∆R² ∆F β ∆R² ∆F β ∆R² ∆F ___________________________________________________________________________________________________________ _____________________________________________________________________________________________________________________ Consultants X FI -.629* .024 5.196* -.630* .024 5.214* -.903* .049 10.976* CO .588* .021 4.595* MM -.851* .034 7.656* -.640* .019 3.982* -.964* .043 9.496* PP -.679* .029 6.529* PS -.871* .020 4.289* SD -.643* .023 5.083*` -1.011* .057 12.886* QM -.805* .032 7.127* HR .651* .023 4.809* SCM -.569* .020 3.986* Implementation Team X CO .960* .017 4.294* QM -.996* .016 3.982* APO/APS 1.667* .017 4.410* Data Accuracy X MM -.965* .019 4.538* SCM -.878* .018 4.450* -.835* .016 3.910* -1.261* .037 8.859* -.939* -.021 4.856* APO/APS -.665* .020 5.000* -.751* .026 6.245* -.782* .028 7.000* - .761* .026 6.154* Communication X EC -1.602* .023 5.535* Organizational Culture X MM .646* .016 4.038* LO .708* .019 4.705* HR .621* .017 4.634* .813** .030 7.092** SCM .871* .028 6.483* National Culture X FI -1.018** .040 8.771** -.951** .035 8.308** .785* .024 5.522* CO -.656* .019 4.284* MM .973** .035 7.593** -.950** .034 7.858** -.770* .022 4.929* PP -.753* .024 5.161* -.726* .023 5.246* SCM -.707* .018 3.903* ____________________________________________________________________________________________________________________
Note Modules: FI – Financials, CO – Controlling, PM – Plant Maintenance, MM – Materials Management, PP – Production Planning, SD – Sales and Distribution, GL – General Logistics, QM – Quality Management, HR – Human Resources, SCM – Supply Chain Management, CRM – Customer Relationship Management, APO/APS – Advance Planner and Optimizer/Advance Planner and Scheduler β: All values are standardized regression coefficients Significance: * p < .05, ** p < .01, *** p < .001
The results presented in the tables show the size of the standardized regression
coefficients (β), the changes in the coefficients of determination (∆R²), and the changes in F
ratios (∆F) for the fitted models. Only significant parameter estimates of the fitted models are
190
shown. All non-significant parameter estimates are omitted from the tables. The tables further
indicate that both positive as well as negative interactional effects on performance are present.
The positive relationships in the tables indicate that the interactional relationships have a
beneficial impact on performance; whereas negative relationships demonstrate an adverse impact
on performance.
The results in Tables 28a and 28c indicate that the regression coefficient for the
interactive effect of the human resources module and the top management CSF on ROI (+1.094)
has the greatest magnitude and highest significance among all the models involving the
moderating effect of this CSF. There are interaction effects present between the top management
CSF and sales and distribution module on information quality and profitability. Also, interaction
effects are present between the top management CSF and the production planning module on
information availability. The E-commerce module shows a negative interactive effect with the
top management CSF on inventory management.
A perusal of the interaction effects of the planning CSF on various modules in Tables 28a
and 28c reveals that the APO/APS module has the greatest magnitude effect on profitability
(+1.430). The planning CSF also interacts with the controlling, sales and distribution, and the
SCM modules to cause changes in profitability. The planning CSF further interacts with the
SCM module to increase information availability and user satisfaction. There are negative
interactions between the planning CSF and the production planning and the quality management
modules on on-time delivery.
Five of the ERP system modules – financials, materials management, sales and
distribution, SCM, CRM – in Tables 28a and 28c indicate significant interactive effects with the
user support CSF on profitability. The regression coefficient for the interactive effect of the user
191
support CSF and the CRM module has the highest magnitude on profitability (-1.426) among all
the models involving the moderating effect of this CSF. There are interaction relationships
present between the user support CSF and four ERP system modules – financials, materials
management, sales and distribution, and human resources modules – and ROI. The user support
CSF interacts with four ERP system modules – financials, production planning, sales and
distribution, SCM – to affect information availability. The user support CSF further interacts
with four ERP system modules – financials, materials management, production planning, sales
and distribution – to impact information quality. There are also interactions present between the
user support CSF and two ERP system modules on inventory management, and one ERP system
module on user satisfaction and competitive advantage. There is also a negative interaction
present between the quality management module and the user CSF on on-time delivery.
The results in Tables 28a and 28c indicate that the regression coefficient for the
interactive effect of the SCM module and the project management CSF on information
availability (+1.334) has the greatest magnitude and highest significance among all the models
involving the moderating effect of this CSF. Three other ERP system modules – financials, sales
and distribution, human resources – interact with the project management CSF to affect changes
in information availability. Interactive relationships between the project management CSF and
various ERP system modules also impact inventory management, information quality, on-time
delivery, profitability, and ROI.
Four of the ERP system modules – financials, production planning, sales and distribution,
human resources – in Tables 28a and 28c interact with the training CSF to impact the
profitability measure. The regression coefficient for the interactive effect of the project system
module and the training CSF on information quality has the highest magnitude (+1.033) among
192
all the models involving the moderating effect of this CSF. The training CSF interacts negatively
with the SCM module to impact information quality. Interaction relationships between the
training CSF and three ERP system modules – financials, sales and distribution, human resources
– affect inventory management. There are also interactions present between the training CSF and
various ERP system modules on on-time delivery, ROI, customer satisfaction, and information
availability.
Tables 28a and 28c indicate significant interaction effects between the learning CSF and
three ERP system modules – financials, controlling, sales and distribution – on profitability. The
regression coefficient for the interactive effect of the learning CSF and the SCM module on user
satisfaction (+.773) has the highest magnitude among all the models involving the moderating
effect of this CSF. Interaction relationships are present between the learning CSF and various
ERP system modules on information quality, customer satisfaction, and competitive advantage.
Three ERP system modules – materials management, SCM, APO/APS – and the data
accuracy CSF in Tables 28a and 28d negatively impact information availability. The regression
coefficient for the interactive effect of the data accuracy CSF and the SCM module on customer
satisfaction has the highest magnitude (-1.261) among all the models involving the moderating
effect of this CSF. The APO/AP module also interacts with the data accuracy CSF to adversely
affect customer satisfaction. Negative interaction relationships are present between the data
accuracy CSF and the SCM and APO/ASP modules on ROI, and the SCM module on
information quality and competitive advantage.
In tables 28b and 28c significant interactions are present between the alignment CSF and
the controlling and production planning modules on profitability. The regression coefficient for
the interactive effect of the alignment CSF and the APO/APS module on user satisfaction has the
193
highest magnitude (-1.087) among all the models involving the moderating effect of this CSF.
The alignment CSF interacts with the general logistics and the quality management modules to
negatively impact ROI. Interaction relationships are also present between the alignment CSF and
various ERP system modules on information quality and information availability.
Tables 28b and 28d indicate the presence of significant negative interactions between five
ERP system modules – financials, controlling, materials management, sales and distribution,
quality management – and the consultants CSF on profitability. There are negative interaction
relationships indicated between 4 ERP system modules – financials, controlling, materials
management, production planning, sales and distribution – and the consultants CSF on
competitive advantage. Negative interaction relationships are also present between various ERP
system modules and the consultants CSF on standardization and customer satisfaction. The
regression coefficient for the interaction effect of the consultants CSF and the human resource
and the controlling modules on information availability and competitive advantage respectively
are the only positive effects among all the interaction models involving this CSF.
The regression coefficient for the interactive effect of the APO/APS module and the
implementation team CSF on information availability, in Tables 28b and 28d, has the greatest
magnitude (+1.667) among all the models involving the moderating effect of this CSF. Four ERP
system modules – financials, controlling, production planning, sales and distribution - interact
with the implementation team CSF to affect information quality. There are also significant
interactions present between three ERP modules – financials, controlling, production planning –
and the implementation team CSF on inventory management and profitability. The
implementation team CSF negatively interacts with the quality management module to affect on-
time delivery and competitive advantage.
194
Tables 28b and 28d show that four ERP system modules – financials, controlling,
production planning, sales and distribution – interact with the communication CSF to impact
information quality. The regression coefficient for the interaction effect of the communication
CSF and the financials module on information quality has the highest magnitude (+1.646) among
all the models involving the moderating effect of this CSF. The communication CSF also
interacts with the production planning module to cause changes in inventory management. The
tables also indicate that the interaction between the communication CSF and the E-commerce
module negatively impacts information availability.
A perusal of the interactive effects of the organizational culture CSF on seven ERP
system modules, in Tables 28b and 28d, reveals that the financials module has the greatest
magnitude and the highest significance effect on profitability (+1.001). The other six ERP
system modules that interact with the organizational culture CSF to impact profitability are the
controlling, materials management, production planning, sales and distribution, human resources,
and SCM modules. Interaction relationships are present between the organizational culture CSF
and two ERP system modules on information availability and customer satisfaction. There is also
a negative interaction between the organizational culture CSF and the quality management
module on on-time delivery.
The results in Tables 28b and 28d indicate that there are significant interactions between
six ERP system modules – financials, controlling, materials management, production planning,
sales and distribution, quality management – and the national culture CSF on standardization. All
these interactions are, however, negative suggesting that increase in national culture CSF
elements adversely affects the standardization of the firms’ processes. The regression coefficient
for the interactive effect of the national culture CSF and the production planning module on
195
standardization has the highest magnitude (-1.214) and significance effect among all the models
involving the moderating effect of this CSF. Negative interaction relationships are present
between four ERP system modules and the national culture CSF on on-time delivery and user
satisfaction. There are also negative interactions between various ERP system modules and the
national culture CSF on information availability, customer satisfaction, and inventory
management.
A synthesis of the discussion pertaining to the results presented in Tables 28a to 28d
reveals partial support for hypothesis 2a. Most CSFs had positive interaction effects with various
ERP system modules to affect performance. Negative interaction effects with most ERP system
modules were reported mainly for the consultants and the national culture CSFs besides a few
others. The results thus indicate that different CSFs interact with different ERP system modules
to change the form of the relationship between the implementation status of individual ERP
system modules and various changes in performance. To further understand the moderator
relationships in hypothesis 2a, the three key model variables - implementation status,
performance, CSFs - were dichotomized as “low” and “high.” The “low” category for each of the
three variables comprised of frequency percentile values less than 33.33% and the “high”
category greater than 66.67%. A test for hypotheses 2a was conducted using univariate ANOVA
and examining the results for the joint effects of each of the 14 ERP modules and each of the 13
CSFs on the 10 performance measures. As a representation of the overall results, the analyses for
ROI and competitive advantage are shown in Table 29.
A synthesis of the results from the descriptive statistics and regression analyses indicate
that firms scored relatively high on ROI and relatively low on competitive advantage. Also,
significant differences in performance were obtained for the interaction effects of the planning
196
and the alignment CSFs and various ERP system modules on ROI and competitive advantage. A
perusal of the table indicates that the interaction relationship between the planning CSF and the
EC commerce module on ROI had the highest magnitude (+1.242) and significance among all
the models involving this CSF. Also, the interaction relationship between the alignment CSF and
the SCM module on competitive advantage had the highest magnitude (+2.301) and significance
among all the models involving this CSF. The least interaction effects in terms of magnitude and
significance were reported between the planning CSF and the plant maintenance module for
ROI, and the alignment CSF and the financials module for competitive advantage. The
interaction plots of the Table 29 results are shown in Figures 7a, 7b, and 8.
Table 29 Significant Interaction Relationships Between Implementation Status of ERP Modules and Changes in Performance (ANOVA) ___________________________________________________________________________________________________________________ Implementation Changes in Performance Status of __________________________________________________________________________________________________________ ERP Modules Return on Investment Competitive Advantage X CSFs SS MS F SS MS F
(df 1,166) _________________________________________________________________________________________________________________ Note Modules: FI – Financials, CO – Controlling, PM – Plant Maintenance, MM – Materials Management, PP – Production Planning, SD – Sales and Distribution, GL – General Logistics, QM – Quality Management, HR – Human Resources, SCM – Supply Chain Management, CRM – Customer Relationship Management, APO/APS – Advance Planner and Optimizer/Advance Planner and Scheduler Significance: * p < .05, ** p < .01, *** p < .001
197
Figure 7a. Interaction Effects Between Implementation Status of Various ERP Modules, Planning CSF, and ROI.
1.00 2.00Implementation Status - Plant Maintenance
Module
1.30
1.40
1.50
1.60
1.70
1.80
1.90
Perfor
man
ce - R
etur
n on
Inve
stm
ent
CSF - Planning1.002.00
Estimated Marginal Means
1.00 2.00Implementation Status - Sales & Distribution
Module
1.30
1.40
1.50
1.60
1.70
1.80
1.90
Perfor
man
ce - Ret
urn on
Inve
stmen
t
CSF - Planning1.002.00
Estimated Marginal Means
1.00 2.00Implementation Status - Financials Module
1.30
1.40
1.50
1.60
1.70
1.80
1.90
Perfor
man
ce - R
etur
n on
Inve
stm
ent
Estimated Marginal Means
CSF - Planning1.002.00
198
Figure 7b. Interaction Effects Between Implementation Status of various ERP Modules, Planning CSF, and ROI.
1.00 2.00Implementation Status - E-commerce Module
1.00
1.20
1.40
1.60
1.80
Per
form
ance
- R
etur
n on
Inve
stmen
t
CSF - Planning1.002.00
Estimated Marginal Means
1.00 2.00Implementation Status - APO/APS Module
1.20
1.40
1.60
1.80
Per
form
ance
- R
etur
n on
Inve
stmen
t
CSF - Planning1.002.00
Estimated Marginal Means
1.00 2.00Implementation Status - Materials Management
Module
1.30
1.40
1.50
1.60
1.70
1.80
1.90
Per
form
ance
- R
etur
n on
Inve
stmen
t
CSF - Planning1.002.00
Estimated Marginal Means
199
The interaction plots of the Table 29 results in Figures 7a and 7b – implementation status
of various ERP modules, planning CSF, ROI – indicate that firms, which focus on the planning
CSF during the low implementation status of the plant maintenance, sales and distribution,
financials, and the materials management modules, obtain increases in ROI. As the
implementation status of these four modules increases, firms that continue to focus on the
planning CSF obtain greater increases in their ROI. Figures 7a and 7b further indicate that firms
that do not focus on the planning CSF during the low implementation status of the E-Commerce
and the APO/APS modules experience a decline in their ROI. The ROI increases as firms pay
attention to the planning CSFs at higher implementation statuses of these two modules. The
interaction plots of the Table 29 results – implementation status of various ERP modules,
alignment CSF, competitive advantage – are shown in Figure 8.
The interaction plots in Figure 8 indicate that firms obtain increases in competitive
advantage when they focus on the alignment CSF during the low implementation status of the
sales and distribution module; however, the interaction between the alignment CSF and the low
implementation status of the financials module results in decrease in competitive advantage. As
the implementation status of the sales and distribution and the financials modules increases,
firms that continue to focus on the alignment CSF obtain greater increases in competitive
advantage. The figure further indicates that firms which do not focus on the alignment CSF
during the low implementation status of the SCM and the E-Commerce modules experience a
decline in their competitive advantage. Competitive advantage increases as firms pay attention to
the alignment CSFs at higher implementation statuses. The interpretations of these results are
discussed in detail in chapter 5.
200
Figure 8. Interaction Effects Between Implementation Status of Various ERP Modules, Alignment CSF, and Competitive Advantage.
A test for hypothesis 2b – CSFs moderate the relationship between the implementation
status of a holistic ERP system and changes in performance – was conducted by running
standard linear regression analyses and developing regression models to analyze the moderator
effects of each of the 13 CSF measures. Summated scales were used for assessing the holistic
implementation status of ERP system as well as each of the 13 CSFs. The results of the
regression analysis are presented in Table 30. The tables show the size of the standardized
regression coefficients (β), the changes in the coefficients of determination (∆R²), and the
1.00 2.00Implementation Status - Financials Module
1.10
1.20
1.30
1.40
1.50
1.60
1.70
Perfor
man
ce - C
ompe
titive Adv
antage
CSF - Alignment1.002.00
Estimated Marginal Means
1.00 2.00Implementation Status - Sales & Distribution
Module
1.20
1.30
1.40
1.50
1.60
1.70
1.80
Perfor
man
ce - C
ompe
titive Adv
antage
CSF - Alignment1.002.00
Estimated Marginal Means
1.00 2.00Implementation Status - SCM Module
1.20
1.40
1.60
1.80
Perfor
man
ce - C
ompe
titive Adv
antage
CSF - Alignment1.002.00
Estimated Marginal Means
1.00 2.00Implementation Status - E-Commerce Module
1.00
1.20
1.40
1.60
1.80
Perfor
man
ce - C
ompe
titive Adv
antage
CSF - Alignment1.002.00
Estimated Marginal Means
201
changes in F ratios (∆F) for the fitted models. Only significant parameter estimates of the fitted
models are shown. All non-significant parameter estimates are omitted from the tables.
Table 30 Significant Interaction Relationships Between Holistic Implementation Status of ERP System and Changes in Performance ______________________________________________________________________________ Holistic Changes in Performance Implementation _______________________________________________________________________________________________________ Status of ERP Inventory Information On-Time Delivery Standardization Profitability System x CSFs Management Quality
______________________________________________________________________________ Note β : All values are standardized regression coefficients Significance: * p < .05, ** p < .01, *** p < .001
The results in Table 30 indicate that there are interaction effects between the holistic
implementation status of the ERP system and eight of the CSFs for various performance
202
measures. The regression coefficient for the interactive effect of the implementation status of the
holistic ERP system and the communication CSF on the changes in on-time delivery (+1.457)
has the greatest magnitude among all the models. The results further indicate that interaction
effects are present between the holistic implementation status of the ERP system and the
planning, user support, learning, implementation team, and the organizational culture CSFs, on
profitability. The implementation team CSF also interacts with the holistic ERP system
implementation status to affect information quality. The interactions for the consultants CSF and
the holistic ERP system implementation status are negative for profitability and ROI. Also, the
interactions for the national culture CSF and the holistic ERP system implementation status are
negative for six performance measures. These negative interactions indicate that firms which
focus on the consultants and the national culture CSFs experience a decrease in firm performance
on various measures.
A synthesis of the discussion pertaining to the above results reveals partial support for
hypothesis 2b. Similar to the results obtained from testing hypothesis 2a, the consultants and the
national culture CSFs interact negatively with the holistic ERP implementations status scale to
affect performance. The results overall indicate that different CSFs interact with the holistic ERP
implementation status to change the form of the relationship between the holistic ERP
implementation status and various changes in performance.
To further understand the moderator relationships in hypothesis 2b the three key model
variables - implementation status, performance, CSFs - were dichotomized as “low” and “high.”
The “low” category for each of the three variables comprised of frequency percentile values less
than 33.33% and the “high” category greater than 66.67%. A test for hypothesis 2b was
conducted by running univariate ANOVA and examining the interaction results of the holistic
203
ERP system implementation status and each of the 13 CSFs on the 10 performance measures. As
a representation of the overall results, the analyses for the interaction effects of the planning and
the alignment CSFs on the ROI and competitive advantage measures respectively are shown in
Table 31.
Table 31 Significant Interaction Relationships Between Holistic Implementation Status of ERP System and Changes in Performance (ANOVA) ___________________________________________________________________________________________________________________
Implementation Changes in Performance Status of __________________________________________________________________________________________________________ ERP System Return on Investment Competitive Advantage X CSFs SS MS F SS MS F
Planning .805 .805 4.225* (1,107) Alignment 1.602 1.602 8.880** (1,111) ___________________________________________________________________________________________________________________ Note β: All values are standardized regression coefficients Significance: * p < .05, ** p < .01, *** p < .001
A synthesis of the results from the descriptive statistics and regression analyses indicate
that firms have scored relatively high on the ROI measure and relatively low on the competitive
advantage measure. The planning and the alignment CSFs were chosen as there were significant
differences in performance measures obtained for the interaction effects of these 2 CSFs and
various ERP system modules on ROI and competitive advantage. The interaction plots for the
planning and the alignment CSFs with the holistic ERP system implementation status for ROI
and competitive advantage respectively are shown in figure 9.
The plots in Figure 9 indicate that firms which focus on the planning CSF during the low
implementation status of the holistic ERP system obtain increases in performance. As the holistic
implementation status of the ERP system increases, firms that continue to focus on the planning
CSF obtain greater increases in performance. The interaction plot of the alignment CSF with the
204
holistic ERP implementation status on competitive advantage demonstrates that firms that focus
on the alignment CSF through the deployment process obtain large increases in performance. In
contrast, the alignment CSF does not play an important role during low ERP holistic
implementation statuses. The interpretation of these results is discussed in chapter 5.
Figure 9. Interaction Effects Between Holistic Implementation Status of ERP System and Planning and Alignment CSFs, on ROI and Competitive Advantage.
To further understand the impact of CSFs on the relationships revealed in Tables 26 and
27, a test of the hypothesis 2b was conducted for the 12 module holistic ERP system and the two
13 module ERP systems (excluding the e-commerce and project system modules, respectively)
2.001.00
Holistic Implementation Status
2.00
1.90
1.80
1.70
1.60
1.50
1.40
1.30
Perfo
rman
ce - R
OI
2.001.00
CSF - Planning
Estimated Marginal Means
2.001.00
Holistic Implementation Status
1.80
1.60
1.40
1.20
1.00
Perfo
rman
ce - C
ompe
titive
Adv
antag
e 2.001.00
CSF - Alignment
Estimated Marginal Means
205
and the results are given in Tables 32a to 32c. A comparison of the results presented in Tables 30
and 32a reveals that CSF interactions for the 12 module holistic ERP system produce
improvements in six performance measures. The results further show a decrease in six
performance measures; three additional CSF interactions were revealed and three existing CSF
interactions were omitted.
Table 32a Significant Interaction Relationships Between Different Holistic Implementation Statuses of ERP System and Changes in Performance ______________________________________________________________________________ Holistic Changes in Performance Implementation _______________________________________________________________________________________________________ Status of ERP Inventory Information On-Time Delivery Standardization Profitability System^ X Management Quality CSFs β ∆R² ∆F β ∆R² ∆F β ∆R² ∆F β ∆R² ∆F β ∆R² ∆F _______________________________________________________________________________________________________ _____________________________________________________________________________________________________________________ Planning .859* .021 5.535* User Support .901* .022 6.212* Learning .691* .017 4.502* Consultants -.798** .033 7.174** Implementation 1.007* .018 4.426* 1.125* .022 5.302* Team Communication 1.525* .028 6.325* Organizational .842* .027 8.117** Culture National Culture -.785* .023 5.119* -1.167***.051 12.002*** ______________________________________________________________________________ ______________________________________________________________________________ Holistic Changes in Performance Implementation _______________________________________________________________________________________________________ Status of ERP Return on Information User Satisfaction Customer Competitive System ^ X Investment Availability Satisfaction Advantage CSFs β ∆R² ∆F β ∆R² ∆F β ∆R² ∆F β ∆R² ∆F β ∆R² ∆F _______________________________________________________________________________________________________ _____________________________________________________________________________________________________________________ Top .767* .015 3.917* Management Consultants -.650* .022 5.037* -.981* .050 11.507* National -.924** .032 7.000** -.866* .028 6.644* Culture ______________________________________________________________________________ Note ^ - 12 module holistic ERP system (excluding project system and e-commerce) β : All values are standardized regression coefficients Significance: * p < .05, ** p < .01, *** p < .001
206
A comparison of the results presented in Tables 30 and 32b reveals that various CSFs
interact with the 13 module holistic ERP system excluding the e-commerce module to produce
improvements in nine performance measures. The results further indicate a decrease in four
performance measures; two additional CSF interactions were revealed and three existing CSF
interactions were omitted.
Table 32b Significant Interaction Relationships Between Different Holistic Implementation Statuses of ERP System and Changes in Performance ______________________________________________________________________________ Holistic Changes in Performance Implementation _______________________________________________________________________________________________________ Status of ERP Inventory Information On-Time Delivery Standardization Profitability System ^ X Management Quality CSFs β ∆R² ∆F β ∆R² ∆F β ∆R² ∆F β ∆R² ∆F β ∆R² ∆F _______________________________________________________________________________________________________ _____________________________________________________________________________________________________________________ Planning .878* .021 5.566* User Support .892* .022 6.085* Learning .697* .016 4.358* Consultants -.847** .035 7.731** Implementation 1.044** .019 4.715** 1.070* .020 4.737* Team Communication 1.457* .028 6.224* Organizational .811** .026 7.773** Culture National Culture -.752* .022 4.902* -.818* .026 5.823* -1.109*** .048 11.295*** ______________________________________________________________________________ ______________________________________________________________________________ Holistic Changes in Performance Implementation _______________________________________________________________________________________________________ Status of ERP Return on Information User Satisfaction Customer Competitive System ^ X Investment Availability Satisfaction Advantage CSFs β ∆R² ∆F β ∆R² ∆F β ∆R² ∆F β ∆R² ∆F β ∆R² ∆F CSFs _______________________________________________________________________________________________________ _____________________________________________________________________________________________________________________ Consultants -.648* .021 4.784* -1.028*** .052 12.084*** National -.891** .031 6.783** -.814* .026 6.108* -.657* .017 3.884* Culture ______________________________________________________________________________ Note ^ - 13 module holistic ERP system (excluding e-commerce) β : All values are standardized regression coefficients Significance: * p < .05, ** p < .01, *** p < .001
207
A comparison of the results presented in Tables 32a and 32b reveals that CSF interactions
for the 13 module holistic ERP system excluding the e-commerce module produce improvements
in seven performance measures. The results further show a decrease in seven performance
measures; two additional CSF interactions surfaced and one existing CSF interaction was
omitted.
Table 32c Significant Interaction Relationships Between Different Holistic Implementation Statuses of ERP System and Changes in Performance ______________________________________________________________________________ Holistic Changes in Performance Implementation _______________________________________________________________________________________________________ Status of ERP Inventory Information On-Time Delivery Standardization Profitability System ^ X Management Quality CSFs β ∆R² ∆F β ∆R² ∆F β ∆R² ∆F β ∆R² ∆F β ∆R² ∆F _______________________________________________________________________________________________________ _____________________________________________________________________________________________________________________ Planning .871* .022 5.577* User Support .882* .021 5.824* Learning .699* .017 4.527* Consultants -.819** .034 7.384** Implementation 1.007* .017 4.285* 1.115* .021 5.036* Team Communication 1.522* .027 6.108* Organizational .811** .025 7.495** Culture National Culture -.782* .023 4 .962* -.186*** .052 12.161*** _____________________________________________________________________________________ ______________________________________________________________________________ Holistic Changes in Performance Implementation _______________________________________________________________________________________________________ Status of ERP Return on Information User Satisfaction Customer Competitive System ^ X Investment Availability Satisfaction Advantage CSFs β ∆R² ∆F β ∆R² ∆F β ∆R² ∆F β ∆R² ∆F β ∆R² ∆F CSFs _______________________________________________________________________________________________________ _____________________________________________________________________________________________________________________ Top .776* .016 3.988* Management Consultants -.665* .022 5.130* -.987*** .049 11.364*** National -.931** .032 6.960** -.834* .026 6.000* Culture ______________________________________________________________________________ Note ^ - 13 module holistic ERP system (excluding project system) β : All values are standardized regression coefficients Significance: * p < .05, ** p < .01, *** p < .001
208
A comparison of the results presented in Tables 30 and 32c shows that CSF interactions
for the 13 module holistic ERP system excluding the project system module produce
improvements in six performance measures. The results further indicate a decrease in six
performance measures; three additional CSF interactions were revealed and three existing CSF
interactions were omitted. The results in Tables 32a and 32c indicate that CSF interactions for
the 13 module holistic ERP system excluding the project system module produce improvements
in six performance measures. The results further reveal a decrease in eight performance
measures. A comparison of the results in Tables 32b and 32c indicates that the 13 module
holistic ERP system excluding the project system module results in improvements in seven
performance measures. There were also decreases in six performance measures; one additional
CSF interaction was revealed and two existing CSF interactions were omitted.
A synthesis of the results presented in Tables 30, and 32a to 32c, and the ensuing
discussions indicate that a 13 module holistic ERP system excluding the e-commerce module
interacts with various CSFs to produce higher benefits when compared to the 14 module ERP
system. Among the two 13 module holistic ERP systems, however, the 13 module system
excluding the project system module provides greater benefits. The results further suggest that
the 12 module and the 13 module system excluding the e-commerce module broadly provide
similar benefits to firms; the 13 module holistic ERP system excluding the project system
module, however, results in deceased benefits when compared to the 12 module system.
A test of the hypothesis 2b using the four holistic ERP implementation status scales and a
summated scale as a measure of the overall performance was conducted and the results are
shown in Table 33. Analysis of the table reveals partial support for the interactional CSF effects
of the 13 module holistic ERP system excluding the project system module for national culture,
209
and the 12 module holistic ERP system for consultants. The interpretations of these findings are
discussed in chapter 5.
Table 33 Significant Interaction Relationships Between Different Holistic Implementation Statuses of ERP System and Overall Change in Performance ________________________________________________________________________________________________________________ Implementation Status Overall Change in Performance of ERP System (10 Performance Measures) β R² F ________________________________________________________________________________________________________________ Holistic Implementation Status (14 modules) X Consultants -.752* .027 6.226* National Culture -.740* .021 5.183* Holistic Implementation Status (12 modules excluding project system and e-commerce) X Consultants -.707* .026 5.909* National Culture -.743* .021 5.130* Holistic Implementation Status (13 modules excluding e-commerce) X Consultants -.732* .026 6.058* National Culture -.757* .023 5.577* Holistic Implementation Status (13 modules (excluding project system) X Consultants -.727* .027 6.100* National Culture -.721* .019 4.707* ______________________________________________________________________________ Note β : All values are standardized regression coefficients Significance: * p < .05, ** p < .01, *** p < .001
Additional Analyses
Most ERP researchers report results of analyses conducted at the individual module and
the performance level. There is a paucity of studies that examine ERP system issues either at the
module or performance category levels. To investigate the hypothesized relationships in this
study at the category levels, the data for the key variables in the study – ERP implementation
status, performance, CSFs – were factor analyzed and the results are discussed in the first part of
this section. The data were subject to regression analyses and the results are discussed in the next
part of this section.
210
The 14 modules forming part of the ERP system were first factor analyzed. Based on a
priori criterion the number of factors to be extracted was entered as two in the SPSS 12.0
program. As discussed in chapter 2, ERP research indicates that firms typically implement
modules that first address key intra-firm activities such as finance, logistics, and human
resources (Hernandez, 1998; Appelrath & Ritter, 2000). Firms, after stabilizing their internal
ERP deployments then extend their implementations to include inter-firm activities with the
addition of modules such as SCM, CRM, E-Commerce, and APO/APS (Miller, 1999; Ayers,
2001; Tyler, 2002; Yen et al., 2002). The above suggests that factor analysis of the 14 modules
forming part of the ERP system should result in two factors, factor one comprising of intra-firm
modules and factor two inter-firm modules.
Visual inspection of the correlation matrix of the 14 modules revealed that most
correlations were greater than 0.30 and the correlations in the anti-image correlation matrix were
small. The measure of sampling adequacy was meritorious at 0.862 and the Bartlett’s test of
sphericity was significant. Hence, the data are appropriate for conducting factor analysis. The 14
modules forming part of the ERP system were factor analyzed using a varimax rotation. The total
variance extracted by the two factors was 50.31%. Table 34 indicates that 10 modules loaded
onto factor one and the remaining four modules onto factor two. As per the a priori criterion,
factor one (intra-firm module sub-system) consists of modules that firms implement to address
intra-firm activities and factor two (inter-firm module sub-system) comprises of modules that
firms deploy to address inter-firm activities. The factor loadings for the 10 modules in the intra-
firm module sub-system range from 0.384 to 0.902 and those for the four modules in the inter-
firm module sub-system from .583 to .710. Hair et al. (1998) and Nunnally and Bernstein (1994)
211
recommend consideration of factor loadings of 0.30 and above as the minimum acceptable level
and the results of the factor analysis of the 14 ERP system modules satisfies this criteria.
A perusal of the reliability analysis results for each of the CSF scales indicates that
removal of items with low factor loadings did not result in any significant improvement of scale
216
reliabilities and hence no items were deleted based on this criterion. The factor analysis results
presented in Table 37 indicate that a few items loaded onto the CSFs different from those
conceptualized in the questionnaire. A brief description of each of the factors obtained from the
factor analysis is given below. Factor 1 – top management support – consists of top management
CSF items 15-1a to 15-1f and also includes two user support CSF items: 15-3a “employees
understand how they fit into the new ERP defined processes” and 15-3e “management actively
ensures user participation and involvement to foster user support for the ERP system.” Stratman
and Roth (2002) indicate that top management plays a vital role in implementing change
strategies to cope with the operational changes resulting from the deployment of ERP systems.
This suggests that items 15-3a and 15-3e reflect top management’s support in ensuring that users
seamlessly transition into the ERP work environment and hence can be considered as part of the
top management factor.
Factor 2 – training – consists of training CSF items 15-5a to 15-5e and also includes a
learning CSF item 15-6a “benchmarking is used to identify cutting-edge ERP techniques.”
Stratman and Roth (2002) indicate that learning activities can be designed so that the firm is able
to identify cutting-edge techniques from internal sources. This suggests that benchmarking forms
an integral part of a firm’s ERP training program and hence provides support for inclusion of
item 15-6a as part of the training factor. Factor 3 – project management – consists of the project
management CSF items 15-4a to 15-4e as well as a learning CSF item 15-6b “cross-functional
groups meet regularly to discuss new uses for the ERP system” from the learning CSF. Stratman
and Roth (2002) indicate that ERP project management activities include ongoing and
continuous incremental improvement initiatives. This suggests that the item 15-6b can be
construed as falling under the project management factor.
217
Factor 4 – culture – consists of three organizational culture CSF items 15-13f, 15-13d,
15-13e; two national culture CSF items 15-14a, 15-14b; and one planning CSF item 15-2a. Item
15-14a concerns the national culture dimension of power distance and measures whether the
ERP system facilitates business unit supervision of employees. This item thus has a close bearing
on item 15-13d which measures the degree of control within a business unit. Power distance to a
large extent determines the parochial versus the professional nature of employee behavior
(measured by 15-13f) as well as the pragmatic versus normative behavior of the business unit
(measured by 15-13e). The planning item 15-2a measures the flexibility of the business unit to
constantly align their ERP system capabilities to their business goals. This business unit
flexibility depends on whether employees are given the autonomy to respond to changing
business conditions and is measured by item 15-14b. A synthesis of the above discussion
indicates that factor 4 can be broadly construed as a culture factor representing the overall
culture of the business unit.
Factor 5 – implementation team – consists of implementation team CSF items 15-10a to
15-10d as well as a learning CSF item: 15-6c “ERP improvement suggestions are regularly
collected from multiple employee levels.” Stratman and Roth (2002) indicate that the
responsibilities of the ERP implementation team include refining and adapting the ERP system
on an ongoing basis to support evolving business needs. This provides support for the inclusion
of item 15-6c under the implementation team factor.
Factor 6 – communication – consists of three communication CSF items 15-12a to 15-
12c. Factor 7 - user support - consists of two user support CSF items 15-3c and 15-3d and a
planning CSF item 15-2d “strategic ERP planning includes inputs from all functional areas.”
Stratman and Roth (2002) indicate that strategic ERP planning is a collation of user inputs which
218
facilitates the employees’ absorptive capacity to understand and effectively use the ERP system.
This suggests that the item 15-2d forms part of the user support factor. Factor 8 – alignment –
consists of three alignment CSF items 15-8a, 15-8b and 15-8c. Factor 9 – data accuracy –
consists of three data accuracy CSF items 15-11b, 15-11a and 15-11c. Factor 10 – consultants –
consists of three consultants CSF items 15-9a, 15-9b and 15-9c. As mentioned earlier in this
section, four factors – 11 to 14 – have been omitted from analysis on the basis of the scree test
criterion. These four factors together account for 9 items – two alignment CSF items 15-8d, 15-
8e; three national culture CSF items 15-14c, 15-14d, 15-14e, one consultants CSF item 15-9d;
and one learning CSF item 15-6d. Internal consistency analysis using the SPSS 12.0 program
was undertaken and the Cronbach’s Alpha for each of the 10 CSF scales is presented in Table 38.
Table 38 Summary of Items Omitted from 10 CSF Scales & Cronbach’s Alpha _____________________________________________________________________________________________
CSFs Final Number of Items Cronbach’s Alpha ____________________________________________________________________________________________
Top Management Support 8 .922 Training 6 .923 Project Management 6 .917 Culture 6 .818 Implementation Team 5 .868 Communication 3 .848 User Support 3 .818 Alignment 3 .853 Data Accuracy 3 .730 Consultants 3 .633 __ Total 46 __________________________________________________________________________________________
The results presented in Table 38 indicate that the reliability of all the scales except that
of the consultants scale is above the recommended level of 0.70. Hair et al. (1998) suggests that
the reliability criterion may be decreased to 0.60 in exploratory research. Hence, the data
accuracy scale with a reliability coefficient of .633 is included in this study. To confirm that the
219
items were accurately assigned to each CSF scale, item-to-scale correlations were calculated for
all items and the results are presented in Table 39.
Note β : All values are standardized regression coefficients Significance: * p < .05, ** p < .01, *** p < .001
The percentage of total variance in the aggregate change in performance that is explained
by the intra-firm module sub-system is 7.9%. The results indicate that firms experience overall
221
change in performance when they implement the 10 modules forming part of the intra-firm
module sub-system. The results in Table 40 indicate that the percentage of total variance in the
overall changes in performance that is explained by the inter-firm module sub-system is 2.5%.
The results further indicate that firms obtain overall change in performance when they
implement the four modules comprising the inter-module sub-system.
As discussed earlier in this section, 10 CSFs were obtained from the factor analysis of all
the CSF items. Summated scales were constructed for each of the 10 CSF measures. Regression
models were developed to analyze the overall change in performance resulting from the
interactions between the 10 CSFs and the intra-firm and inter-firm module sub-systems. The
results of the regression analysis are shown in Table 41. The regression results in Table 41
indicate that there are interaction effects between the intra-firm module sub-system and the
implementation team and the consultants CSFs on the overall change in performance. The
interaction effect of the consultants CSF is, however, negative indicating that as elements of this
CSF increases there is a decrease in overall firm performance. There are no interactive effects
between the intra-firm module sub-system and the other eight CSFs on overall firm performance.
The table also indicates that there are significant interactions between the inter-firm
module sub-system and the data accuracy CSF on the overall change in performance. The
interaction effects of the data accuracy CSF is, however, negative indicating that as elements of
this CSF increases there is a decrease in overall firm performance. The above results indicate that
firms obtain overall performance benefits when they focus on the implementation team CSF
while implementing the intra-module sub-system. Also, firms that focus on the consultants and
the data accuracy CSFs will obtain decreased performance benefits when implementing the intra-
module and inter-module sub-systems respectively.
222
Table 41 Significant Interaction Relationships Between Two Holistic ERP Module Sub-systems and Overall Change in Performance ___________________________________________________________________________ Implementation Status of Overall Change in Performance ERP Module Sub-systems X (10 Performance Measures) CSFs (each of 10 CSF Factors) β ∆R² ∆F ___________________________________________________________________________
Intra-Firm Module Sub-system X Implementation Team .870* .015 4.542* Consultants -.757* .027 6.108* Inter-Firm Module Sub-system X Data Accuracy -.836* .026 6.092* ___________________________________________________________________________
Note β : All values are standardized regression coefficients Significance: * p < .05, ** p < .01, *** p < .001
Summary
In this chapter the results of the statistical procedures used to test the hypotheses were
presented. First, the results pertaining to the demographic profile for the business units as well as
the respondents’ characteristics were shown. Then, the results of the factor analyses and
regression analyses used in this study were presented. Additional analyses were conducted to
further understand the hypothesized relationships.
The business unit characteristics indicated that a cross-section of business units of
different sizes, operating in different industries, using different production processes, and
implementing different ERP vendor systems were represented in the sample. The individual
characteristics of the respondents revealed that a majority of the respondents belonged to the
middle and top management levels and had considerable experience in the IT and ERP arena.
223
Factor analysis and item analyses indicated that the instrument used to gather data for this study
had high reliability and validity.
The results of the regression analyses demonstrate support for hypothesis 1a wherein 12
modules (except the project system and the E-Commerce modules) made a significant
contribution to one or more of the 10 performance measures even though the contribution of
each module varied with each of the performance measures. Hypothesis 1b was supported
indicating that as the implementation status of a holistic ERP system increases synergistic
changes in firm performance results. Further investigation demonstrated that a 13 module
holistic ERP system provided the greatest synergistic benefits to firms. The regression results
show partial support for hypothesis 2a indicating that different CSFs interact with different ERP
system modules and impact various performance measures. Hypothesis 2b also has partial
support indicating that there are interaction effects between the holistic implementation status of
the ERP system and eight of the 13 CSFs, and various performance changes. Additional analyses
revealed partial support for the accrual of the greatest synergistic benefits with the deployment of
a 13 module holistic ERP system.
Factor analysis was conducted on the three key model variables – ERP system modules,
CSFs, and performance. The regression results using the factors derived from the factor analysis
of the above variables indicates that firms which implement intra and inter-module sub-systems
obtain overall performance benefits. The univariate ANOVA results suggest that firms that focus
on CSFs throughout the implementation process garner greater performance benefits than those
that stress CSFs during the initial deployment stage. In chapter 5, conclusions of the research
study are discussed along with the implications of this study for both academicians and
practitioners. Then, future research directions are proposed.
224
CHAPTER 5
DISCUSSION OF RESULTS
Introduction
The final chapter consists of a discussion of the results of the study. The first part of this
chapter discusses improvements that were made to previous instruments used in enterprise
resource planning (ERP) research studies followed by an explanation of the analysis results.
Then, the implications of the study to academicians and practitioners, the limitations of the
study, and suggestions for future research are discussed.
Measurement Instrument Improvement
In this study, efforts made to develop as well as improve on previous instruments used in
ERP as well as other system studies were successful. The scales used to measure the
implementation status of the ERP system were developed from the White’s (1990) just-in-time
(JIT) and Berry’s (1996) quality studies. Minor changes were made to the scales used by these
two researchers to allow for sharper delineation in the measurement of the implementation
statuses of the modules. Internal consistency analysis yielded a Cronbach’s alpha of 0.876 for the
holistic ERP implementation status scale. ERP literature suggests that ERP systems can be
considered to broadly comprise two module sets that address intra-firm and inter-firm activities
respectively. The above findings were substantiated through factor analysis of the 14 modules
comprising the ERP system, which yielded two factors. The first factor, intra-firm module sub-
management, production planning, project management, sales and distribution, general logistics,
quality management, and human resources. The factor loadings for these 10 modules ranged
from 0.384 to 0.902 and the Cronbach’s alpha for this scale was .888. The second factor, inter-
225
firm module sub-system, comprises of four modules – supply chain management (SCM),
customer relationship management (CRM), electronic-commerce (E-Commerce), and advanced
planner optimizer/advanced planner scheduler (APO/APS). The factor loadings for these four
modules ranged from .583 to .710 and the Cronbach’s alpha for this scale was .578, which in an
exploratory research context can be considered acceptable. In addition, item-to-scale correlations
confirmed that the items were accurately assigned to each of the two module scales.
ERP research suggests that implementations result in overall improvements in firm
performance. The factor analysis results of the 10 performance measures – inventory
management, information quality, on-time delivery, standardization, profitability, return on
investment (ROI), information availability, user satisfaction, customer satisfaction, competitive
advantage – support the above findings. All the 10 performance measures loaded onto a single
factor. The factor loadings ranged from .734 to .799 and the internal consistency of the overall
performance scale yielded a reliability coefficient of 0.914. The reliability of the overall
performance scale in this study compares favorably with those of similar scales used in literature
(Stratman and Roth, 2002). Stratman and Roth’s (2002) “improved business performance” scale
uses 16 items to measure performance. Their scale, however, predominantly comprises of
operational improvement and business goals realization items. The overall performance scale in
this study improves on Stratman and Roth’s (2002) scale by including parsimonious items that
capture firm performance across different ERP implementation statuses. The items in the overall
performance scale assess changes in informational, transactional, and organizational benefits
accruing to firms from their ERP system deployments.
The items comprising the 13 critical success factors (CSFs), as mentioned in chapter 3,
were drawn from multiple studies and hence comparisons of the CSFs with other studies’ scales
226
are made to the extent possible in the ensuing paragraphs. Each of the 13 CSFs were factor
analyzed separately; 10 of the CSFs loaded onto a single factor; these being top management
support, planning, user support, project management, training, learning, implementation team,
data accuracy, communication, and national culture. Two factors were extracted from each of the
remaining three CSFs – alignment, consultants, and organizational culture. One of the factors
from the two-factor solution for the consultants and the organizational culture CSFs were
dropped as they were single item factors. Also, one of the factors from the two-factor solution for
the alignment CSF was dropped due to a potential confounding issue between the time element
in this factor and the time element measured through the implementation status scale.
The scale used to measure top management support (reliability of .916) improved
substantially on Stratman and Roth’s (2002) “executive commitment” scale (reliability of .88).
This improvement was due to removal of two of the seven items from the Stratman and Roth
(2002) scale and the inclusion of an item in the top management support scale that assessed the
role of the cross-functional steering committee in the implementation process. The two excluded
items from the Stratman and Roth (2002) scale were “Functional managers willingly assign
resources to the ERP project as they are needed” and “Executive management is enthusiastic
about the possibilities of ERP.” A perusal of the items comprising the top management support
scale suggests that they encompass the purported measures of the two excluded items and hence
were redundant.
The reliability of the scale used to measure planning (.869) in this study did not change
from the “strategic IT planning” scale (.87) used by Stratman and Roth (2002). The planning
scale, however, improved on Stratman and Roth’s (2002) scale by including only four of their six
scale items. The two excluded items from the Stratman and Roth (2002) scale were “Strategic IT
227
planning is a continuous process’ and ‘Top Management is not involved in IT planning.” These
two items were redundant as the remaining four items adequately measured all relevant facets of
the planning CSF.
The reliability of the scale used to measure user support (.858) in this study did not
change from the “change readiness” scale (.86) used by Stratman and Roth (2002). The user
support scale, however, improved on Stratman and Roth’s (2002) scale by including only four of
their eight scale items. An item that assessed whether management actively ensures user
participation and involvement to foster user support for the ERP system was included in the user
support scale in this study. The four items of the excluded Stratman and Roth (2002) scale were
“Employees have input into how their jobs will change with new ERP business processes,” “The
roles of all employees under the ERP system have been clearly communicated,” Employees are
not prepared for a series of ERP-related changes as the system evolves,” and “ERP-focused
changes to the employee reward system have been communicated.” A perusal of the above four
excluded items suggests that these measures implicitly form part of the existing five items that
make up the user support scale and hence were redundant.
The reliability of the scale used to measure project management (.916) in this study did
not change from the project management planning scale (.91) used by Stratman and Roth (2002).
The project management scale in this study, however, improved on Stratman and Roth’s (2002)
scale by including only four of their eight scale items. An item that assessed whether ERP
project changes are clearly documented was included in the project management scale used in
this study. The four items of the excluded Stratman and Roth (2002) scale were “The
responsibilities of project team members are clearly defined,” “Problems found during reviews
of external project members are not tracked to closure,” “Measurements are used to determine
228
the status of project tasks,” and “The ERP project leader is able to track project tasks to
completion.” A perusal of the above four excluded items suggests that these measures implicitly
form part of the existing five items that make up the project management scale and hence were
superfluous.
The Cronbach’s alpha for the scale to assess training (.931) improved substantially over
Stratman and Roth’s (2002) ERP training scale (.86). This improvement was due to the removal
of three of the eight items from the Stratman and Roth’s (2002) scale, which were repetitive with
the other five items and hence redundant. The three excluded items from the Stratman and Roth
(2002) scale were “Training materials have been customized for each specific job,” “We seldom
update training materials to reflect system changes,” and “All users have been trained in ERP
system skills.”
The reliability of the learning scale (.805) was lower than that of the learning scale (.85)
used by Stratman and Roth (2002). This could be due to only four of the eight items of the
Stratman and Roth (2002) scale being used in this study’s learning scale and hence probably did
not cover all facets of the learning measure. The four excluded Stratman and Roth (2002) items
were “We keep track of ERP developments related to our industry,” “Internal groups meet
regularly to share new methods of using the ERP system,” “Business experiments are conducted
to evaluate potential improvements in the way we use ERP,” and “External ERP experts are
invited to suggest better ways to use the ERP system.”
The Cronbach’s alpha for the implementation team support scale (.892) was lower than
that of the “IT skills” scale (.93) used by Stratman and Roth (2002). This could be due to only
four of the eleven items of the Stratman and Roth (2002) scale being used in this study’s
implementation team support scale which probably did not cover all aspects of the
229
implementation team measure. The seven excluded Stratman and Roth (2002) items were “There
is a high degree of technical expertise in the IT organization,” “The database administration is an
expert in the ERP database management system,” “Internal IT team members understand custom
ERP software programs,” “The IT staff have the technical ability to conduct a formal validation
of all system changes,” “IT staff are able to analyze the technical impact of proposed system
changes,” “IT staff communicate with functional use groups in the ERP entity,” and “The IT
organization provides a service to the business.”
The Cronbach’s alpha for the other six CSF scales ranged from a low of .648 to a high of
.853. The 10 CSF scales (given in Table 38), which resulted from the factor analysis comprising
of the 56 items belonging to the 13 CSFs, comprised of items that cross-loaded across the 13
CSFs. This precluded the assessment of the measurement improvement for these scales against
existing scales in literature. The overall improvement over existing measures and the high
reliability of the existing as well as developed scales could be due to the careful selection of the
target population for this study. Most of the respondents to the survey were managers with
hands-on experience in managing the implementation of ERP systems and thus have an informed
perspective and a good understanding of their ERP systems than respondents in other survey
studies.
Discussion of the Findings
In the first phase of this research study, ERP was characterized as a 14 module system
that included all of a firm’s business applications and firms could improve their performance
with the implementation of one or more modules. The identification of these 14 distinct but
interrelated ERP modules, through a synthesis of literature, facilitates the use of a systems
approach to understanding ERP thus providing a foundation for the second phase of the study.
230
Further, cross-study comparisons yielded 10 performance measures to evaluate ERP
implementation benefits as well as 14 CSFs for facilitating system deployment. A theoretical
model was developed to illustrate the relationships associated with ERP system implementation.
The model indicated that different ERP system implementation statuses result in differential
performance benefits accruing to firms; and CSFs influence the relationship between ERP
system implementation status and changes in performance. Data were gathered through a cross-
sectional survey of production firms that had implemented ERP systems for testing the linkages
proposed in the model. Multiple linear regression and univariate ANOVA were used for
hypotheses testing. The results of these analyses were presented in chapter 4. A summary of the
findings and implications of this research study are presented below.
ERP System Implementation Status and Changes in Performance
The first hypothesis H1a was supported by the results of the regression analyses for 12 of
the 14 modules. The findings suggest that there is a positive relationship between the
implementation status of individual ERP system modules and changes in performance.
Significant differences were found in the regression models for the financial and controlling
modules (six and seven out of the 10 performance measures respectively). ERP system research
indicates that firms are early implementers of these two modules, which can be considered to
form part of the financials category, as one of the weakest business links is the management of
cost and productivity. The high means for the implementation status for these two modules (3.61
years for the financials module and 2.23 years for the controlling module) as well as their high
implementation rate (93.1% and 61.7% of the surveyed firms for the financials and the
controlling modules respectively) lends supports to the above findings. Also, the easy availability
of information from the ERP system results in quick benefits from the implementation of these
231
two modules such as shortened financial close cycles and timely budget-to-actuals information.
These early visible benefits in turn strengthen employee buy-in to the firm’s ERP deployment.
The standardization of budgeting and reporting practices and procedures, through reengineering
of business practices to conform to the ERP system or vice versa, enables the firm to make real-
time decisions that help them stay on budget or shift business direction as required.
The results indicate that the quality management module was statistically significant for
all the 10 performance measures. The plant maintenance and the production planning module
were statistically significant for nine and eight of the 10 performance measures respectively.
Significant differences were also found in the performance of the general logistics (six out of 10
performance measures), sales and distribution (five out of the 10 performance measures) and the
materials management modules (four out of 10 performance measures). Research indicates that
the above modules can be characterized as forming part of the logistics category, which
coordinates and manages all of a firm’s value chain activities from procurement to distribution.
Research also indicates that firms use ERP information to leverage their logistics category
modules to obtain early transactional benefits. On the supply side, firms use information on
materials availability, transportation, and labor to configure changes across the product life cycle
in tune with changing business conditions. On the demand side, planning forecasts that are
updated in real-time allow planners to achieve higher utilization of plant capacity as well as
materials. The high means for the implementation status of these modules (ranging from 1.55
years for the plant maintenance module to 3.66 years for the materials management module)
indicates that firms implement these modules early on in the implementation process. This could
be the reason for the significant relationships between the logistics category as a whole and
various performance measures. The low mean value for the project system module (.92 years),
232
which research indicates as forming part of the logistics category, and its low implementation
rate (31% of the surveyed firms) probably accounts for its lack of relationship with any of the 10
performance measures.
The human resources module (mean implementation status of 1.72 years; 57.6%
implementation rate among surveyed firms), which can be characterized as forming part of the
human resources category, was significant only for the ROI measure. The above suggests that
firms have not fully leveraged the capabilities of this module. ERP research indicates that this
module is typically heavily customized to conform to local practices. Most of the surveyed firms
probably focused on initially customizing and automating employee transaction activities like
payroll and benefits management. Firms are yet to realize the full benefits from this module
deployment due to under-utilization of module capabilities such as employee lifecycle
management, self-service options, and workforce deployment.
Significant differences were found in the performance of the CRM (four out of 10
performance measures), SCM (two out of 10 performance measures) and the APO/APS modules
(one out of 10 performance measures). The low means for the implementation status of these
modules (ranging from .38 years for the CRM module to 1.02 years for the SCM module) as well
as their low implementation rate (ranging from 16.7% for the APO/APS module to 30.5% for the
SCM module) could account for the low performance gains from these modules. ERP research
indicates that firms implement modules such as CRM, SCM, and APO/APS, which can be
considered to form part of the extension category, that are associated with inter-firm activities
after having stabilized their intra-firm deployments. The above results lend support to these
findings and suggest that most firms are yet to leverage their transactional data for real-time
decision support and problem monitoring across the supply chain. The lack of support for the E-
233
commerce module (mean implementation status of .45 years; 16.7% implementation rate among
surveyed firms), which research indicates as being part of the extension category, also shows that
most firms have not Web-enabled their ERP systems. ERP research indicates that implementing
an agile supply chain solution is facilitated by firms Web-enabling their ERP systems to enable
real-time information exchange between supply chain partners. The initial gains that firms
obtained from implementing the CRM and the SCM modules further lends support to ERP
research findings on the need for firms to Web-enable their ERP systems to garner supply chain
benefits.
ROI is statistically the most important performance measure as it is significant for 11 out
of the 14 modules thus suggesting that most firms were able to obtain speedy and early ROIs
from their ERP systems. The quality management module is the most important variable for
predicting the changes in information availability, user satisfaction, and competitive advantage
measures. This suggests that the availability of seamless integrated real-time information from
the ERP system is essential for the effective performance of tasks associated with quality
planning, inspection, and control. In addition, a unified approach to total quality management
increases the ability of the firm to meet competitive challenges and enhance its market position.
The controlling module is the most significant variable in predicting information quality and
typically contains the tools and reports necessary to analyze and manage budgeting and cost
structures. This suggests that the quality of information flowing through the supply chain has a
direct bearing on cost and budgeting activities.
The plant maintenance module is an important variable in predicting inventory
management and standardization. This underscores the importance of the maintenance of plant
systems for efficient management of the production process. The graphical representations,
234
connection to geographic information systems, and detailed diagrams forming part of the plant
maintenance module helps standardize the order-to-market flow cycle. The production planning
module is a significant predictor of changes in on-time delivery. This suggests that the effective
use of the different phases, tasks, and methodologies used in both the planning of production and
the process of production helps firms meet delivery deadlines. The CRM module is an important
variable for predicting the changes in firm profitability and customer satisfaction. CRM extends
the scope of ERP systems to include automating functions such as sales, marketing, customer
service, and collaborative order management. The streamlining of downstream processes to
facilitate customer order management thus serves to increase customer satisfaction as well as
improve firm profitability.
The first hypothesis H1b was supported by the results of the regression analyses. The
results indicate that there is a positive relationship between the holistic implementation status of
the ERP system and synergistic changes in performance. The profile plots in Figure 6 further
suggest that initial performance gains accrue to firms with low implementation statuses. As the
firms’ implementation status increases, performance gains also increase. This reinforces the
findings of ERP and other relevant system research, which indicate that firms derive increased
benefits as their implementation status increases with full benefits being obtained with a holistic
implementation status. The above suggests that the integrated nature of the ERP system
facilitates real-time decision making thus helping firms implement supply chain solutions to keep
pace with the rapid changes in market demand and supply.
Additional analysis revealed that firms which implement a 13 module holistic ERP
system, excluding the e-commerce module, derive the greatest synergistic benefits. The above
suggests that firms which implement more than the 13 modules excluding the e-commerce
235
module will not obtain increased benefits from adding more modules; on the contrary, firms may
experience a decrease in performance.
Influencers of ERP System Implementation Success
The second hypothesis H2a, which suggests that CSFs influence the relationship between
the implementation status of ERP system modules and changes in performance, was partially
supported by the results of the regression analyses. The interaction plots in Figures 7 and 8
suggest that firms obtain initial gains when they focus on CSFs during their low implementation
statuses. Firms, however, that emphasize CSFs throughout the entire implementation cycle
obtain greater benefits. In contrast, firms that do not emphasize CSFs either during the low or the
high implementation statuses do not obtain improvements and even suffer declines in
performance.
Top Management
There were significant interactions between the top management CSF and four ERP
system modules on various performance measures. The positive interactive effect of the top
management CSF and the human resource module showed the greatest magnitude and the
highest significance on ROI besides information availability. This could be due to quick and
visible benefits arising from the executive support for customizing and automating payroll and
benefits management tasks. Positive relationships for the top management CSF and the
production planning module on information availability suggests that there is good support for
leveraging information and generating feasible production plans to optimize manufacturing with
demand. The positive interactive effect of the top management CSF and the sales and
distribution module on information quality and profitability suggests that managerial support for
facilitating the obtainment of up-to-date demand side information has a bearing on the quality of
236
information obtained as well as the profitability of transactions. Negative relationships were
indicated for the top management CSF and the E-commerce module on inventory management.
This could be due to the firms’ top management not having invested the time and resources
necessary to leverage the use of E-commerce module capabilities such as e-procurement.
Planning
Significant interactions between the planning CSF and six of the ERP system modules
were found for various performance measures. Interaction relationships were present for the
planning CSF and four of the ERP system modules for the profitability measure. This
underscores the importance of continuous adaptive planning for a successful ERP system
deployment and its impact on the firm’s bottom-line. The strong interaction effect between the
planning CSF and the APO/APS module on profitability highlights the importance of planning
complex processes such as shelf-life considerations, alternate routing, and capacity storage
constraints, and their resultant impact on profitability. Positive relationships were indicated
between the planning CSF and the SCM module on profitability, information availability, and
user satisfaction. Firms leverage ERP system information to improve their planning and
execution capabilities. This, in turn, facilitates better management of inter-firm supply chain
operations and hence impacts profitability. Negative relationships were found between the
planning CSF and the production planning and the quality management modules on on-time
delivery. These negative interactions suggest that there is a planning disconnect within the firm
with regard to ensuring the quality of activities pertaining to the order management cycle.
User Support
There were significant interaction effects between the user support CSF and eight ERP
system modules for various performance measures. These interaction relationships lend strong
237
support to ERP research findings that implementations are more about people rather than process
or technology. The results underscore the important role played by users in ensuring ease of
accurate information retrieval, better inventory management, quicker ROI, and more profitable
transactions. Positive relationships were found between user support and the financials module
for inventory management, information quality, profitability, ROI, and information availability.
The extensive report facilities in the financials module require accurate information, and user
support is instrumental in ensuring their real-time availability. The linkages between the
financials module (for example the accounts payable submodule) and materials management (for
example the purchasing submodule) could explain the influence of user support on gains in
inventory management.
Significant positive interactions were found between the user support CSF and the sales
and distribution module on inventory management, information quality, profitability, ROI, and
information availability. The importance of user support is due to the intensive transactional
nature of the sales and distribution module as it links and integrates with all the other modules to
impact informational and transactional performance. There were positive interactions between
the user support CSF and the production planning module on information quality, information
availability, and user satisfaction. This highlights the importance of user support in both the
planning of production and the process of production itself. Negative relationships were found
between the user support CSF and the CRM module on profitability. The low implementation
status for this module could be a reason for this negative interaction as users’ are yet to
familiarize themselves with the full capabilities of this module. Negative interactions were also
found between the user support CSF and the quality management module on on-time delivery
and competitive advantage. This suggests that the surveyed firms are yet to adopt a unified
238
quality planning approach to their order management cycle activities and this in turn affects their
competitive positioning in the market place.
Project Management
Significant interactions were found between the project management CSF and six ERP
system modules on various performance measures. Interaction relationships were present for the
project management CSF and four of the ERP system modules for the information availability
measure. ERP research indicates that the practice of excellent project management techniques
over the ERP life cycle is crucial for successful ERP system deployment. Effective project
management activities help firms leverage ERP information to obtain greater insights into supply
chain activities. Supply chain activities gain the most when compared to other functional
activities as evident in the strong interaction relationship between the project management CSF
and the SCM module. Significant positive interactions were found between the project
management CSF and the human resources module on inventory management and information
availability. This could be due to the key role that good project management design and
execution plays in the effective use of workforce analytics and hence the impact on these
performance measures.
Negative relationships were found between the project management CSF and the quality
management and the project system module on on-time delivery and profitability respectively.
The negative interaction for the quality management module again highlights the lack of infusion
of quality planning activities into the order management cycle. The negative interaction for the
project system module suggests a lack of focus on long-term project management activities
associated with resource planning and the budgeting of complex tasks that are typically
associated with project system module applications.
239
Training
Significant interactions were found between the training CSF and six of the ERP system
modules on various performance measures. Interaction relationships were present for the training
CSF and four ERP system modules for the profitability measure. This suggests that training
activities across the financials, logistics, and the human resources sub-systems have a bearing on
profitability. Positive relationships were found between the training CSF and the human
resources module on inventory management, on-time delivery, profitability, ROI, information
availability, and customer satisfaction. This reveals that firms focus on human resources
activities associated with employee life cycle management and hence register gains across
informational, transactional, and organizational measures. There are positive interaction
relationships between the training CSF and the financials module on inventory management, on-
time delivery, profitability, and ROI. This shows that training activities that focus on the
operational aspects of the general financial and accounting function have a beneficial impact on
transactional and organizational performance measures.
The strong interaction between the training CSF and the project system module on
information quality suggests that training for activities associated with data procurement for
resource planning and budgeting of complex tasks results in accurate information output. The
findings also suggest that training activities which focus on the sales and distribution cycle
impact profitability. Negative interactions were found between the training CSF and the SCM
module on information quality and customer satisfaction. This suggests that firms need to focus
on training activities targeted at accurate data gathering so as to leverage the inter-firm planning
and execution capabilities of the SCM module.
240
Learning
Significant positive interactions were found between the learning CSF and seven ERP
system modules on various performance measures. Interaction relationships were found between
the learning CSF and three ERP system modules for the profitability measure. The positive
interactions with the financial and the controlling modules indicate that suggestions for new and
improved ERP system usage have a beneficial impact on the firms’ financial and cost practices.
Improvements in the firms’ bottom-line suggest that firms encourage the building up of skill-sets
and knowledge to leverage the intensive transactional capabilities of the sales and distribution
module. The strong interaction between the learning CSF and the SCM module on user
satisfaction suggests that users experiment with the ERP system to improve inter-firm
operations. There is a negative relationship between the learning CSF and the quality
management module on competitive advantage. This highlights the need for firms to use external
benchmarking for the planning and controlling of quality management activities.
Data Accuracy
Significant negative interactions were found between the data accuracy CSF and three
ERP system modules on various performance measures. Negative interaction relationships were
present between the data accuracy CSF and the SCM and the APO/APS modules for five and
four performance measures respectively. The strong negative interaction between the data
accuracy CSF and the SCM module on customer satisfaction suggests that lack of data integrity
in the ERP system affects decision-making quality and hence customer satisfaction. The SCM
module also indicates negative interactions for the information quality, ROI, information
availability, and competitive advantage measures. The APO/APS module exhibits negative
interactions for the ROI, information availability, user satisfaction, and customer satisfaction
241
measures. The negative interactions for both these modules could be due to the firm’s lack of
control over information that comes into the ERP system from supply chain partners. The low
mean implementation status as well as the low implementation rate for these two modules
suggests that firms are not yet cognizant of this deficiency in the data collection process.
Alignment
The alignment CSF had significant interactions with seven of the ERP system modules
for various performance measures. Positive relationships were found between the alignment CSF
and the production planning module on inventory management, information quality, and
profitability. This indicates that there is good integration of plant scheduling and execution
systems with the ERP system’s production planning processes. The alignment CSF has
significant interactions with the controlling module on profitability. This suggests that a good fit
between the firm’s cost and budgeting structures and the ERP system’s processes has a bearing
on the firm’s bottom-line.
Negative interactions were found between the alignment CSF and the quality
management and the general logistics modules on ROI. These negative interactions demonstrate
that there could be key mismatches between various quality and logistic processes embedded in
the ERP system and the firms’ business processes. There is a strong negative interaction between
the alignment CSF and the APO/APS module on the user satisfaction measure. This indicates
that firms are yet to align their supply chain planning and optimization processes at the strategic,
tactical, and operational levels. The positive interaction between the alignment CSF and the
SCM module on information availability, however, suggests that firms are cognizant of the need
to fine-tune their inter-firm module processes.
242
Consultants
Significant interactions were found between consultants and nine ERP system modules
on various performance measures. These associations were, however, mostly negative suggesting
that performance declines as the interaction between consultants and the implementation status
of most modules increases. Five ERP system modules had negative interactions with the
consultants CSF on the profitability and competitive advantage measures. Standardization, ROI,
information quality, and information availability were the other performance measures that
registered a decline.
The interaction between the consultants CSF and the human resources and the controlling
modules on information availability and competitive advantage were the only positive ones. The
human resources module components are typically highly customized to ensure adherence to
local reporting requirements. The positive interaction could be the result of the key role played
by consultants in facilitating this local customization. ERP research indicates that consultants
play an important role in facilitating ERP system deployments from project inception to system
upgrades. The positive interaction with the controlling module could be due to the influence of
consultants in configuring the controlling module to firm-specific needs. The module, when
configured to aggregate work activities along different dimensions, enables consolidation and
monitoring of all performance related information vis-à-vis competitors.
The results of this study, however, indicate that consultants mostly exert a negative
influence on the implementation process. This could be due to the paucity of consultants with the
requisite product, business, technical, and inter-personal skills to guide the implementation
process. The findings suggest that firms could invest resources in developing consultants
internally rather than outsource these skills.
243
Implementation Team
The implementation team CSF has significant interactions with six ERP system modules
on various performance measures. Significant interaction relationships are present between the
implementation team CSF and the financials module on inventory management, information
quality, and profitability. ERP research indicates that firms typically deploy the financials
module before other modules as early visible benefits will ensure employee buy-in. The
implementation team members play a vital role in ensuring the success of this partial
deployment. Significant interaction relationships were found between the implementation team
CSF and the controlling and the production modules on inventory management, information
quality, and profitability. These positive associations suggest that the implementation team
members’ focus on ensuring data integrity results in increased information quality. Firms could
have deployed their best information technology (IT) and functional resources as the focus on
cost structures and production processes resulted in the slashing of inventories and contributed to
increases in the bottom-line.
There is a strong positive interaction between the implementation team CSF and the
APO/APS module on information availability. This suggests that the implementation team
members are aware of the need to have adequate information to enable the APO/APS module
users to carry out complex planning and scheduling activities. Negative interactions were found
between the implementation team CSF and the quality management module on on-time delivery
and competitive advantage. This could be due to quality related skill-set inadequacies among the
implementation team members.
244
Communications
Significant interactions were found between the communications CSF and five ERP
system modules on various performance measures. Four ERP system modules – financials,
controlling, production planning, sales and distribution – have positive interactions with the
communications CSF on information quality. This suggests that firms have successfully
integrated user input into the communication process to ensure the data integrity of the ERP
system. Significant negative interactions were found between the communication CSF and E-
commerce module on information availability. This could be due to weak or incompatible system
links with supply chain partners, which impacts the availability of requisite information
necessary to successfully conduct transactions. Overall, the low support for the interaction
effects of the communication CSF was unexpected as ERP research indicates that ongoing
communication within the firm throughout the implementation life cycle is essential for ERP
system success. This could be due to firms relying more on informal channels to disseminate as
well as collect pertinent user input on the ERP implementation. This lack of an open information
policy could, however, potentially lead to problematic implementations as they may result in
delayed employee buy-in.
Organizational Culture
The organizational culture CSF has significant interaction relationships with nine ERP
system modules on various performance measures. Interactions relationships were present for
seven ERP system modules on the profitability measure. ERP research indicates that ERP system
implementations cause major organizational transformations in firms. The findings suggest that
firms follow a socio-technical approach in deploying their ERP system and that successful
implementation impacts the firms’ profitability. The organizational culture CSF interacts with
245
the human resources module to influence profitability, ROI, and information availability. This
was as expected as typically the human resources function focuses on efficient human capital
management – from recruitment to post termination benefits. The negative interaction between
the organizational culture CSF and the quality management module on on-time delivery suggests
that a quality culture is yet to take root among the surveyed firms and hence adversely affects the
order cycle.
National Culture
Significant interactions were found between the national culture CSF and eight ERP
system modules on various performance measures. These associations were mostly negative
suggesting that performance declines as the interaction between national culture elements and
implementation status increases. The standardization measure registered the highest decline with
six ERP system modules – financials, controlling, materials management, production planning,
sales and distribution, and quality management – exhibiting negative interactions with the
national culture CSF. ERP research (Krumbholz & Maiden, 2001) suggests that ERP vendors
provide generic off-the-shelf solutions which could cause implementation problems when they
are deployed across different cultures. There is, however, an increasing trend of ERP vendors
providing country-specific packages with embedded local practices so that national culture
differences do not come to the fore during implementations. Hence, firms that focus on national
culture differences could face a decline in various performance measures. The financials,
controlling, materials management and production planning modules were the most affected by
negative interactions with the national culture CSF. This could be due to the high
implementation status of these modules. As firms continue to focus attention on the national
culture CSF through the ERP implementation process, performance decreases.
246
The results in Table 23 indicate that the e-commerce and the project system modules do
not contribute to improvements in any of the ten performance measures. A perusal of the results
in Tables 28a-28d further indicates that none of the CSFs interact with the E-commerce module
to improve performance. This adds support to the finding that firms should focus on
implementing a 13 module system (excluding the E-commerce module). The project
management CSF is the only one that interacts with the project system module to improve
profitability. The APO/APS module contributes to improvements in only one performance
measure – information quality. Two CSFs – planning and implementation team – interact with
the APO/APS module to improve profitability and information availability respectively. The
above suggests that firms should implement the project system and the APO/APS modules only
when they have specific business needs to meet – for example, projects and contracts in the case
of the project system module, and integrating global and local supply chain planning in the case
of the APO/APS module.
The results in Table 23 indicate that the human resources module contributes to changes
in only one performance measure – ROI. The results in Tables 28a-d, however, indicate that
seven CSFs interact with the human resources module to improve six of the ten performance
measures. The interaction between the human resource module and the training CSF alone
accounts for five of the six performance measures that registered improvements. The results in
Table 23 also indicate that the SCM module contributes to changes in two performance measures
– profitability and ROI. The results in Tables 28a-d, however, indicate that seven CSFs interact
with the SCM module to improve six of the ten performance measures. The interaction between
the SCM module and the planning CSF alone accounts for improvements in three of the six
247
performance measures. The above discussion suggests that CSFs are crucial in helping firms
leverage module capabilities and improve performance.
The second hypothesis H2b, which suggests that CSFs influence the relationship between
holistic ERP implementation status and synergistic changes in performance, is partially
supported by the results of the regression analyses. The interaction plots in Figure 9 indicate that
firms that emphasize CSFs during their holistic low implementation status register improvements
in performance. As their holistic implementation status increases, firms that continue to focus on
CSFs obtain greater increases in performance. The plots further suggest that firms stress relevant
aspects of the CSF appropriate to their module implementation status to obtain desired benefits.
Six CSFs – planning, user support, learning, consultants, implementation team,
organizational culture – interact with the holistic ERP system to impact the profitability measure.
The significant interaction of the planning CSF indicates that dynamic alignment of ERP system
capabilities and business needs has a bearing on the firm’s profitability. The garnering of user
support through user involvement in the ERP system implementation process, aided by a
supportive organizational culture, further influences the firm’s bottom-line. The responsive
support of the implementation team to user needs and the freedom to experiment with ERP
system capabilities also contributes to increases in the firm’s profitability.
Significant negative relationships were found between the consultants CSFs and holistic
ERP implementation status, on the profitability and ROI measures. This suggests that the firm’s
performance decreases when consultants are involved in the ERP system implementation
process. These findings are in tune with the negative interactions obtained between the
consultants CSF and individual ERP modules on various performance measures. The dearth of
ERP talent in the country could be a reason why firms are forced to manage with consultants
248
who lack the multi-faceted skills required to facilitate successful deployment. This in turn affects
the quality of the ERP implementation process.
Significant negative interactions were found between the national culture CSF and
holistic ERP implementation status, on the inventory management, on-time delivery,
standardization, information availability and competitive advantage measures. These results are
in tune with the negative interactions obtained between the national culture CSF and individual
ERP modules on various performance measures. Two reasons can be attributed to the negative
influence of national culture elements on the ERP system implementation. The first reason could
be that the surveyed firms implement the India-customized ERP system offerings of the ERP
vendors and hence there is minimal influence of the national culture elements of ERP vendors
embedded in the systems. The second reason is that India is a mix of Asian, Anglo, and Latin
European cultures and hence cannot be classified into any of the world’s major cultural
groupings (Hofstede, 1980). This composite cultural mix is attributed to the country’s
amalgamation of native and various colonial cultures as well as economic development that have
resulted in the reduction of the influence of national culture. The above suggests that a focus on
national culture elements negatively impacts the ERP system implementation process.
Further investigation revealed that firms which deploy a 12 module holistic ERP system
derive marginally higher synergistic benefits due to the interaction effects of various CSFs when
compared to the two 13 module holistic ERP systems (excluding the e-commerce and the project
system modules, respectively) and the 14 module holistic ERP system. The beneficial interaction
effects of the CSFs between the 12 and the two 13 module ERP systems are, however, mixed;
some performance measures improved whereas there has been a decrease in others. The above
suggests that firms obtain higher synergistic benefits when they emphasize CSFs while
249
implementing a 12 module holistic ERP system or any of the two 13 module systems. Firms that
focus on CSFs while implementing additional modules beyond the 12 or 13 module holistic ERP
systems do not obtain increased synergistic performance benefits.
A perusal of the results in Tables 24 and 30 indicate that five CSFs interact with the
holistic ERP system to improve profitability. The results also indicate that the implementation
team CSF interacts with the holistic ERP system to improve information quality. This suggests
that the competency of the implementation team members is critical in ensuring ERP information
quality. The results further indicate that the communication CSF interacts with the holistic ERP
system to improve on-time delivery. This suggests that firms need to develop and maintain open
and honest communication channels in order to improve their order management process. The
above discussion underscores the importance of CSFs in helping firms leverage holistic ERP
system capabilities to improve performance.
Additional Analyses
In chapter 4, two module sub-system factors and one overall performance factor were
obtained from the factor analysis of the 14 ERP modules and 10 performance measures
respectively. ERP research suggests that firms first deploy and consolidate intra-firm modules
and then extend the ERP system to include inter-firm modules. The results of the factor analysis
and a perusal of the mean implementation status of the modules lend support to the above
findings. The first module sub-system factor consists of 10 modules that address intra-firm
activities and the second module sub-system factor comprises of four modules that cater to inter-
firm activities. The findings from the regression analysis suggest that firms obtain overall
performance benefits with the implementation of the intra and inter-module sub-systems. These
results for the intra-module sub-system model are similar to those obtained with the holistic ERP
250
system model. This suggests that most of the surveyed firms have implemented the intra-firm
module sub-system and are yet to stabilize their inter-firm module sub-system deployment.
As discussed in chapter 4, 10 CSFs were obtained from the factor analysis of all the CSF
items. The results from the interaction analysis of these CSFs with the intra-module sub-system
suggest that firms obtain overall performance benefits when they focus on the implementation
team CSF. On the other hand, firms that focus on the consultants and the data accuracy CSFs
will obtain decreased performance benefits when implementing the intra-module and inter-
module sub-systems respectively. These results are similar to those obtained with the holistic
ERP system model except there is no significance for the data accuracy CSF. This suggests that
the focus on the data accuracy CSF for the intra-module sub-system deployment overrides the
negative effect of inaccurate inter-firm data.
Significant interaction relationships between the implementation team CSF and the intra-
firm module sub-system could be due to inclusion of the learning item “ERP improvement
suggestions are collected from multiple employee levels.” This suggests that the effectiveness of
the implementation team is enhanced as they fine-tune their skill-sets in accordance with user
needs, which accounts for the significant interaction differences. ERP research suggests that
learning is a continuous process and intensifies as implementation status increases. As mentioned
earlier in this section, most of the surveyed firms have low mean implementation statuses for the
inter-firm module sub-system; this coupled with the low implementation rate suggests that
significant interactions for learning could result as the implementation status for inter-firm
modules increases.
Analysis of the descriptive statistics of the overall success measure indicates that nearly
82.27% (N = 167) of the surveyed firms reported that their ERP systems implementation was a
251
success. Most firms (88.66%) indicated that an increase in the number of modules implemented
as well as fine-tuning these modules over time increased their performance benefits. About
88.67% of the firms reported that their internal coordination activities increased with the
implementation of more ERP modules; in contrast, only 79.31% of the firms indicated an
increase in the external coordination of their business activities across the supply chain. This
could be due to the higher implementation status of the intra-module as compared to the inter-
module sub-system.
Contributions of the Study
This study contributes theoretically and methodologically to the understanding of ERP
systems. ERP systems were defined as a collection of 14 modules that allowed for
operationalizing of this construct for this study. Thirteen CSFs were identified as facilitating the
implementation process and 10 performance measures for evaluating ERP deployment benefits.
A model was developed that allowed for testing the theoretical underpinnings of the relationships
between ERP system implementation status, CSFs, and performance. The linkages presented in
the model were tested and the results broadly indicate support for the model.
Most ERP system research focus on the piece-meal analysis of implementation issues due
to high incidences of deployment delays and failures. These studies indicate that similar
problematic implementation issues dominate the ERP markets in both the developed and the
developing countries (Buckhout et al., 1999; Lall, 2003). Hence, understanding the ERP system
concept, the role of each ERP system module, its interactions with CSFs, and how these affect
performance is essential for effective implementation of ERP systems in both the developed and
the developing countries.
252
This study used a theory driven approach to field-test an ERP system implementation
model in the Indian ERP market. The findings suggest that the implementation of 12 of the
individual ERP modules make varying significant contributions to one or more of the 10
performance measures. Firms that implement a holistic ERP system or intra-firm and inter-firm
module sub-systems obtain overall performance benefits. All the 13 CSFs have varying
significant interactional effects with individual ERP system modules to impact one or more of
the 10 performance measures. Interactional effects were also present for firms that implement a
holistic ERP system as well as intra-firm and inter-firm module sub-systems. The findings from
the regression runs conducted on the demographic variables suggest that ERP systems are
adaptable and flexible across firm size, industry, and the type of production environment.
The analysis presented in this study advances the understanding of ERP systems by
suggesting that firms derive benefits by implementing individual ERP system modules and that
their integration helps the firm derive aggregate benefits. Previous ERP research has not
investigated the integrative effects of the ERP system modules. This study drew upon previous
research to build an integrated model of ERP system implementation, which highlights the
importance of firms adopting a socio-technical approach to their ERP deployments. Empirical
support is provided for the suggested linkage between Galbraith’s (1977) information processing
model and the ERP system implementation model. The findings suggest that ERP systems can be
implemented in accordance with the organizational configurations suggested by Galbraith in his
various studies. Galbraith (1977) indicates that firms change their organizational configurations
in response to changing uncertainty. The survey results indicate that the extent of implementation
and the usage of ERP modules vary across business units thus giving rise to different ERP
configurations. This suggests that firms could use equifinal ERP configurations as a link between
253
their internal and external environments. Future ERP system implementation models developed
could further explore this linkage.
Managers who focus on CSFs throughout the ERP implementation process, i.e. focus on
the “people component” of implementations, contribute significantly to successful deployments.
This study demonstrates that CSFs are crucial in facilitating the implementation process. As
performance benefits vary with implementation status it is important that managers focus on
holistic integration to derive maximum synergistic gains. ERP equifinal configurations
comprised of various levels of module integration, coupled with support from CSFs, will
determine how best managers can meet the needs of their firms in their respective competitive
environments. This combination, rather than ERP implementation per se, is the key factor for
Indian production firms in their quest for improved performance.
The study’s findings suggest that there are as many small and medium firms that invest in
ERP systems as large firms. The firms are, moreover, spread across various industries and use
one or more different production processes. The above suggests that the common denominator
for implementing ERP systems is integration of activities and leveraging system capabilities to
achieve business objectives. The study’s findings reveal that firms “must” deploy the quality
management module as it contributes significantly to all performance measures. This is in tune
with production literature (Ferdows & Meyer, 1990), which suggests that quality initiatives
nurture the seeds of lasting improvements in firm performance. Implementation of more and
more modules results in a cumulative buildup of ERP system capabilities culminating in the
greatest synergistic benefits being obtained with the deployment of a 13 module holistic ERP
system. The optimal sequence of implementation of these 13 modules, however, could vary with
different firm-specific contingencies. Managers should recognize that the complex
254
interrelationships between modules could also result in different optimal sequence paths of
module deployment leading to high performance. The findings further suggest that merely
throwing more modules (beyond the 13 modules identified in this study) at existing business
problems do not cause them to be resolved. On the contrary, they could tend to reinforce old
ways of doing things. It is well known that technological advances of any nature bring change.
ERP is no exception. Managers should focus attention on all 13 CSFs identified in this study to
handle pre-implementation expectations and fears; implementation realities; and post-
implementation blues. A well-implemented holistic ERP system would enable managers adopt a
‘fly-by-wire’ approach to continuously and proactively monitor firm activities.
Though numerous suggestions to practicing managers could be made based on the
study’s findings, one key area that could “make” or “break” ERP deployments is ensuring
information quality. The results indicate that information quality has a high mean value among
ERP implementers. The results, however, further indicate that only five out of 14 ERP modules
contribute significantly to improvements in information quality; moreover, information quality
ranks eighth among performance improvements that result from the deployment of a holistic
ERP system. The above suggests that managers do recognize the importance of information
quality as a critical business concern. This recognition, however, has not been translated into
information quality improvements at the individual module as well as the holistic
implementation status levels. As the same information is used by different decision-makers for
different tasks, managers must realize that dirty information has adverse ripple effects across the
firm. If ERP information is not of high quality, then the whole system becomes suspect and
recovering data integrity may well nigh be impossible once it is compromised.
255
Investigation into the reasons for the low performance of the information quality measure
suggests that firms are affected by information inflows from outside sources such as from
customers and suppliers. The results of the regression analyses for the interaction effects of the
data accuracy CSF indicate negative relationships for two of the four modules that form part of
the inter-firm module sub-system – the SCM and the APO/APS modules – with the exception of
the materials management module. The negative interaction effect of the data accuracy CSF with
the intra-firm module – materials management – could be due to the tight integration of the
module components with SCM module components. The regression results for the negative
interaction effect of the data accuracy CSF with the two modules forming part of the inter-firm
module sub-system validates the contention that ERP systems in the sampled firms tend to be
contaminated by dirty inter-firm information flows. The lack of interactions between the data
accuracy CSF and the other modules forming part of the intra-firm module subsystem (except for
the materials management module) further suggests that data accuracy is not a key concern at the
intra-firm level also.
The above discussion suggests that it is imperative that managers clearly define
information quality goals, plan for trade-offs if any (for example cost versus quality), focus on
all elements of the data accuracy CSF, and establish a framework to assess information quality
issues. Managers could foster an information quality culture that ensures that all employees and
supply chain partners understand the concept and value of integrated ERP information.
Maintaining information integrity requires awareness and control of dirty information right from
the pre-implementation stage of the ERP system deployment. The above could be addressed by
the use of data migration and conversion tools to automate the conversion and interface process
from the firm’s legacy as well as supply chain partners’ systems to the ERP system. Managers
256
could ensure compatibility between firm data requirements and the ERP system in terms of data
format and the relationships among entities as represented by the underlying data model. The
maintenance of high quality ERP information would help lay the foundation for the deployment
of data warehouses to manipulate data for analysis as well as facilitate the integration of data
mining into business processes thus leading to optimized business decision-making.
Over the past decade and a half, ERP has come to mean many things – information
systems (IS), enterprise resource management (ERM), enterprise systems (ES) – to many people
– academicians, practitioners, and vendors. The ambiguity surrounding the term ERP allowed the
confusing proliferation of research in alternate fields of study. In this study, ERP is defined as a
broad and universal “umbrella” system that includes all of a firm’s value chain business
applications that are integrated into a firm’s IS infrastructure. This definition of ERP
encompasses and focuses attention on two broad streams of research that have emerged over the
years – ERP as an IT system, and ERP as a management system. The “ERP as an IT system”
research stream focuses on implementation and maintenance issues (Jacobs and Bendoly, 2003).
The challenges involved in getting the system up and running dominate this research area. The
“ERP as a management system” research stream focuses on operational and usage issues (Jacobs
and Bendoly, 2003). The strategic use of the ERP system and its impact on business performance
dominate this research area.
The well publicized failures and delays associated with ERP deployments has directed
most research efforts at systems issues such as configuration, design/redesign of business
processes, maintenance, customization, and upgrades. The bulk of research in this area is
dominated by descriptive and case studies, with empirical and modeling studies gaining
prominence in the past few years only. There is a paucity of research in the managerial use of
257
ERP systems to improve business performance. There are not many studies that have evaluated
the usage of ERP on business activities such as inventory management and on-time delivery.
There are yet fewer studies that have addressed the impact of ERP on performance parameters
such as customer satisfaction and competitive advantage. This research study bridges the gap
between the systems and managerial considerations of ERP. This study addresses system issues
such as the optimal set of modules to implement and the CSFs that facilitate deployment. Such
system issues in turn are linked to managerial issues such as which module or holistic ERP
system deployments lead to improvements in various business activities and what CSFs firms
should focus on to improve the performance of various modules or the holistic ERP system. Such
a consideration of system and managerial issues in tandem underscores the importance of
aligning ERP system deployments with evolving business needs to maximize performance
benefits.
Limitations of the Study
Some caution should be exercised when interpreting the results of this study. The cross-
sectional design of the study precludes casual statements and only indicates that a correlation
exists between ERP systems, CSFs, and changes in performance. There are also many additional
possible predictors of changes in performance. The sampled population was composed
predominantly of firms in the automotive sector (21.7%), therefore, the findings may not be
equally generalizable to other industries. A global ERP system implementation model was
developed and field-tested in India; therefore, the findings may not be generalizable across other
developing as well as developed countries. This study examined ERP system implementations in
the Indian production environment. Service firms may place a different emphasis on various ERP
258
system modules and performance measures; therefore, the generalizability of the study’s findings
may not be fully applicable to them.
There is a possibility of systematic bias due to the use of self-reporting as a means to
gather data. Many respondents reported negative outcomes from their ERP implementations,
which suggest that their answers were not biased. Future research, however, could benefit from
the obtainment of more objective data. The majority of the respondents were information
technology/systems managers (86.2%) and managers from other areas in the business unit may
have a different perspective on their ERP system implementation. In the context of Indian ERP
system implementations, however, discussions with a cross-section of the respondents suggests
that most of them possess a managerial background and had been drafted for spearheading the
ERP system deployment. Future research could benefit from data obtained from a cross-section
of managers across different intra and inter organizational levels as well as work areas.
Suggestions for Future Research
Future research should consider the use of longitudinal designs to capture the lagged
effects between ERP system fine-tuning as well as upgradations, and increased performance. The
support for the model relationships tested in this cross-sectional study provide a priori
justification for the conduct of a longitudinal study. Data gathered through the ERP system pre-
implementation, implementation, and post-implementation phases would provide a good
indication of the sequence of module implementation. The data would also identify which
module components need to be integrated and what CSFs are to be focused on and in what stage
of the implementation process. Longitudinal studies would help examine which ERP system
configurations are suitable in different types of business environments and how firms can adapt
their ERP systems to changes in business conditions.
259
There has been an increase in the number of module offerings from ERP vendors owing
to the relative newness of the ERP field, the rapid rise in ERP technologies, and delivery
mechanisms. Future research could help identify ERP system configurations as firms evolve into
supply chains and compete and collaborate with other supply chains. The performance measures
used in this study are not exhaustive but represent a good mix of informational, transactional,
and organizational measures. Developing more objective and quantifiable measures that link the
firm’s internal and external information flows is needed to test to test the effectiveness of the
overall ERP configuration of the firm. The CSFs used in this study represent a well balanced mix
of managerial, technical, and organizational measures. Future research could help identify CSF
measures that take into account those factors that are critical to suppliers and customers as the
firm’s ERP system is extended across the supply chain(s).
Future research could collect data from multiple sources within the firm as well as across
the supply chain. This gathering of data across multiple managerial levels would enable the
investigation of linkages among the module components that support the information flow
relating to intra-firm as well as inter-firm activities. The additional use of archival data besides
the self-report data would enable confirmation of the study’s findings. This study used a global
ERP system implementation model and field-tested it in a developing country. This model can be
validated by replicating the study in a developed country. This validation would help ERP
implementers across the world holistically manage their ERP system deployments and derive
maximum benefits from their ERP systems.
Summary
This study provides a theoretical framework and empirical evidence for ERP researchers.
This study synthesized previous research to identify the composition of ERP systems, CSFs to
260
facilitate the implementation process, and performance measures to evaluate the benefits that
accrue from deployments. The study’s findings open up a new line of research into the systemic
integration of ERP systems. Analysis of the findings suggests that more variance is explained by
holistic implementation statuses than individual modules. The varying interactions of CSFs with
different implementation statuses and their differential impacts on performance suggest that ERP
researchers need to further explore these interaction relationships.
This study used Galbraith’s information processing theory as a framework to develop and
field-test a global ERP system implementation model. The findings validate the model and
provide a socio-technical foundation for explaining the relationships between the integration of
ERP systems and performance. Future research could explore these relationships in the context
of extended ERP deployments as firms increasingly encounter business environments where
supply chain competition, collaboration, and outsourcing are becoming the norm. Academicians
and practitioners can thus leverage the information presented in this research study to enhance
their understanding of conceptual and system-oriented ERP system issues, optimize their ERP
system implementations, and hence maximize the returns from their ERP systems.
261
APPENDIX A
PRE-NOTICE LETTER
262
Date To Dear …………, I am writing this letter to ask for your help in a cross-country academic research study on enterprise resource planning (ERP) systems conducted by a group of researchers at the University of North Texas (UNT) and the Indian Institute of Management Bangalore (IIMB). You are part of a carefully selected sample of production firms in India that have been asked to assist in this survey and we appreciate your assistance. A few days from now, I will be mailing you a request to fill out a brief questionnaire that seeks information on your ERP system implementation (packaged vendor system or home-grown/in-house developed system or hybrid system). We will be using the survey data to test a global ERP system implementation model that examines the relationships between the relative contributions of ERP system modules, critical success factors, and differential changes in firm performance. This study is an important one, as we believe that our results will enhance your understanding of conceptual and system oriented ERP issues, help optimize your ERP system implementation, and will enable you to maximize the returns from your ERP system. The questionnaire has been designed to specifically collect the information needed for this study and to minimize the amount of time required to complete it. We anticipate that the questionnaire will take about 25 to 30 minutes for you to complete. Your answers to the survey will be kept strictly confidential (kindly do not give your name and contact details in the questionnaire or the mailing envelope if you wish your responses to be completely anonymous). The names of participating firms and individuals will not be released. Only aggregate results from the answers of the participating firms may be published. I am writing this in advance because we have found many people like to know ahead of time that they will be contacted. Thank you for your time and consideration. It is only with the generous help of people like you that our research can be successful. Sincerely, Prof. Arun Madapusi Department of Management College of Business Administration University of North Texas Denton, Texas 76203, USA Telephone Number (US & India) Email Id P.S. I will be glad to provide you with a copy of the executive summary of our study’s results as a way of saying thanks.
263
APPENDIX B
FIRST WAVE MAILING PACKET
264
Date To Dear …………, I am writing this letter to ask for your help in a survey study on enterprise resource planning (ERP) systems conducted by a group of researchers at the University of North Texas (UNT) and the Indian Institute of Management Bangalore (IIMB). This study is part of a multinational research project designed to understand the relationship between the relative contributions of ERP system modules, critical success factors, and differential changes in firm performance. I believe that our research team can use the survey results to help firms enhance their understanding of conceptual and system oriented ERP issues. Your firm is part of a carefully selected sample of production firms considered among the most progressive Indian firms in understanding and adopting ERP systems (packaged vendor system or home-grown/in-house developed system or hybrid system). Though participation in this study is voluntary, in order for the results to truly represent an evaluation of ERP system implementations, it is important that the questionnaire attached to this letter be completed fully. The questionnaire should take about 25 to 30 minutes to complete and the responses generally consist of circled items and a few short responses. I have enclosed a stamped, self-addressed envelope to expedite the return of your completed questionnaire. Your answers to the survey will be kept strictly confidential (kindly do not give your name and contact details in the questionnaire or the mailing envelope if you wish your responses to be anonymous). The names of participating firms and individuals will not be released. Only aggregate results from the answers of the participating firms may be published. I deeply appreciate your cooperation and request your response preferably within two weeks to enable our research team to successfully complete this phase of the research project. As a small token of appreciation for your help, I would be glad to provide you with a copy of the executive summary of the study’s results as soon as our research team completes its data analysis. If you have any questions about this study please feel free to contact me. There are no foreseeable risks involved in this study. By completing this survey you are agreeing to participate in this study. If you have any questions about the study, you may contact Prof. Arun Madapusi at Email Id (Telephone Number) or Prof. Richard E. White at Email Id (Telephone Number). This research study has been reviewed and approved by the UNT Institutional Review Board (IRB). The UNT IRB can be contacted at (Telephone Number) with any questions regarding your rights as a research subject. Sincerely, Prof. Arun Madapusi Department of Management College of Business Administration University of North Texas Denton, Texas 76203, USA Telephone Numbers (USA & India) Email Id
265
Research Project on Enterprise Resource Planning (ERP) Systems
University of North Texas, College of Business Administration, Department of Management
Denton, Texas 76203, USA. &
Indian Institute of Management Bangalore Bannerghatta Road, Bangalore 560 076, Karnataka, India.
General Instructions
1. The purpose of this survey is to assess the changes in performance that result from the implementation of
enterprise resource planning (ERP) systems. Most of the questions in this survey are self-explanatory and follow a standard format that allows you to provide answers in a short period of time. If your business unit has not implemented an ERP system kindly discard this questionnaire.
2. Some questions ask you to check a line or circle a response and others ask for specific information. There
are no ‘right’ or ‘wrong’ answers. Different firms respond differently to similar situations and our goal is to understand these differences.
3. There is a separate page of definitions of various modules typically comprising the ERP system enclosed
along with this questionnaire. It may be convenient for you to place this ERP system modules definitions page alongside the questionnaire as you answer the questions.
4. This questionnaire consists of 9 pages with a total of 20 questions. Please answer all questions as
accurately as you can.
5. Your answers to the survey will be kept strictly confidential. The names of participating firms and individuals will not be released. Only aggregate results from the answers of the participating firms will be published.
6. Please return the completed questionnaire in the enclosed self-stamped envelope - if possible within two
weeks.
7. Your cooperation is greatly appreciated.
Please return the completed questionnaire to (stamped self-addressed envelope enclosed): Prof. Arun Madapusi / Prof. D. Krishna Sundar ERP Centre Indian Institute of Management Bangalore Bannerghatta Road, Bangalore 560 076 Karnataka I will be happy to clarify and answer any questions that you may have. Please contact: Prof. Arun Madapusi (Project Coordinator) Telephone Numbers (US & India) Email Id
266
Enterprise Resource Planning (ERP) Systems Survey
All the questions in this questionnaire refer to a business unit. A business unit may be an overall corporation, a company (within a corporation), a group (several divisions), a division, or a plant depending upon your position and the way your company is organized. A business unit is an entity that compiles financial statements such as balance sheet, profit and loss statement, etc. Please answer this questionnaire consistently with respect to that part of the business unit about which you are most familiar with and that you know the best. Please try to complete all the sections of the questionnaire even if your ERP implementation is still in process. Kindly base your answers on current ERP status and not on anticipated future results.
_____ 1. less than 5 crores _____ 2. greater than 5 crores but less than 100 crores _____ 3. greater than 100 crores but less than 250 crores _____ 4. greater than 250 crores but less than 500 crores _____ 5. greater than 500 crores but less than 1000 crores _____ 6. greater than 1000 crores 4. PPlleeaassee iinnddiiccaattee tthhee ppeerrcceennttaaggee ooff yyoouurr bbuussiinneessss uunniitt’’ss ssaalleess tthhaatt iiss ggeenneerraatteedd ffrroomm mmaannuuffaaccttuurriinngg aanndd sseerrvviiccee rreessppeeccttiivveellyy ((cchheecckk oonnee oorr bbootthh;; ttoottaall sshhoouulldd aadddd uupp ttoo 110000%%)).. ____ 1. Manufacturing …… __________ % ____ 2. Service …………… __________ % 5. BBuussiinneessss uunniitt cchhaarraacctteerriissttiiccss ((cchheecckk oonnee oorr mmoorree aass aapppplliiccaabbllee ffoorr eeaacchh ooff tthhee tthhrreeee bbuussiinneessss uunniitt cchhaarraacctteerriissttiiccss)).. (i) _____ 1. Unionized (ii) _____ 1. Private Sector (iii) _____ 1. Multinational (foreign origin) _____ 2. Non-unionized _____ 2. Public Sector _____ 2. Indian (Indian origin) _____ 3. Both _____ 3. Other - please specify _____ _____ 3. Other - please specify_____
267
6. MMeemmbbeerrsshhiipp ooff PPrrooffeessssiioonnaall AAssssoocciiaattiioonnss ((cchheecckk oonnee)).. _____ 1. Confederation of Indian Industry (CII) Member _____ 2. Member of any association affiliated to the CII - please specify ______________________________________________ _____ 3. Other - please specify _______________________________________________________________________________ 7. DDooeess yyoouurr bbuussiinneessss uunniitt ‘‘mmaakkee ttoo oorrddeerr’’,, ‘‘mmaakkee ttoo ssttoocckk’’,, oorr ssoommee ccoommbbiinnaattiioonn ooff bbootthh?? ((cchheecckk oonnee oorr bbootthh;; ttoottaall sshhoouulldd aadddd uupp ttoo 110000%%)).. ____ 1. Make to order …… _____ % ____ 2. Make to stock …… _____ % 8. PPeerrcceennttaaggee ooff yyoouurr bbuussiinneessss uunniitt’’ss ssaalleess pprroodduucceedd bbyy ttyyppee ooff pprroodduuccttiioonn ffllooww ((cchheecckk oonnee oorr mmoorree;; ttoottaall sshhoouulldd aadddd uupp ttoo 110000%%)).. _____ 1. Project (Products/units are of different size and complexity and hence require special planning and control. The material flow pattern may be different for each product/unit.)……………………_________ % _____ 2. Job shop (Products/units are produced in small batches in production runs lasting a few hours
or days with different equipment setups generally required for each batch. The material flow pattern may be different for each product/unit.)……………………………………………………__________ %
_____ 3. Batch (Each product/unit is produced in moderately large batches in production runs lasting several days or weeks with different equipment setups generally required between batches. The material flow pattern may be same or similar for each product/unit.) ……………………….. __________ %
_____ 4. Repetitive {Products/units are similar or standardized and are mostly mass produced (assembly line). The material flow pattern is mostly the same for all products/units.}..………………….…. __________ %
_____ 5. Flow process {Mostly standard products are mass produced (almost totally automated processing undertaken). The material flow is continuous.} …………………………………...…. __________ %
_____ Ramco, _____ Others - please specify). _____ 2. Best-of-Breed ERP system from multiple ERP system vendors ( _____ SAP, _____ Oracle/People Soft, _____ SSA Global/Baan, _____ Ramco, _____ Others - please specify). _____ 3. Totally in-house developed ERP system.
268
Enclosed with this questionnaire is a separate page of definitions of various ERP modules typically comprising the ERP system. Please read each definition for use in answering questions concerning ERP and your business unit. It may be convenient for you to place this ERP system module definitions page alongside the questionnaire as you answer question 11 below. 11. IIMMPPLLEEMMEENNTTAATTIIOONN SSTTAATTUUSS OOFF EEAACCHH EERRPP MMOODDUULLEE IINN YYOOUURR BBUUSSIINNEESSSS UUNNIITT.. Please circle the appropriate responses for this question using the following scale:
NI = Not Implemented 0 to < 1 = Implementation started within the last year 1 to < 3 = Implementation started 1 or more but less than 3 years ago 3 to < 5 = Implementation started 3 or more but less than 5 years ago 5+ = Implementation started 5 or more years ago
ERP Modules Implementation Status of ERP Modules 1. Financials (FI) NI 0 to < 1 1 to < 3 3 to < 5 5+ 2. Controlling (CO) NI 0 to < 1 1 to < 3 3 to < 5 5+ 3. Plant Maintenance (PM) NI 0 to < 1 1 to < 3 3 to < 5 5+ 4. Materials Management (MM) NI 0 to < 1 1 to < 3 3 to < 5 5+ 5. Production Planning (PP) NI 0 to < 1 1 to < 3 3 to < 5 5+ 6. Project System (PS) NI 0 to < 1 1 to < 3 3 to < 5 5+ 7. Sales and Distribution (SD) NI 0 to < 1 1 to < 3 3 to < 5 5+ 8. General Logistics (LO) NI 0 to < 1 1 to < 3 3 to < 5 5+ 9. Quality Management (QM) NI 0 to < 1 1 to < 3 3 to < 5 5+ 10. Human Resources (HR) NI 0 to < 1 1 to < 3 3 to < 5 5+ 11. Supply Chain Management (SCM) NI 0 to < 1 1 to < 3 3 to < 5 5+ 12. Customer Relationship Management (CRM) NI 0 to < 1 1 to < 3 3 to < 5 5+ 13. E-Commerce (E-Com) NI 0 to < 1 1 to < 3 3 to < 5 5+ 14. Advanced Planner and Optimizer/ NI 0 to < 1 1 to < 3 3 to < 5 5+ Advanced Planner and Scheduler (APO/APS) 12. Kiinnddllyy ssppeecciiffyy tthhee ccoommppoonneennttss oorr ssuubb--mmoodduulleess iimmpplleemmeenntteedd uunnddeerr eeaacchh ooff tthhee EERRPP mmoodduulleess.. _____ 1. Financials (FI). The components implemented are: ________________________________________________________ _____ 2. Controlling (CO). The components implemented are:_______________________________________________________ _____ 3. Plant Maintenance (PM). The components implemented are: ________________________________________________ _____ 4. Materials Management (MM). The components implemented are: ____________________________________________ _____ 5. Production Planning (PP). The components implemented are: _______________________________________________ _____ 6. Project System (PS). The components implemented are: ____________________________________________________ _____ 7. Sales and Distribution (SD). The components implemented are: ______________________________________________ _____ 8. General Logistics (LO). The components implemented are: _________________________________________________ _____ 9. Quality Management (QM). The components implemented are: ______________________________________________ _____ 10. Human Resources (HR). The components implemented are: ________________________________________________ _____ 11. Supply Chain Management (SCM). The components implemented are: _______________________________________ _____ 12. Customer Relationship Management (CRM). The components implemented are: _______________________________ _____ 13. E-Commerce (E-Com). The components implemented are: ________________________________________________ _____ 14. Advanced Planner and Optimizer/Advanced Planner and Scheduler (APO/APS). The components implemented are: _________________________________________________________________________________________________ _____ 15. Other Module(s) - please specify _____________________________________________________________________
13. CCHHAANNGGEESS IINN TTHHEE FFOOLLLLOOWWIINNGG PPEERRFFOORRMMAANNCCEE MMEEAASSUURREESS IINN YYOOUURR BBUUSSIINNEESSSS UUNNIITT TTHHAATT AARREE AATTTTRRIIBBUUTTAABBLLEE TTOO YYOOUURR EERRPP SSYYSSTTEEMM.. Please circle the appropriate responses for this question using the following scale: D = Disagree MD = Mostly Disagree SD = Somewhat Disagree N = Neither Agree or Disagree SA = Somewhat Agree MA = Mostly Agree A = Agree Change in Performance Measures Change Attributable to the ERP System 1. Inventory Management (lower inventory levels, D MD SD N SA MA A higher inventory levels, better control over inventory, etc.) 2. Information Quality (accurate and reliable D MD SD N SA MA A information for strategic planning, operational control, etc.) 3. On-time Delivery (improved order management/ D MD SD N SA MA A order cycle, reduced delivery lead times, etc.) 4. Standardization (streamlining of business processes D MD SD N SA MA A and business unit facilities, improved business flexibility, etc.) 5. Profitability (increased efficiency, increased profits, D MD SD N SA MA A improved productivity, etc.) 6. Return on Investment (returns to the business unit D MD SD N SA MA A from the ERP system) 7. Information Availability (easier access and faster D MD SD N SA MA A retrieval of information) 8. User Satisfaction (precise information availability, D MD SD N SA MA A user friendly system, output available in useful format, etc.) 9. Customer Satisfaction (improved customer relations D MD SD N SA MA A and responsiveness, increased interaction with customers, etc.) 10. Competitive Advantage (new market opportunities D MD SD N SA MA A identified, improved business unit agility, enhanced competitiveness, etc.) 14. OOvveerraallll,, bbaasseedd oonn yyoouurr eexxppeerriieennccee wwiitthh EERRPP ssyysstteemmss iimmpplleemmeennttaattiioonn,, wwhhaatt iiss yyoouurr vviieeww ooff tthhee ssuucccceessss ooff yyoouurr ffiirrmm’’ss EERRPP ssyysstteemm?? _____ 1. Disappointing (achieved very little) _____ 3. Successful (achieved most goals) _____ 2. Very Successful (went beyond expectations) _____ 4. Other - please specify ____________________
Dis
agre
e
Mos
tly
Dis
agre
e
Som
ewha
t D
isag
ree
Nei
ther
A
gree
or
Dis
agre
e
Som
ewha
t A
gree
Mos
tly
Agr
ee
Agr
ee
270
15. FFAACCTTOORRSS CCRRIITTIICCAALL TTOO SSUUCCCCEESSSSFFUULL EERRPP SSYYSSTTEEMM IIMMPPLLEEMMEENNTTAATTIIOONN IINN YYOOUURR BBUUSSIINNEESSSS UUNNIITT.. Please circle the appropriate responses for this question using the following scale: D = Disagree MD = Mostly Disagree SD = Somewhat Disagree N = Neither Agree or Disagree SA = Somewhat Agree MA = Mostly Agree A = Agree Critical Factors Impact of Critical Factors on ERP Implementation 1. Top Management Support for the ERP system. a. Top management has invested the time needed to D MD SD N SA MA A understand how ERP will benefit the business unit. b. The need for long-term ERP support resources is D MD SD N SA MA A recognized by top management. c. Top management mandates that ERP requirements D MD SD N SA MA A have priority over unique functional concerns. d. Top management has clearly defined the ERP D MD SD N SA MA A project’s business goals. e. All levels of management support the overall goals D MD SD N SA MA A of the ERP project. f. A cross-functional steering committee periodically D MD SD N SA MA A reviews the ERP project’s progress. 2. Planning the implementation of the ERP system. a. We constantly review our ERP system capabilities D MD SD N SA MA A against our business goals. b. ERP system plans are redesigned as required to D MD SD N SA MA A meet evolving conditions. c. Written guidelines exist to structure strategic ERP D MD SD N SA MA A planning in our business unit. d. Strategic ERP planning includes inputs from all D MD SD N SA MA A functional areas. 3. User Support for the ERP system. a. Employees understand how they fit into the new D MD SD N SA MA A ERP defined business processes. b. Management actively works to alleviate employee D MD SD N SA MA A concerns about the introduction of the ERP system. c. An ERP support group is available to answer D MD SD N SA MA A concerns about ERP job changes. d. The change readiness of employees impacted by the D MD SD N SA MA A ERP system is regularly assessed. e. Management actively ensures user participation and D MD SD N SA MA A involvement to foster user support for the ERP system.
Dis
agre
e
Mos
tly
Dis
agre
e
Som
ewha
t D
isag
ree
Nei
ther
A
gree
or
Dis
agre
e
Som
ewha
t A
gree
Mos
tly
Agr
ee
Agr
ee
271
1155.. FFAACCTTOORRSS CCRRIITTIICCAALL TTOO SSUUCCCCEESSSSFFUULL EERRPP SSYYSSTTEEMM IIMMPPLLEEMMEENNTTAATTIIOONN IINN YYOOUURR BBUUSSIINNEESSSS UUNNIITT ((ccoonnttiinnuueedd)).. 4. Project Management for the ERP system implementation. a. The tasks to be performed during the ERP project D MD SD N SA MA A are clearly defined. b. There is a formal management process to track D MD SD N SA MA A external consultant activities. c. Project tasks are reviewed on a periodic basis. D MD SD N SA MA A d. The ERP project leader is experienced in project D MD SD N SA MA A management. e. All ERP project changes are clearly documented. D MD SD N SA MA A 5. Training for effective ERP system use. a. Specific user training needs were identified early D MD SD N SA MA A in the implementation. b. A formal training program has been developed to D MD SD N SA MA A meet the requirements of the ERP system users. c. Training materials target the entire business unit D MD SD N SA MA A task and not just the ERP screens and reports. d. Employees are tracked to ensure that they have D MD SD N SA MA A received the appropriate ERP system training. e. ERP system training review sessions are D MD SD N SA MA A scheduled on an ongoing basis. 6. Learning to enhance ERP system capabilities. a. Benchmarking is used to identify cutting-edge D MD SD N SA MA A ERP techniques. b. Cross-functional groups meet regularly to discuss D MD SD N SA MA A new uses for the ERP system. c. ERP improvement suggestions are regularly D MD SD N SA MA A collected from multiple employee levels. d. ERP experimentation is encouraged even if the D MD SD N SA MA A proposed improvements are unsuccessful. 7. Implementation Strategy for roll-out of the ERP system. a. A single go-live date was used to roll-out the ERP D MD SD N SA MA A system across our business unit (‘big bang’ strategy). b. A single go-live date was used to roll-out a sub-set D MD SD N SA MA A of modules across our business unit (‘mini big-bang’ strategy). c. Different modules were ‘phased-in’ on different D MD SD N SA MA A live dates across our business unit (‘phased-in module’ strategy). d. Different modules were ‘phased-in’ by site/location D MD SD N SA MA A across our business unit (‘phased-in site’ strategy).
Dis
agre
e
Mos
tly
Dis
agre
e
Som
ewha
t D
isag
ree
Nei
ther
A
gree
or
Dis
agre
e
Som
ewha
t A
gree
Mos
tly
Agr
ee
Agr
ee
272
1155.. FFAACCTTOORRSS CCRRIITTIICCAALL TTOO SSUUCCCCEESSSSFFUULL EERRPP SSYYSSTTEEMM IIMMPPLLEEMMEENNTTAATTIIOONN IINN YYOOUURR BBUUSSIINNEESSSS UUNNIITT ((ccoonnttiinnuueedd)).. 8. ERP System-Business Alignment. a. The processes embedded in the ERP system D MD SD N SA MA A correspond to our business practices. b. ERP data items correspond to those used in our D MD SD N SA MA A business documents. c. The user interface in the ERP system is well designed D MD SD N SA MA A to meet our business needs. d. Significant time and effort is required to customize D MD SD N SA MA A the ERP system to our business practices. e. Significant time and effort is required to re-engineer D MD SD N SA MA A our business practices to conform to the ERP system. 9. Support from Consultants for the ERP system implementation. a. Involvement of external consultants in the ERP D MD SD N SA MA A system implementation is an ongoing effort. b. The role of external consultants should be phased D MD SD N SA MA A out by capturing and transferring their expertise to the in-house team. c. External consultants help streamline our D MD SD N SA MA A implementation effort and achieve quicker ERP project success. d. External consultants were changed during the course D MD SD N SA MA A of the ERP project. 10. Implementation Team support for the ERP system implementation. a. The implementation team has the ability to D MD SD N SA MA A implement, maintain, and upgrade the ERP system. b. The implementation team actively builds relationships D MD SD N SA MA A with business managers. c. The implementation team offers suggestions on D MD SD N SA MA A how the ERP system can be used to achieve business goals. d. The implementation team is responsive to end-user D MD SD N SA MA A needs. 11. Data Accuracy in the ERP system. a. Data integrity in the ERP system affects the D MD SD N SA MA A efficiency of our operations and the quality of our business decisions. b. Data integrity requires awareness and control of D MD SD N SA MA A dirty data right from the pre-implementation stage of the ERP system. c. Maintaining data integrity is an ongoing process D MD SD N SA MA A that needs to be ensured by all employees. d. All employees understand the concept and the value D MD SD N SA MA A of integrated data available from the ERP system.
Dis
agre
e
Mos
tly
Dis
agre
e
Som
ewha
t D
isag
ree
Nei
ther
A
gree
or
Dis
agre
e
Som
ewha
t A
gree
Mos
tly
Agr
ee
Agr
ee
273
1155.. FFAACCTTOORRSS CCRRIITTIICCAALL TTOO SSUUCCCCEESSSSFFUULL EERRPP SSYYSSTTEEMM IIMMPPLLEEMMEENNTTAATTIIOONN IINN YYOOUURR BBUUSSIINNEESSSS UUNNIITT ((ccoonnttiinnuueedd)).. 12. The role of Communication in the ERP system implementation process. a. Open and honest communication throughout the D MD SD N SA MA A business unit facilitates the ERP system implementation process. b. Communication is an ongoing process among all D MD SD N SA MA A employees throughout the ERP system project. c. Managing user input in the communication process D MD SD N SA MA A results in greater understanding of organizational needs and quicker acceptance of the ERP system. 13. The role of Organizational Culture in the ERP system implementation process. a. It is very easy for my coworkers to access the ERP D MD SD N SA MA A system to see the status of my work performance. b. The management is only interested in employees D MD SD N SA MA A getting work done using the installed ERP system rather than addressing their concerns. c. Job descriptions and task procedures in our business D MD SD N SA MA A unit is highly specific and detailed. d. The ERP system enables tight control by providing D MD SD N SA MA A very reliable information on how well or badly employees do their work. e. The ERP system has enabled our business unit to be D MD SD N SA MA A more market-driven and customer-oriented. f. The ERP system has enabled me to more clearly D MD SD N SA MA A identify myself with my job. 14. The role of National Culture in the ERP system implementation process. a. The ERP system facilitates close supervision of D MD SD N SA MA A employees to ensure that they conform to standard work procedures established. b. Management relies a great deal on me to ensure D MD SD N SA MA A proper operational processing when I use the ERP system. c. The ERP system has resulted in changes in job D MD SD N SA MA A roles that tends to make employees work more individually and not in groups. d. The short-term results obtained from ERP system D MD SD N SA MA A implementation is more valuable than it’s long-term results. e. I do not mind my increased workload resulting D MD SD N SA MA A from the ERP system implementation as it would prove beneficial to my career.
Dis
agre
e
Mos
tly
Dis
agre
e
Som
ewha
t D
isag
ree
Nei
ther
A
gree
or
Dis
agre
e
Som
ewha
t A
gree
Mos
tly
Agr
ee
Agr
ee
274
16. IINNTTEEGGRRAATTIIOONN OOFF EERRPP SSYYSSEEMM IINN YYOOUURR BBUUSSIINNEESSSS UUNNIITT.. Please circle the appropriate responses for this question using the following scale: D = Disagree MD = Mostly Disagree SD = Somewhat Disagree N = Neither Agree or Disagree SA = Somewhat Agree MA = Mostly Agree A = Agree a. Internal coordination of business activities has D MD SD N SA MA A increased with implementation of more ERP modules. b. The implementation of more ERP modules has D MD SD N SA MA A increased the business unit’s performance benefits. c. The fine-tuning of the ERP system over time has D MD SD N SA MA A increased the business unit’s performance benefits. d. The implementation of more ERP modules has D MD SD N SA MA A increased the external coordination of business activities with customers and suppliers.
Personal 17. PPlleeaassee pprroovviiddee ddeettaaiillss ooff yyoouurr wwoorrkk eexxppeerriieennccee:: (i) Total number of years of work experience _____ yrs (ii) Number of years with this organization _____ yrs 18. WWhhiicchh ooff tthhee ffoolllloowwiinngg bbeesstt rreepprreesseennttss yyoouurr ccuurrrreenntt ppoossiittiioonn wwiitthh tthhee oorrggaanniizzaattiioonn?? ((cchheecckk oonnee)) _____ 1. Top Management (top managers) _____ 4. Team Leaders (facilitators) _____ 2. Middle Management (middle managers) _____ 5. Production Line _____ 3. Lower level Management (first line managers ) _____ 6. Other - please specify ____________________ 19. WWhhaatt iiss yyoouurr ccuurrrreenntt aarreeaa ooff wwoorrkk?? ((cchheecckk oonnee)) _____ 1. Finance _____ 4. Marketing _____ 2. Engineering _____ 5. Information Technology/Systems _____ 3. Production _____ 6. Other - please specify ____________________ 20. PPlleeaassee iinnddiiccaattee tthhee hhiigghheesstt lleevveell ooff eedduuccaattiioonn yyoouu hhaavvee ccoommpplleetteedd ((cchheecckk oonnee)):: _____ 1. Vocational _____ 2. College: ___ (i) bachelors ___ (ii) masters ___ (iii) doctorate
Dis
agre
e
Mos
tly
Dis
agre
e
Som
ewha
t D
isag
ree
Nei
ther
A
gree
or
Dis
agre
e
Som
ewha
t A
gree
Mos
tly
Agr
ee
Agr
ee
275
Thank you for taking the time to complete this questionnaire. Your assistance in providing this information is deeply appreciated. If there is anything else you would like to tell us about this survey, please do so either separately on a blank sheet or in the body of the questionnaire itself, whichever is convenient. In the event the enclosed self-stamped return envelope is misplaced please return the completed questionnaire to the following address: Prof. Arun Madapusi / Prof. D. Krishna Sundar ERP Centre Indian Institute of Management Bangalore Bannerghatta Road, Bangalore 560 076 Karnataka I would be glad to provide you with a copy of the executive summary of the study’s results. Please give your name and address below or simply attach your business card in the return envelope so that I can mail/fax the study’s results to you or email me at (Email Id) and I can send the same to you as an attachment. Your name: ______________________________________ Title: ______________________________________ Company: ______________________________________ Address: ______________________________________ ______________________________________ ______________________________________ Telephone: ______________________________________ Fax: ______________________________________ Email: ______________________________________
276
Definitions Enterprise Resource Planning System (ERP) Modules
Some terms used in the questionnaire are defined here to make it convenient for you to refer to them. Financials (FI): This module constitutes the operational aspects of the general accounting and financial information for a business unit. Controlling (CO): This module represents a business unit’s cost structures and the factors that influence them. Plant Maintenance (PM): This module takes care of the maintenance of plant systems and supports graphical representations, connection to geographic information systems, and detailed diagrams. Materials Management (MM): This module comprises all activities related with material acquisitions such as purchasing, inventory, and warehouse. Production Planning (PP): This module addresses the different phases, tasks, and methodologies used in the planning of production and the process of production itself. Project System (PS): This module handles all aspects of activities, resource planning, and budgeting of complex tasks. Sales and Distribution (SD): This module enables the management of all sales and distribution activities such as ordering, sales leads, promotions, competition, marketing, call tracking, planning, mail campaigns, and billing. General Logistics (LO): This module contains the tools and reports necessary to analyze and manage the status in supply chain forecasts. Quality Management (QM): This module handles tasks involved in quality planning, inspection and control, and compliance with international quality standards to ensure that a business unit employs a unified approach to total quality management for all its business areas. Human Resources (HR): This module includes all business processes required to efficiently manage a business unit’s human resources needs such as personnel, payroll, recruiting, time management, training, benefits, workforce deployment and analytics, and self-service delivery. Supply Chain Management (SCM): This module extends the scope of ERP systems to include planning and execution capabilities to manage inter-business unit supply chains operations. Customer Relationship Management (CRM): This module extends the scope of ERP systems to include automating functions such as sales, marketing, customer service, and collaborative order management. E-Commerce (E-Com): This module facilitates access to ERP processes and data from anywhere in the world through web-enabled ERP systems and portals. Advanced Planner and Optimizer/Advanced Planner and Scheduler (APO/APS): This module extends ERP systems to enable handling of complex processes such as shelf-life considerations, alternate routing, intermediate storage accounting, changeover light matrixes, clean-down time considerations, and fixed capacity storage constraints.
277
APPENDIX C
FIRST WAVE THANK YOU/REMINDER NOTE
278
Date To Dear …………, Last week a questionnaire seeking to evaluate your ERP system implementation was mailed to you. Your firm’s name was carefully chosen from a selected sample of production firms considered among the most progressive Indian firms in understanding and adopting ERP systems (packaged vendor system or home-grown/in-house developed system or hybrid system). If you have already completed and returned the questionnaire to us, please accept our sincere thanks. If not, we request you to do so at the earliest. We are especially grateful for your help because it is only by asking people like you to share your ERP implementation experiences that we can enhance our holistic understanding of ERP system concepts and associated implementation issues and benefits. If you did not receive the questionnaire, or it was misplaced, please call or email me and we will get another one in the mail to you today. Sincerely, Arun Madapusi Prof. Arun Madapusi Department of Management College of Business Administration University of North Texas Denton, Texas 76203, USA Telephone Numbers (USA & India) Email Id
279
APPENDIX D
SECOND WAVE MAILING INTRODUCTORY LETTER
280
Date To Dear …………, About five weeks back I had written to you seeking your participation in our survey study on the evaluation of enterprise resource planning (ERP) system implementations (packaged vendor system or home-grown/in-house developed system or hybrid system). In case our questionnaire has not reached you, our research team has enclosed a replacement along with a stamped self-addressed envelope for returning the questionnaire once you have completed it. If you have already returned the completed questionnaire from our previous mailing, we deeply appreciate your help, and also kindly request you to disregard this letter. If you have not yet returned the completed questionnaire from our first mailing, I request you take this opportunity to mail the same to us. As indicated in our first mailing, this study is part of a multinational research project conducted by a group of researchers at the University of North Texas (UNT) and the Indian Institute of Management Bangalore (IIMB) that is designed to understand the relationship between the relative contributions of ERP system modules, critical success factors, and differential changes in firm performance. I request your kind participation in this study, as I believe that our research team can use the survey results to help firms enhance their understanding of conceptual and system oriented ERP issues, optimize their ERP implementations, and maximize the benefits derived from their ERP systems. I am writing this letter to you again due to the significance that each returned questionnaire has to the usefulness of this study. For the results of our study to truly reflect the evaluation of ERP system implementations, it is essential that our research team obtain completed questionnaires from each of the firms that we are contacting. Your firm is part of a carefully selected sample of production firms considered among the most progressive Indian firms in understanding and adopting ERP systems. Though participation in this study is voluntary, in order for the results to truly represent an evaluation of ERP system implementations, it is important that the questionnaire attached to this email be completed fully. The questionnaire has been specifically designed by our research team to collect information critical to this study and should take about 25 to 30 minutes to complete. Your answers to the survey will be kept strictly confidential (kindly do not give your name and contact details in the questionnaire or the mailing envelope if you wish your responses to be anonymous). The names of participating firms and individuals will not be released. Only aggregate results from the answers of the participating firms may be published. I deeply appreciate your cooperation and request your response preferably within two weeks to enable our research team to successfully complete this phase of the research project. As a small token of appreciation for your help, I would be glad to provide you with a copy of the executive summary of the study’s results as soon as our research team completes its data analysis. If you have any questions about this study please feel free to contact me. There are no foreseeable risks involved in this study. By completing this survey you are agreeing to participate in this study. If you have any questions about the study, you may contact Prof. Arun Madapusi at Email Id (Telephone Number) or Prof. Richard E. White at Email Id (Telephone Number). This research study has been reviewed and approved by the UNT Institutional Review Board (IRB). The UNT IRB can be contacted at (Telephone Number) with any questions regarding your rights as a research subject. Sincerely, Prof. Arun Madapusi Department of Management College of Business Administration University of North Texas Denton, Texas 76203, USA Telephone Numbers (USA & India) Email Id
281
APPENDIX E
SECOND WAVE THANK YOU/REMINDER NOTE
282
Date To Dear …………, Last week a questionnaire seeking to evaluate your ERP system implementation was mailed to you. Your firm’s name was carefully chosen from a selected sample of production firms considered among the most progressive Indian firms in understanding and adopting ERP systems (packaged vendor system or home-grown/in-house developed system or hybrid system). If you have already completed and returned the questionnaire to us, please accept our sincere thanks. If not, we request you to do so at the earliest. We are especially grateful for your help because it is only by asking people like you to share your ERP implementation experiences that we can enhance our holistic understanding of ERP system concepts and associated implementation issues and benefits. If you did not receive the questionnaire, or it was misplaced, please call or email me and we will get another one in the mail to you today. Sincerely, Arun Madapusi Prof. Arun Madapusi Department of Management College of Business Administration University of North Texas Denton, Texas 76203, USA Telephone Numbers (USA & India) Email Id
283
REFERENCES
Adams, B. (2002). Creating Value with an Instant Close. Strategic Finance, 84(3), 48-51.
Ahituv, N., Neumann, S., & Zviran, M. (2002). A System Development Methodology for ERP Systems. Journal of Computer Information Systems, 42(3), 56-67.
Al-Mashari, M., & Zairi, M. (2000). The Effective Application of SAP-R/3: A Proposed
Model of Best Practice. Logistics Information Management, 13(3), 156-166.
Al-Mashari, M., Al-Mudimigh, A., & Zairi, M. (2003). Enterprise Resource Planning: A Taxonomy of Critical Factors. European Journal of Operational Research, 146(2), 352- 364.
AMR Research (2000). AMR Research predicts enterprise application market will reach $78
billion by 2004. Retrieved December 20, 2004 from http://www.amrresearch.com/press/files/99518.asp.
AMR Research (2005). AMR research releases ERP market report showing overall market
growth of 14% in 2004. Retrieved January 20, 2006 from http://www.amrresearch.com/Content/View.asp?pmillid=18358.
Anderson, J.C., & Schroeder, R.G. (1984). Getting Results from your MRP System. Business
Horizons, May/June, 57-64.
Ang, J.S.K., Sum, C.C., & Yeo, L.N. (2000). A Multiple Case-Design Methodology for Studying MRP Success and CSFs. Information & Management, 39, 271-281.
Appelrath, H.J., & Ritter, J. (2000). SAP R/3 Implementation: Methods and Tools. Berlin:
Springer-Verlag.
Ash, C.G., & Burn, J.M. (2003). A Strategic Framework for the Management of ERP- enabled e-Business Change. European Journal of Operational Research, 146(2), 374-387.
Ayers, J. (2001). Is Supply Management the Same as ERP? Information Strategy: The
Executive’s Journal, 17(3), 43-45.
Barker, T., & Frolick, M.N. (2003). ERP Implementation Failure: A Case Study. Information Systems Management, Fall, 43-49.
Beretta, S. (2002). Unleashing the Integration Potential of ERP Systems. Business Process
Management Journal, 8(3) 254-277.
284
Berry, R.W. (1996). An Investigation of the Relationship between World Class Quality System Components and Performance. Doctoral Dissertation, University of North Texas.
Besson, P., & Rowe, F. (2001). ERP Project Dynamics and Enacted Dialogue: Perceived
Understanding, Perceived Leeway, and the Nature of Task-Related Conflicts. Database for Advances in Information Systems, 32(4), 47-66.
Dataquest (2004). Packaged software: multi-factor revival. Retrieved January 20, 2006 from http://www.dqindia.com/dqtop20/2004/ArtIndseg.asp?artid=59645.
Datamonitor (2005). Manufacturing Applications Model. Retrieved January 20, 2006 from
http://www.datamonitor.com/technology. Davenport, T.H. (1998). Putting the Enterprise into the Enterprise System. Harvard Business
Review, 76(4), 121-131.
Davenport, T.H. (2000). The Future of Enterprise System-Enabled Organizations. Information Systems Frontiers, 2(2), 163-180.
Davison, R. (2002). Cultural Complications of ERP. Communications of the ACM, 45(7),
109-111.
De, R. (2004). Manufacturing: Back on the Rebound. Retrieved December 20, 2004 from www.dqindia.com/dqtop20/2004/artdisp.asp?artid=60678.
Dillman, D.A. (1978). Mail and Telephone Surveys: The Total Design Method. New York:
John Wiley & Sons.
Dillman, D.A. (2000). Mail and Internet Surveys: The Tailored Design Method. (2nd. Ed.) New York: John Wiley & Sons.
Drayer, R., & Wight, R. (2002). Getting the most from your ERP system. Supply Chain
Management Review, May/June, 44-52.
Duchessi, P., Schaninger, C.M., Hobbs, D.R., & Pentak, L.P. (1988). Determinants of Success in Implementing Materials Requirement Planning (MRP). Journal of Manufacturing & Operations Management, 1(3), 263-304.
Eisenhardt, K.M (1989). Building Theory from Case Study Research. Academy of Management Research, 14, 532-550.
286
Evgeniou, T. (2002). Information Integration and Information Strategies for Adaptive Enterprises. European Management Journal, 20(5), 486-494.
Ferdows, K., & Meyer, A.D. (1990). Lasting Improvements in Manufacturing Performance: In Search of a New Theory. Journal of Operations Management. 9(2), 168-183.
Flynn, B.B., Schroeder, R.G., & Sakakibara, S. (1990). A Framework for Quality
Management Research and Associated Measurement Instrument. Journal of Operations Management, 11(4), 339-366.
Francalanci, C. (2001). Predicting the Implementation Effort of ERP Projects: Empirical
Evidence on Sap R/3. Journal of Information Technology, 16 (1), 33-48.
Galbraith, J.R. (1973). Designing Complex Organizations. Philippines: Addison-Wesley Publishing Company Inc.
Galbraith, J.R. (1974). Organization Design: An Information Processing View. Interfaces,
4(3), 28-36.
Galbraith, J.R. (1977). Organization Design. Philippines: Addison-Wesley Publishing Company Inc.
Galbraith, J.R. (1994). Competing with Flexible Lateral Organizations. New York: Addison- Wesley Publishing Company, Inc.
Galbraith, J.R. (2000). Designing the Global Corporation. Jossey-Bass Inc.: San Francisco.
Galbraith, J.R. (2002). Designing Organizations: An Executive Guide to Strategy, Structure, and Process. New York: John Wiley & Sons Inc.
Galbraith, J.R., Downey D., & Kates, A. (2002). Designing Dynamic Organizations: A hands-on guide for leaders at all levels. New York: AMACOM.
Galbraith, J.R. Lawler III, E.E., & Associates. (1993). Organizing for the Future: The New Logic of Managing Complex Organizations. Sa Francisco: Jossey-Bass Publishers.
Gartner (2002). Frequently asked questions about ERP II. Retrieved December 20, 2004
from http://www.gartner.com.
Gartner (2003a). Asia Pacific ERP: the road ahead, 2003-2007. Retrieved December 20, 2004 from http://www.gartner.com.
Gartner (2003b). Enterprise application software: winning in the Indian marketplace.
Retrieved December 20, 2004 from http://www.gartner.com.
287
Gefen, D., & Ridings, C.M. (2002). Implementation Team Responsiveness and User Evaluation of Customer Relationship Management: A Quasi-Experimental Design Study of Social Exchange Theory. Journal of Management Information Systems, 19(1), 47-69.
Gefen, D., & Ragowsky, A. (2005). A Multi-level Approach to Measuring the Benefits of an
ERP System in Manufacturing Firms. Information Systems Management, 22(1), 18-25.
Harold, J. E. (1997). Evaluating and Implementing EDI at a Small Electronics Manufacturer. Production and Inventory Management Journal, 38(3), 1-5.
Harrold, D. (2001). How Manufacturing Benefits by Understanding ERP and IT. Control Engineering, January, 26-36.
Hawking, P., & Stein, A. (2004). Revisiting ERP Systems: Benefit Realization. Proceedings of the 37th. Hawaii International Conference on System Sciences, p. 8.
Hayman, L. (2000). ERP in the Internet Economy. Information Systems Frontiers, 2(2), 137- 139.
Hendrickson, D. (2001). Getting more out of ERP. EAI Journal, December, 24-27.
Hernandez, J.A. (1998). The SAP R/3 Handbook. New Delhi: Tata McGraw Hill Publishing Company Limited.
Hitt, L.M., Wu, D.J., & Zhouo, X. (2002). Investment in Enterprise Resource Planning: Business Impact and Productivity Measures. Journal of Management Information Systems, 19(1), 71-98.
Hofstede, G. (1980). Culture's Consequences. Beverly Hills, California: Sage.
288
Hofstede, G., Neuijen, B. Ohayv, D.D., & Sanders, G. (1990). Measuring Organizational Cultures: A Qualitative and Quantitative Study across Twenty Cases. Administrative Science Quarterly, 35(2), 286-316.
Holland, C.P., & Light, B. (1999). A Critical Success Factors Model for ERP
Implementation. IEEE Software, May-June, 30-36. Hong, K.K., & Kim, Y.G. (2001). The Critical Success Factors of ERP Implementation: An
Organizational Fit Perspective. Information & Management, 40(1), 25-40. Hsieh, P.J., & Kleiner, B.H. (1992). New Developments in Inventory and Materials
Management. Logistics Information Management, 5(2), 32-35.
Huang, Z., & Palvia, P. (2001). ERP Implementation Issues in Advanced and Developing Countries. Business Process Management Journal, 7(3), 276-284.
Huck, S.W. (2000). Reading statistics and Research. USA: Adision Wesley Longman Inc.
IDC (2003). Worldwide Packaged Applications Forecast and Analysis, 2002-2007: 2003 Reference Guide. Retrieved December 24, 2004 from http://www.idc.com/getdoc.jsp?containerId=30082.
IDC (2004). IDC Releases Top 10 Vendors in ERP Applications Market; Market
Consolidation Will Continue at Gradual Pace. Retrieved December 24, 2004 from http://www.idc.com/getdoc.jsp?containerId=pr2004_05_05_094804.
IDC India (2003). Competition Intensifies in the Indian ERP Space - Market Expected to Cross 800 Crores by 2006. Retrieved December 24, 2004 from http://www.idcinida.com/pressrel/Show.pressrel.asp?prpath=PRI20020058.htm.
Jacobs, F.R., & Bendoly, E. (2003). Enterprise Resource Planning: Developments and directions
for operations management research. European Journal of Operational Research, 146(2), 233-240.
Johnson, G. (2000). The Big Kahuna of IT Systems. Electrical Wholesaling, 81(4), p. 36.
Kanungo, S., & Bagchi, S. (2000). Understanding User Participation and Involvement in
ERP Use. Journal of Management Research, 1(1), 47-63.
Karakanian, M. (1999). Choosing an ERP Implementation Strategy. Year 2000 Practitioner, 2(7), p1, 6p.
Kawalek, P., & Wood-Harper, T. (2002). The Finding of Thorns: User Participation Enterprise System Implementation. Database for Advances in Information Systems, 33(1), 13-22.
289
Kennerley, M., & Neely, A. (2001). Enterprise Resource Planning: Analyzing the Impact. Integrated Manufacturing Systems, 12(2), 103-113.
Kharbanda, R. (1999). Enterprise Resource Planning: Baan Implementation by New Holland Tractors India (Pvt) Ltd. In Sadagopan, S. (Ed.) ERP: A Managerial Perspective (pp. 137-143). New Delhi: Tata McGraw-Hill Publishing Company Limited.
Klaus, H., Rosemann, M., & Gable, G.G. (2000). What is ERP? Information Systems Frontiers, 2(2), 141-162.
Koch, C. (2001). Enterprise Resource Planning: Information Technology as a Steamroller for
Management Politics. Journal of Organizational Change Management, 14(1), 64-78.
Kochan, A. (1999). Shortcuts to peak ERP Performance. Works Management, 52(3), 22-25.
Kraemmergaard, P., & Rose, J. (2002). Managerial Competencies for ERP Journeys. Information Systems Frontiers, 4(2), 199-211.
Krumbholz, M., & Maiden, N. (2001). The Implementation of Enterprise Resource Planning Packages in Different Organizational and National Cultures. Information Systems, 26(3), 185-204.
Kumar, V., Maheshwari, B., & Kumar, U. (2003). An Investigation of Critical Management Issues in ERP Implementation: Empirical Evidence from Canadian Organizations. Technovation, 23(10), 793-807.
Lall, A. (2003). Making ERP work for you. Retrieved December 24, 2004 from http://www.business-standard.com/search/storypage_new.php? leftnm=lmnu7&leftindx =7&lselect=6 &autono=146525.
Lau, R.S.M., Zhao, X., & Lai, F. (2002). Survey of MRP II Implementation and Benefits in
Mainland China and Hong Kong. Production and Inventory Management Journal, 43(3&4), 65-71.
Lee, H.L., So, K.C., & Tang, C.S. (2000). The Value of Information Sharing in a Two-Level Supply Chain. Management Science, 46(5), 626-643.
Legare, T.L. (2002). The Role of Organizational Factors in Realizing ERP Benefits. Information Systems Management, 19(4), 21-42.
290
Lewis-Beck, M.S. (1980). Applied Regression. Newbury Park, California: Sage.
Li, L.X., Chaudhry, S.S., Chaudhry, P.E., & Wang, Y. (2001). Evaluation of Acquiring and Implementing a Manufacturing Resource Planning System. Production and Inventory Management Journal, 42(3&4), 1-8.
Mabert, V.A., Soni, A., & Venkataramanan, M.A. (2000). Enterprise Resource Planning Survey of US Manufacturing Firms. Production and Inventory Management Journal, 41(2), 52-58.
Mabert, V.A., Soni, A., & Venkataramanan, M.A. (2001a).Enterprise Resource Planning:
Measuring Value. Production and Inventory Management Journal, 42(3/4), 46-51.
Mabert, V.A., Soni, A., & Venkataramanan, M.A. (2001b). Enterprise Resource Planning: Common Myths versus Reality. Business Horizons, 43(3), 69-76.
Mabert, V.A., Soni, A., & Venkataramanan, M.A. (2003a). Enterprise Resource Planning: Managing the Implementation Process. European Journal of Operational Research, 146(2), 302-314.
Mabert, V.A., Soni, A., & Venkatramanan, M.A. (2003b). The Impact of Organization size in Enterprise Resource Planning (ERP) Implementations in the US Manufacturing Sector, Omega, 31(3), 235-246.
Madhavan, S.K. (2000). Erhardt+Leimer India Limited: Strategic Transformation through ERP. Vikalpa, 25(3), 57-69.
Markus, M.L., Petrie, D., & Axline, S. (2000). Bucking the Trends: What the Future may hold for ERP Packages. Information Systems Frontier, 2(2) 181-193.
Markus, M.L., Tanis, C., & Fenema, P.C. (2000). Multisite ERP Implementations. Communications of the ACM, 43(4), 42-46.
Markus, M.L., Axline, S., Petrie, D., & Tanis, C. (2000). Learning from Adopters’ Experience with ERP: Problems Encountered and Success Achieved. Journal of Information Technology, 15, 245-265.
Menezes, J. (1999). Companies urged to reexamine ERP Models. Computer Dealer News,
15(25), p. 16.
Meissner, G. (2000). SAP: Inside the Secret Software Power. New York: McGraw-Hill Companies, Inc.
Miller, S.S. (1999). SAP R/3 Certification Exam Guide. New York: McGraw-Hill Companies Inc.
291
Miller, J.G., & Sprague, L.G. (1975). Behind the Growth in Materials Requirements Planning. Harvard Business Review, 53(5), 83-91.
Miltenburg, J. (2002). Computational Complexity of Algorithms for MRP and JIT
Production Planning Problems in Enterprise Resource Planning Systems. Production and Planning Control, 12(2), 198-209.
Minahan, T. (1998). Enterprise Resource Planning Strategies not Included. Purchasing, 125(1), 112-127.
Mirani, R., & Lederer, A.L. (1998). An Instrument for Assessing the Organizational Benefits of IS Projects. Decision Sciences, 29(4), 803-838.
Mohrman, S.A., Galbraith, J.R., Lawler III, E.E. and Associates (1998). Tomorrow’s Organization: Crafting Winning Capabilities in a Dynamic World. San Francisco: Jossey-Bass Inc.
Nah, F.F, Lau, J.L., & Kuang, J. (2001). Critical Factors for Successful Implementation of
Enterprise Systems. Business Process Management Journal, 7(3), 285-296.
Nandhakumar, J., Rossi, M., & Talvinen, J. (2002). Planning for ‘drift’? Implementation process of enterprise resource planning systems. Proceedings of the 36th. Hawaii International Conference on System Sciences, p. 10.
Nunnally, J.C. (1978). Psychometric Theory. New York: McGraw Hill.
Olhager, J., & Selldin, E. (2003). Enterprise Resource Planning Survey of Swedish Manufacturing Firms. European Journal of Operational Research, 146(2), 365-373.
Padmanabhan, S. (1999). Implementation of ERP in Large-Scale Organizations: A User’s Perspective. In Sadagopan, S. (Ed.) ERP: A Managerial Perspective (pp. 133-136). New Delhi: Tata McGraw-Hill Publishing Company Limited.
Parr, A.N., & Shanks, G. (2000a). A Model of ERP Implementation. Journal of Information Technology, 15, 289-303.
Parr, A.N., & Shanks, G. (2000b). A Taxonomy of ERP Implementation Approaches. Proceedings of the 33rd. Hawaii International Conference on System Sciences, p10.
Pasha, A. (2003). Enterprise Apps Special: ERP Case Study - Triveni gets a handle on project costing with SAP R/3. Retrieved December 20, 2004 from http://www.expresscomputeronline.com/20031124/appsspecial08.shtml.
292
Petroni, A. (2002). Critical Factors of MRP Implementation in Small and Medium-Sized Firms. International Journal of Operations and Production Management, 22(3), 329- 348.
Podsakoff, P.M., & Organ, D.W. (1986). Self-reports in organizational research: problems and prospects. Journal of Management, 12(4), p. 531-544.
Poston, R., & Grabski, S. (2001). Financial Impacts of Enterprise Resource Planning
Implementations. International Journal of Accounting Information Systems, 2, 271-294.
Raghuraman, P.G. (1999). IT: Managing Large Scale Change. In Sadagopan, S. (Ed.) ERP: A Managerial Perspective (pp. 114-126). New Delhi: Tata McGraw-Hill Publishing Company Limited.
Rajani, R. (1999). Going the ERP Way: Important Issues. In Sadagopan, S. (Ed.) ERP: A Managerial Perspective (pp. 70-79). New Delhi: Tata McGraw-Hill Publishing Company Limited.
Romeo, J. (2001). Less Pain, More Gain in ERP Rollouts. Network Computing, 12(19), 49- 56.
Rondeau, P.J., & Litteral, L.A. (2001). Evolution of Manufacturing Planning and Control Systems: From Reorder Point to Enterprise Resource Planning. Production and Inventory Management Journal, 42(2), 1-7.
Ross, J.W., & Vitale, M.R. (2000). The ERP Revolution: Surviving vs. Thriving. Information
Systems Frontiers, 2(2), 233-241.
Sadagopan, S. (1999). The World of ERP. In Sadagopan, S. (Ed.) ERP: A Managerial Perspective (pp. 1-16). New Delhi: Tata McGraw-Hill Publishing Company Limited.
Sarker, S., & Lee. A.S. (2002). Using a Case Study to test the Role of Three Key Social Enablers in ERP Implementation. Information and Management, 20(31), 1-17.
Sarkis, J., & Sundarraj, R.P. (2003). Managing large-scale global enterprise resource planning systems: a case study at Texas Instruments. International Journal of Information Management, 23, 431-442.
Sastry, M.V.S.P. (1999). Making ERP Effective. In Sadagopan, S. (Ed.) ERP: A Managerial Perspective (pp. 48-55). New Delhi: Tata McGraw-Hill Publishing Company Limited.
Satyan, E. (2002). Mind the Returns, Never Mind the ROI. Retrieved December 20, 2004 from www.dqindia.com/content/top_stories/102093001.asp.
Satyan, E. (2003). Focus: Enterprise Apps: Moving Up to ERP. Retrieved December 20, 2004 from www.dqindia.com/content/cio_handbook/103021901.asp.
293
Scheer, A.W., & Habermann, F. (2000). Making ERP a Success. Communications of the
ACM, 43(4), 57-61.
Schroeder, R.G, Anderson, J.C., Tupy, S.E., & White, E.M. (1981). A Study of MRP Benefits and Costs. Journal of Operations Management, 2(1), 1-9.
Scott, J.E., & Vessey, I. (2000). Implementing Enterprise Resource Planning Systems: The Role of Learning from Failure. Information Systems Frontiers, 2(2), 213-232.
Sheau, C., Chae, B., & Yang, C.L. (2004). National Differences and ERP Implementation: Issues and Challenges. Omega, 32, 361-372.
Sheldon, D. Jr. (1994). MRP II Implementation. Hospital Material Management Quarterly, 15(4), 48-52.
Shields, M.G. (2001). E-business and ERP: Rapid Implementation and Project Planning. New York: John Wiley & Sons, Inc.
Sia, S.K., Tang, M., Soh, C., & Boh, W.F. (2002). Enterprise Resource Planning (ERP) Systems as a technology of Power: Empowerment or Panoptic Control? Database for Advances in Information Systems, 33(1), 23-37.
Sillince, J.A.A., & Sykes, G.M.H. (1993). Integrating MRP II and JIT: A Management rather
than a Technical Challenge. International Journal of Operations and Production Management, 13(4), 18-31.
Siriginidi, S.R. (2000). Enterprise Resource Planning in Reengineering Business. Business Process Management Journal, 6(5), 376-391.
Slater, D. (1999). What is ERP? CIO, 12(15), p. 86.
Soh, C., Kien, S.S., & Tay-Yap, J. (2000). Cultural Fits and Misfits: Is ERP a Universal Solution? Communications of the ACM, 43(4), 47-51.
Sousa, J.E., & Collado, J.P. (2000). Towards the Unification of Critical Success Factors for ERP Implementations. 10th. Annual Business Information Technology (BIT) Conference, Manchester, p. 9.
Stensrud, E., & Myrtveit, I. (2002). Identifying High Performance ERP Projects. Norwegian School of Management, Discussion Paper 4/2002, 1-20.
Sweat, J. (1999). Learning Curve. Information Week, 746, p44.
Tarafdar, M., & Roy, R.K. (2003). Analyzing the adoption of enterprise resource planning systems in Indian organizations: A process framework. Journal of Global Information Technology Management, 6(1), p. 21.
Teltumbde, A., Tripathy, A., & Sahu, A.K. (2002). Bharat Petroleum Corporation Limited (BPCL). Vikalpa, 27(3), 45-58.
Management, January/February, 25-33. Vosburg, J., & Kumar, A. (2001). Managing Dirty Data in Organizations Using ERP:
Lessons from a Case Study. Industrial Management and Data Systems, 101(1), 21-31.
Watanabe, C., & Hobo, M. (2003). Creating a firm self-propagating function for advanced innovation-oriented projects: lessons from ERP. Technovation, 23, 1-15.
Weston Jr., F.C. (2001). ERP Implementation and Project Management. Production and Inventory Management Journal, 42(3/4), 75-80.
Weston Jr. F.C. (2003). ERP II: The Extended Enterprise System. Business Horizons, November-December, 49-55.
White, R.E. (1990). Post-Implementation Evaluation of Just-In-time Manufacturing. Doctoral Dissertation, Arizona State University.
White, E.M., Anderson, J.C., Schroeder, R.G., & Tupy, S.E. (1982). A Study of the MRP Implementation Process. Journal of Operations Management, 2(3), 145-153.
Willis, T.H., & Willis-Brown, A.H. (2002). Extending the Value of ERP. Industrial Management and Data Systems, 102(1), 35-38.
Worthen, B. (2002). Nestle’s ERP Odyssey: Nestle USA’s costly and protracted struggle with its SAP project is a cautionary tale for any company intent on an enterprise wide implementation, CIO, 15(15), 62-70.
Wyatt, J. (2002). ERP in the consumer-driven marketplace. Health Management Technology, 23(7), 24-25.
Xu, H., Nord, J.H., Brown, N., & Nord, D.G. (2002). Data quality issues in implementing an ERP. Industrial Management and Data Systems, 102(1), 47-58.
295
Yen, D.C., Chou, D.C., & Chang, J. (2002). A Synergic Analysis for Web-Based Enterprise Resources Planning Systems. Computer Standards & Interfaces, 24, 337-346.
Yu, Z., Yan, H., & Cheng, T.C.E. (2001). Benefits of Information Sharing with Supply Chain Partnerships. Industrial Management and Data Systems, 101(3), 114-119.
Zhang, Z., Lee, K.O.M., Huang, P., Zhang, L., & Huang, X. (2005). A Framework for ERP Systems Implementation in China: An Empirical Study. International Journal of Production Economics, 98(1), 56-80.