University of Central Florida University of Central Florida STARS STARS Electronic Theses and Dissertations, 2004-2019 2009 Post Treatment Alternatives For Stabilizing Desalinated Water Post Treatment Alternatives For Stabilizing Desalinated Water Susaye Douglas University of Central Florida Part of the Environmental Engineering Commons Find similar works at: https://stars.library.ucf.edu/etd University of Central Florida Libraries http://library.ucf.edu This Masters Thesis (Open Access) is brought to you for free and open access by STARS. It has been accepted for inclusion in Electronic Theses and Dissertations, 2004-2019 by an authorized administrator of STARS. For more information, please contact [email protected]. STARS Citation STARS Citation Douglas, Susaye, "Post Treatment Alternatives For Stabilizing Desalinated Water" (2009). Electronic Theses and Dissertations, 2004-2019. 4065. https://stars.library.ucf.edu/etd/4065
Transcript
University of Central Florida University of Central Florida
STARS STARS
Electronic Theses and Dissertations, 2004-2019
2009
Post Treatment Alternatives For Stabilizing Desalinated Water Post Treatment Alternatives For Stabilizing Desalinated Water
Susaye Douglas University of Central Florida
Part of the Environmental Engineering Commons
Find similar works at: https://stars.library.ucf.edu/etd
University of Central Florida Libraries http://library.ucf.edu
This Masters Thesis (Open Access) is brought to you for free and open access by STARS. It has been accepted for
inclusion in Electronic Theses and Dissertations, 2004-2019 by an authorized administrator of STARS. For more
The use of brackish water and seawater desalination for augmenting potable water supplies
has focused primarily on pre-treatment, process optimization, energy efficiency, and concentrate
management. Much less has been documented regarding the impact of post-treatment requirements
with respect to distribution system.
The goals of this study were to review current literature on post-treatment of permeate
water, use survey questionnaires to gather information on post-treatment water quality
characteristics, gather operation information, review general capital and maintenance cost, and
identify appropriate “lessons learned” with regards to post-treatment from water purveyors
participating in the Project. A workshop was organized where experts from across the United States,
Europe and the Caribbean active in brackish and seawater desalination, gathered to share technical
knowledge regarding post-treatment stabilization, identify solutions for utilities experiencing
problems with post-treatment, note lessons learned, and develop desalination water post-treatment
guidelines. In addition, based on initial workshop discussions, the iodide content of reverse osmosis
and nanofiltration permeate from two seawater desalination facilities was determined.
The literature review identified that stabilization and disinfection are required desalination
post-treatment processes, and typically are considerations when considering 1) blending, 2) re-
mineralization, 3) disinfection, and 4) materials used for storage and transport of product water.
Addition of chemicals can effectively achieve post-treatment goals although considerations relating
to the quality of the chemical, dosage rates, and possible chemical reactions, such as possible
formation of disinfection by-products, should be monitored and studied.
The survey gathered information on brackish water and seawater desalination facilities with
specific regards to their post-treatment operations. The information obtained was divided into seven
iv
sections 1) general desalination facility information, 2) plant characteristics with schematics, 3) post-
treatment water quality, 4) permeate, blend, and point of entry quality, 5) post-treatment operation,
6) operation and maintenance costs, 7) and lessons learned. A major consideration obtained from
the survey was that facilities should conduct post-treatment pilot studies in order to identify
operational problems that may impact distributions systems prior to designing the plant. Effective
design and regulation considerations will limit issues with permitting for the facility.
The expert workshop identified fourteen priority issues pertaining to post-treatment. Priority
issues were relating to post-treatment stabilization of permeate water, corrosion control, disinfection
and the challenges relating to disinfection by-product (DBP) formation, water quality goals,
blending, and the importance of informing the general public. For each priority issues
guidelines/recommendations were developed for how facilities can effectively manage such issues if
they arise.
One of the key priorities identified in the workshop was related to blending of permeate and
formation of DBPs. However, it was identified in the workshop that the impact of iodide on
iodinated-DBP formation was unknown. Consequently, screening evaluations using a laboratory
catalytic reduction method to determine iodide concentrations in the permeate of two of the
workshop participants: Tampa Bay and Long Beach seawater desalination facilities. It was found that
the permeate did contain iodide, although at levels near the detection limit of the analytical method
(8 µg/L).
v
This Thesis is dedicated to my parents, grandpa, and especially my sisters Tricia, Karone, and
Kamala for all the love and support they have given me.
vi
ACKNOWLEDGEMENTS
Special thanks to Dr. Steven Duranceau for serving as my advisor and for his patience, guidance,
and support through this project. I want to thank Dr. David Cooper for his advice and
encouragement at times when I needed it the most. Thanks to Dr. Andrew Randall for serving on
my committee. Thanks to the Water Research Foundation for funding this project and the National
Water Research Institute (NWRI) for providing workshop assistance. Thanks to the following
utilities for participating in the project, their time and valuable input that was necessary for
completion of this project and is greatly appreciated.
Irvine Ranch Water District, Irvine, CA Carl Spangenberg
San Diego County Water Authority, San Diego, CA Cesar Lopez, Jr.
MWD of Southern California, Los Angeles, CA Sun Liang
Long Beach Water Department, Long Beach, CA Robert Cheng
City of Pompano Beach, Pompano Beach, FL Donald Baylor
Collier County Utilities, Naples, FL Steven Messner
Tampa Bay Water, Tampa, FL Christine Owen
Town of Jupiter Utilities, Jupiter, FL Paul Jurczak
El Paso Public Water Utilities Services, El Paso, TX Fernie Rico
Naval Facilities Engineering Command, Norfolk, VA James Harris
Consolidated Water Company, LTD, Cayman Islands John Countz
PWN Water Supply Co. North Holland, Netherlands Gilbert Galjaard
Thanks to Maria Pia Real-Robert, Nancy P. Holt, William J. Johnson, Vito Trupiano, and
Jayapregasham Tharamapalan for their help when I needed the most, and a special thanks to Amalia
vii
Abdel-Wahab for her time spent with me in the laboratory completing iodide testing. All your time
and effort is sincerely appreciated.
viii
TABLE OF CONTENTS
LIST OF FIGURES ........................................................................................................................................ xii
LIST OF TABLES ......................................................................................................................................... xiv
LIST OF ACRONYMS .................................................................................................................................. xv
Study Objective .............................................................................................................................................. 2
Theory ............................................................................................................................................................. 5
Permeate Conditioning and Blending ................................................................................................... 16
Municipal Methods .................................................................................................................................. 17
Water Quality Considerations .................................................................................................................... 20
Water Quality Parameters and Stability ................................................................................................ 21
Brackish Water Post-treatment Considerations ...................................................................................... 25
Blended Water Ratios ............................................................................................................................. 67
Impacts On Existing Distribution System Infrastructure...................................................................... 68
Blending Water Compatibility ............................................................................................................... 68
Red Water Experiences ............................................................................................................................... 72
Permeate and Agriculture ........................................................................................................................... 75
Desalted Seawater Supplies and Permeate Boron Concentrations .................................................. 75
Desalination and the Sodium Adsorption Ratio ................................................................................. 78
Summary of Literature Review Findings .................................................................................................. 81
Chemicals and Post-treatment Issues ................................................................................................... 82
Brackish and Sea Water Post-treatment ............................................................................................... 83
Identified Water Quality Goals for Post-treatment Processes ......................................................... 85
CHAPTER THREE: PERMEATE POST TREATMENT PRACTICES QUESTIONNAIRE ..... 86
Results and Discussion ............................................................................................................................ 129
Guideline for Priority Issues ............................................................................................................... 135
CHAPTER FIVE: EVALUATION OF TOTAL IODIDE IN SEAWATER PERMEATE
Results and Discussion ............................................................................................................................ 147
Quality Assurance and Quality Control ............................................................................................ 150
xi
CHAPTER SIX: CONCLUSION AND RECOMMENDATIONS .................................................. 152
Figure 5-2: Tampa Bay Mean Iodide Concentrations with Max and Min Observations ................... 148
Figure 5-3: Long Beach Mean Iodide Concentrations with Max and Min Observation .................... 150
xiv
LIST OF TABLES
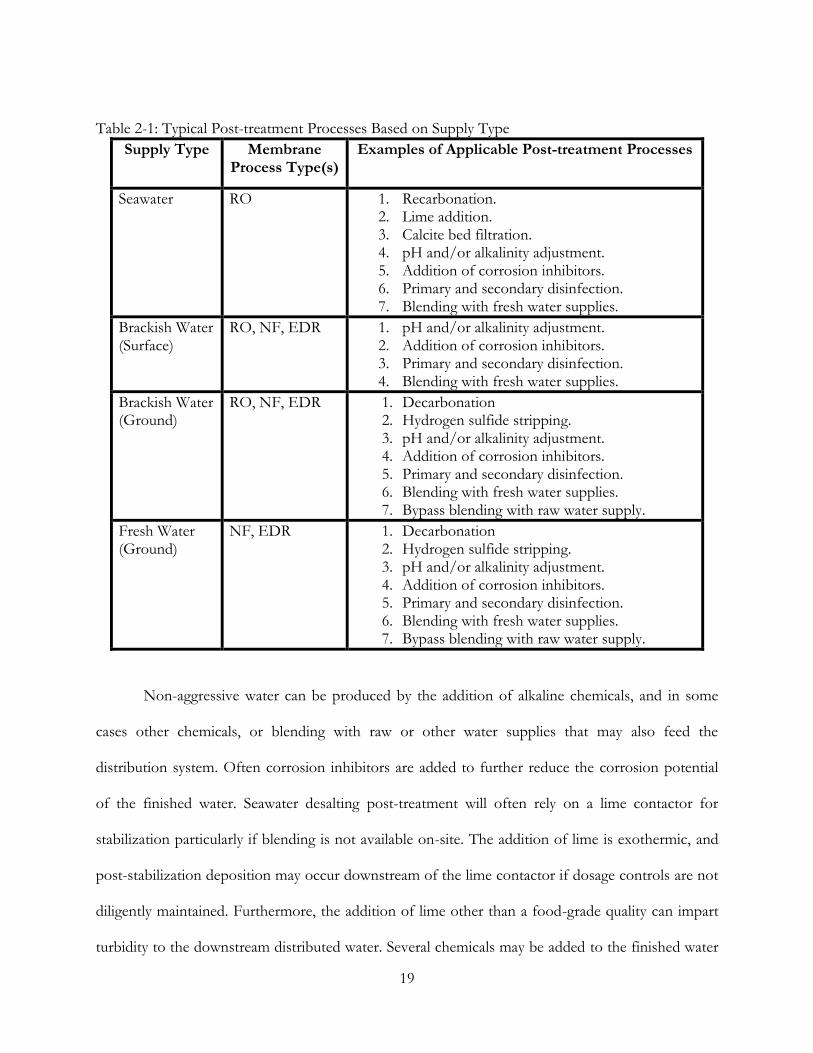
Table 2-1: Typical Post-treatment Processes Based on Supply Type ...................................................... 19
Table 2-2: Pipe Material and Corrosion........................................................................................................ 43
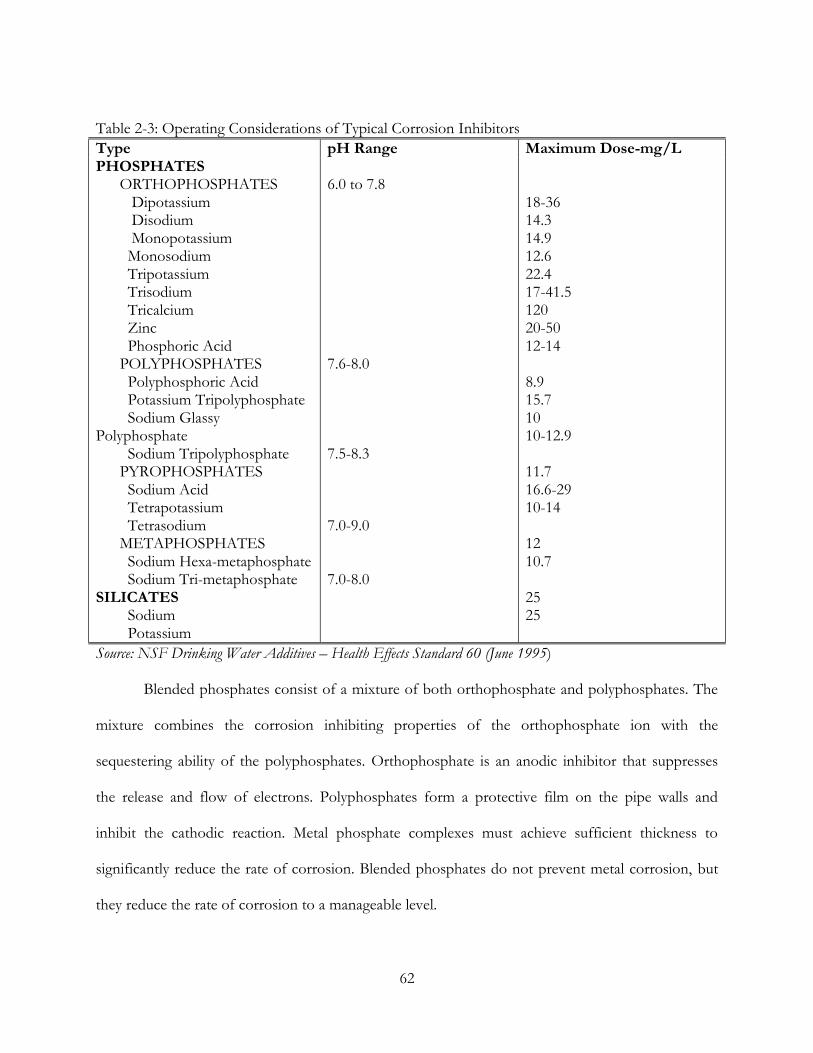
Table 2-3: Operating Considerations of Typical Corrosion Inhibitors ................................................... 62
Table 2-4: SAR Versus ECw .......................................................................................................................... 79
Table 2-5: Irrigation Goals for Bermuda Grass .......................................................................................... 80
Table 3-1: Post-treatment Types and Disinfection ..................................................................................... 98
Table 3-2: Post-treatment Disinfection and Disinfection Residual Goals .............................................. 99
Table 3-3: Have you experienced any post-treatment problems within the plant? ............................. 100
Table 3-4: Any distribution system impacts noted? ................................................................................. 101
Table 3-5: Blending or By-Pass Descriptions ........................................................................................... 102
Table 3-6: Sequence of Post-treatment Operations ................................................................................. 103
Table 3-7: Control of pH and Buffering Content on Post-treatment ................................................... 104
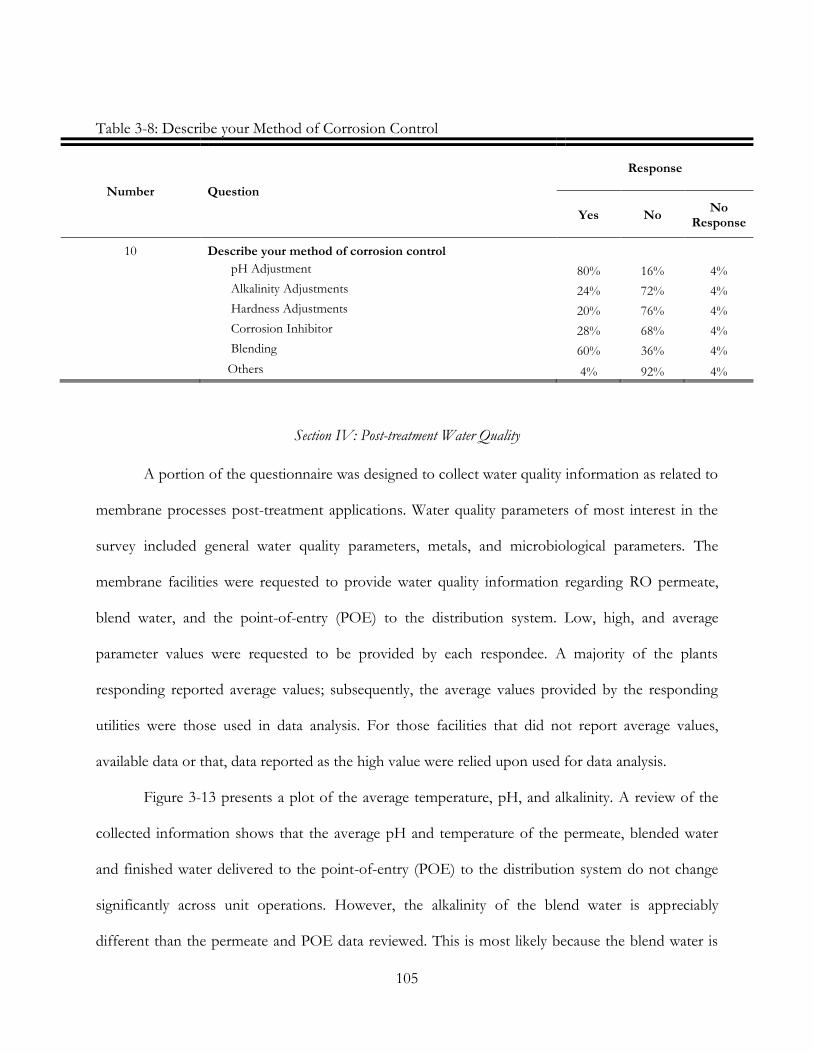
Table 3-8: Describe your Method of Corrosion Control ........................................................................ 105
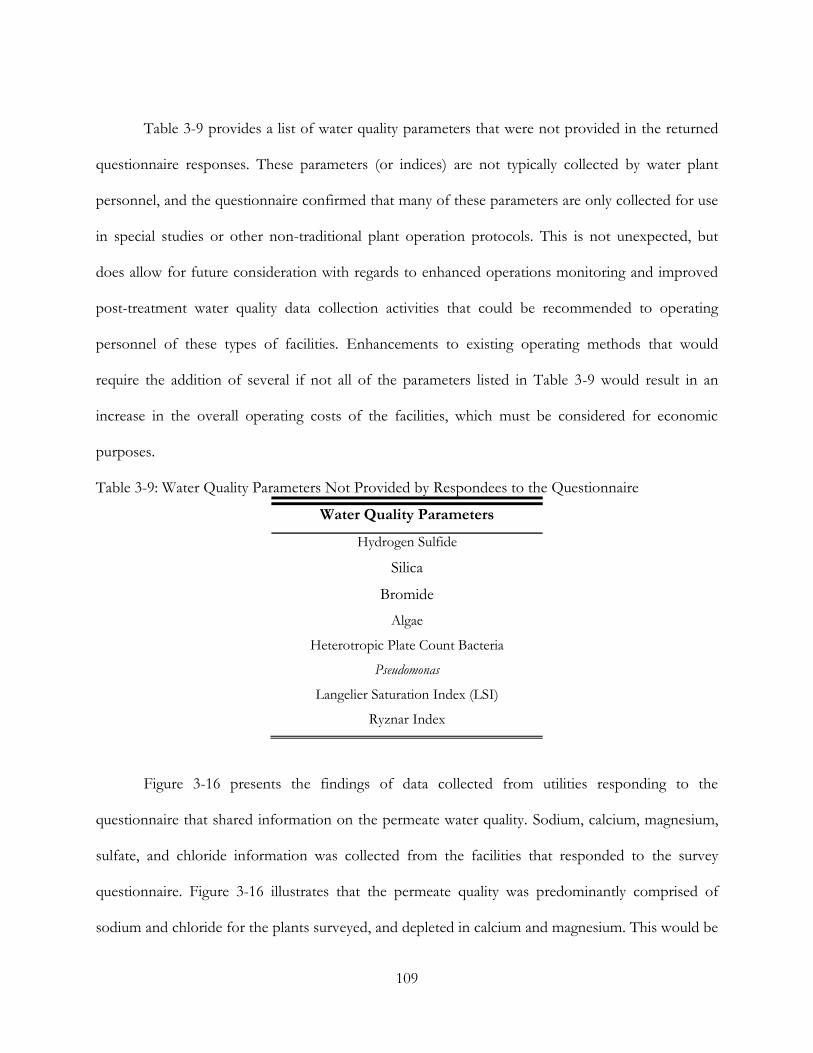
Table 3-9: Water Quality Parameters Not Provided by Respondees to the Questionnaire ............... 109
Table 4-1: Example of Rankings for NGT ............................................................................................... 125
Table 4-2: Outline of Priority Issues Generated from Workshop ......................................................... 129
Table 5-1: Standard Solutions Concentrations ......................................................................................... 143
Table 5-2: Water Quality Parameters for samples .................................................................................... 143
Table 5-3: Standard Curve Equations ........................................................................................................ 145
Table 5-4: Iodide Concentrations for Tampa Bay RO Water ................................................................ 147
Table 5-5: Iodide Concentrations for Long Beach NF Water ............................................................... 149
Table 5-6: Quality Assurance and Control Parameters ........................................................................... 151
xv
LIST OF ACRONYMS
AI Aggressive Index
CCPP Calcium Carbonate Precipitation Potential
CSI Calcium Saturation index
DBP Disinfection by-product
DIC Dissolved Inorganic Carbon
DO Dissolved Oxygen
EDR Electro-dialysis
GW Groundwater
GWUI Groundwater under Influence
HRT Hydraulic Retention Time
HPLC High-performance Liquid Chromatography
KSCN Potassium Thiocyanate
LCR Lead Copper Rule
LSI Langelier Saturation Index
MTC Mass Transfer Coefficient
MCL Minimum Contaminant Level
NF Nanofiltration
POE Point of Entry
RPD Relative Percent Difference
RO Reverse Osmosis
SOC Synthetic Organic Carbon
SFW Surface Water
xvi
TCR Total Coliform Rule
TDS Total Dissolved Salts
TOC Total Organic Carbon
THMs Trihalomethanes
UCL Upper Control Limit
UWL Upper Warning Limit
WTP Water Treatment Plant
1
CHAPTER ONE: INTRODUCTION
Overview
Studies regarding the application and effectiveness of brackish and seawater desalination to
augment drinking water supplies have focused primarily on pretreatment challenges, process
optimization, energy efficiency, and concentrate management; however, less has been documented
with regards to post-treatment requirements with respect to distribution system water quality
impacts. The behavior of desalinated water in the distribution system remains largely non-
documented, and potential issues that may arise after introducing desalinated water into existing
distribution systems include impacts on internal corrosion control, disinfectants and disinfection by-
products, hydraulics, infrastructure maintenance, water quality, aesthetics, and customer acceptance.
Potable water producers increasingly are turning to membrane processes to augment existing
unit operations to improve water quality and allow reliance on poorer source waters. Moreover, the
use of membrane processes for softening, brackish and seawater treatment has become more
widespread around the globe. Although, in the United States of America (USA) seawater potable
membrane applications are few, there has been long-term successful reliance on membrane
treatment of brackish supplies, particularly in Florida, over the years. Although there is much
knowledge in the professional community about membrane processes, water purveyors would
benefit from documenting historical operation design, operation and implementation experience in a
guidance document. To address this need, the research reported herein is intended to provide the
drinking water community with information regarding post-treatment alternatives for stabilization of
desalinated water.
2
Study Objective
The Water Research Foundation funded this research to review current literature on post-
treatment of permeate water, use survey questionnaires to gather information on post-treatment
water quality characteristics, gather operation information, review general capital and maintenance
cost, and identify appropriate “lessons learned” with regards to post-treatment from water
purveyors, conduct an expert workshop to report practical experiences by water purveyors, denote
lessons learned, and determine desalinated water post-treatment guidelines/recommendations
linking water quality targets to distribution system operational goals. Consideration to customer
acceptance of desalinated water is also reviewed. The five key tasks of the study included:
1. Conduct review of current literature on post-treatment of desalination water
2. Gather post-treatment water quality information through a survey questionnaire
3. Conduct an expert workshop
4. Denote lessons learned
5. Determine post-treatment guidelines (best practices) linking water quality targets to
distribution system operational goals
Background
Desalination for Drinking Water Production
Desalination is an important and rapidly growing source of drinking water treatment around
the world originating from seawater or brackish water. The use of synthetic membrane processes for
desalination and production of drinking water has increased over the past five decades primarily in
coastal areas with limited freshwater sources. Desalting techniques are primarily intended for the
removal of total dissolved salts (TDS) that generally cannot be removed by conventional treatment
3
processes. Between 1994 and 2004, world desalination capacity increased from 17.3 to 35.6 million
m3/day (Wagnick 2004).
However, synthetic membrane processes produce permeate water depleted in minerals and
are often is found to be aggressive towards distribution system components. Moreover, the water
produced by membrane processes is typically incompatible with existing water distribution system
infrastructure. Thus, post-treatment is needed for municipal water treatment before the membrane-
treated water is delivered to the distribution system as finished water.
Synthetic Membrane Processes
Since the development of synthetic asymmetric membranes in 1960, interest in membrane
processes, particularly reverse osmosis (RO) and nanofiltration (NF) for water and wastewater
treatment has increased primarily because of the following reasons (Mallevialle, Odendaal, and
Wiesner 1996):
1. Increased regulatory pressure to provide better treatment for both potable and waste waters
2. Increased demand for water, especially during times of drought, requiring exploitation of
water resources of poorer quality than those relied upon previously
3. Technological improvements have lowered costs associated with the manufacturing and
operational use of membrane technologies
Water desalination had initially been used to produce or augment drinking water supplies through
the use of evaporative or distillation methods. The process is believed to date back to the 4th
century BC when Greek sailors used an evaporative process to desalinate seawater. Beginning in the
1970s however, the water industry began to focus on commercially viable desalination applications
using synthetic membranes. Today, reverse osmosis (RO), nanofiltration (NF), and electrodialysis
4
reversal (EDR) are the most commonly used desalting processes for potable water treatment in the
United States, typically treating brackish or impaired water supplies. Globally, many seawater RO
water treatment plants (WTPs) have been operating successfully for more than 30 years (Redondo
2001; Busch and Mickols 2004).
At present time, desalting plants worldwide have the capacity to produce over 6.0 billion
gallons a day, enough water to provide over 15 gallons a day for every person in the United States
(Wagnick 2004). About 1,200 desalting plants are in operation nationwide. Most plants operating in
the United States are used for either moderately brackish ground water treatment, for softening and
natural organic matter (disinfection by-product precursors) removal, or to produce highly purified
water for industrial use. The reverse osmosis process has the ability to remove more than ninety nine
percent of all dissolved minerals and more than ninety-five percent of organic compounds, as well as
biological and colloidal suspended matter, including turbidity, from water. Nanofiltration, also
referred to as membrane softening, is used primarily for water softening and disinfection byproduct
precursor (dissolved natural organic carbon) removal, and can remove up to ninety-five percent
TDS from source water. Electrodialysis reversal (EDR) is employed for lower salinity waters,
especially for surface waters having high fouling content or ground water having high silica content.
EDR does not remove microorganisms or small suspended materials from source waters (Taylor,
Duranceau, Barrett, and Goigel 1989).
The first commercial plant for the production of potable water from a saline source using
electrodialysis and ion-exchange membranes was placed into operation in 1954 (Powell and Guild
1961). In 1968, use of membranes for brackish-water treatment started with the construction of an
electrodialysis (ED) plant in Florida. This process was not well-received because of its inability to
adequately reduce dissolved solids. The first RO treatment plant was constructed in 1970 for the
5
Ocean Reef Club, a condominium complex, on Longboat Key, Florida (Dykes and Conlon 1989).
The plant began operation in October 1971 with an initial operating pressure of 600 psi and a
capacity of 0.6 million gallons per day (MGD), and was later expanded to 0.93 MGD. Since that
time, significant advances in membrane technologies have improved the cost effectiveness and
performance capabilities of the membrane. RO membrane processes are increasingly being used
worldwide to solve a variety of water treatment problems.
Theory
Osmosis
In general, membrane desalting process produces permeate water that is considered
chemically unstable and low in mineral content, which can lead to corrosion within the distribution
system. The mineral composition of the water is significantly changed and then partially
reconstituted to achieve stable finished water that can be distributed in pipes. Whether or not the
ultimate composition of the finished water has a positive or negative impact on the viability of
distribution system components, distributed water quality, and health of long-term consumers of
desalinated water supplies remains for the most part unknown.
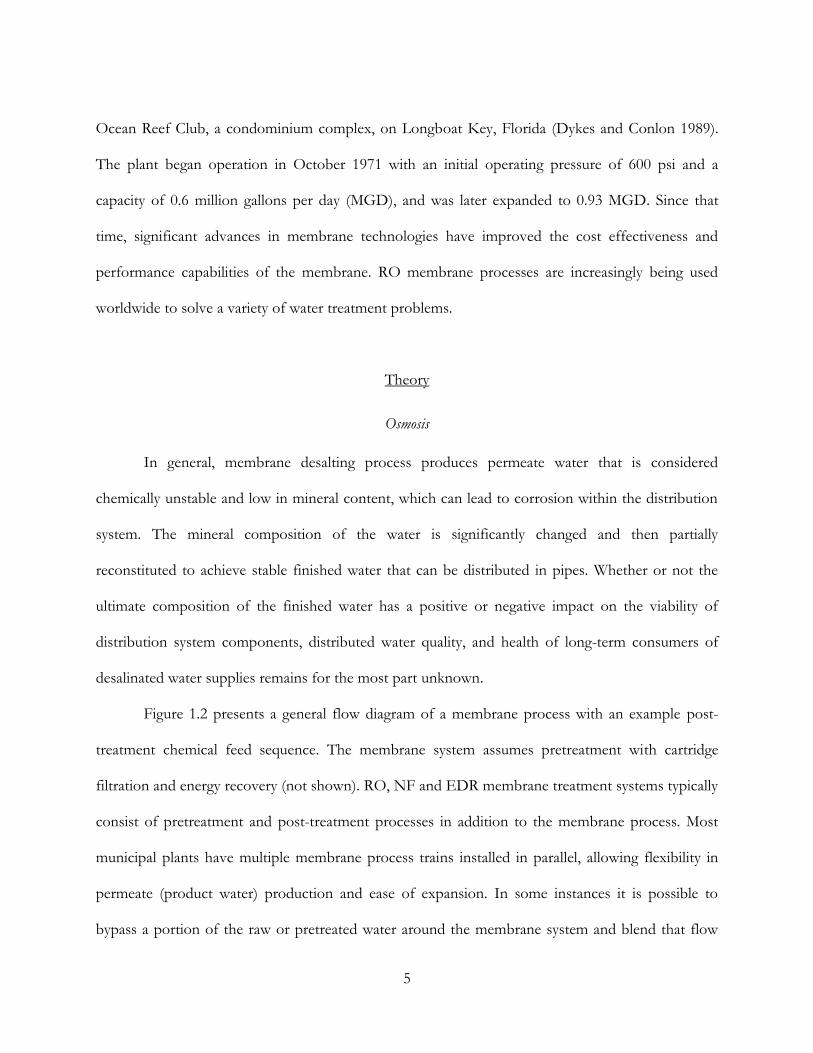
Figure 1.2 presents a general flow diagram of a membrane process with an example post-
treatment chemical feed sequence. The membrane system assumes pretreatment with cartridge
filtration and energy recovery (not shown). RO, NF and EDR membrane treatment systems typically
consist of pretreatment and post-treatment processes in addition to the membrane process. Most
municipal plants have multiple membrane process trains installed in parallel, allowing flexibility in
permeate (product water) production and ease of expansion. In some instances it is possible to
bypass a portion of the raw or pretreated water around the membrane system and blend that flow
6
with the permeate stream to reduce the capacity of the membrane system, improve finished water
stability, and minimize capital and operating costs (Bergman and Elarde 1995). The maximum
allowable blend ratio is determined from an analysis of bypassed and permeate water qualities.
Figure 1-1: Example of a Simplified Membrane System Flow Diagram
Post-treatment processes typically include disinfection and corrosion control, and can
include degasification and/or air stripping processes if carbon dioxide and hydrogen sulfide gases
are present in the permeate water. Post-treatment is needed for municipal water treatment before
the membrane-treated water is delivered to the distribution system as finished water. Membrane
processes also produce a residual concentrate stream that may require post-treatment prior to
disposal or reuse, such as the removal of hydrogen sulfide and/or addition of dissolved oxygen prior
to surface water discharge; however, this document only discusses desalted process stream post-
treatment.
Osmotic Flow
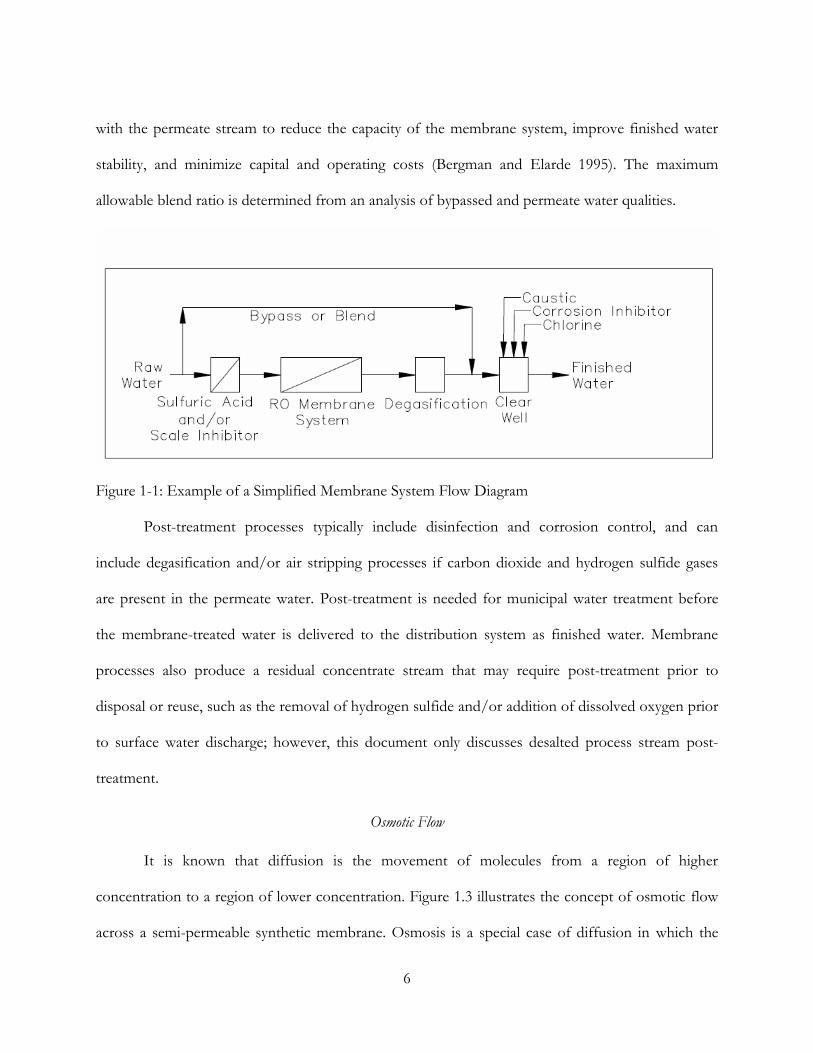
It is known that diffusion is the movement of molecules from a region of higher
concentration to a region of lower concentration. Figure 1.3 illustrates the concept of osmotic flow
across a semi-permeable synthetic membrane. Osmosis is a special case of diffusion in which the
7
molecules are water and the concentration gradient occurs across a semi-permeable membrane. The
semi-permeable membrane allows the passage of water, but not ions (e.g., Na+, Ca2+, Cl-) or larger
molecules (e.g., natural organic matter). Diffusion and osmosis are thermodynamically favorable and
will continue until equilibrium is reached. Osmosis can be slowed, stopped, or even reversed if
sufficient pressure is applied to the membrane from the 'concentrated' side of the membrane.
Reverse osmosis occurs when the water is moved across the membrane against the concentration
gradient, from lower concentration to higher concentration.
8
Figure 1-2: The Principles of Osmotic Flow
9
To illustrate, imagine a semi-permeable membrane with fresh water on one side and a
concentrated aqueous solution on the other side. If normal osmosis takes place, the fresh water will
cross the membrane to dilute the concentrated solution. In reverse osmosis, pressure is exerted on
the side with the concentrated solution to force the water molecules across the membrane to the
fresh waterside. Thermodynamically, the osmotic pressure is defined below in Equation (1.1) where
π=−𝑅𝑇
𝑉𝑏ln(𝑥𝑤 ) (1.1)
.π is the osmotic pressure, 𝑉𝑏 the molar volume of water, 𝑥𝑤 the mole fraction of water, and R the
ideal gas constant. In dilute solutions, the osmotic pressure can be estimated using Van‟t Hoff‟s law,
which was developed using the ideal gas law and is shown in Equation (1.2) with the total amount of
π=−𝑛𝑠
𝑉RT or π = CRT (1.2)
solutes in solution ns [moles], total concentration of solutes C [moles/L], and the volume of solvent
V. Considering the dissociation of ions in solution, Van‟t Hoff‟s Equation is shown in Equation
(1.3):
π = 𝑖𝛷CRT (1.3)
with i, representing the dissociation constant, this is equal to the number of ions and molecules per
mole of solute produced by the dissolution of the solute, and where 𝛷 represents a correction factor
for non-ideal behavior.
As a general rule of thumb, for every 100 mg/L of total dissolved solids that is present in the
feed water, one psi of osmotic pressure will be present within the membrane feed channel by
Equation (1.4):
𝜋 = [𝑇𝐷𝑆,𝑚𝑔
𝐿]
1𝑝𝑠𝑖
100𝑚𝑔 𝐿−𝑇𝐷𝑆 (1.4)
10
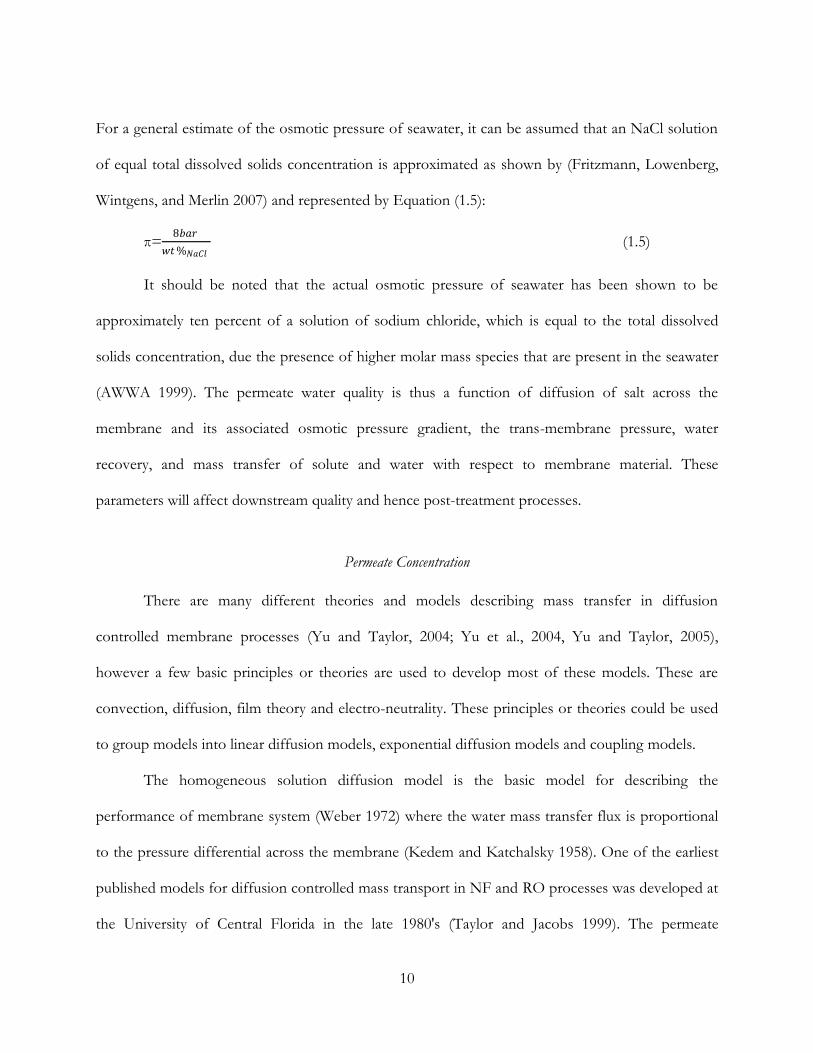
For a general estimate of the osmotic pressure of seawater, it can be assumed that an NaCl solution
of equal total dissolved solids concentration is approximated as shown by (Fritzmann, Lowenberg,
Wintgens, and Merlin 2007) and represented by Equation (1.5):
π=8𝑏𝑎𝑟
𝑤𝑡 %𝑁𝑎𝐶𝑙 (1.5)
It should be noted that the actual osmotic pressure of seawater has been shown to be
approximately ten percent of a solution of sodium chloride, which is equal to the total dissolved
solids concentration, due the presence of higher molar mass species that are present in the seawater
(AWWA 1999). The permeate water quality is thus a function of diffusion of salt across the
membrane and its associated osmotic pressure gradient, the trans-membrane pressure, water
recovery, and mass transfer of solute and water with respect to membrane material. These
parameters will affect downstream quality and hence post-treatment processes.
Permeate Concentration
There are many different theories and models describing mass transfer in diffusion
controlled membrane processes (Yu and Taylor, 2004; Yu et al., 2004, Yu and Taylor, 2005),
however a few basic principles or theories are used to develop most of these models. These are
convection, diffusion, film theory and electro-neutrality. These principles or theories could be used
to group models into linear diffusion models, exponential diffusion models and coupling models.
The homogeneous solution diffusion model is the basic model for describing the
performance of membrane system (Weber 1972) where the water mass transfer flux is proportional
to the pressure differential across the membrane (Kedem and Katchalsky 1958). One of the earliest
published models for diffusion controlled mass transport in NF and RO processes was developed at
the University of Central Florida in the late 1980's (Taylor and Jacobs 1999). The permeate
11
concentration of a membrane processes can be predicted using several key mass transfer and
membrane parameters, and is useful for determining post-treatment requirements. There are many
different theories and models describing mass transfer in diffusion controlled membrane processes,
however a few basic principles or theories are used to develop most of these models. A basic
element flow and mass transport balance diagram in a synthetic membrane shown in Figure 1.4.
Figure 1-3: Basic Diagram of Mass Transport in a Membrane The basic Equations used based on the homogeneous solution diffusion model (HSD) are shown in
buffer intensity, total salt concentration, chloride, sulfate, phosphate, and silicate have shown to
have different effects on the corrosion of different metals. The dissolution or corrosion of pipe
materials occurs when water chemistry and physical conditions generate the following corrosion
mechanisms.
Uniform corrosion - when the water freely dissolves metal from the pipe surface.
Concentration cell corrosion - when anodic and cathodic points are established along the
pipe surface, causing the sacrifice of metals at the anode (dissolved metal species) and the
precipitation of less soluble metal compounds at the cathode.
Galvanic corrosion - when two dissimilar metals are in contact with each other, causing the
dissolution of the anode.
Dezincification corrosion – occurring in a copper-zinc alloy, such as brass, is the result of
zinc being more anodic than copper and being corroded in water, leaving the copper in situ.
Yellow brass is subject to severe dezincification in soft, non-stabilized waters; however, red
brass and Admiralty brass metal containing less zinc are much less subject to this type of
corrosion.
41
Some of the primary constituents in the water that promote and support pitting attack are
dissolved carbon dioxide and dissolved oxygen (Cohen and Meyers 1987). Oxygen is usually present
when corrosion occurs, and carbon dioxide is present at low pH values. Unlike generalized
corrosion, pitting is associated with hard waters having high carbon dioxide and dissolved oxygen
content, and most often occurs in cold-water copper piping in the horizontal runs of piping. Pitting
has also been associated with stray current and impingement attack by high water velocities of
copper. However, pitting attack is most common in new installations, with 80 to 90 percent of the
reported failures occurring in the first 2 to 3 years, after which incidence of pitting is reduced
(Schock 1990).
Abrasion is the physical removal of pipe material due to irregularities in the pipe surface,
which may dislodge under high fluid velocities. Abrasion of piping materials is typically accelerated
when corrosion by-products, such as tubercles, are present in the distribution system. Abrasion
activity normally diminishes when tubercles are reduced or if the tubercles can be coated with a less
permeable substance. This effect has been noted by several full-scale systems, which have reported
fewer customer complaints about red or black water events after corrosion control treatment was
implemented (USEPA 1992). There is a difference in the chemistry of corrosion control between
flowing and standing conditions. This variation was evidenced by fluctuations in pH and increases in
alkalinity for standing water compared with flowing water (Johnson et. al. 1994).
Metabolic activity is the utilization of pipe materials as a nutrient supply by microorganisms.
Implementing corrosion control will alter the finished water chemistry, which subsequently may
influence microbial growths within the distribution system. Recent studies have shown that bio-films
are strongly associated with corrosion by-products within distribution systems. This association
42
makes the bio-films more resistant to disinfection, and therefore, more persistent when active
corrosion takes place in distribution system piping.
While bio-film formation may be promoted by corrosion, it remains difficult to accurately
quantify the effects of microbial activity and the effect of treatment on such activity. Some potable
water systems have experienced increases in distribution system microbial growth when corrosion
control treatment was implemented due to the addition of nutrients to the finished water. In
particular, this may become a problem within distribution systems where chloramines are used for
final disinfection and a phosphorous-based inhibitor is applied for corrosion control.
As chloramines are reduced during oxidation, ammonia is released into the water. Thus the
presence of two major nutrients, nitrogen and phosphorous, could increase microbial growth. This
is especially likely in the extremes of the distribution system where localized areas with inadequate
disinfection may occur (USEPA 1992).
Certain qualities of RO permeate water can destroy certain types of piping materials, such as
galvanized steel or asbestos-cement materials. Material selection for RO permeate is dependent on
many design and site-specific criteria, such as water type. For examples, the use of piping materials
constructed of polyvinylchloride (PVC) may be selected for use in NF and brackish RO permeate,
and whereas 304L stainless could be selected for fresh water, 316L stainless should be considered
for brackish water. Other possible options include the use of duplex stainless for brackish water and
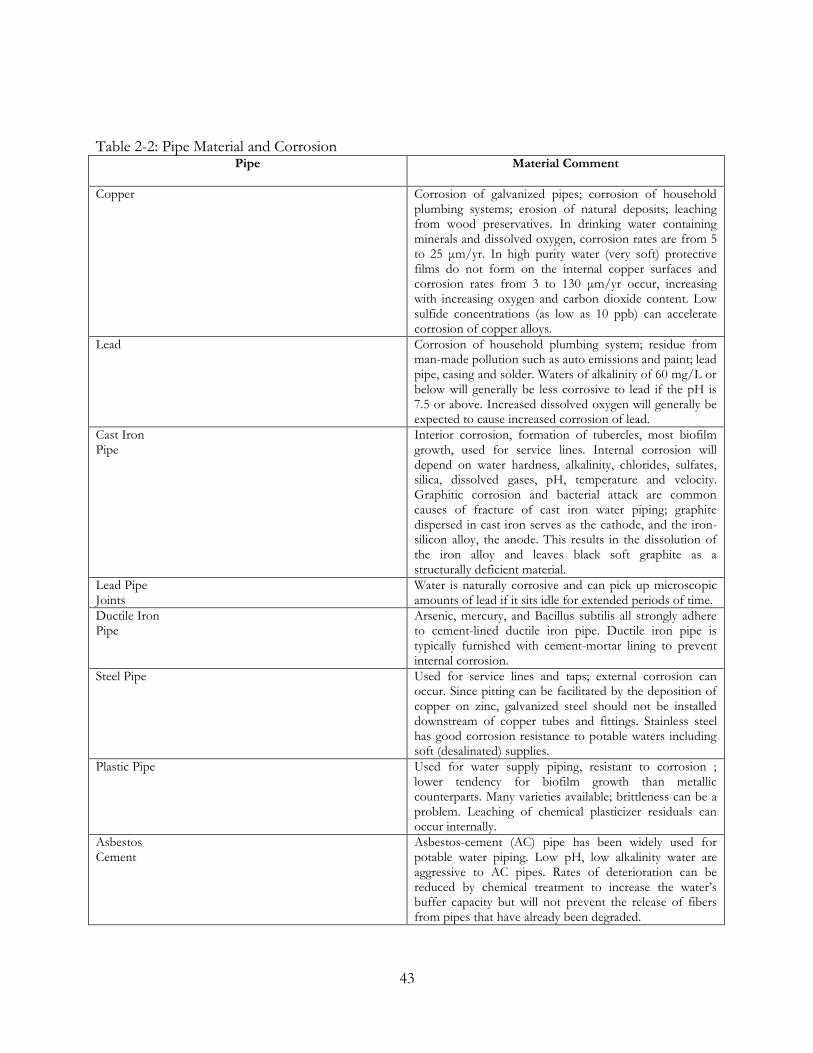
specific alloys (for example 6% Moly) for seawater applications. Table 2.2 summarizes a list of pipe
materials and comments regarding corrosion. The chemical composition of permeate water
produced by RO or NF when blended with other source water can cause water quality and
infrastructure problems when distributed.
43
Table 2-2: Pipe Material and Corrosion
Pipe
Material Comment
Copper Corrosion of galvanized pipes; corrosion of household plumbing systems; erosion of natural deposits; leaching from wood preservatives. In drinking water containing minerals and dissolved oxygen, corrosion rates are from 5 to 25 μm/yr. In high purity water (very soft) protective films do not form on the internal copper surfaces and corrosion rates from 3 to 130 μm/yr occur, increasing with increasing oxygen and carbon dioxide content. Low sulfide concentrations (as low as 10 ppb) can accelerate corrosion of copper alloys.
Lead Corrosion of household plumbing system; residue from man-made pollution such as auto emissions and paint; lead pipe, casing and solder. Waters of alkalinity of 60 mg/L or below will generally be less corrosive to lead if the pH is 7.5 or above. Increased dissolved oxygen will generally be expected to cause increased corrosion of lead.
Cast Iron Pipe
Interior corrosion, formation of tubercles, most biofilm growth, used for service lines. Internal corrosion will depend on water hardness, alkalinity, chlorides, sulfates, silica, dissolved gases, pH, temperature and velocity. Graphitic corrosion and bacterial attack are common causes of fracture of cast iron water piping; graphite dispersed in cast iron serves as the cathode, and the iron-silicon alloy, the anode. This results in the dissolution of the iron alloy and leaves black soft graphite as a structurally deficient material.
Lead Pipe Joints
Water is naturally corrosive and can pick up microscopic amounts of lead if it sits idle for extended periods of time.
Ductile Iron Pipe
Arsenic, mercury, and Bacillus subtilis all strongly adhere to cement-lined ductile iron pipe. Ductile iron pipe is typically furnished with cement-mortar lining to prevent internal corrosion.
Steel Pipe Used for service lines and taps; external corrosion can occur. Since pitting can be facilitated by the deposition of copper on zinc, galvanized steel should not be installed downstream of copper tubes and fittings. Stainless steel has good corrosion resistance to potable waters including soft (desalinated) supplies.
Plastic Pipe Used for water supply piping, resistant to corrosion ; lower tendency for biofilm growth than metallic counterparts. Many varieties available; brittleness can be a problem. Leaching of chemical plasticizer residuals can occur internally.
Asbestos Cement
Asbestos-cement (AC) pipe has been widely used for potable water piping. Low pH, low alkalinity water are aggressive to AC pipes. Rates of deterioration can be reduced by chemical treatment to increase the water‟s buffer capacity but will not prevent the release of fibers from pipes that have already been degraded.
44
Indices for Predicting Corrosive and Scale Tendencies of a Water
Several indices have been developed to indicate the stability or corrosiveness of potable
water. Although no single index is definitive, and some may at times be misleading, potable water
corrosiveness or scaling potential can be evaluated and determined with a combination of indices.
Each index provides information on the nature of the potable water; however, many of the indexes
found in the water treatment and corrosion control literature are only approximations.
Corrosion Indices
For the purposes of this evaluation, buffer intensity, the calcium saturation index (CSI),
metals, dissolved organics, and residual chlorine.
The sodium adsorption ratio (SAR) is defined as being the concentration of sodium (Na)
divided by the square root of the quantity equal to one half of the sum of the concentrations of
79
calcium (Ca) and magnesium (Mg), where all concentrations are expressed in milliequivalents per
liter, as shown in equation (2.27):
SAR = 𝑁𝑎
𝐶𝑎 +𝑀𝑔
2
(2.27)
The SAR commonly is used in association with electrical conductivity (ECw) of the irrigation
water to evaluate potential hazards associated with sodium (Rowe and Abdel-Magid 2007). Table 2-3
illustrates the degree of concern related to SAR and ECw: Desalinated water 70 typically will have
very low ECw values.
Table 2-4: SAR Versus ECw
SAR Conductivity (μmhos/cm) and Degree of Restrictions
on Use
0-3 None Moderate Severe
0-3 ECw>700 200<ECw<700 ECw < 200
3-6 ECw>1,200 300<ECw<1,200 ECw<300
6-12 ECw>1,900 500<ECw<1,900 ECw<500
12-20 ECw>2,900 1,300<ECw<2,900 ECw<1,300
20-40 ECw>5,000 2,900<ECw<5,000 ECw<2,900
Source Rowe and Abdel-Magid, 2007
The effect of the SAR is that sodium will take the place of the calcium and magnesium
present in the clay particles of the soil. This reaction reduces the effective infiltration capacity of the
soil. The SAR is of great concern in areas with high clay content, however in areas with sandy soil
containing little to no clay, the SAR concerns are less critical. The SAR is also of less concern when
regular “leaching” occurs when water with little to no sodium content washes the soil profile. An
example of this would be seasonal rains on an annual basis. The third concern with the SAR is the
salinity, which is measured as conductivity. As the conductivity increases, the SAR‟s infiltration
effects are not as critical, so that a range of 3 to 7 is provided for blending targets for desalinated
permeate.
80
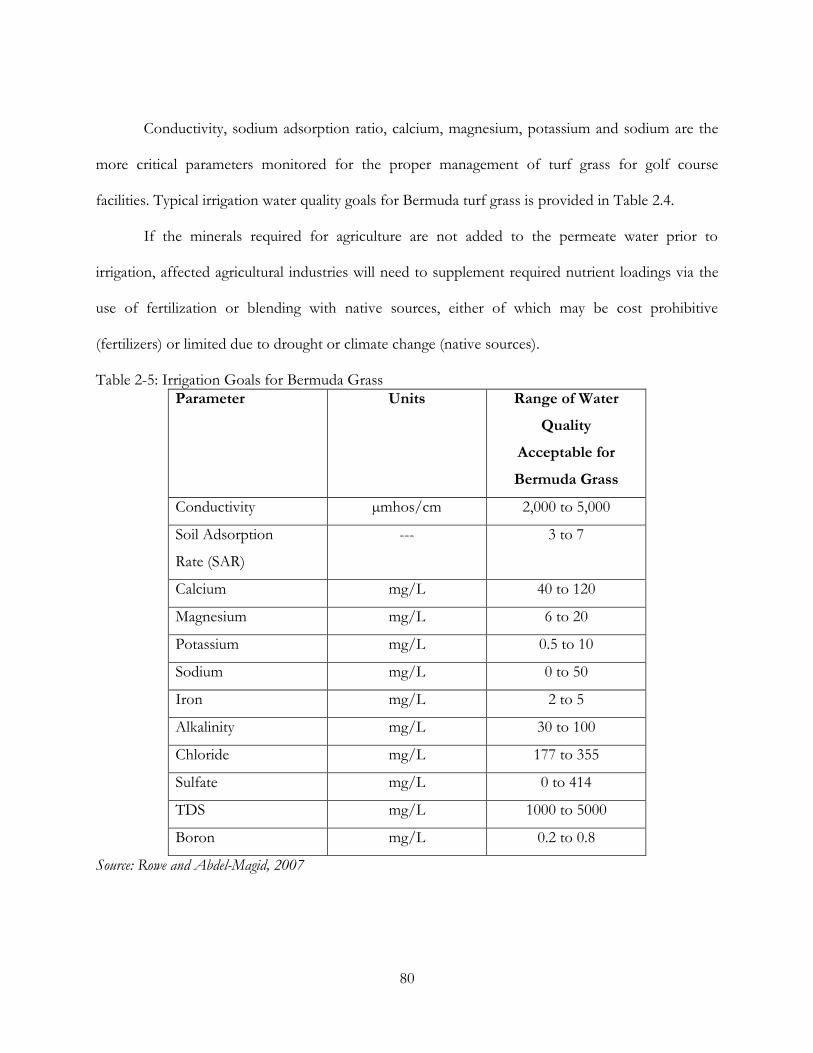
Conductivity, sodium adsorption ratio, calcium, magnesium, potassium and sodium are the
more critical parameters monitored for the proper management of turf grass for golf course
facilities. Typical irrigation water quality goals for Bermuda turf grass is provided in Table 2.4.
If the minerals required for agriculture are not added to the permeate water prior to
irrigation, affected agricultural industries will need to supplement required nutrient loadings via the
use of fertilization or blending with native sources, either of which may be cost prohibitive
(fertilizers) or limited due to drought or climate change (native sources).
Table 2-5: Irrigation Goals for Bermuda Grass
Parameter Units Range of Water
Quality
Acceptable for
Bermuda Grass
Conductivity µmhos/cm 2,000 to 5,000
Soil Adsorption
Rate (SAR)
--- 3 to 7
Calcium mg/L 40 to 120
Magnesium mg/L 6 to 20
Potassium mg/L 0.5 to 10
Sodium mg/L 0 to 50
Iron mg/L 2 to 5
Alkalinity mg/L 30 to 100
Chloride mg/L 177 to 355
Sulfate mg/L 0 to 414
TDS mg/L 1000 to 5000
Boron mg/L 0.2 to 0.8
Source: Rowe and Abdel-Magid, 2007
81
Summary of Literature Review Findings
Desalination will result in the production of water having low dissolved solids content that can
and will cause internal corrosion, and may not be fit for human consumption. Pure water is
considered a reactive chemical: when air is dissolved in extremely pure water, the resultant solution
is very corrosive. Water that contains little to no hardness would be considered unhealthy for
potable use and water that contains no dissolved oxygen may be offensive and taste flat.
Consequently, post-treatment of membrane desalinated water is required prior to storage and
distribution for municipal water purveyors, and must include disinfection.
There are four primary issues concerning the post-treatment water. These relate to blending,
remineralization, disinfection and the materials used for storage and transport of the water to the
tap. Desalinated water is often blended with other sources that contribute minerals to the final
blended water. Seawater as a source for blending is limited due to issues related to corrosivity and
taste if the blending levels exceed about 1%. Blending of permeate water with seawater results in the
addition of sodium, potassium, calcium, and magnesium to drinking-water but also will contribute
bromide and iodide which are DBP precursors, and is limited in quantity due to the significant
concentrations of these constituents. Consideration should be given to the natural minerals present
and whether these will result in finished water having unacceptable water qualities in addition to
unacceptable taste and odor.
Membranes do not remove small, uncharged molecular contaminants or dissolved gases such as
carbon dioxide, hydrogen sulfide and methane. If hydrogen sulfide is present in a source ground
water, it must be removed, typically by packed tower or air stripping processes prior to disinfection
and distribution to consumers. If sulfides are removed in the stripping process, then provision are
also made to remove (scrub) the off-gas sulfides from the air stripping tower off gas to prevent odor
82
and external corrosion issues on surrounding buildings and infrastructure. The stripping of carbon
dioxide and hydrogen sulfide raises the pH and reduces the amount of base needed to perform
stabilization. Permeate is typically low in calcium, magnesium, alkalinity and may have a low pH if
acid was used for pretreatment ahead of the membrane process. Since the permeate is corrosive to
downstream piping and appurtenances, alkalinity and pH adjustments are accomplished with bases
such as sodium hydroxide, and inhibitors may also be employed for corrosion control purposes.
There is also an issue regarding potential anthropogenic pollutants from a range of sources,
which need to be considered on a local basis, whenever any external and potentially minimally
treated source is used, taking into account potential pollution sources and threats. Disinfection and
filtration of the blending water will be necessary if there is any possibility of microbiological or other
regulated parameter contamination, in which case similar considerations regarding the formation of
by-products in the blending water apply.
Generally the natural organic matter or TOC content in finished water is very low and the yield
of by-products from final disinfection would be expected to be low as a consequence (McGuire
Environmental 2004). However, blending with other source waters can prove to be problematic for
desalted permeate, should bromide and iodide be present, or should the blend not provide enough
buffering to the desalted permeate resulting in an unstable finished water.
Chemicals and Post-treatment Issues
Post-treatment may be achieved by the addition of chemicals as described in the literature. If this is
undertaken there are three primary concerns that need to be addressed:
a) The quality of the additives and the introduction of chemical contaminants produced
during the manufacture, storage, distribution and transport. Unlike pre-treatment
chemicals, there are no downstream processes that will remove undesirable contaminants.
83
b) Controlling dose rates so that required concentrations are provided.
c) Preventing or minimizing unwanted chemical reactions following chemical addition. This
issue is similar to blending. Localized changes can occur at dosing points leading to
fouling problems on a micro-scale.
Brackish and Sea Water Post-treatment
Post-treatment of the permeate water from the desalination processes can include several
unit operations, each dependent upon the source water type and desalination method.
Considerations of post-treatment, based on literature findings, will include:
Stabilization by addition of carbonate alkalinity; corrosion inhibition; remineralization by
blending with source water; disinfection and enhanced removal of specific compounds
(i.e., boron, silica, NDMA, etc.). Stabilization by addition of calcium carbonate alkalinity
is the most widely used approach for corrosion control of metallic pipelines and
distribution systems;
Corrosion inhibition is the most popular post-treatment method for plastic pipelines and
distribution systems;
Sodium hypochlorite and chlorine gas are most widely used for disinfection of
desalinated water;
Use of chloramines instead of chlorine for disinfection is more advantageous when
product water must be conveyed over long distances (over 100 km) or stored for long
periods of time (several days) due to the significantly lower decay rate of chloramines
compared to free chlorine.
84
Use of ozone as a disinfectant for desalinated water has the potential of forming
disinfection by-products and bromate.
Blending of desalinated water for re-mineralization is suitable with brackish water, and
only up to about 1% with seawater. The raw water used for blending should be
pretreated for chemical and microbial control prior to mixing with the desalinated water.
The primary desalination water plant post-treatment unit operations for potable water supplies
reliant upon brackish ground water are the following (AWWA 2007; Duranceau 1993):
a. Carbon dioxide removal (degasification or decarbonation);
b. Hydrogen sulfide removal (stripping) and odor control treatment (scrubbing);
c. Alkalinity recovery, pH adjustment, stabilization and corrosion control; and,
d. Disinfection.
Alternative treatments reported for use in seawater desalination post-treatment applications include
(Withers 2005):
1. Addition of carbon dioxide and excess lime;
2. Filtration of carbon dioxide dosed permeate through limestone bed contactors;
3. Application of sodium carbonate and hydrated lime;
4. Application of sodium bicarbonate and calcium sulfate;
5. Application of sodium bicarbonate and calcium chloride;
6. Blending with a native low-salinity water source or by-pass blending.
Remineralization can be categorized into a series of four treatment processes: (1) chemical addition
without lime or limestone; (2) carbon dioxide addition followed by limestone bed contactors for
dolomitic dissolution, (3) carbonic acid addition followed by lime dosing; and (4) blending with
water containing high mineral content.
85
Identified Water Quality Goals for Post-treatment Processes
The discussions provided herein this literature review indicate clearly that stabilization and
disinfection are fundamentally important in the proper design and operation of post-treatment
processes. It is therefore important to develop treatment goals and condition that can be used as a
guide for developing post-treatment concepts. Although the development of these goals is site
specific to the desalination process and source(s) water(s) used, it has been recommended that the
following goals could be used as a guide for desalination post-treatment processes (AWWA 2007;
Lahav and Birnhack, 2007):
Alkalinity ≥ 80 mg/L as CaCO3
Calcium between 80 and 100 mg/L as CaCO3
CCPP between 4 and 10 mg/L as CaCO3
Larson ratio < 5
Producing an alkalinity greater than or equal to 80 mg/L as CaCO3 has been shown as a goal
because it has been suggested by others that alkalinity less than this value is considered low and may
result in poor buffering resulting in pH variations in distribution systems (Holm and Schock 1991;
Taylor et al. 2005). It should be noted that the TDS content should be similar to other supplies
when consecutive distribution systems are impacted by the inclusion of a desalination process into a
water community‟s treatment portfolio. Consideration of a stabilized and disinfected permeate (and
its blends) SAR value should be taken into account when water quality goals are to be developed, in
addition to possible further consideration of permeate boron when seawater supplies are to be used
in a system that includes irrigation as an end-use.
86
CHAPTER THREE: PERMEATE POST TREATMENT PRACTICES QUESTIONNAIRE
Utility Questionnaire
A utility questionnaire was developed and distributed to the fourteen participating utilities in
this research project, in addition to many utilities not directly participating in the research workshop.
The utility questionnaire was organized using information obtained from the literature review, as
well as from individual participant utility phone interviews conducted by UCF. Internet searches of
industry, academic and regulatory sources, and organizations aided in identifying additional
information, and provided for a basis of other municipal desalination facilities of interest.
The design of the questionnaire included questions relative to post-treatment stabilization
options and impacts to the distribution system and water quality data. The questionnaire required
documentation of post-treatment quality characteristics, operation information, general capital, and
maintenance cost for post-treatment. A total of eight-three questionnaires were distributed, of which
twenty-five (30 percent reporting) were returned and used for data analysis based on survey
responses by each utility.
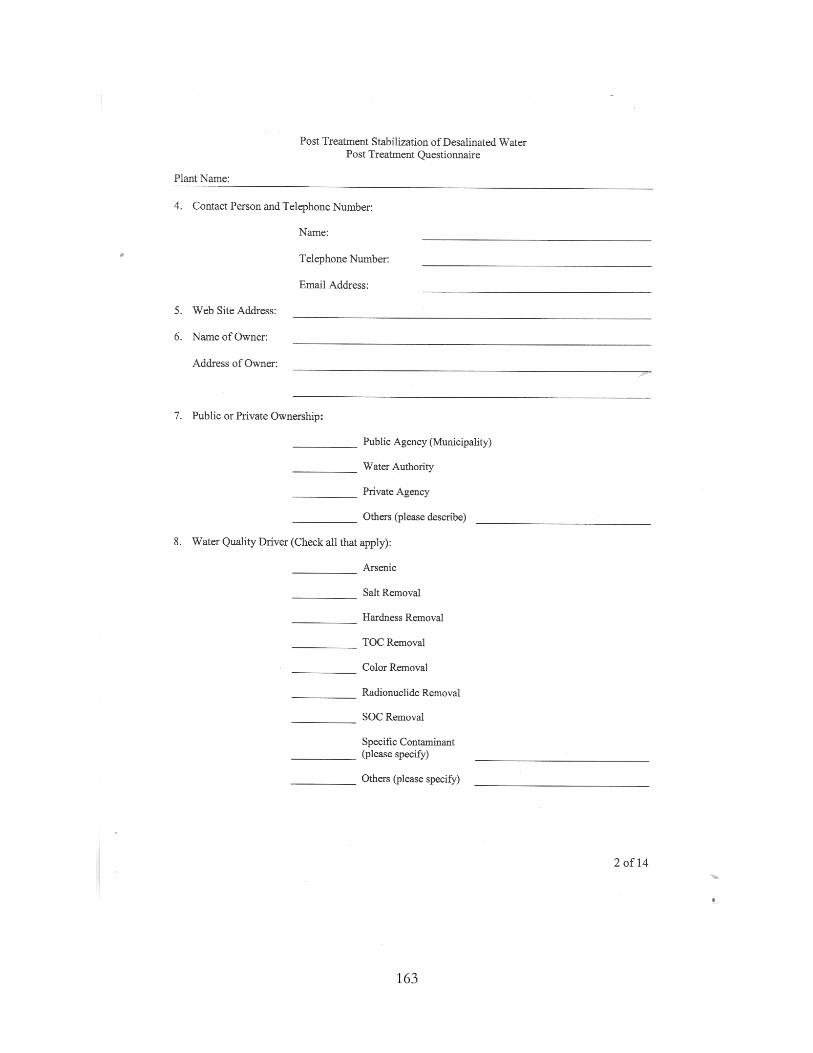
A copy of the utility questionnaire presenting each question and requests for specific
information is located in Appendix A. The questionnaire was organized and categorized into seven
sections:
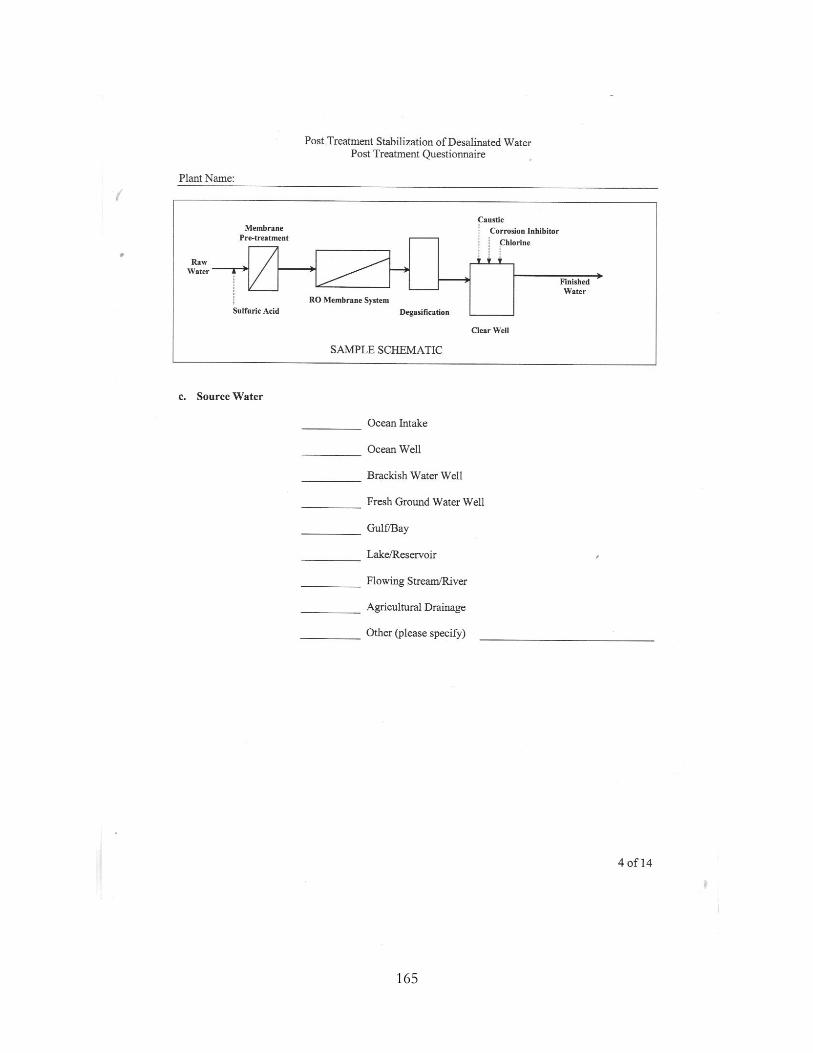
1. Section I requested general information about the desalting facility (or facilities).
2. Section II requested more specific plant characteristics along with a plant schematic showing
pre-treatment and post-treatment processes.
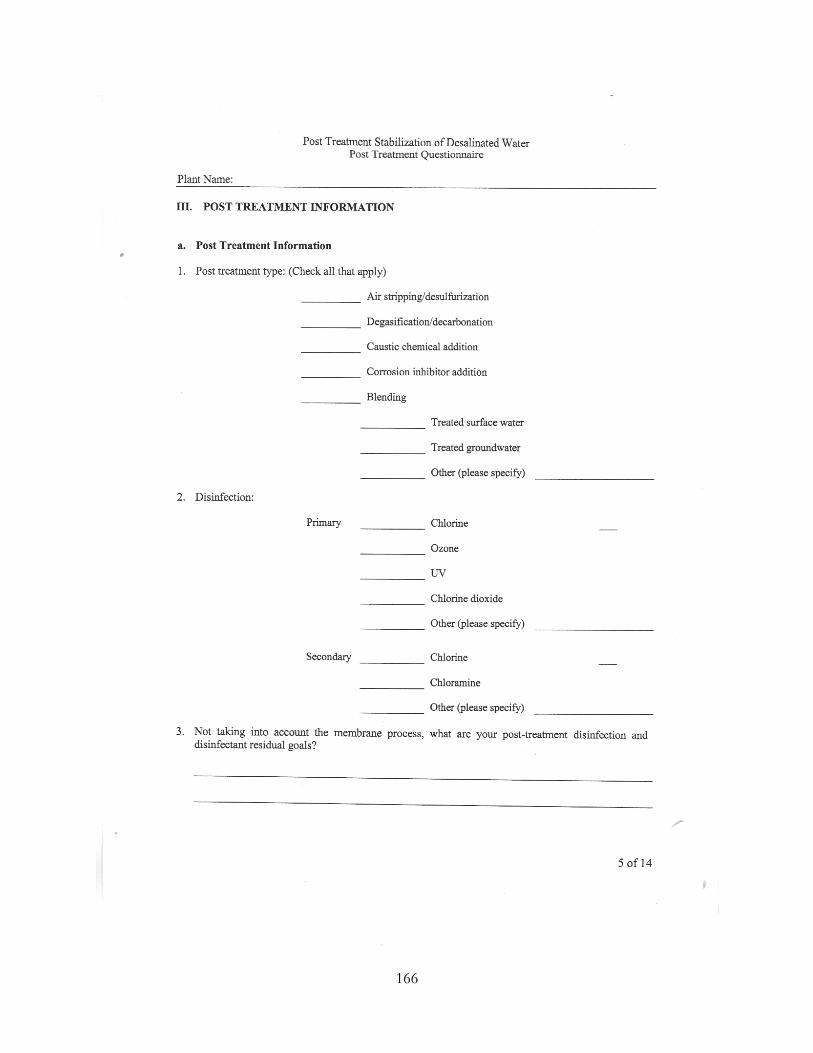
3. Section III was to obtain post-treatment information for each facility with specific
information on water quality.
87
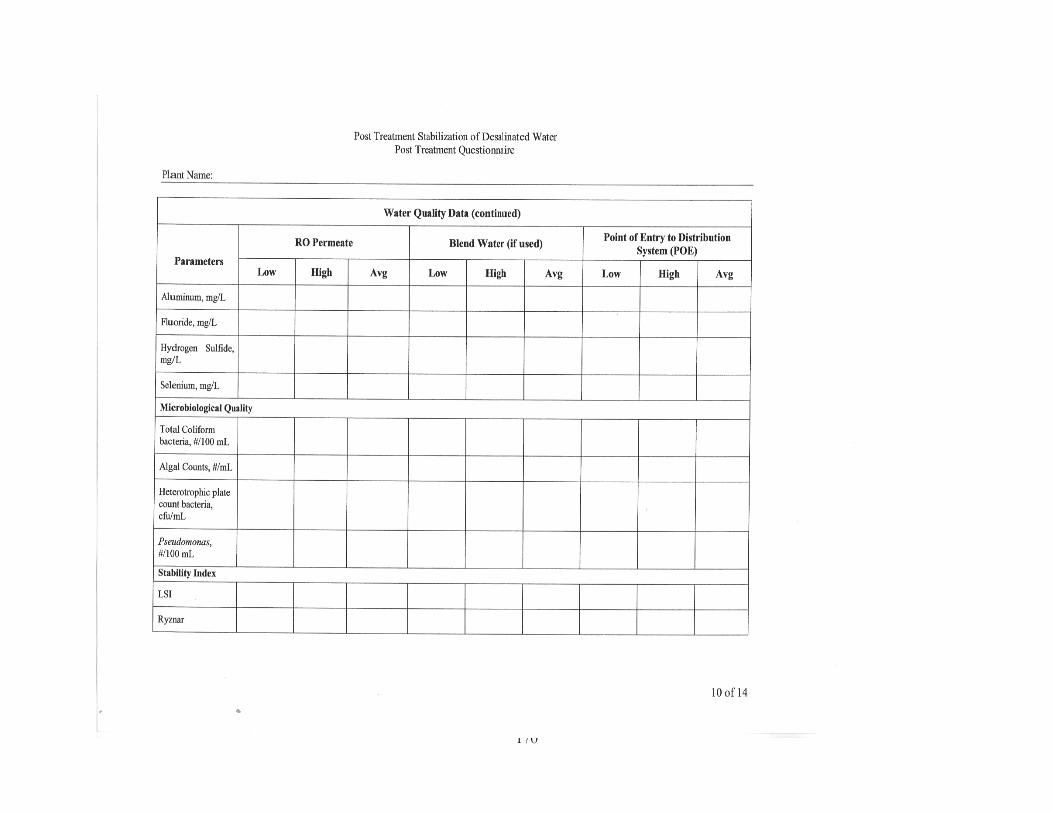
4. Section IV with regard to permeate quality, blend, and point-of-entry (POE) quality.
5. Section V requesting information on post-treatment operation
6. Section VI was designed to obtain information on post-treatment operation and
maintenance costs.
7. Section VII was seeking information on lessons learned and/or major issues experienced
with respect to post-treatment operations and practices.
Survey Response
Section I: Background Information
This section requested respondents to provide their plant name, address, and type as
categorized by total dissolved solids (TDS) levels. An additional question asked if the source water
was considered as groundwater under the direct influence of surface water (GWUI). Respondents
indicated the type of source water their desalination plant processed, with seven categories identified
as provided:
1. Seawater [SW]: (20,000 – 35,000 mg/L TDS)
2. High Brackish Groundwater [GW]: (>7,500 - <20,000 mg/L TDS)
3. High Brackish Surface Water [SFW]: (>7,500 - <15,000 mg/L TDS)
4. Low Brackish GW: (1,000 – 5,000 mg/L TDS)
5. Low Brackish SFW: (1,000 – 2,500 mg/L TDS)
6. Fresh GW: (<1,000 mg/L)
7. Fresh SFW: (<1,000 mg/L)
Figure 3-1 presents a distribution that indicated ninety-two percent of the plants used
reverse osmosis membranes in their treatment process. The remainder of plants that responded was
88
divided between EDR and NF. Of those water purveyors reporting, forty-eight percent of the
utilities indicated that low brackish GW was the feed water type supplying their desalting process, as
indicated in Figure 3-2. None of the responding organizations was classified as either highly brackish
groundwater or highly brackish surface water. Twenty percent of the plants reporting indicated that
they utilize fresh groundwater, and twelve percent treated seawater. Eight percent of the reporting
plants represented low brackish surface water (SFW), and four percent utilized fresh SFW. Eight
percent of the respondents reported treating water not listed in the defined categories presented
herein.
Figure 3-1: Distribution of Plants Surveyed
0
5
10
15
20
25
RO EDR NF
Nu
mb
er
of
Pla
nts
Process
RO
EDR
NF
89
Figure 3-2: Plant Type Categorized by Feedwater TDS
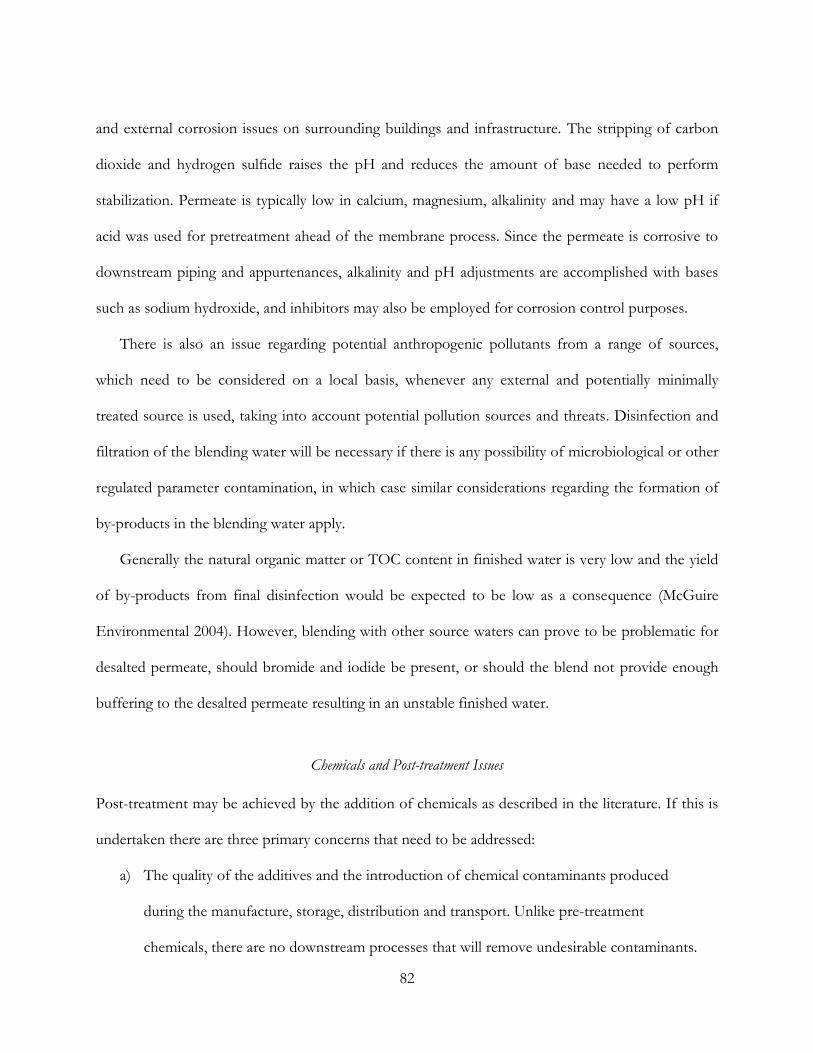
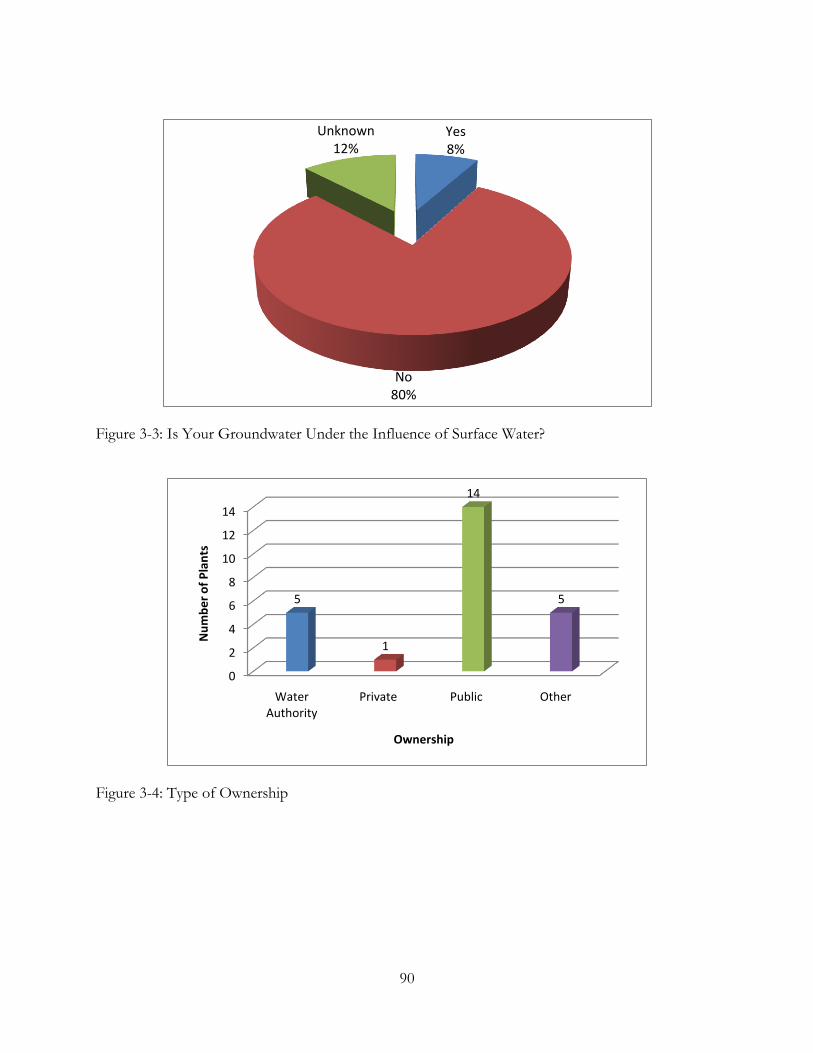
Figure 3-3 shows the percentage of utilities treating water that are considered groundwater
under the influence of surface water (GWUI). Twelve percent of the respondents were uncertain if
their source water was considered GWUI. Eighty percent of the responding utilities indicated that
their ground water was not influenced by groundwater.
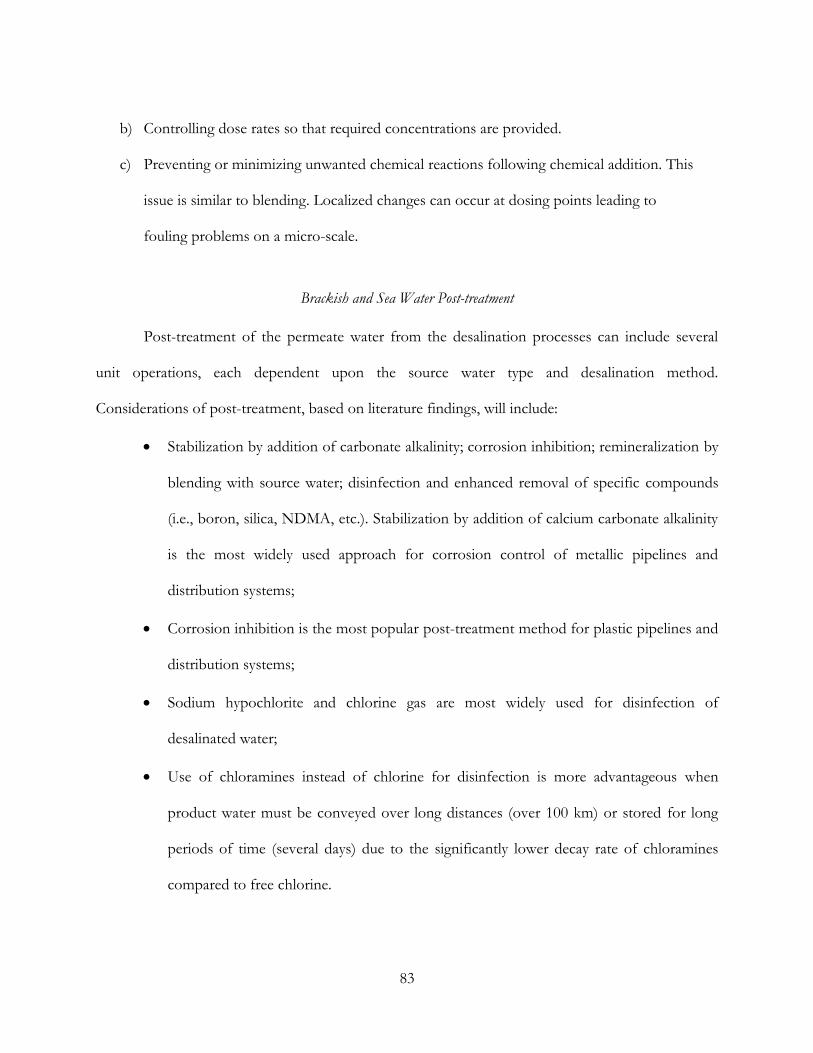
Figure 3-4 presents the different types of ownership classification of the respondent utilities,
with fifty-six percent of the desalting plants being publicly owned water treatment facilities, and an
additional twenty percent of the utilities reported to be classified as a water authority. An additional
twenty percent of the utilities responding were classified as other. Only four percent of the surveyed
groups could be considered private. One component of the questionnaire was designed to determine
what water quality drivers for the use of desalination treatment. Those surveyed were requested to
provide information on what specific water quality parameter or combination of water quality
parameters drove the decision for the use of their desalination process for water treatment, further
defining the type of TDS that was being treated.
Seawater12%
Low Brackish GW48%
Low Brackish SFW8%
Fresh SFW4%
Fresh GW20%
Other8%
90
Figure 3-3: Is Your Groundwater Under the Influence of Surface Water?
Figure 3-4: Type of Ownership
Yes 8%
No80%
Unknown12%
0
2
4
6
8
10
12
14
Water Authority
Private Public Other
5
1
14
5
Nu
mb
er
of
Pla
nts
Ownership
91
As shown in Figure 3-5, of the twenty-five reporting utilities, sixty-eight percent of the plants
listed salt removal as the major water quality driver. In addition, hardness removal was identified by
sixty-four percent of the respondents as a major water quality driver, whereas twenty-four percent of
the facilities listed total organic carbon (TOC). A portion of the respondents reported that some
other driver was responsible for the decision to use a desalting process, and none reported the use of
the technology for synthetic organic compound (SOC) removal
Figure 3-5: Water Quality Driver
02468
1012141618
1
17 16
64
1 0
6
3
Nu
mb
er
of
Pla
nts
Driver
92
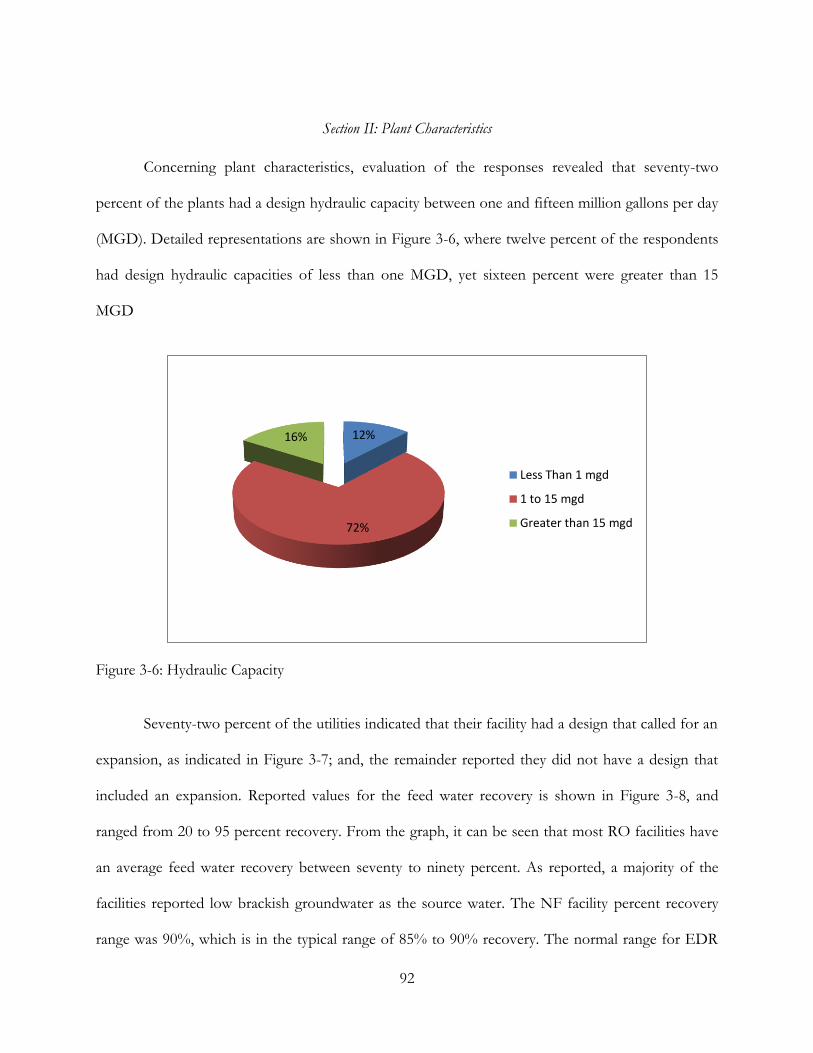
Section II: Plant Characteristics
Concerning plant characteristics, evaluation of the responses revealed that seventy-two
percent of the plants had a design hydraulic capacity between one and fifteen million gallons per day
(MGD). Detailed representations are shown in Figure 3-6, where twelve percent of the respondents
had design hydraulic capacities of less than one MGD, yet sixteen percent were greater than 15
MGD
Figure 3-6: Hydraulic Capacity
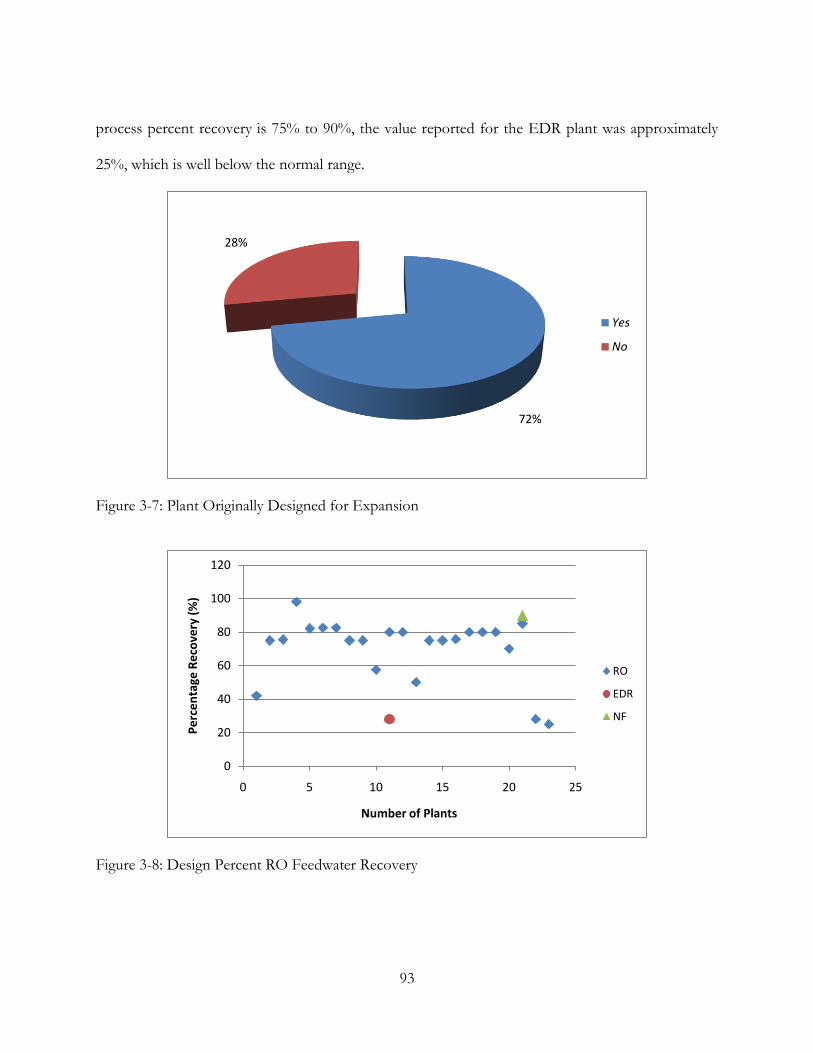
Seventy-two percent of the utilities indicated that their facility had a design that called for an
expansion, as indicated in Figure 3-7; and, the remainder reported they did not have a design that
included an expansion. Reported values for the feed water recovery is shown in Figure 3-8, and
ranged from 20 to 95 percent recovery. From the graph, it can be seen that most RO facilities have
an average feed water recovery between seventy to ninety percent. As reported, a majority of the
facilities reported low brackish groundwater as the source water. The NF facility percent recovery
range was 90%, which is in the typical range of 85% to 90% recovery. The normal range for EDR
12%
72%
16%
Less Than 1 mgd
1 to 15 mgd
Greater than 15 mgd
93
process percent recovery is 75% to 90%, the value reported for the EDR plant was approximately
25%, which is well below the normal range.
Figure 3-7: Plant Originally Designed for Expansion
Figure 3-8: Design Percent RO Feedwater Recovery
72%
28%
Yes
No
0
20
40
60
80
100
120
0 5 10 15 20 25
Pe
rce
nta
ge R
eco
very
(%
)
Number of Plants
RO
EDR
NF
94
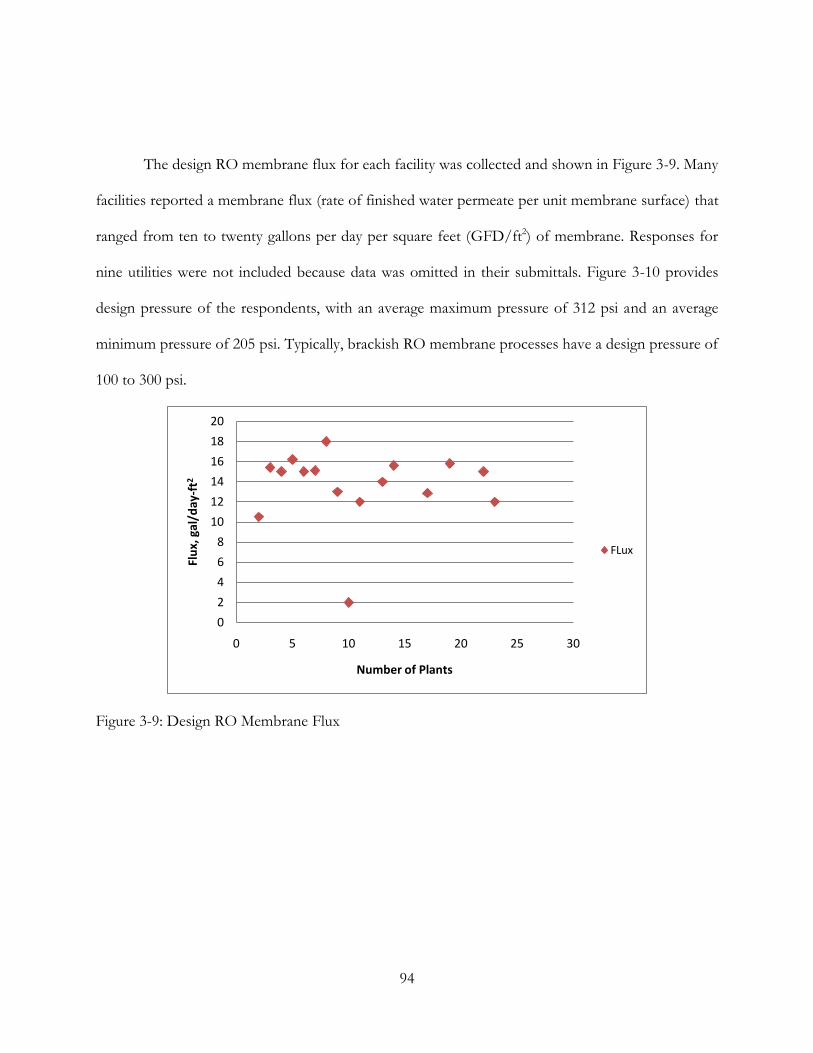
The design RO membrane flux for each facility was collected and shown in Figure 3-9. Many
facilities reported a membrane flux (rate of finished water permeate per unit membrane surface) that
ranged from ten to twenty gallons per day per square feet (GFD/ft2) of membrane. Responses for
nine utilities were not included because data was omitted in their submittals. Figure 3-10 provides
design pressure of the respondents, with an average maximum pressure of 312 psi and an average
minimum pressure of 205 psi. Typically, brackish RO membrane processes have a design pressure of
100 to 300 psi.
Figure 3-9: Design RO Membrane Flux
0
2
4
6
8
10
12
14
16
18
20
0 5 10 15 20 25 30
Flu
x, g
al/d
ay-f
t2
Number of Plants
FLux
95
Figure 3-10: Design Pressure
Each facility was requested to indicate the end use of permeate, as shown in Figure 3-11.
Most plants (seventy-seven percent) reported only one end use of the permeate water, that being
potable water, with only a few plants reporting alternative end-uses, seven percent of which included
irrigation and six percent listing an industrial end-use. Three percent of the respondents reported
ground water as a seawater intrusion barrier. Distribution of source water for the facility for each
survey respondent can be seen in Figure 3-12. Approximately fifty percent of the plants reported
brackish water well for their source water.
0
100
200
300
400
500
600
700
800
900
1000
1 3 5 7 9 11 13 15 17 19 21 23 25
Pre
ssu
re ,
psi
Number of Plant
Max Pressure, psi
Min Pressure, psi
96
Figure 3-11: Permeate Water End-Use
Figure 3-12: Source Water
77%
6%
7%3% 7%
Potable Water
Industrial Use
Groudwater Recharge
Ground water
Irrigation
0
2
4
6
8
10
12
2
12
6
21
2
97
Section III: Post-treatment Information
Table 3-1 summarizes findings related to post-treatment types and associated disinfection
practices. Regarding post-treatment, seventy-two percent of the plants used caustic chemical
addition and sixty-four percent rely on blending. Most plants used a combination of disinfection
practices for post-treatment. For primary disinfection, sixty-eight percent of the plants use chlorine
addition and for secondary treatment forty-four percent of the plants implemented chloramines.
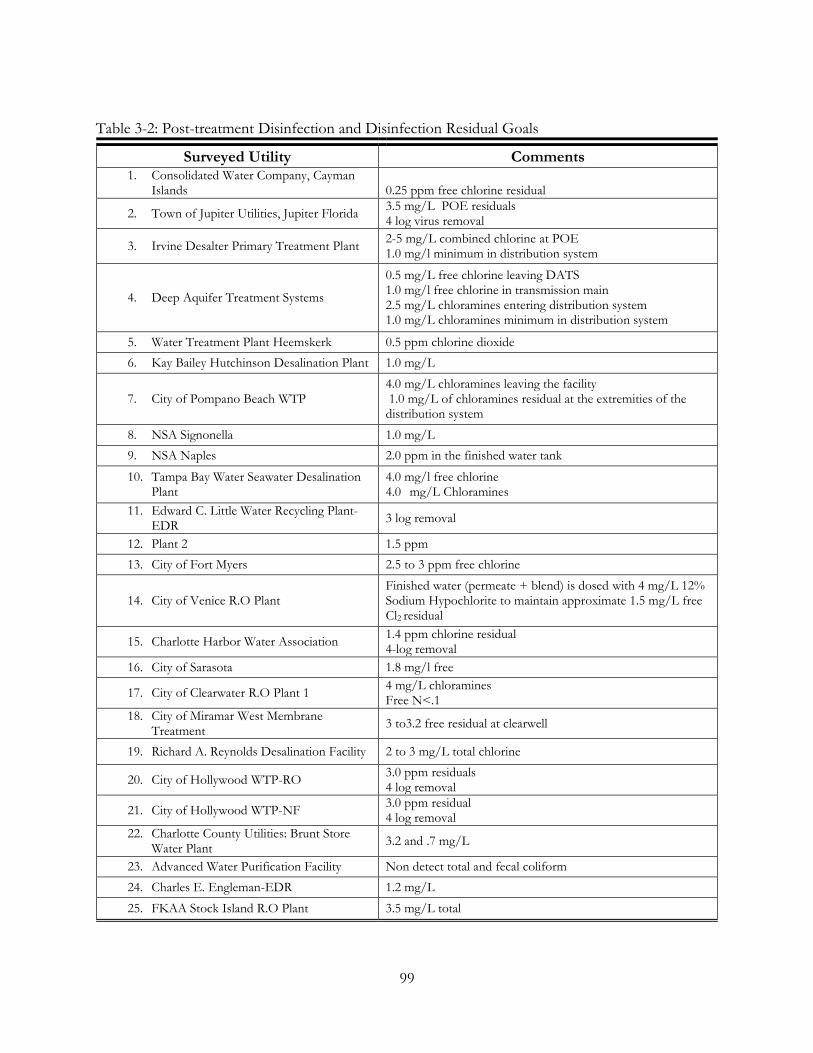
None of the respondents used ozone. Table 3-2 details the response given by the facilities in regards
post-treatment disinfection and residual goals at the facility. Disinfection chemicals reported to be
used include free chlorine and chloramines. Goals for free chlorine leaving the facilities ranged from
0.5 mg/L to 4 mg/L. Log removal of contaminants ranged from 3 to 4 log removal, representing
99.9% to 99.99% reduction of contaminants. Residual goals ranged from 2-4 mg/L.
98
Table 3-1: Post-treatment Types and Disinfection
Number Question
Response
Yes No
1 Post-treatment Type:
Air Stripping 28% 72%
Degasification 64% 36%
Caustic Chemical Addition 72% 28%
Corrosion Inhibitor Addition 32% 68%
Blending 64% 36%
Treated SW 12% 88%
Treated GW 36% 64%
Other 36% 64%
2 Disinfection: Primary
Chlorine 68% 32%
Ozone 0% 100%
UV 8% 92%
Chlorine Dioxide 4% 96%
Other 20% 80%
Disinfection: Secondary
Chlorine 12% 88%
Chloramines 44% 56%
Other 4% 96%
99
Table 3-2: Post-treatment Disinfection and Disinfection Residual Goals
Surveyed Utility Comments 1. Consolidated Water Company, Cayman
Islands 0.25 ppm free chlorine residual
2. Town of Jupiter Utilities, Jupiter Florida 3.5 mg/L POE residuals 4 log virus removal
3. Irvine Desalter Primary Treatment Plant 2-5 mg/L combined chlorine at POE 1.0 mg/l minimum in distribution system
4. Deep Aquifer Treatment Systems
0.5 mg/L free chlorine leaving DATS 1.0 mg/l free chlorine in transmission main 2.5 mg/L chloramines entering distribution system 1.0 mg/L chloramines minimum in distribution system
5. Water Treatment Plant Heemskerk 0.5 ppm chlorine dioxide
6. Kay Bailey Hutchinson Desalination Plant 1.0 mg/L
7. City of Pompano Beach WTP 4.0 mg/L chloramines leaving the facility 1.0 mg/L of chloramines residual at the extremities of the distribution system
8. NSA Signonella 1.0 mg/L
9. NSA Naples 2.0 ppm in the finished water tank
10. Tampa Bay Water Seawater Desalination Plant
4.0 mg/l free chlorine 4.0 mg/L Chloramines
11. Edward C. Little Water Recycling Plant-EDR
3 log removal
12. Plant 2 1.5 ppm
13. City of Fort Myers 2.5 to 3 ppm free chlorine
14. City of Venice R.O Plant Finished water (permeate + blend) is dosed with 4 mg/L 12% Sodium Hypochlorite to maintain approximate 1.5 mg/L free Cl2 residual
15. Charlotte Harbor Water Association 1.4 ppm chlorine residual 4-log removal
16. City of Sarasota 1.8 mg/l free
17. City of Clearwater R.O Plant 1 4 mg/L chloramines Free N<.1
18. City of Miramar West Membrane Treatment
3 to3.2 free residual at clearwell
19. Richard A. Reynolds Desalination Facility 2 to 3 mg/L total chlorine
20. City of Hollywood WTP-RO 3.0 ppm residuals 4 log removal
21. City of Hollywood WTP-NF 3.0 ppm residual 4 log removal
22. Charlotte County Utilities: Brunt Store Water Plant
3.2 and .7 mg/L
23. Advanced Water Purification Facility Non detect total and fecal coliform
24. Charles E. Engleman-EDR 1.2 mg/L
25. FKAA Stock Island R.O Plant 3.5 mg/L total
100
Table 3-3 indicates that there were plants that believed they had significant problems with
post-treatment. Twenty percent of the plants identified biological growth in degasification and
stripping towers as a problem. Distribution impacts for each plant are presented in Table 3-4. Of the
plants surveyed, twenty-four percent of the responding parties reported that they had experienced
red water or black water events.
Table 3-3: Have you experienced any post-treatment problems within the plant?
Number Question
Response
Yes No
4 Have you experienced any post-treatment problems within
the plant?
Blending Limitations 8% 92%
Scaling of Degasification/stripping towers 16% 84%
Biological growth in Degasification/stripping towers 20% 80%
Chemical Injector plugging 16% 84%
Issues with Cleaning Post-treatment Equipment 0% 100%
White Water formation 4% 96%
Corrosion Events 12% 88%
Colored or red water 16% 84%
Others 20% 80%
101
Table 3-4: Any distribution system impacts noted?
Number Question
Response
Yes No
5 Any distribution system impacts noted?
Corrosion events (infrastructure) 16% 84%
Lead and Copper Rule Impacts 4% 96%
Disinfection By-Products 4% 96%
Taste and Odor 0% 100%
Detention time prior to point of entry 4% 96%
Detention time after point of entry 0% 100%
pH stability 16% 84%
Disinfection residual stability 20% 80%
White water 0% 100%
Color 12% 88%
Red water/black water 24% 76%
Biological regrowth 12% 88%
Others 12% 88%
Table 3-5 lists descriptions given by the facilities with responses describing their blending or
by-pass process. From the descriptions provided it is apparent most facilities incorporated form of
blending or bypass for post-treatment processing of permeate water.
Table 3-6 lists the detailed description given by the facilities with response describing their
sequence of post-treatment operations. With regards to the sequence of post-treatment operations
respondent facilities detailed descriptions were provided. The sequence of post-treatment varied for
each facility. Most facilities utilized blending, ph adjustment using CO2 or NaOH. Desgasifiers were
used for gas removal, and for disinfection chorine or chloramines addition was utilized.
102
Table 3-5: Blending or By-Pass Descriptions
Surveyed Utility Comments 1. Consolidated Water Company, Cayman Islands Not Reported
2. Town of Jupiter Utilities, Jupiter Florida Lime softened and ion exchange water is blended with RO permeate
3. Irvine Desalter Primary Treatment Plant RO permeate produced goes through decarbonation and is then blended with raw groundwater
4. Deep Aquifer Treatment Systems
Blend concentrate treatment system NF permeate with Deep Aquifer Treatment System NF permeate. The combined flow s blend with untreated , disinfected groundwater in the transmission main
5. Water Treatment Plant Heemskerk Ration WTP Mensink = 7 Mm3/y to 30.09Mm3/y variable; Ratio WTP Bergen = 9.2 Mm3/y to 13.68 Mm3/y fixed on TH = 1.5 mmol/L
6. Kay Bailey Hutchinson Desalination Plant Permeate blended with brackish feed water
7. City of Pompano Beach WTP Marginal Bleeding occurs in two clear wells and is not adequate.
8. NSA Signonella Adjust hardness and alkalinity
9. NSA Naples Blending water is filtered by Granular Activated Carbon filter then blended with RO permeate (manually control)
10 Tampa Bay Water Seawater Desalination Plant
Finished water from seawater desalination plant blends with finished water from the regional SWTP. The blended product if adjusted for finished pH and alkalinity then blends with groundwater
11. Edward C. Little Water Recycling Plant Seventy percent post RO water goes to Decarbonation Towers-30% by passes
12. Plant 2 Blend up to 5% to add back some fluoride
13. City of Fort Myers By-pass 10% raw water through a cartridge filter into the product water
14. City of Venice R.O Plant Six Percent of raw water is by-passed through 5 micron cartridge filters and blended with product water stream prior to degasification and post-treatment
15. Charlotte Harbor Water Association Filtered with sand separators and micron filters has been treated with anti-scalant
16. City of Sarasota RO product water blended with ion exchange treated raw water raw water which has be degasified and chlorinated to breakpoint
17. City of Clearwater R.O Plant 1 Thirty-three percent of filtered effluent is blended with permeate for stabilization. Fifty percent sodium hydroxide is added to permeate for pH adjustment
18. City of Miramar West Membrane Treatment Not Reported
19. Richard A. Reynolds Desalination Facility Raw bypass water is blended with permeate following the degasifiers but before chlorine and caustic addition
20. City of Hollywood WTP-RO Finished water product form (Lime softening, RO, NF) is blended together on one blend tank and then pumped to onsite storage tanks. Cl2, Caustic, and Fluoride are added in blend tank
21. City of Hollywood WTP-NF Finished product water from (Lime Softening, NF, RO) is blended is and the pumped to onsite storage tank
22. Charlotte County Utilities: Brunt Store WTP Blend water is filtered raw water after the pre-filters. Blend 10% of the total permeate gallons from the RO units
23. Advanced Water Purification Facility After RO there is a partial bypass of flow around decarbonation with majority sent to decarbonation towers
24. Charles E. Engleman-EDR No Response
25. FKAA Stock Island R.O Plant No Response
103
Table 3-6: Sequence of Post-treatment Operations
Surveyed Utility Comment 1. Consolidated Water Company, Cayman Islands Degasification, sodium hydroxide for pH-adjustment, disinfection
using calcium hypochlorite
2. Town of Jupiter Utilities, Jupiter Florida pH adjustment, degasification, chlorination, ammonization, blending
4. Deep Aquifer Treatment Systems Free Chlorine and degasification
5. Water Treatment Plant Heemskerk CO2 dosage followed by NaOH to form HCO3, transport, blending, pH correction with NaOH or CO2, ClO2 dosage distribution
6. Kay Bailey Hutchinson Desalination Plant Blending, pH control, disinfection, corrosion control
7. City of Pompano Beach WTP Addition of corrosion inhibitors, degasification, addition of caustic and some blending
8. NSA Signonella NaOH then NaOCL
9. NSA Naples Add NaOH the NaOCL
10. Tampa Bay Water Seawater Desalination Plant CO2 followed by saturated lime injection, then final disinfection with free chlorine (sodium hypochlorite)
11. Edward C. Little Water Recycling Plant Barrier Injection= peroxide, UV, Decarbonation, lime, storage. Industrial Use=Decarbonation , 2nd pas RO (for some water) to industry
12. Plant 2 Calcium Chloride, chloramines
13. City of Fort Myers Degasifiers, clear well CO2 addition, caustic addition, blend corrosion inhibitor, Fluoride
14. City of Venice R.O Plant Product stream blended w 6% raw water addition of CO2, degasification, Cl2 to NaOH for pH adjustment and zinc ortho-PO4 for corrosion control
15. Charlotte Harbor Water Association Blend, degasification, chlorine and soda addition
16. City of Sarasota Degasification, NaOH addition, Chlorine addition
17. City of Clearwater R.O Plant 1 Blend filtered/permeate and add free chlorine for .5 to .8 ppm dose; blend water enters 5 mg GST; Post disinfection is chloramination
18. City of Miramar West Membrane Treatment Chemical feed to clear well offsite storage tank with Cl2 booster
19. Richard A. Reynolds Desalination Facility Degasifiers, blend, chlorine(hypo caustic agent and blend ahead of blend point) chlorine contact tank (2-4 hrs), ammonia, high lift pumps, distribution
20. City of Hollywood WTP-RO Permeate water from the RO plant is sent to a Degasifier and the H2S gas goes thought a scrubber. The finished water then goes to the blend tank
21. City of Hollywood WTP--NF Permeate from the membrane plant is sent to a degasifer and then to the blend tank where it is blended and caustic sodium hypochlorite, and Florida is added
22. Charlotte County Utilities: Brunt Store WTP Degasification, sodium hydroxide injection, sodium hypochlorite injection, clear well water pumped to GST's
23. Advanced Water Purification Facility Take blend of fully and partially decarbonated RO product water and add lime solution. Lime solution by adding powered form hydrated lime (CaOH) to decarbonated RO water in a slurry unit tank and sending slurry to a saturator. Saturator supernatant drawn off for addition to plant effluent water
24. Charles E. Engleman-EDR Raise pH with NaOH
25. FKAA Stock Island R.O Plant Degasification, NaOH addition,NH3, Cl for disinfection
104
Table 3-7 shows that pH adjustment is the most common method for addressing
stabilization and corrosion control for the utilities surveyed. Table 3-8 shows the responses on what
was their method for corrosion control. Eighty percent of the plants listed pH adjustment as their
method for corrosion control; and blending represents sixty percent. Most plants did incorporate
two or more methods for corrosion control in their facility.
Table 3-7: Control of pH and Buffering Content on Post-treatment
Surveyed Utility Comment 1. Consolidated Water Company, Cayman Islands -
2. Town of Jupiter Utilities, Jupiter Florida Addition of NaOH and blending of water of low color and moderate hardness
4. Deep Aquifer Treatment Systems Water is well buffered, membranes don't remove inorganic material, not required
5. Water Treatment Plant Heemskerk Online measurements of pH controlling CO2 and NaOH dosage
6. Kay Bailey Hutchinson Desalination Plant Only addition of poly-orthophosphate
7. City of Pompano Beach WTP Degasification, pH adjustment, some blending and addition of corrosion inhibitor
8. NSA Signonella NaOH adjusting pH to 7.2
9. NSA Naples In line pH meter and conductivity
10. Tampa Bay Water Seawater Desalination Plant Yes, pH/ alkalinity adjustment facility
11. Edward C. Little Water Recycling Plant Lime Addition and decarbonation towers.
12. Plant 2 -
13. City of Fort Myers Addition of CO2 then caustic alkalinity at 30 ppm
14. City of Venice R.O Plant Addition of CO2 and 50% NaOH
15. Charlotte Harbor Water Association Soda ash only
16. City of Sarasota pH control with caustic and blending Verna well water. The Verna water is treated through an ion exchange system and also blended raw.
17. City of Clearwater R.O Plant 1 50% caustic from pH adjustment; 33% blend ratio for stabilization
18. City of Miramar West Membrane Treatment Caustic Soda
19. Richard A. Reynolds Desalination Facility With raw blend and caustic
20. City of Hollywood WTP-RO pH is raised by blending with water from the lime softening plant and caustic soda
21. City of Hollywood WTP-NF pH is raised by blending the water with the lime softening plant and adding caustic soda
22. Charlotte County Utilities: Brunt Store WTP Clear well target range of 8.2 to 8.5 for the pH. Sodium hydroxide metering pump is adjusted accordingly by the operators to maintain that range for pH
23. Advanced Water Purification Facility Use hydrated lime (CaOH) made into a solution via slurry mix system. Also, pH is controlled by controlling amount of bypass around decarbonation process
24. Charles E. Engleman Raise the pH with caustic soda addition
25. FKAA Stock Island R.O Plant NaOH addition
105
Table 3-8: Describe your Method of Corrosion Control
Number Question
Response
Yes No No
Response
10 Describe your method of corrosion control
pH Adjustment 80% 16% 4%
Alkalinity Adjustments 24% 72% 4%
Hardness Adjustments 20% 76% 4%
Corrosion Inhibitor 28% 68% 4%
Blending 60% 36% 4%
Others 4% 92% 4%
Section IV: Post-treatment Water Quality
A portion of the questionnaire was designed to collect water quality information as related to
membrane processes post-treatment applications. Water quality parameters of most interest in the
survey included general water quality parameters, metals, and microbiological parameters. The
membrane facilities were requested to provide water quality information regarding RO permeate,
blend water, and the point-of-entry (POE) to the distribution system. Low, high, and average
parameter values were requested to be provided by each respondee. A majority of the plants
responding reported average values; subsequently, the average values provided by the responding
utilities were those used in data analysis. For those facilities that did not report average values,
available data or that, data reported as the high value were relied upon used for data analysis.
Figure 3-13 presents a plot of the average temperature, pH, and alkalinity. A review of the
collected information shows that the average pH and temperature of the permeate, blended water
and finished water delivered to the point-of-entry (POE) to the distribution system do not change
significantly across unit operations. However, the alkalinity of the blend water is appreciably
different than the permeate and POE data reviewed. This is most likely because the blend water is
106
derived either from the raw water source or from another source that contains appreciable levels of
alkalinity that has not been removed or is low in pH containing predominantly carbonic acid instead
of carbonate alkalinity. Use of blend water to increase the alkalinity of the permeate water prior to
distribution at the POE is typical for corrosion control and stabilization purposes. As a result,
alkalinity is highest for the blend water, which is approximately 142 mg/L as CaCO3. Alkalinity at
the POE averaged at least one milli-equivalent, or 60 mg/L as CaCO3, which is an important
consideration for post-treatment stability. The dataset appears to agree with industry trends that
target a minimum of one milli-equivalent of alkalinity as CaCO3 provides sufficient buffering for the
distribution system.
Figure 3-13: Average Temperature, pH, and Alkalinity for Permeate, Blend, and Point of Entry
0
20
40
60
80
100
120
140
160
Permeate Blend Water Point of Entry
Ave
rage
Te
mp
era
ture
oC
, pH
, an
d
Alk
alin
ity
mg/
L as
CaC
O3
Water Qaulity
Temperature
pH
Alkalinity
107
Figure 3-14 presents a graphical summary of the reported average turbidity and color data
for the permeate, blend, and POE water sample locations. The data indicates that the turbidity,
although low for permeate, is actually lowest as identified at the point of entry, which would not be
unexpected, particularly if other water plants feed the same POE. In addition, the difference in
turbidity between reporting locations is not significantly different when reported as averages, so it is
shown that, as would be expected, permeate produces high quality water with respect to turbidity.
Although color does vary by location, the difference between the POE (3.5 CPU) and permeate (1.1
CPU) are not significant.
Figure 3-15 is a plot of the average conductivity and TDS for the permeate, blend, and POE
sample locations. Note that TDS and conductivity are related; however, care should be taken and
specific correlations should not be used for the data presented because averages are presented across
many different types of water supplies. The permeate TDS is reported as below the secondary
standard of 500 mg/L, one of the goals of most desalination facilities. Conductivity and TDS are
greater than the secondary water quality standard in the blend water supply, which is not
unreasonable since many plants by-pass the native raw water supply to blend with permeate to add
stability economically. The blended water and/or treated water prior to distribution (at the POE)
will meet the secondary standard of 500 mg/L, which is reflected in this data being reported.
108
Figure 3-14: Average Turbidity and Color for Permeate, Blend, and Point of Entry
Figure 3-15: Average Conductivity and TDS for Permeate, Blend, and Point of Entry
0
0.5
1
1.5
2
2.5
3
3.5
4
Permeate Blend Water Point of EntryAve
rage
Tu
rbid
ity,
NTU
. an
d C
olo
r , C
PU
Water Quality Data
Turbidity
Color
0
500
1000
1500
2000
2500
Permeate Blend Water Point of Entry
Ave
rage
Co
nd
uct
ivit
y u
mh
o/c
m,
and
TD
S m
g/L
Water Quality
Conductivity
TDS
109
Table 3-9 provides a list of water quality parameters that were not provided in the returned
questionnaire responses. These parameters (or indices) are not typically collected by water plant
personnel, and the questionnaire confirmed that many of these parameters are only collected for use
in special studies or other non-traditional plant operation protocols. This is not unexpected, but
does allow for future consideration with regards to enhanced operations monitoring and improved
post-treatment water quality data collection activities that could be recommended to operating
personnel of these types of facilities. Enhancements to existing operating methods that would
require the addition of several if not all of the parameters listed in Table 3-9 would result in an
increase in the overall operating costs of the facilities, which must be considered for economic
purposes.
Table 3-9: Water Quality Parameters Not Provided by Respondees to the Questionnaire
Water Quality Parameters
Hydrogen Sulfide
Silica
Bromide
Algae
Heterotropic Plate Count Bacteria
Pseudomonas
Langelier Saturation Index (LSI)
Ryznar Index
Figure 3-16 presents the findings of data collected from utilities responding to the
questionnaire that shared information on the permeate water quality. Sodium, calcium, magnesium,
sulfate, and chloride information was collected from the facilities that responded to the survey
questionnaire. Figure 3-16 illustrates that the permeate quality was predominantly comprised of
sodium and chloride for the plants surveyed, and depleted in calcium and magnesium. This would be
110
expected since the majority of the facilities that responded to the questionnaire utilized reverse
osmosis (Figure 3-1) that treated predominantly some form of brackish or seawater supply
(Figure 3-2).
Figure 3-16: RO Permeate Water Quality
In a reverse osmosis process the divalent constituents‟ calcium, magnesium, and sulfate
would be completely rejected by the membrane, resulting in permeate where sodium and chloride
would be present in quantities controlled by diffusion through the membrane. However, as
presented in Figure 3-17, facilities reporting blend water constituents indicated that calcium,
magnesium and strontium were present, in addition to chloride. Chloride appeared to be the
controlling ion with regards to the greatest amount present and upon which total dissolved solids
content would be based.
Figure 3-18 presents information with respect to several water quality parameters identified
at the POE. Sodium, sulfate, and chloride are found to be present in higher concentrations at the
POE than other constituents such as potassium, barium, calcium, iron, manganese, phosphate,
aluminum, fluoride, and selenium. There is a portion of the respondents reporting magnesium, due
0
10
20
30
40
50
60
Sodium Calcium Magnesium Sulfate Chloride
RO
Pe
rme
ate
Wat
er
Qu
alit
y in
mg/
L
Parameters
111
to the blending impacts of by-pass water. A small amount of aluminum is present, representing
corrosion by-products of valves, pumps, and appurtenances and not necessarily the by-pass or blend
water supplies.
Figure 3-17: Blend Water Quality
Figure 3-18: Point of Entry (POE) Water Quality
0
50
100
150
200
250
300
350
Ble
nd
Wat
er
Qu
alit
y in
mg/
L
Parameters
0102030405060708090
PO
E W
ate
r Q
ual
ity
in m
g/L
Parameters
112
Section V: Post-treatment Operations
Several of the responding utilities provided data pertaining to post-treatment operations.
Information requested included the average and maximum daily permeate production, in addition to
data regarding daily permeate and blend water flow rates. In addition, information regarding post-
treatment chemicals and average dosage rates was requested. Blending ratio (as a percentage) and its
control also was one component of the post-treatment operations survey. Figure 3-19 shows the
frequency distributions of the daily permeate production at facilities reporting flow rates. Plants that
did not report data were not evaluated as part of the data set.. Permeate production rates ranged
from 0.12 MGD to 70 MGD across the respondents. Blend water flow rates are schematically
represented as the frequency chart shown in Figure 3-20. Many of the facilities reporting indicated
that a significant amount of flow is blended across the facilities. Of the plants that were surveyed,
the highest average flow of the blend water flow was approximately ten million gallons per day.
Figure 3-19: Frequency Distribution of the Average Daily NF/RO Permeate Production
Sometimes these results are given back to the participants in order to stimulate further
discussion, and perhaps a readjustment in the overall rankings assigned to the various responses.
This is done only when group consensus regarding the prioritization of issues is important to the
126
overall research or planning project. As its name suggests, the nominal group technique is only
"nominally" a group, since the rankings are provided on an individual basis. NGT is based on three
fundamental, research-based principles:
1. „Nominal‟ groups are thought to generate higher quality ideas than interacting groups
typical of classic brainstorming. A nominal group consists of several people (usually
gathered in one room) who are prepared to work as a team to resolve a problem.
This sharing of ideas (which can be anonymously submitted) promotes a sense of
involvement and motivation within the group.
2. The „round robin‟ element provides encouragement and equal opportunities for all
members to contribute. Contribution from all participants is encouraged and every
individual‟s idea is given equal standing, whether unique or not.
3. Reliable communication requires that the recipient‟s understanding of a message be
checked with the sender, especially in the case of „new ideas‟ being put forward.
Checks for accurate communication are built in to the technique.
Various forms of the procedure can be undertaken, however, the classical form suggested by
Delbecq et al. (1975) uses the following steps:
1. Anonymous generation of ideas in writing begins with the facilitator stating the
problem and giving the participants up to 10 minutes to jot down any initial ideas
privately. The facilitator also writes down his own ideas.
2. Round-robin recording of ideas allows each person in turn to read out one idea,
which the facilitator writes up on a flip chart for all to view and numbered
sequentially. This is repeated going around the groups until all ideas are exhausted
and any duplicates are eliminated.
127
3. Serial discussion to clarify ideas and check communication is encouraged by the
facilitator. Working through each idea systematically asking for questions or
comments with a view to developing a shared understanding of an idea. Discussions
are calm and controlled to aid clarification of the idea, they are not heated debates.
4. Preliminary anonymous vote on item importance is usually carried out in the method
described under anonymous voting.
5. Further discussion and voting, takes place if the voting is not consistent. Steps three
to four can be repeated and any ideas that received votes will be re-discussed for
clarification.
As with any technique, there are advantages and disadvantages. NGT is no exception. Some
of the obvious advantages are that voting is anonymous, there are opportunities for equal
participation of group members, and distractions (communication "noise") inherent in other group
methods are minimized. As to disadvantages, opinions may not converge in the voting process and
the process may appear to be too mechanical.
Location and Purpose
The workshop was held at UCF‟s Fairwinds Alumni Center in Orlando, Florida beginning May 21
and ending May 23, 2008. The purpose of the workshop was to identify practical experiences with
post-treatment stabilization (i.e. lessons learned) and identify solutions for utilities experiencing
problems with post-treatment.
128
Participants
Attendees of the first workshop included the following persons:
1. John Countz Consolidated Water Company, LTD, Cayman Islands
2. Ian Watson RosTek Associates, Inc., Tampa, FL
3. Cesar Lopez, Jr. San Diego County Water Authority, San Diego, CA
4. Albert Ilges AwwaRF, Denver, CO
5. Donald Baylor City of Pompano Beach, Pompano Beach, FL
6. Christine Owen Tampa Bay Water, Tampa, FL
7. Gilbert Galjaard PWN Water Supply Co. North Holland, Netherlands
8. Paul Jurczak Town of Jupiter Utilities, Jupiter, FL
9. Steven Duranceau UCF Civil & Environmental Engineering, Orlando, FL
10. Ferne Rico El Paso Public Water Utilities Services, El Paso, TX
11. James Harris Naval Facilities Engineering Command, Norfolk, VA
12. Carl Spangenberg Irvine Ranch Water District, Irvine, CA
13. Sun Liang MWD of Southern California, Los Angeles, CA
14. Robert Cheng Long Beach Water Department, Long Beach, CA
129
Results and Discussion
The workshop efforts resulted in the identification of fourteen priority issues associated with
the post-treatment of desalinated permeate. Table 4.2 presents the fourteen identified items with
their respective topics and are listed in order of importance, based on NGT ranking procedures.
Table 4-2: Outline of Priority Issues Generated from Workshop
Priority No 1-“Stabilization” Tools for identifying and defining good water quality (consistent water quality) to assure effective water quality results in the distribution system
Priority No 2- Permeate Conditioning / Corrosion Control
Priority No 3- Challenges of disinfection by-product formation – Post-treatment
Priority No 4- Blending Sources to meet Target Water Quality Goals
Priority No 5-Impacts of Blending Permeate into Existing Distribution System
Priority No 6- Secondary Water Quality Impacts to Potable, Wastewater, and Recycled Water
Priority No 7- Informing (rather than educating) consumers, regulators, and political entities of issues related to desalinated water and its post-treatment
Priority No 8- Source Water Characterization as Related to Finished Water Quality
Priority No 9- Permeate Conditioning / Quality & Aesthetics
Priority No 10- Stabilizing a disinfectant residual
Priority No 11- Blending for Finish Water Quality
Priority No 12- Importance of Pilot Studies specifically focused on desalting pre- and post-treatment.
Priority No 13- Recognition of Water Quality Aesthetics Changes as Related to Varying Water Supplies
Priority No 14-Decisions on pretreatment can affect post-treatment decisions/needs.
130
1. The highest ranked priority was related to how utilities should approach post-treatment
stabilization with regards to help and available information. The main idea behind priority one is that
stabilization of permeate water is a mandatory component of post-treatment for desalination
facilities. Consistency of finished water is an important consideration and the utility must be able to
define their “consistent” water, because it may hold different results for different utilities and or
locations. Utilities should explore and define consistency goals by evaluating how much variation
their systems can withstand without experiencing problems in the distribution system, since there is
a range of variability that a distribution system can tolerate when integrating desalinated water into
an existing water distribution system. Indicators such as the Langelier Saturation Index (LSI),
Ryznar, calcium carbonate precipitation potential (CCPP), aggressiveness index (AI), and dissolved
inorganic carbon (DIC) are helpful in predicting the behavior of water within a distribution system.
It was recognized by the workshop participants that it is important that facilities implement studies
and use available “tools” to understand post-treatment challenges in an effort to develop internal
management procedures and technical actions; subsequently, by doing so one could provide
consistent and stabilized water quality for the distribution system. Suggested tools include pilot
studies, distribution water quality modeling, monitoring, coupon studies, linear polarization, and
online water quality instruments within the distribution system.
2. The second highest-ranked priority dealt with permeate conditioning and corrosion
control. This topic is interrelated to the highest priority topic identified in the workshop.
Nanofiltration and reverse osmosis permeate are considered corrosive to many types of
materials of construction. The permeate produced by synthetic membrane processes can be
“aggressive” water that if not stabilized may cause internal damage to many of the components that
make up the water distribution system. The utility is required to understand the interrelated issues
131
between treatment and the distribution system with respect to regulatory compliance, distribution
integrity and reliability, and the premise plumbing impacts specifically related to lead and copper
release at consumer taps.
3. The third highest priority pertains to the challenges of disinfection by products (DBP)
formation during and following post-treatment operations. Considerations must be made with
regard to the type of disinfection(s) used and their potential for DBP formation, whether it be
chlorinated, chloraminated, brominated, or iodated species. With regards to pretreatment, the use of
pH buffers must be taken into account when it comes to their impact on post-treatment. DBP
precursors in bypass water must be considered as a contributor to the total DBP concentration in
the distribution system, while providing for inactivation of pathogens. Seasonal changes as well as
mixing different water sources in the distribution systems should be known. Utilities must be able to
meet regulatory standards for disinfection residuals in the distribution system, MCL‟s of DBP, and
lead and copper levels. Potential health risk and issues with blending are imperative to know. For
example bromide in permeate is higher than in blend waters and TOC may be higher in blend waters
which can affect DBP formation.
4. To meet a target potable water quality goal it may be necessary to blend different water
sources and is the topic of priority number four. Water utilities will find themselves unable to meet
the future demands with a single source. To meet demands, water purveyors will need to diversify
their water resources. These new resources will likely vary in finished water quality. The quantity,
quality, and economics of source water will influence the appropriate blend ratios for different
waters in different seasons.
5. Priority number five relates to the impacts of blending permeate water into an existing
distribution system. Blending of newly desalted water supplies in a system having an older
132
infrastructure which, historically has been exposed to different supplies of significantly differing
quality can cause problems with water quality within the distribution system. Those problems of
concern included discolored water, constituents remaining in water such as H2S, taste, odor, and
corrosion.
6. Secondary water quality impacts to potable, wastewater, and recycled systems were
identified as priority six. Issues are many, and some were identified. Since regulatory requirements
for potable, wastewater, and recycled water differ, utilities are motivated to understand permit
limitations that may be imposed by various regulatory agencies. These limitations may impact the
use of desalinated supplies if post-treatment does not address conflicting goals that these other
permits may represent. For example, conservative ions will increase through each water cycle which
will limit reuse and irrigation use. Post-treatment with sodium hydroxide will add sodium to the
water supply but a change to the use of potassium hydroxide would reduce the amount of sodium
loading into the environment (i.e. changes in sodium adsorption ratio). Another example is the
secondary impact of bromide (other unknown conservative ions such as iodide) entering a blended
water supply impacting historical DBP speciation and concentrations (reference priority three).
7. Priority seven topic is “Informing, rather than educating consumers, regulators and political entities of
issues related to desalinated water and its post-treatment.” Although in the NGT process this item was not
ranked as a high priority with regards to post-treatment, priority number seven was seen by the
participants to be a significant factor if problems with water quality were to occur. Informing
consumers, regulators, and political entities of issues relating to desalinated water and its post-
treatment is advised. It is also noted that a utilities understanding of its water treatment process, its
cost, and benefits is necessary. Post-treatment is necessary to create a desirable water quality for
consumers, to meet regulatory requirements, and protect the distribution system and consumer
133
infrastructure. Again understanding water quality and impacts of blending different source waters is
imperative.
8. Source water characterization as related to the finished water quality was ranked as the
eighth priority. Finished water quality can be affected by the source water quality fluctuations,
negative impacts may occur that will affect water recycling and irrigation. Boron accumulation
through the water cycle was given as an example because its accumulation may negatively impact
water recycling and irrigation practices.
9. Priority nine is listed as permeate conditioning, quality, and aesthetics of water quality. NF
and RO permeates can contain dissolved gases that may impact the taste and odor acceptability of
the water. This is critical for water purveyors in maintaining customer satisfaction and consumer
confidence within their drinking water community, within which the utility operates.
10. The tenth-ranked priority considers issues related to stabilizing a disinfectant residual in
the distributed water supply. Consideration as to the choice of disinfectants used, types of blending,
and regulatory compliance challenges in answering the question “how to obtain a stable disinfectant
residual in the distribution system?”
11. Priority eleven items were related to blending for finished water quality. Currently
blending is a term used to explain a specific unit operation. However, there are several classifications
of blending related to the post-treatment of blended streams containing NF / RO permeates. It is
important evaluate these by the following general classifications:
1. Blending permeate with other sources in a common blending scheme
2. Bypass blending a component of the raw water into the permeate stream
3. Blending within distribution system at multiple locations having multiple plants
4. Conditioning permeate for transport to remote blending or end use locations
134
5. Treatment of blending bypass or blending mixtures of multiple source waters
Again, this is important because when adding NF/RO permeate sources into a distribution system
destabilizing conditions may occur. To mitigate against possible negative effects proper blending is
paramount.
12. Priority twelve notes the importance of pilot studies focused on pre and post-treatment.
It may be necessary to continue using pilot plants studies once a facility goes online because it will
allow for continued optimization of the process.
13. Recognizing of water quality aesthetics relating to varying supplies is priority thirteen.
Water quality changes will occur when water supply changes, which may generate customer
complaints. Utility‟s knowledge of water qualities can deflect negative responses from consumers.
14. Finally, how pretreatment can affect post-treatment decisions and needs is the topic of
priority fourteen. Seawater is vastly different across the globe, so basically what works for one utility
does not necessarily work for another utility. For example, in the Cayman Islands the deep seawater
from Cayman Trench is rich in hydrogen sulfide yet low in dissolved oxygen. Whereas, in the
Bahamas, the raw water contains higher levels of dissolved oxygen in water, the water is warmer and
contains 2 to 4 mg/L of hydrogen sulfide. These conditions require careful consideration of
compatible construction materials. Similar care should be incorporated into selection of post-
treatment materials.
135
Guideline for Priority Issues
Upon determination of the fourteen priority issues recommendations were solicited on how
to best handle these issues. The recommended actions that can serve as a guide to desalination
facilities in handling the priority issues are listed below:
1. Utilities should consider carrying out pilot studies, distribution system water quality
modeling, monitoring, coupon studies, linear polarization, and online water quality instrumentations
within the distribution system in order to be able to determine if the desalinated water is to be
stabilized and how much stabilization is needed prior to introduction into existing or new
distribution systems. Through these studies, the utilities will be able to predict a range of operating
conditions for the system, which the distribution network can tolerate, while at the same time
ensuring that the quality of water supplied is not compromised.
2. For corrosion control, identification of permeate characteristics is necessary. At the very
minimum the pH, temperature, alkalinity, ionic strength, hardness, TOC, sulfates, and chlorides of
permeate should be monitored. With these data the susceptibility of the distribution system and the
internal plumbing of customer premises can be assessed, and the necessary stabilization program can
be instituted to mitigate the problems anticipated.
3. When the choice of disinfection has been made, it is recommended that studies be carried
out on the formation of disinfection by products. Alternatively, depending on the water source that
is being desalinated, the choice on disinfection can be made after conducting studies and assessing if
any disinfection by products may potentially be formed.
4. Looking at the target water quality goals, utilities can assess the various sources of water
that is available and determine the type of treatment necessary. Blending of different water sources
in order to meet the target water quality is a key consideration. The choice of treatment for the
136
different sources of waters will need to be evaluated together with the blending ratios. Using mass
balance, various source combinations can be evaluated to meet desired finished water quality, in
order to optimize the supply, in terms of cost of production and water quality. An example of this is
that utilities can blend different supplies for taste and odor control or blend permeate with bypass
water at various stages of the process, for control of TDS and chloride.
5. Impacts of permeate in the distribution systems can be resolved by:
Setting permeate water quality goals;
Identifying the water quality issues associated with specific source waters and the
corresponding permeate water quality;
Considering and resolving mixing and stability issues before introducing any new
sources;
Considering all treatment options to ensure that all drinking water regulations are
met; and
Developing blending options
6. To resolve the potential issues with secondary water quality impacts i.e. those impact on
wastewater and recycled water, it is recommended that utilities understand the comprehensive
permit limitations as imposed by regulatory agencies on water, wastewater and water reuse. Knowing
the regulatory limits, and the water quality of the available water sources, water quality goals will
need to be set that will ensure that all water use, wastewater collection and treatment, and reuse fall
within these regulatory limits. The water quality goals will thereafter determine the choice of
treatment, blending ratios with multiple sources, quality stabilization and disinfection methods.
7. Customer acceptance is important to the utility and programs need to be introduced to
inform stakeholders of the different aspects of desalination and the post-treatment options.
137
Stakeholders must be informed of the reasons for adopting particular treatment; disinfection and
stabilization systems and the benefits that they derive as a result of the utilities taking these measures
must also be mentioned.
8. Characterizing source water and its variability in terms of quality and quantity during
different seasons is important. Utilities will need to factor this, in considering the treatment,
disinfection, and post-treatment stabilization options as part of meeting the water quality goals that
it is required to meet.
9) Utilities need to understand the quality of water that it produces and take the necessary
measures to condition the water to meet the expectations of customers in terms of quality and
aesthetics. It is recommended that odor control and taste acceptability tests be conducted, as these
are critical customer acceptance indices.
10. To ensure public health, studies need to be carried out on the choice of post-treatment
disinfection process and its stability.
11. When blending water from various sources, with and without treatment, are considered,
analysis of blend streams and water quality goals are recommended. Such analysis should also
include seasonal fluctuations of various sources, varying operating conditions in the treatment
plants, seasonal treated water demand patterns, and any hydraulic limitations within the treatment
plant and in the distribution systems.
12. Pilot scale studies are recommended to establish pre and post-treatment systems. It is
recommended that considerations be given towards the continued operation of pilot scale studies,
even after the commissioning of the treatment facilities. Where large-scale desalination facilities are
proposed, demonstration scale studies are recommended, over and above the pilot scale studies. In
carrying out the studies, utilities should include the storage and distribution systems including any
138
new networks if they are proposed, and simulation of the overall production and supply system
ought to be also considered.
13. In order to maintain the aesthetics of water that it supplies, the utility should:
Understand water quality differences from different finished water sources.
Understand consumers‟ water quality expectations.
Evaluate resultant water quality from potential blend changes – and understand how such
changes in blending will affect the aesthetics of water. Flavor, taste, and odor tests are
recommended, as these are the primary aesthetic parameters of concern to customers. Such
evaluation can serve as a predictor of water quality when changes in blending are necessary
for various operational reasons.
Institute an action plan for instances when there need to be changes to the water supply.
Such action plans should include effective public communication and outreach strategies.
14. As decisions on pretreatment can affect post-treatment options, pilot studies should focus on
optimizing the whole plant to meet the pre-determined treated water quality goals, enabling effective
post-treatment.
139
CHAPTER FIVE: EVALUATION OF TOTAL IODIDE IN SEAWATER PERMEATE STREAMS
Introduction
One output of the expert workshop related to disinfection by-products (DBPs), which are
formed in the chlorination process. In recent years, an effort has been made to minimize DBPs in
finished drinking water. Much of the progress made on this front has been through the
identification, treatment, and removal of DBP precursor material. DBPs are commonly formed from
the chlorination of drinking water with disinfecting agents such as chlorine, chloramines, ozone, and
chlorine dioxide. Regulation controls the prevalence and toxicity of disinfection by-products formed
during chlorination. Furthermore, chlorination of a water containing iodides can produce iodinated
trihalomethanes and haloacetic acids. However, there is a lack of extensive studies addressing the
carcinogenicity of iodated-THMs (Richardson, 2007), but the aesthetic impacts of I-THM's have
been documented.
It has been long know that bromides and iodides can be a source of DBPs and are
particularly more problematic because they often are more carcinogenic and mutagenic that their
chlorinated analogs (Agus et. al 2009). Iodide concentrations have been of little concern in the U.S.
because common source waters typically have little to no iodide present. However, with the growing
demand for water there has been a shift towards brackish and seawater desalination. These source
waters, especially seawater, can possess natural total iodide concentrations that could have an impact
on disinfection.
140
During the disinfection process iodide is rapidly oxidized by chlorine to form hypochlorous
acid (HOI).The hypochlorous acid is either further reduced to nontoxic iodate or reacts with the
organic matter to produce I-THMs (Bichsel and Von Gunten, 1999). The purpose of this evaluation
has been to develop a reliable and repeatable method with which to measure and interpret total
iodide concentrations in finished drinking water of this origin.
Approach
Iodide in natural waters have been found to range from less than 1 μg/L in freshwaters to as
high as 60 μg/L in some costal surface seawaters (Agus et al. 2009). This range is one of the primary
factors in determination of an appropriate method for total iodide concentrations. As these
concentrations are attributed to natural untreated water it was hypothesized that once treated by
reverse osmosis or nanofiltration it was likely for the iodide concentrations to be in the range of 5-
10 μg/L. In order to obtain reading for this relatively low concentration a sensitive method was
required. Two methods were deemed appropriate, the “catalytic reduction method” and the
“voltammetric method.” These methods are applicable when evaluating samples with iodide
concentrations of 80 μg/L or less and 0.13 to 10.2 μg/L, respectively. Ultimately, the catalytic
reduction method was selected because of its relative simplicity and repeatability.
The catalytic reduction method is based on the reduction of ceric sulfate by arsenious acid in
a sulfuric acid solution. When iodides are present in solution they act as a catalyst for this reduction
reaction. As iodide concentrations increase, ceric sulfate reduction also increases. The ceric sulfate
solution produced in this method has a distinct yellow color, and as the ceric ions are reduced the
yellow colors steadily dissipates. Theoretically, under conditions of constant temperature and reagent
concentration the time until disappearance of this yellow color could be used to determine total
141
iodide concentration. However, a more convenient method has been developed in which the
reduction reaction time is held constant and the non-reduced ceric ion concentration are measured.
It would be impractical, using this approach, to measure this ion concentration while the reaction is
still taking place. To remedy this issue the addition of ferrous ions was implemented in order to
arrest the reaction and allow for more consistent and accurate readings.
Ferrous ions arrest the reaction by immediately reducing the remaining ceric ions. The
resulting ferric ion concentration is equal to that of the remaining ceric ion concentration present
before the reduction reaction is arrested Addition of a thiocyanide solution then produces a red
color of proportional color intensity. The darkness or the red color in this method is inversely
proportional to the iodide concentration. (Rogina et.al. 1953). This color intensity can then be
measured with respect to a set of standards by means of a color photometer or spectrometer. In
order for this method to be accurate and repeatable, several precautions were taken in order to keep
the kinetics constant sans changes in the catalyst (total iodide) concentration. They include, 1)
control of the temperature variable by use of a water bath set at plus/minus 30°C, 2) stringent
control of the time variable from the point of reduction reaction initiation until the addition
arresting agent, and 3) uniformity and accuracy of reagent concentration/addition to laboratory
samples. These variables along with the accuracy of the synthesized iodide standards were found to
have the most profound effect on overall accuracy and repeatability.
142
Experimental Design
Iodide concentrations were measured using the method dictated by the 20th edition of the
Standard Methods for examination of Water and Wastewater. The experiment was modified to meet
the need for accuracy and precision. Reagents were prepared on a monthly basis (except Ferrous
ammonium sulfate, which was prepared daily) per the catalytic method 4500 I- C of the Standard
Methods. High-performance liquid chromatography (HPLC) reagent-grade water was used for
sample and standard dilutions after problems encountered with distilled water during initial
experimentation was identified. A sodium chloride (NaCl) reagent solution was prepared by
dissolving 200 grams of NaCl in 1 liter of HPLC reagent-grade water. Formation of non-catalytic
forms of iodide such as silver and mercury can have inhibitory effects on iodide readings, so NaCl is
used to reduce such effects. Arsenious acid, which is used for the reduction of ceric sulfate in
sulfuric acid, was prepared by heating to dissolve 4.946 g of As2O3 and 0.20 mL H2SO4 in 1 liter of
HPLC water. Standard 36N sulfuric acid was used for all acid additions. Ceric ammonium was made
by dissolving 13.38 grams of Ce(NH4)(SO4)4•4H20 with 44 mL of H2SO4 in 1 liter of HPLC water.
Ferrous ammonium sulfate reagent was prepared by dissolving 1.50 grams of Fe(NH4)2(SO4)2 •6
H2O in 100 mL of HPLC water with an addition of 0.6 mL of H2SO4 and potassium thiocyanate
solution was prepared by dissolved 4.0 grams of KSCN in 100 mL of HPLC water.
For standard iodide solution initial preparations, using the standard method outline did not
produce feasible results. In turn, standard iodide solutions were produced using an anion standard
iodide with a concentration of 1000 mg/L NaI. Initially a 5000 μg/L standard stock solution was
prepared by diluting 0.5 mL of the 1000 mg/L NaI anion iodide standard to 100 mL using HPLC
water. Table 5.1 list the standards prepared for the experiment and the volume of the 5000 μg/L
143
iodide stock solution used in preparation of those standards. The 100 ug/L iodide standard solution
was used for preparation of the 0.5, 1.0, 2.5, and 8.0 μg/L standard solutions.
Table 5-1: Standard Solutions Concentrations
Standard Solution Volume of 5000 μg/L I stock standard used for preparation
0 μg/L I- 10 mL HPLC reagent-grade water
0.05 μg/L I- 0.05 mL of 100 μg/L I- diluted to 100 mL
1.0 μg/L I- 1.0 mL of 100 μg/L I- diluted to 100 mL
2.5 μg/L I- 2.5 mL of 100 μg/L I- diluted to 100 mL
5.0 μg/L I- 5.0 mL of 100 μg/L I- diluted to 100 mL
8.0 μg/L I- 8.0 mL of 100 μg/L I- diluted to 100 mL
10 μg/L I- 0.2 mL of 5000 μg/L I- diluted to 100 mL
20 μg/L I- 0.4 mL of 5000 μg/L I- diluted to 100 mL
40 μg/L I- 0.8 mL of 5000 μg/L I- diluted to 100 mL
80 μg/L I- 1.6 mL of 5000 μg/L I- diluted to 100 mL
100 μg/L I- 2.0 mL of 5000 μg/L I- diluted to 100 mL
Water samples with unknown iodide concentrations were collected from Tampa Bay's
reverse osmosis desalination facility utilizing seawater as its source. Tampa Bay‟s samples included
raw, combined permeate, and concentrated water. Long Beach nanofiltration source water was inlet
seawater. Long Beach sample water included filtrate and 2nd pass permeate from a north and south
train used at the facility. Table 5.2 shows the temperature, pH, and conductivity at the time of
collection.
Table 5-2: Water Quality Parameters for samples
Sample Temperature,
oC pH Conductivity
Tampa Bay Water Permeate 30 6.5 497
Long Beach
Filtrate 18.3 7.83 50.91
2nd Pass North 19 10.1 34.5
2nd Pass South 19 10.5 21.6
144
For the experiment, approximately 10 mL of each sample, at room temperature, was
pipetted into test tubes. Tampa Bay‟s raw and concentrated water were diluted by using 20 mL of
the sample and diluting to 100 mL with HPLC reagent-grade water corresponding to a 1:4 ratio.
One duplicate and a 10 μg/L spike were analyzed for quality control and assurance. For the standard
solutions 10 mL of each were used to for analysis.
Two people in assembly style performed the experiment. First, 1.00 mL of NaCl, 0.50 mL of
arsenious acid, and 0.50 mL of concentrated sulfuric acid, were added to each 10 mL standard
solutions and water samples in the respective order. Test tubes-with samples were capped and
placed in a water bath at 30.0 degrees Celsius. A test tube containing ceric ammonium sulfate was
also placed in the water bath. Samples were allowed to reach temperature equilibrium (approximately
20 to 30 minutes). After 20 minutes with samples remaining in the water bath, caps were removed
and 1 mL of ceric ammonium sulfate solution (mix by inverting) was added to each sample in 1-
minute intervals. Color upon addition was yellow. Precisely 20 minutes after the introduction of
ceric ammonium sulfate to the first sample, the reaction is stopped by the addition of 1.0 mL of
ferrous ammonium sulfate. Following a recognizable pattern in 1 minute intervals addition of
ferrous ammonia sulfate was added to all the samples, while promptly removing the test tube from
bath. Mixing was done by a vortexor. The solutions in the test tube were clear in color. Next 1.00 ml
of potassium thiocyanate solution was added to each sample. The KSCN produces a red color that
has intensity inversely proportional to iodide concentration.
Samples were allowed to reach ambient room temperate, which took approximately 45
minutes. A spectrophotometer set at 525 nm was used to measure absorbance of the samples using
10 mm cuvette. The spectrometer was calibrated (zeroed) with the blank standard. A standard
calibration curve was developed from the standard samples shown in Table 6.1. For each standard
145
curve developed, there were 7 data points ranging from 0 μg/L to 10 μg/L I-. Three data points
were used for concentrations ranging from 20 μg/L I- to 80 μg/L I-. Using the equation developed
by non-linear regression using Sigma-plot 11, which followed a 3 parameter exponential decay
equation, the concentrations for each sample containing unknown amount of iodide is determined.
Figure 5-1 shows the standard calibration curves used for the determination of iodide concentrations
in the water samples. It was observed during the development of the standard curves that as the
absorbance decreases the concentration of the samples increases, denoting an inverse relationship
between the absorbance and concentration. The standard curve data fit equations are presented with
the respective R2 values shown in Table 5-3.
Table 5-3: Standard Curve Equations
Run # Data Fit Equation R2
1 y=1.2723+1.2212 *exp(-0.1077x) 0.9971
2 y=1.3369+1.2660 *exp(-0.1122x) 0.9949
3 y=1.4618+1.3147 *exp(-0.1298x) 0.9818
4 y=1.4964+1.4997 *exp(-0.1206x) 0.9993
5 y=1.3201+1.3648 *exp(-0.1012x) 0.995
6 y=1.345+1.3105 *exp(-0.1142x) 0.9906
7 y=1.3664+1.3119 *exp(-0.1348x) 0.9774
8 y=1.4264+1.4516 *exp(-0.1142x) 0.9990
9 y=1.3534+1.3618 *exp(-0.1152x) 0.9992
10 y=1.4279+1.3965 *exp(-0.1187x) 0.9982
11 y=1.5859+1.5137 *exp(-0.1228x) 0.9966
146
Figure 5-1: Iodide Calibration Curves
-1.8
-1.6
-1.4
-1.2
-1
-0.8
-0.6
-0.4
-0.2
0
0.2
0 10 20 30 40 50 60 70 80 90
Ab
sorb
ance
Iodide Concentration, μg/L I-
Run 1
Run 2
Run 3
Run 4
Run 5
Run 6
Run 7
Run 8
Run 9
Run 10
Run 11
Run 1
Run 2Run 3
Run 4Run 5
Run 6Run 7
Run 8Run 9 Run 10 Run 11
147
Results and Discussion
Table 5.3 below shows concentration values found for Tampa and Long Beach waters.
Concentration of iodide in Tampa Bay‟s RO process raw feed water was found to on average 36.06
μg/L I-, which is in the typically range found for seawater process. Permeate iodide concentration
were found to be an average of 10.30 μg/L I- Concentrate values were on average 70.12 μg/L I-
Iodide concentrations were below the detection limit of 8 μg/L I-. The average iodide
concentrations were plotted and shown in Figure 5.2 and error bars shows the maximum and
minimum observations.
Table 5-4: Iodide Concentrations for Tampa Bay RO Water
Samples Concentration, μg/L I-
Tampa Bay Raw Water 41.31
42.31
31.25
32.23 33.20 Mean 36.06 Std 5.31 Std Error 2.37
Tampa Bay Permeate 6.38
9.57
9.74
15.5 Mean 10.3 Std 3.8 Std Error 1.9
Tampa Bay Concentrate 69.25
70.59
53.19
69.70
87.87 Mean 70.12 Std 12.28 Std Error 5.49
i
148
Figure 5-2: Tampa Bay Mean Iodide Concentrations with Max and Min Observations
Shown on Table 6.4 filtrate water for the Long Beach NF process was found to have an
average iodide concentration of 43.73 μg/L I-. The Long Beach facility had two permeate streams
that produce different results for iodide concentrations. The Long Beach NF 2nd pass north iodide
concentrations on average 0.24 μg/L I-, well below our hypothesized detection limits. The 2nd pass
iodide concentration was average to be 11.41 μg/L I-. The average iodide concentrations were
plotted and shown in Figure 6.3 and error bars show the maximum and minimum observations.
0
10
20
30
40
50
60
70
80
90
Co
nce
ntr
atio
n Io
did
e a
s u
g/L
I-
Tampa Bay Raw Tampa Bay Permeate Tampa Bay Concentrate
149
Table 5-5: Iodide Concentrations for Long Beach NF Water
Samples Concentration, μg/L I-
Long Beach Filtrate 45.33 42.78 49.27 41.52 42.47
41.04 Mean 43.73 Std 3.10 Std Error 1.27
Long Beach 2nd Pass North 0.11 0.14 0.21 0.41 0.35
Mean 0.24 Std 0.13 Std Error 0.06
Long Beach 2nd Pass South 8.25 8.76 8.71 15.06 16.25
Mean 11.41 Std 3.91 Std Error 1.75
150
Figure 5-3: Long Beach Mean Iodide Concentrations with Max and Min Observation
Quality Assurance and Quality Control
For quality assurance and quality control a minimum of one duplicate and spike samples
were performed for every ten samples were performed. Duplicates were analyzed to determine any
variance with samples and to check the reproducibility of the method. Spikes of 10 μg/L I using the
100 μg/L I standard were performed to determine the percent recovery (ratio of product feed to
water produce) of the method. Table 5-6 shows the 95% confidence interval, percent recovery,
relative percent difference (RPD), upper control limit (UCL), and upper warning limit (UWL) for
the samples. Percent recovery for the Tampa Bay samples was found to be 95.70 %, compared to
the Long Beach sample which was 74.90 %. The typical range required percent recovery on is 70%
to 120%. The Tampa Bay samples are in the median range for permeate production, compared to
Long Beach samples where were found to be at the lower end of the recovered percentage. The
reproducibility (RPD) of Tampa Bay‟s; raw water was determined to by 2.39% while concentrated
had a RPD of 1.92%. Long Beach RPD was determined to be 2.28%. Typically it is best to have
0.00
5.00
10.00
15.00
20.00
25.00
30.00
35.00
40.00
45.00
50.00
Co
nce
ntr
atio
n Io
did
e a
s u
g/L
I-
LB Filtrate LB North 2nd Pass LB South 2nd Pass
151
RPD with the range of 1% to 10%, where been at the lower end of that range is optimum. The RPD
values for the samples indicate the method used for determining iodide concentrations is accurate.
Table 5-6: Quality Assurance and Control Parameters
Sample Confidence
Interval Percent Recovery % RPD
% UCL UWL
Tampa Bay Water Raw ±4.65 ─ 2.39 51.99 46.68
Permeate ± 3.72 95.7 ─ 21.7 17.9
Concentrate ± 10.76 ─ 1.92 106.96 94.68
Long Beach Water Filtrate ± 2.48 ─ 2.28 53.03 49.93
From the results of the analysis it is shown that by using the catalytic reduction method
concentrations of iodide were detected in feed, permeate, and concentrated water. Seawater being
treated by a desalination process results in a significant reduction in iodide concentrations to levels
near or below analytical detection limits; consequently, trace amounts of iodide would be expected
to not significantly impact the formation of iodinated disinfection by-products.
152
CHAPTER SIX: CONCLUSION AND RECOMMENDATIONS
Summary
With a growing number of potable water purveyors turning to desalination processes as a
means for augmenting existing drinking water supplies, it is important to understand the behavior of
desalted permeate within the distribution system and possible issues that may arise if proper post-
treatment of permeate is not practiced. Desalination water is considered corrosive due to its
inherently low mineral content and is not suitable for consumption without post-treatment. A
review of relevant literature indicates that post-treatment is required for desalted permeate, and
would include consideration of possible impacts from blending, remineralization, disinfection,
storage and distribution.
Based on the information obtained from the literature review, a utility questionnaire was
developed and distributed to utilities known to rely on desalination processes and located in the
U.S., Caribbean, and Europe to gather information on post-treatment. Water quality data was
obtained from each facility, in addition to delineation of post-treatment practices and identification
of impacts experienced to the distribution system. Questions were also asked regarding plant
descriptions, operation costs, and a summary of post-treatment actual experiences.
A workshop was conducted that brought together experts in the field of desalination where
they could describe their experiences with post-treatment stabilization, share lessons they have
learned, and offer guidance to utilities experiencing problems with post-treatment. The experts
identified fourteen priority guidance recommendations to deal with the many issues associated with
post-treatment, as were presented in Table 4.2. found in chapter 4.
153
One of the issues identified in the workshop was related to disinfection of permeate and
resultant disinfection-by-products (DBPs). As illustrated in the literature review, bromide is known
to permeate the membrane and will serve as a brominated-DBP precursor when the permeate is
blended with a native water supply conventionally treated. Recently it has been shown that
iodinated DBPs can be present in treated water supplies where iodide levels are naturally occurring.
Although the amount of iodide permeating a membrane is not fully known, it is known that
iodinated DBPs can form in a manner analogous to bromide in drinking water. Consequently, two
of the participant utilities (Tampa Bay Water and City of Long Beach) submitted permeate water
samples taken from the permeate of their desalination facilities for analytical determination of iodide
using a catalytic reduction method for detection.
Literature Review Findings
Stabilizing permeate water is accomplished by effectively controlling aspects of post-
treatment. Most of the literature pointed to the use of various chemical treatments to achieve post-
treatment goals. Literature indicates that there are several considerations that should be taken into
account when deciding post-treatment strategies, including the quality of the chemicals added,
controlling dosage rates, and minimizing unwanted chemical reactions within the distribution
system. It was found that primary post-treatment unit operations includes degasification
(decarbonation) for CO2 removal, air stripping for H2S removal, alkalinity and pH adjustment for
stabilization, corrosion control, and disinfection. Post-treatment unit operation performance is
dependent on the source water type and the desalination process. Stabilization of finished water
typically includes the addition of carbonate alkalinity, the use of corrosion inhibitors,
remineralization through blending with source water, disinfection, and enhanced removal of specific
compounds.
154
Due to low mineral content of desalted water, blending with source water allows for the
addition of mineral such as sodium, calcium, potassium, and magnesium. When seawater is used for
blending, the ability to by-pass source water and blend permeate for stability is limited to one
percent, and hence is not typically practiced. In addition, it has been reported that blending could be
problematic if bromides are present because of the possible formation of regulated and non-
regulated DBPs, and possible impacts of bromide on chloramines disinfection. Some literature
suggested that poor buffering might lead to stability problems such that corrosion control is needed,
and could be accomplished with alkalinity and pH adjustment or the use of inhibitors
Effective disinfection of desalted water is accomplished by the use of sodium hypochlorite,
chlorine gas, chloramines, and ozone. It is important to note that disinfection-by-product formation
of blended finished water supplies could be greater when blending native source waters containing
TOC with seawater permeate due to higher concentration of bromide in the permeate. Recently
iodinated DBPs have gained more attention as evidence suggests their presence in many water
supplies across the US; however, the relative contribution of seawater permeate to iodinated DBP
formation due to the passage of iodide across the membrane remains in question. Stabilization and
disinfection are required components of post-treatment processes. Developing treatment goals to
define post-treatment design targets is recommended by many in the literature.
Conclusions
Questionnaire Findings
Compilation and analysis of the questionnaire results indicated that there are a variety of
methods currently relied upon that could be used for post-treatment of permeate. A majority of the
surveyed facilities reported the use of degasification, air stripping, chemical addition of caustic soda
(sodium hydroxide) for pH adjustment, with or without the need for by-pass or native source water
blending. In some instances, more than one form of post-treatment was implemented. Treated
155
ground and surface water were reported to be used to accomplish blending for some facilities.
Specific details on blending were provided by some facilities who reported blending with ion
exchange treated source water, by-passed raw groundwater, and lime-softened or calcite filtered
ground water.. Of the facilities that reported degasification and blending for post-treatment, few
reported blending issues or biological growth within degasification units. Primary disinfection is
accomplished mainly by chlorine addition, although a number of facilities reported using
chloramines for primary treatment.
Chloramines was the main chemical used for secondary disinfection to carry residual into the
system. Chlorine residual goals reported by the surveyed facilities ranged from 2-5 mg/L at the point
of entry (i.e. leaving the plant), and 1 mg/L within the distribution system. Facilities reporting the
use of chloramines indicated that residual goals of 4 mg/L leaving the plant is desired and was
between 1 mg/L and 2.5 mg/L within the distribution system.
Many facilities reported taking advantage of, blending and by-pass options for post-
treatment stabilization purposes; however, specific methods or types of sources use widely varied
between utilities. Blending options included: 1) blending permeate with raw by pass water, 2)
blending using water from lime softening, RO and NF processes, 3) blending with brackish water or
water produced by ion exchange. Facilities that were reliant upon using by-pass reported bypass
blending ratios between ten and thirty percent. It was also reported that blend water alkalinity
averaged about 150 mg/L as CaCO3, as compared to post-treatment using alkalinity adjustment,
which averaged approximately 62 mg/L as CaCO3 at the POE. In addition, the average pH was 8.2
at the POE, along with an average daily permeate flow ranging from 0.15 MGD to 70 MGD and an
average blending flow rate ranging from 2 to10.5 MGD.
One comment that was consistently provided by the reporting utilities that had experienced
distribution system related problems when using permeate as part or all of their water portfolio was
156
that pilot testing of the membrane process in concert with the post-treatment would be useful in
identifying possible issues and aid to limit adverse impacts. Pilot testing can help determine issues
related to such items as stabilization, degasification, disinfection, corrosion control, and blending
concerns. Most facilities did not incorporate pilot post-treatment testing, yet did acknowledge they
performed pilot testing for the membrane process. A combined or comprehensive approach to
permeate post-treatment design evaluations was seen to be beneficial because the proper design of
the post-treatment processes will reduce impacts within the facility, particularly blending practices.
Expert Workshop Proves Beneficial Findings
The expert workshop was a positive and well-executed activity where fourteen priority issues
were identified. The highest ranked priority was related to how utilities should approach post-
treatment stabilization with regards to help and available information. The main idea behind this
highest priority is that stabilization of permeate water is a mandatory component of post- treatment
for desalination facilities. Utilities should explore and define consistency goals by evaluating how
much variation their systems can withstand without experiencing problems in the distribution
system, since there is a range of variability that a distribution system can tolerate when integrating
desalinated water into an existing water distribution system.
The second highest-ranked priority dealt with permeate conditioning and corrosion control.
This topic is interrelated to the highest priority topic identified in the workshop. Nanofiltration and
reverse osmosis permeate are considered corrosive to many types of materials of construction.
Permeate produced by synthetic membrane processes can be “aggressive” water that if not stabilized
may cause internal damage to many of the components that make up the water distribution system.
The utility is required to understand the interrelated issues between treatment and the distribution
157
system with respect to regulatory compliance, distribution integrity, and reliability, and the premise
plumbing impacts specifically related to lead and copper release at consumer taps.
The third highest priority pertains to the challenges of disinfection by products formation
during and following post-treatment operations. Considerations must be made with regard to the
type of disinfection(s) used and there potential for DBP formation, whether it be chlorinated
chloraminated, brominated, or iodated species. With regards to pretreatment, the use of pH buffers
must be taken into account when it comes to their impact on post-treatment. DBP precursors in
bypass water must be considered as a contributor to the total DBP concentration in the distribution
system, while providing for inactivation of pathogens. Seasonal changes as well as mixing different
water sources in the distribution systems should be identified.
Other priorities were related to defining water quality goals that are assessed based on source
water type. Since blending is commonly used to improve stability of permeate water, caution was
offered by the workshop participants based on their experiences because there can be secondary
impacts of blending in the distribution system with regards to consumer confidence and water
quality; hence, planning and testing should be taking into consideration when blending.
Additional priorities were related to classification of the source of blending to achieve finished water
quality goals. Consumer acceptance is imperative, so educating the public on the regulations related
to desalinated water and post-treatment is necessary. Pretreatment can affect post-treatment
decisions and careful selection on unit processes and chemical addition should be considered prior
to use.
Iodide Was Found to Be Present In Permeate
Iodide concentrations were detected for raw and permeate samples produced by Tampa
Bay‟s seawater desalination plant, as well as at the City of Long Beach‟s nanofiltration desalination
158
plant. Iodide was detected using a catalytic reduction procedure that proved to be effective for
measuring iodide offering a method detection limit of 8 μg/L as iodide (I-).
It was determined that the Tampa Bay Water desalted permeate iodide concentration was on
average 10.3 μg/L I-, and represented a combined overall permeate concentration value. Testing was
limited to combined permeate as interpass samples could not be collected as a result of utility
constraints However, the Long Beach facility consisted of two redundant membrane trains
configured in a two-pass flow, of which the second pass locations were sampled for this study.
Average iodide concentrations were determined to be 0.24 μg/L (as I-) and 11.4 μg/L (as I-) for the
2nd pass North process train and 2nd pass South train, respectively. The difference in iodide
concentration between process trains is due to differences with the membranes used for in each
process train.
Regarding quality control efforts, it was determined that Tampa Bay iodide analyses had a
95.7% spike recovery. For Long beach samples, a 74.9 % recovery was determined. Although testing
for iodide was limited to two seawater facilities, and although the iodide levels detected in the
permeate of these two seawater facilities was low, the data presented herein is the first known data
to be available with respect to understanding iodide quantities in municipal seawater permeate.
Recommendations
Based on the results of this study, stabilization and effective disinfection of permeate water
is the most import aspect of post-treatment design and operation. It is recommended that water
purveyors carefully assess the integration of desalination into their water portfolio, and in doing so,
develop practical and reasonable post-treatment goals in addition to the goals typically developed for
the desalination process itself.
159
Furthermore, pilot plant testing that takes into account post-treatment processes is
important to develop proper design to achieve overall drinking water goals for the distribution
system. Most water purveyors understand the need to focus on pilot testing for the membrane
process, however, as a result of this study that included an expert workshop, pilot testing should
extend to include post-treatment processes that are to be implemented for the specific need. This
could include such unit operations as degasification, air stripping, pH adjustment or chemical
conditioning with bases or inhibitors, and must at a minimum require disinfection evaluations.
Considerations for effective post-treatment should also include and understanding of feed water
sources, address the potential of by-pass or native water blending for stabilizing permeate, the effect
of alternative disinfectants when used (such as chloramines), and a realization to include programs to
enhance and evaluate consumer confidence in these efforts.
It is recommended that an investigation be conducted to further test for iodide in the
permeate of brackish water facilities, as this work focused on the only two operating seawater
facilities in the US. Since there are several hundred brackish water facilities in operation, this effort
would appear reasonably easy to implement. Furthermore, an investigation regarding the impact on
iodide in desalted seawater permeate on the formation of iodinated-DBPs should be conducted on
blends of a variety of native water supplies and this seawater permeate. It is not known what would
be the impact of blending differing native or traditional water supplies with desalted seawater
permeate.
160
161
APPENDIX A: POST TREATMENT QUESTIONNAIRE
162
163
164
165
166
167
168
169
170
171
172
173
174
175
176
APPENDIX B: WORKSHOP AGENDA
177
178
179
APPENDIX C: NOMINAL GROUP TECHNIQUE WORKSHOP GUIDLINE AND PROCEDURES
180
181
APPENDIX D: PRIORITY ISSUE IDENTIFICATION FORM
182
183
REFERENCES
Agus, E., N. Vouthkov, and D.L. Sedlak. 2009. “Disinfection By-Products and Their Potential
Impact on the Quality of Water Produced by Desalination Systems: A Literature Review. Desalination, 237: 214-237.
Al Arrayedhy, M. 1987. Pre- and Post-treatment at the RO Plant at RA‟s Abu Jarjur Bahrain.
Desalination., 63: 81-94.
AWWA (American Water Works Association). 1992a. Lead and Copper Rule Guidance Manual, Volume I: Monitoring. Denver, Colorado: AWWA.
AWWA (American Water Works Association). 1992b. Lead and Copper Rule Guidance Manual, Volume II: Corrosion Control Treatment. Denver, Colorado: AWWA.
AWWA (American Water Works Association). 2007. Reverse Osmosis and Nanofiltration Manual of Practice. Denver, Colorado: AWWA.
AWWA (American Water Works Association). 1999. Water Quality and Treatment. Fifth Edition, McGraw-Hill, New York, New York.
AWWARF and DVGW-Forschungsstelle. 1985. “Internal Corrosion of Water Distribution
Systems.” Denver, CO: AWWA Research Foundation. Becker, W.C. et. al. 1993. “Complying with the Lead and Copper Rule Effect of Treatment
Strategies - A Utility Engineer‟s Perspective.” Proceedings of the Joint CSCE-ASCE National Conference on Environmental Engineering. Montreal, Quebec., 1631-1638.
Beltran, J.M., and S. Koo-Oshima. 2006. Eds., Water Desalination for Agricultural Applications
(FAO, Rome, Italy). Bergman, Robert A., and Joseph R. Elarde. 2005. Post-treatment of Reverse Osmosis and
Nanofiltration Systems for Municipal Water Supply. AWWA Membrane Technology Conference, Phoenix, Arizona.
Bick, Amos., and Gideon Oron. 2005. “Post-treatment Design of Seawater Reverse Osmosis Plants:
Boron Removal Technology Selection For Potable Water Production and Environmental Control.” Desalination., 178(1-3):233-246.
Binnie, Chris., Martin Kimber, and George Smethurst. 2002. Basic Water Treatment. Heron Quay,
London, England. Thomas Telford Publishing. Bichsel, Y., and U. Von Gunten. 1999. Oxidation of iodide and hypoiodous acid in the disinfection
of natural waters. Environ. Sci. Technol. 33: 4040–4045.
184
Bonnelye, V., M.A. Sanz, L. Francisci, F. Beltran, G. Cremer, R. Colcuera, R and J. Laraudogoitia. 2007. Curacao, Netherlands Antilles: A Successful Example of Boron Removal on a Seawater Desalination Plant. Desalination., 205(1-3): 200-205.
Burbano, A.A., S.S. Adham, and W.R. Pearce. 2007. The State of Full-Scale RO/NF Desalination –
Results from a Worldwide Survey. AWWA. 99(4): 116. Busch, M., and W.E. Mickols. 2004. Reducing Energy Consumption in Seawater Desalination.
Desalination 165: 299-312. Bush, M., W.E. Mickols, S. Jons, J. Redondo, and J. DeWitte. 2003. Boron Removal in Seawater
Desalination. Proc. of the International Desalination Association World Congress. Bahrain, Paper BAH03-039.
Byrne, W. 1995. Reverse Osmosis: A Practical Guide for Industrial Users. Littleton, Co., Tall Oaks
Publishing. Chiodini, R.A., 1998. The Use of Sodium Silicate for the Control of Lead and Copper. Journal of the
New England Water Works Association. 112:2:147. Clesceri, L.S., Arnold E. Greenberg, and Andrew D. Eaton. 1998. Standard Methods for the
Examination of Waste and Wastewater 20th Edition, United Book Press Inc., Baltimore, Maryland, pp 4-96- 4-97.
Cohen A., and Meyers J.R. 1987. “Mitigating Copper Pitting Through Water Treatment”, JAWWA. Delion,N., G. Mauguin and P. Corsin. 2004. Importance and Impact of Post-treatments on Design
and Operation of SWRO Plants. Desalination, 165: 323-334. Delbecq, A.L., and A.H. Van deVen. 1971. Group Process Model for Problem Identification and
Program Planning. Journal Of Applied Behavioral Science 7(4):466-491. Delbecq, A.L., A.H. Van deVen, and D.H. Gustafson. 1975. Group Techniques for Program
Planners: A Guide to Nominal Group and Delphi Processes. Glenview, IL. Scott Foresman and Company.
Dolcinar, S., and A.I. Schafer. 2006. “Public Perception of Desalinated Versus Recycle Water In
Australia.” Proceedings of the AWWA Desalination Symposium. Honolulu, HI (posted online at http://ro.uow.edu.au/commpapers/138.
Duranceau, S.J., J.S. Taylor, and L.A. Mulford. 1992. SOC Removal in a Membrane Softening
Process. Journal AWWA, 84(1): 68-78. Duranceau, S.J. 1993. Membrane Process Post-treatment. Supplement to AWWA Seminar Proceedings:
Duranceau, S.J., R.K. Anderson, R.D. Teegarden. 1999. Comparison of Mineral Acid Pretreatments for Hydrogen Sulfide Removal in Packed Towers. AWWA, 91(5): 85-96.
Duranceau, S. J. 1999. “Holistic Use of Membrane Processes to Reduce Copper Corrosion and Solve Some Source
Water Problems.” Proceedings of the American Water Works Association Annual Conference. Chicago, IL.
Duranceau, S.J. 2001. Membrane Practices for Water Treatment. AWWA Trends in Water Series.
Denver, CO: AWWA (2001). Duranceau, S.J. 2004a. You Can’t Hide From Hydrogen Sulfide. Proceedings of the Florida Section
AWWA 2004 Annual Conference. Orlando, FL (November 14-18, 2004). Duranceau, S.J. 2004b. Post-treatment Considerations for Blending Permeate into Water in to Water Distribution
Systems. Proceedings of the 2004 AMTA Biennial Conference and Exposition. San Antonio, TX: American Membrane Technology Association: (August 4-August 7, 2004).
Duranceau, S.J., D. Townley, and G.E.C. Bell. 2004c. Optimizing Corrosion Control in Water Distribution
Systems. Denver, Co. AWWA Research Foundation. Duranceau, S.J., and W.A. Lovins. 2005. Membrane Post-treatment Optimization for Blending Permeate Into
Water Distribution Systems. Proceedings of the 2005 AWWA Distribution System Symposium Conference and Exposition. Tampa, FL: AWWA (September 18-21).
Duranceau, S.J. 2006. Post-treatment and Distribution System Impacts. Proceedings of the AWWA 2006
Desalination Symposium. Honolulu, HI: (May 7-9, 2006). Dykes, G.M., and W.J. Conlon. 1989. Use of Membrane Technology in Florida. Journal AWWA. 43:
43-46. Fayad, N.M. 1993. Seasonal Variations of THMs in Saudi Arabian Drinking Water. AWWA. 85: 46-
50. Fritzmann, C., J. Lowenberg, T. Wintgens, and T. Merlin. 2007. State-of-the-art Reverse Osmosis.
Desalination., 216(1-3): 1-76. Global Water Intelligence. 2008. IDA/GWI Worldwide Desalination Plant Inventory. London:
Global Water Intelligence. GDWQS. 1993. Gulf Drinking Water Quality Standards. GS/149/1993. Haag, W.R., and J. Hoigne. 1983. Environ. Sci. Tech. 17:3728. Harms, L.L., Clement, J.A, and Schock, M.R. 1994. “Water Chemistry of Lead Control”, Critical Issues
in Water and Wastewater Treatment, Boulder, Colorado.
186
Hendricks, David W. 2006. Water Treatment Unit Processes; Physical and Chemical. 6000 Broken Sound Parkway NW, Suite 300, Boca Raton, FL. CRC Press, Taylor & Francis.
Holm, T.R. and Schock, M.R. 1991. “Potential Effects of Polyphosphate Products on Lead
Solubility in Plumbing Systems.” Journal AWWA, 83 (7): 76-82. Hua, Guanghui., David A. Reckhow, and Junsung Kim. 2006. Effect of Bromide and Iodide Ions
on the Formation and Speciation of Disinfection Byproducts during Chlorination. Environ. Sci. Technol., 40(9): 3050-3056.
Imran, S.A., J.D Dietz, G, Mutoti, J.S Taylor, A.A Randall and C.D Cooper. 2005. Red Water
Release in Drinking Water Distribution Systems. Journal AWWA, 97(9): 93 – 100. Imran, S.A., J.D. Dietz, G. Mutoti, W. Xiao, J.S. Taylor, A.A. Randall, and V. Desai. 2006.
Optimizing Source Water Blends for Corrosion and Residual Control in Distribution Systems. Journal AWWA, 98(5):107 – 115.
Johnson, J., J. Kim, T. Tran, and R. Yorton. 1993. Evaluation of Corrosion Control Alternatives
to meet the Lead and Copper Rule for Eastern Massachusetts. Johnson, B., R. Yorton, T. Tran, and J. Kim. 1994. “Evaluation of Corrosion Control Alternatives
for Low pH, Low Alkalinity Surface Waters in Eastern Massachusetts”, Critical Issues in Water and Wastewater Treatment, Boulder, Colorado.
Kedem, O., and A. Katchalsky. 1958. Thermodynamic Analysis of the Permeability of Biological
Membranes to Nonelectrolytes. Biochimica et Biophysica Acta, 27:123. Krasner, S.W., M.J. McGuire, J.G. Jacangelo, N.L. Patania, K.M. Reagan, and E.M. Aieta. The
Occurrence of Disinfection By-Products in US Drinking Water.” Jour. AWWA, 81(8): 41-53 Krasner, S.W., S.M. Chinn, Z.K. Chowdhury, and D.M. Owen. 1996. In Disinfection By-Products in
Water Treatment: The Chemistry of Their Formation and Control. Ed. P. Singer. CRC Lewis, Boca Raton, FL pg. 59-60.
Lahav, Ori. and Liat Birnhack. 2007. Quality Criteria for Desalinated Water Following Post-
Inhibitors: Issues of Effectiveness and Mechanism.” In: Proceedings American Water Works Association Water Quality Technology Conference, Denver, CO, November 9–12.
Lehrman, L., H.L Shuldener. 1951. Role of sodium silicate in inhibiting corrosion by film formation
on water piping. Journal AWWA. 43(3):175-188. Lovins, W.A.; S.J. Duranceau, T. King and S. Medeiros. 2004a. Trumping Hydrogen Sulfide. Water
Environment & Technology. 16(3): 37-41.
187
Lovins, W.A., S.J. Duranceau, R. Powell and J.R. Voorhees. 2004b. Blending Multiple Source Waters
in a Common Water Distribution System. Proceedings of the Florida Section AWWA 2004 Annual Conference. Orlando, FL (November 14-18, 2004).
Lyn, T. L. and Taylor, J.S. 1993. "Turbidity Control Following Hydrogen Sulfide Chlorination."
JAWWA. 84(1):68-78. Lytle, D.A.; Schock, M.R.; & Sorg, T.J. 1996. Controlling Lead Corrosion in the Drinking Water of a
Building by Orthophosphate and Silicate Treatment. Journal of the New England Water Works Association., 110:3:202.
Magara, Y, A. Tabata, M. Kohki, M. Kawasaki and M. Hirose. Desalination. 118: 25-34. Mallevialle, J., I.H Suffet. 1987 Identification of taste and odor compounds in the drinking waters. Denver
Colo., USA: American Water Works Association Research Foundation and Lyonnaise des Eaux,
Mallevialle, J; Odendaal, P.E.; Wiesner, M.R. 1996. The Emergence of Membranes in Water and Wastewater
Treatment in AwwaRF Water Treatment Membrane Processes, J. Mallevialle et.al., editors. New York. McGraw-Hill.
McGuire Environmental Consultants Inc. 2004 Final Report- Disinfection byproduct formation in a
simulated distribution system: blending desalinated seawater from the Poseidon Resources, Inc. pilot facility with local drinking water sources. McGuire/Malcolm Pirnie, 1919 Santa Monica Blvd. Suite 200, Santa Monica, CA 90404-1955.
McNeill, Laurie S., Marc Edwards. 2001. Iron Pipe Corrosion in Distribution Systems. Journal
AWWA., 93(7):88-100. Melnick, L., O. Vysotskaja and B. Kornilovich. 1999. Desalination. 124: 125-130. Pervov, Alexei G., Alexei P. Andrianov, Roman V Efremov, Andrey V. Desyatov and Alexei E
Baranov. 2003. RO Membrane Rejection: A new solution for the Caspain Sea Desalination, Low-Pressure Membranes. Desalination, 157(1-3):377-384. European Conference on Desalination and the Environment: Fresh Water for all, Malta, 4–8 May 2003.
Pinto, J.A.; McAnally, A.S.; & Flora, J.R.V., 1997. Evaluation of Lead and Copper Corrosion
Control Techniques. Journal of Environment Science and Health., A32:1:31. Pisigan, R.A., Jr. and J.E. Singley. 1984. Evaluation of Water Corrosivity Using the Langelier Index
and Relative Corrosion Rate Models.” Corrosion/84. Paper 149, National Association of Corrosion Engineers, New Orleans, LA.
Prats, D., M.F. ChillonArias and R. Pastor. 2003. Desalination. 120: 145-152.
188
Price, S. and F.T. Jefferson. 1993. Journal of New England Water Works Association. 111:285-293. Powell, J.H., and M.E. Guild. 1961. Salinity Problems in the Arid Zones: Field Operation of Electric
Membrane Equipment for Water Desalination. Proceedings of the Teheran Symposium, UNESCO. 363-370.
Ramaley, B.L., “Monitoring and Control Experience Under the Lead and Copper Rule.” JAWWA,
February 1993. Redondo, J. 2001. Brackish-, Sea- and Wastewater Desalination. Desalination, 138(1-3): 29-40. Reiber, S., 1989. “Copper Plumbing Surfaces: An Electrochemical Study”, JAWWA, July, 1989. Richardson, S.D.; A.D. Thurston; C. Rav-Acha; L. Groisman, I. Popilevsky, O.Juraev, V. Glezer,
A.B. McKague, M.J. Plewa and E.D. Wagner. 2003. Environ. Sci. Tech. 37: 3782. Rodriguez, M., A.F. Ruiz, M.F. Chilon and D.P. Rico. 2001. Desalination. 140: 145-157. Rook, J.J. 1977. Env. Sci. Technology. 11: 478. Rogina, B and M. Dubravcic. 1953. “Micro-determination of iodides by Arresting the Catalytic
Reduction of Ceric Ions”, The Analyst, 78: 594-599. Rowe, D.R., and I.M. Abdel-Magid. 1995. Handbook of Wastewater Reclamation and Reuse, Boca
Raton: CRC Press. Ruggieri, F.; J.L. Fernandez-Turiel; D. Gimeno; F. Valero; J.C. Garcia; M.E. Medina. 2008.
“Limestone Selection Criteria for EDR Water Remineralization.” Desalination, 227 :314-326. Ryder, R.A.; & Wagner, I. Corrosion Inhibitors. Internal Corrosion of Water Distribution Systems.
AWWARF/DVGW-Forschungsstelle Coop.Res.Rept. 1985. Ryznar, J.W. 1944. “A New Index for Determining the Amount of Calcium Carbonate Scale
Formed by a Water.” Journal Amer. Water Works Assoc. 36: 472. Sarin, P., V.L. Snoeyink, D.A. Lytle, and W.M. Kriven. 2004. Journal of Environmental Engineering,
130(4): 364-373. Schock, M.R. & Wagner, I. The Corrosion and Solubility of Lead in Drinking Water. Internal
Corrosion of Water Distribution Systems. AWWARF/DVGW-Rorschungsstelle Coop.Res.Rept. 1985.
Schock, M.R. 1988. “Understanding Corrosion Strategies for Lead”, JAWWA, July, 1988. Schock, M.R. 1990. “Internal Corrosion and Deposition Control,” in Water Quality and Treatment.
New York, NY: McGraw Hill, Inc; 997-1111.
189
Schock, M.R. et. al. 1998. “Replacing Polyphosphate with Silicate to Solve Problems with Lead,
Copper and Source Water Iron.” Proceedings of the AWWA Water Quality Technology Conference. San Diego, CA.
Polyphosphate with Silicate to Solve Lead, Copper, and Source Water Iron Problems. Journal AWWA., 97:11:84
Singley, J.E. 1981. “The Search for a Corrosion Index.” Jour. AWWA. 73(10):529. Sittig, M. 1985. In: Handbook of Toxic and Hazardous Chemicals and Carcinogens, 2nd Ed., Noyes
Data Corporation, Park Ridge, New Jersey, p. 148. Suibing Liu, Michael LePuil, J. S. Taylor and A. A. Randall. 2007. “Nanofiltration and reverse
osmosis biostability relative to alternative methods of water treatment,” in Journal of Water Supply: Research and Technology-AQUA. Q IWA Publishing. Issue 56.1
Taniguchi M, Y. Fusaoka, T. Nishikawa and M. Kurihara. 2004. Boron Removal in RO Seawater
Desalination. Desalination, 167(1-3):419-426. Tang, Z., S. Hong, W. Xiao, and J. Taylor. 2006. Water Research, Volume 40. Pages 943-950. Thresh, J.C., The action of natural waters on lead, Parts I and II. Analyst, 1922, 47:459-468, 501–
505. Malleviale, J. and Suffet, I.H., eds. 1987. The Identification and Treatment of Tastes and Odors in
Drinking Water. Denver, CO: American Water Works Association Research Foundation. Taylor, J.S., S.J. Duranceau, W.M. Barrett, and J.F. Goigel. 1989. Assessment of Potable Water Membrane
Applications and Research Needs. Denver, CO: AWWA Research Foundation, December (1989).
Taylor J. S. and E. P. Jacobs, Reverse Osmosis and Nanofiltration, Water Treatment Membrane
Processes, Chapter 9, McGraw-Hill, October 1996, 70 pages. Taylor, J., J. Dietz, A. Randall and S. Hong. 2005. Water Science Technology. Volume 51, Issue 6-7,
Corrosion Inhibitors: Issues of Effectiveness and Mechanism. Report 12: Valley Forge, PA: PQ Corporation, P.O. Box 840, Valley Forge, PA 19482.
Trussell, R. Rhodes & Jerome F. Thomas. 1971. A discussion of the Chemical Character or Water
Mixtures. Journal AWWA, 63(1):49-51.
190
USEPA. 1991. “Lead and Copper Final Rule.” Federal Register. 56; 110; 26460. USEPA. 1992. Lead and Copper Rule Guidance Manual, Volume II: Corrosion Control Treatment.
USEPA 811-B-92-002. Washington, D.C.: Office of Water. USEPA. 2003. “Revised Guidance Manual for Selecting Lead and Copper Control Strategies.” USEPA. 2007. IRIS Database. www.epa.gov.iris. Wangnick, K. 2004. 2004 IDA Worldwide Desalting Plants Inventory, Rept. 18. Wangnick
Consulting, GMBH, Gnarrenburg, Germany. WHO. 2003a. Report of the WHO workshop: Nutrient minerals in drinking water and potential health consequences of long-term consumption of demineralized and remineralized and altered mineral content drinking waters. Rome, November 11-13, 2003 (SDE/WSH/04.01).
Weber, W.J. 1972. Physiochemical Processes for Water Quality Control. New York: John- Wiley and Sons. WHO. 2003b. Emerging Issues in Water and Infectious Disease. Geneva: WHO Press. WHO. 2004. WHO Guidelines for Drinking Water Quality. Geneva: WHO Press. WHO. 2005. Nutrients in Drinking-water. Water, Sanitation and Health Protection and the Human
Environment, Geneva. WHO. 2006. Expert Committee Mtg on Health Effects of Calcium and Magnesium in Drinking
water. April 27-28 Wash. D.C. Document Production Services, Geneva, Switzerland. Withers, Anthony., 2005. Options for Recarbonation, Remineralisation and Disinfection for
desalination Plants. Desalination., 179 (1-3):11-24. Yermiyahu U, Tal A, Ben-Gal A, Bar-Tal A, Tarchitzky J, and Lahav O. 2007. Rethinking
desalinated water quality and agriculture. Science, Volume 318, Pages 920-921 Yu Zhao and J. S. Taylor, "Modeling Membrane Performance over Time, JAWWA, 96:12, Dec.
2004. Yu Zhao and J. S. Taylor, "Incorporating Osmotic Pressure in an Integrated Incremental Model for
Predicting RO or NF Permeate Concentration", Desal., vol.174 no.2 (2005) pp. 145-159. Yu Zhao and Taylor, J. S., "Assessment of ASTM D 4516 for Evaluation of Reverse Osmosis
Membrane Performance "., Desalination, Vol. 180, Issues 1-3, 15 Aug 2005, Pages 231-244 Yu, Zhao., J. Taylor and S.K. Hong. 2005. “Combined influence of membrane surface properties