+ All Categories
Home > Documents > Poster 1469-2017: Production Forecasting in the Age of...

Poster 1469-2017: Production Forecasting in the Age of...

Date post: 06-Mar-2018
Category:
Upload: dodiep
View: 219 times
Download: 3 times
Share this document with a friend
17
Company Confidential – For Internal Use Only Copyright © SAS Institute Inc. All rights reserved. Production Forecasting in the Age of Big Data in Oil & Gas industry Vipin Gupta, Sr Reservoir Specialist, MPM, PETRONAS Satyajit Dwivedi, Global Process Sensor and IoT Practice Open
Transcript

C o m p a n y C o n f id e n t ial – Fo r In t e rn a l U se O n lyC o p y r ig h t © S AS In st i tu t e In c. Al l r ig h t s re se r ve d .

Production Forecasting in the Age of Big Data in Oil & Gas industryVipin Gupta, Sr Reservoir Specialist, MPM, PETRONAS

Satyajit Dwivedi, Global Process Sensor and IoT Practice

Open

C o m p a n y C o n f id e n t ial – Fo r In t e rn a l U se O n lyC o p y r ig h t © S AS In st i tu t e In c. Al l r ig h t s re se r ve d .

Technical Potential ForecastingNational Production Portfolio Management and why is TP important?

Open

Ensuring standardization on TP definition allows systematic & focused review of existing key

constraints

Currently not transparent

1

TP reporting to MPM not consistent across PAC’s

2

Production system bottlenecks

3 Sustained production

4

• Ideally, this is the rate at which we should be producing.

• However the production at sale point is significantly lower.

• This gap is created by efficiency of various processes through which the crude passes from wellhead to sale point and uptime of the system.

• The balance between maintaining peak efficiency of production system and uptime is directly proportional to delivery of technical potential.

C o m p a n y C o n f id e n t ial – Fo r In t e rn a l U se O n lyC o p y r ig h t © S AS In st i tu t e In c. Al l r ig h t s re se r ve d .

Technical Potential ForecastingValue of improving the TP forecasting accuracy

Existing Thinking Opportunities Business Outcome

• Oil Forecast are still done usingDecline Curve Analysis, A theoryproposed by JJ Arps (1944).

• Normal interpolation techniquesapplied did not plug gaps in WellTest data

• Major Oil & Gas Operators,especially NOCs face decision thatinvolve billions of dollars andthousands of lives essentially basedon the production profiles.

• When it comes to short term ( 1-2years) the accuracy of forecast isparamount since it could meansaving on a huge unnecessaryinvestment.

• Downtimes can be preempted ordelayed based on the overallproduction requirement

• Forecasting adopted was Complex,dependent upon interaction ofmultiplevariables

• Measurement of Forecastingaccuracy not a practice

• Forecasting Process was notautomated

• Understanding the overall technicalcharacteristics / patterns ofFields/Well with the Application ofAnalytics

• Adopt a system that shall automatethe process of Short Term, MediumTerm and Long Term Forecasting

• Forecasts & its Upside/Downsidewith Accuracy measurement anintegral part of forecasting process

• Integration of structured andunstructured data from PD/UPD toenhance forecasts

Open

C o m p a n y C o n f id e n t ial – Fo r In t e rn a l U se O n lyC o p y r ig h t © S AS In st i tu t e In c. Al l r ig h t s re se r ve d .

Technical Potential ForecastingNational Production Portfolio Management and why is TP important?

Open

C o m p a n y C o n f id e n t ial – Fo r In t e rn a l U se O n lyC o p y r ig h t © S AS In st i tu t e In c. Al l r ig h t s re se r ve d .

Technical Potential ForecastingNational Production Portfolio Management and why is TP important?

Note: Numbers are indicative only and do not reflect the actual/forecast figures

Open

C o m p a n y C o n f id e n t ial – Fo r In t e rn a l U se O n lyC o p y r ig h t © S AS In st i tu t e In c. Al l r ig h t s re se r ve d .

Forecasting Science and Art

Open

C o m p a n y C o n f id e n t ial – Fo r In t e rn a l U se O n lyC o p y r ig h t © S AS In st i tu t e In c. Al l r ig h t s re se r ve d .

Technical Potential ForecastingConsiderations

Photo by Loni Townsend

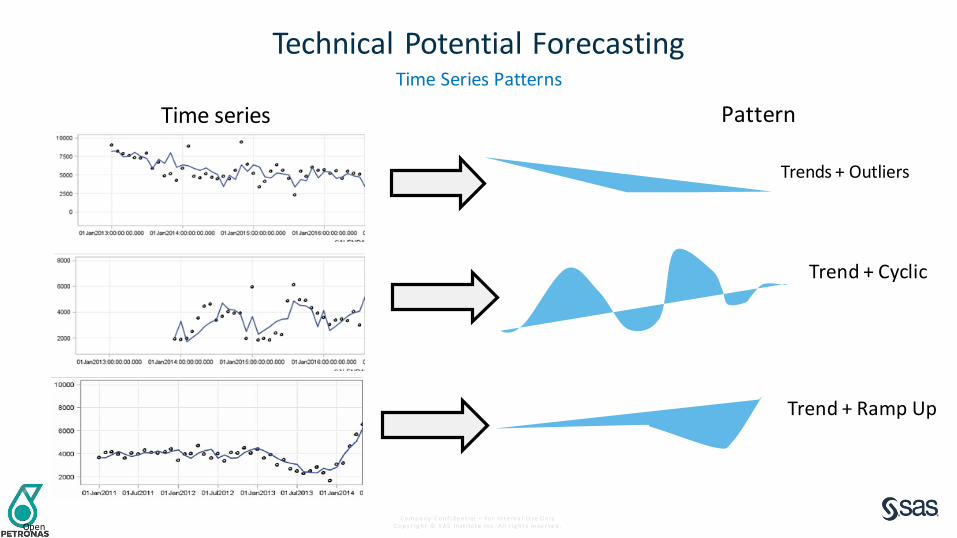
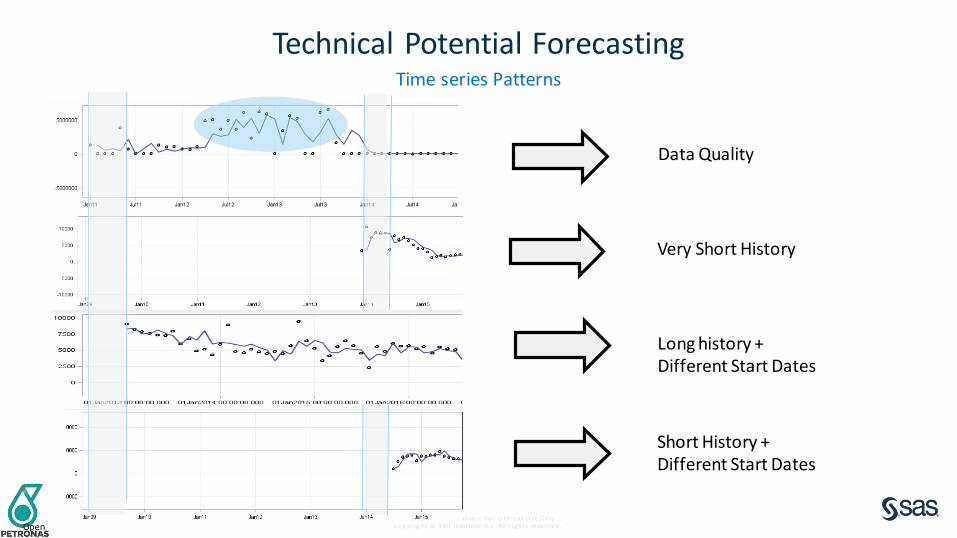
• What is technical potential data? • How do we build the time-series data?• Understanding the time-series patterns?• What do we want out of a production forecast? Long-term or short-term? • Do we want to measure effect of X on Y? (scenario forecasting) • What methods are out there to forecast/analyze them? • How do we decide which method is best? • How can we use SAS for all this?

Open

C o m p a n y C o n f id e n t ial – Fo r In t e rn a l U se O n lyC o p y r ig h t © S AS In st i tu t e In c. Al l r ig h t s re se r ve d .

Forecasting Building the Technical Potential

No Well Test Data

Comparingwith

Production

RemovingOutlier

ApplyingHeuristic

TechnicalPotential

Open

C o m p a n y C o n f id e n t ial – Fo r In t e rn a l U se O n lyC o p y r ig h t © S AS In st i tu t e In c. Al l r ig h t s re se r ve d .

Forecasting Building the Technical Potential

Country

Region 1 Region 2

Operator 1

Field 1 Field 2

Operator 2

Field 9

Technical Potential @ various Field Levels

Open

C o m p a n y C o n f id e n t ial – Fo r In t e rn a l U se O n lyC o p y r ig h t © S AS In st i tu t e In c. Al l r ig h t s re se r ve d .

Technical Potential ForecastingTime Series Patterns

Photo by Loni Townsend

Trend + Cyclic

Trends + Outliers

Trend + Ramp Up

Time series Pattern

Open

C o m p a n y C o n f id e n t ial – Fo r In t e rn a l U se O n lyC o p y r ig h t © S AS In st i tu t e In c. Al l r ig h t s re se r ve d .

Technical Potential ForecastingTime series Patterns

Data Quality

Very Short History

Short History + Different Start Dates

Long history + Different Start Dates

Open

C o m p a n y C o n f id e n t ial – Fo r In t e rn a l U se O n lyC o p y r ig h t © S AS In st i tu t e In c. Al l r ig h t s re se r ve d .

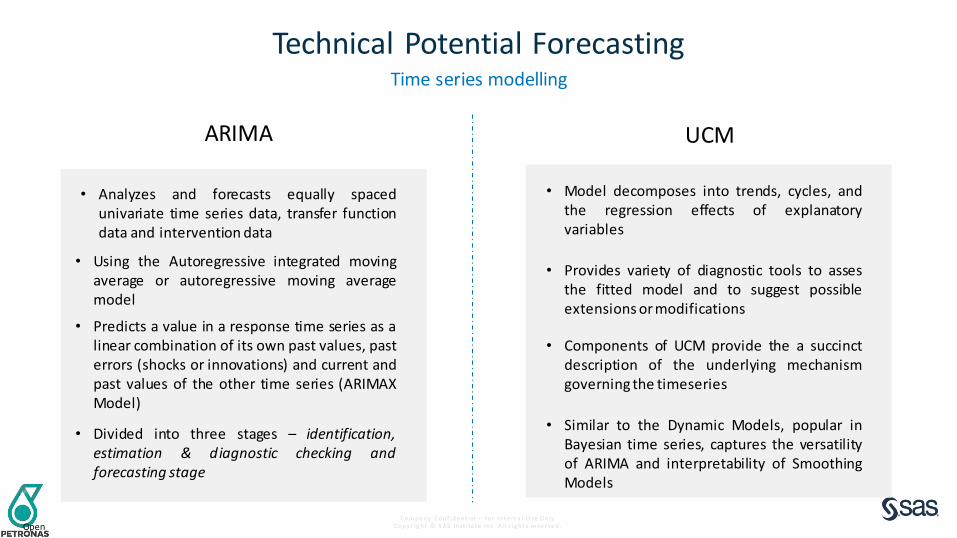
Technical Potential ForecastingTime series modelling

ARIMA UCM

• Analyzes and forecasts equally spacedunivariate time series data, transfer functiondata and intervention data

• Using the Autoregressive integrated movingaverage or autoregressive moving averagemodel

• Predicts a value in a response time series as alinear combination of its own past values, pasterrors (shocks or innovations) and current andpast values of the other time series (ARIMAXModel)

• Divided into three stages – identification,estimation & diagnostic checking andforecasting stage

• Provides variety of diagnostic tools to assesthe fitted model and to suggest possibleextensions or modifications

• Components of UCM provide the a succinctdescription of the underlying mechanismgoverning the timeseries

• Model decomposes into trends, cycles, andthe regression effects of explanatoryvariables

• Similar to the Dynamic Models, popular inBayesian time series, captures the versatilityof ARIMA and interpretability of SmoothingModels

Open

C o m p a n y C o n f id e n t ial – Fo r In t e rn a l U se O n lyC o p y r ig h t © S AS In st i tu t e In c. Al l r ig h t s re se r ve d .

Technical Potential ForecastingChallenges and Integrating DCA

• Very Short History Modelling

• Benchmarking the results of ARIMA, UCM

• Time series with Large errors in ARIMA, UCM

• Lifecycle behaviour of fields

Decline Curve Analysis

Open

C o m p a n y C o n f id e n t ial – Fo r In t e rn a l U se O n lyC o p y r ig h t © S AS In st i tu t e In c. Al l r ig h t s re se r ve d .

Re-constructTechnical potential

(TP)Outlier

Pre-Treatment

Classification of fields

GenerateBaseline

TimeseriesForecast

Integrate Decline Curve

Analysis Schedule monthly

forecast /Re-diagnose

Extract Raw TP from OFM and recalculate the series by applying heuristics

Break into groups based on history available / start dates, short history, # of wells in field, % contribution

Benchmark results with DCA and undertake DCA forecasts for short time series and integrate the results

Apply time-series modelling technique – ARIMA, UCM, Combined Modeling and evaluate out of sample MAPE

Pareto analysis of MAPE, trend of forecast accuracy improvement / detoriation after each cycle of forecast, re-diagnose where required

Technical Potential ForecastingOverall Framework

Smoothen outliers from the time-series example – gas production data mixed with oil production data

Open

C o m p a n y C o n f id e n t ial – Fo r In t e rn a l U se O n lyC o p y r ig h t © S AS In st i tu t e In c. Al l r ig h t s re se r ve d .

Technical Potential ForecastingForecast Evaluation Method and Observed Accuracy

11.05%

Forecast Horizon

1 Define a holdout period for model selection

Model Training Period

2 Diagnose training history

Cyclicity

Causal Events

Outliers

Trend

3 Construct competing models

Model1: ARIMA, f (History, Outliers, etc…)

Model2: ARIMAX, f (History, Trends, Outliers, Predicting variables)

Model3: UCM, f (History, Outliers, Trends, Cyclicity, Events, etc…)

4 Forecast & evaluate model performance over holdout period

13.64%Error

8.58%

5 Select champion model and refit over entire history6 Produce forecast with events and correction for moving

development

Open

C o m p a n y C o n f id e n t ial – Fo r In t e rn a l U se O n lyC o p y r ig h t © S AS In st i tu t e In c. Al l r ig h t s re se r ve d .

Technical Potential ForecastingForecast Evaluation Method and Observed Accuracy

80% of the fields we achieved < 20% error

in MAPE

Top 30 fields contributing 80% of

production we achieved average < 10% error in MAPE

Open

sas.com

C o m p a n y C o n f id e n t ial – Fo r In t e rn a l U se O n lyC o p y r ig h t © S AS In st i tu t e In c. Al l r ig h t s re se r ve d .

[email protected]@sas.com

Open


Recommended