40
Performance improvements in PostgreSQL 9.5 and 9.6 5432meet.us 2016, June 29, Milan Tomas Vondra [email protected]
| Date post: | 16-Apr-2017 |
| Category: |
Technology |
| Upload: | tomas-vondra |
| View: | 4,289 times |
| Download: | 1 times |
Performance improvements in PostgreSQL 9.5 and 9.6
5432meet.us 2016, June 29, Milan
Tomas [email protected]

http://www.slideshare.net/fuzzycz/postgresql-performance-improvements-in-95-and-96
PostgreSQL 9.5, 9.6, ...
● many improvements– many of them related to performance
– many quite large
● release notes are good overview, but ...– many changes not mentioned explicitly
– often difficult to get an idea of the impact
● many talks about new features in general– this talk is about changes affecting performance

What we'll look at?
● PostgreSQL 9.5 & 9.6● only “main” improvements
– complete “features” (multiple commits)
– try to showcase the impact
– no particular order
● dozens of additional optimizations– see release notes for the full list

PostgreSQL 9.5
Sorting
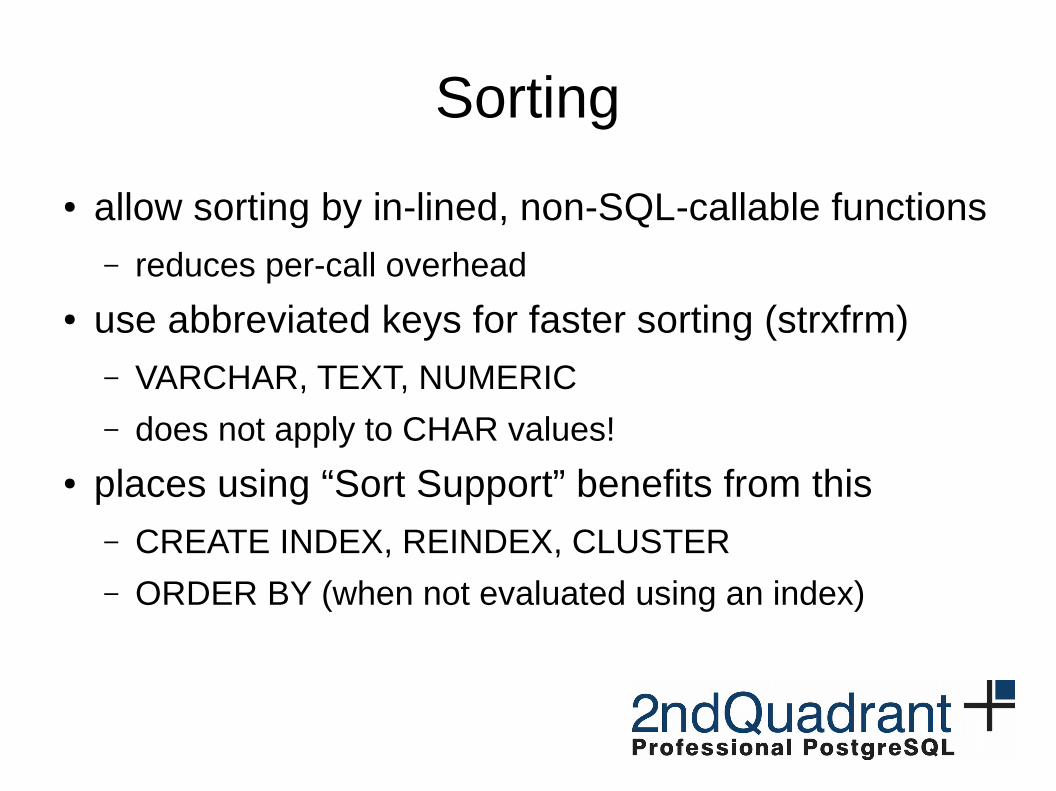
● allow sorting by in-lined, non-SQL-callable functions– reduces per-call overhead
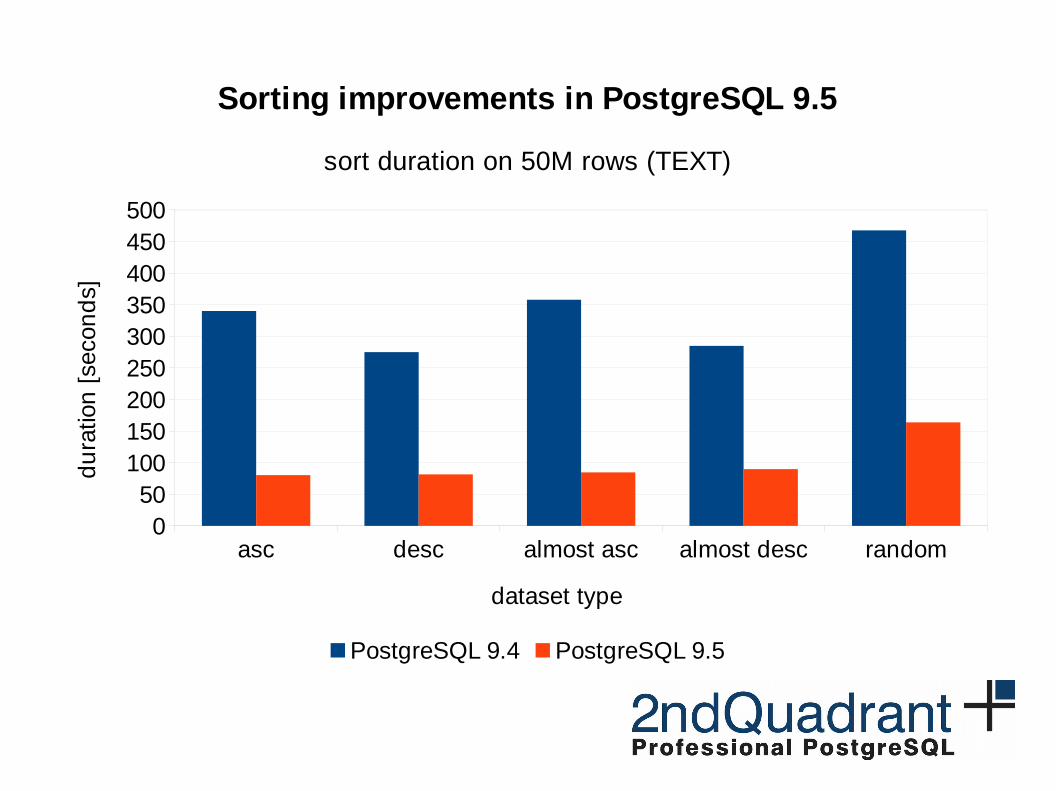
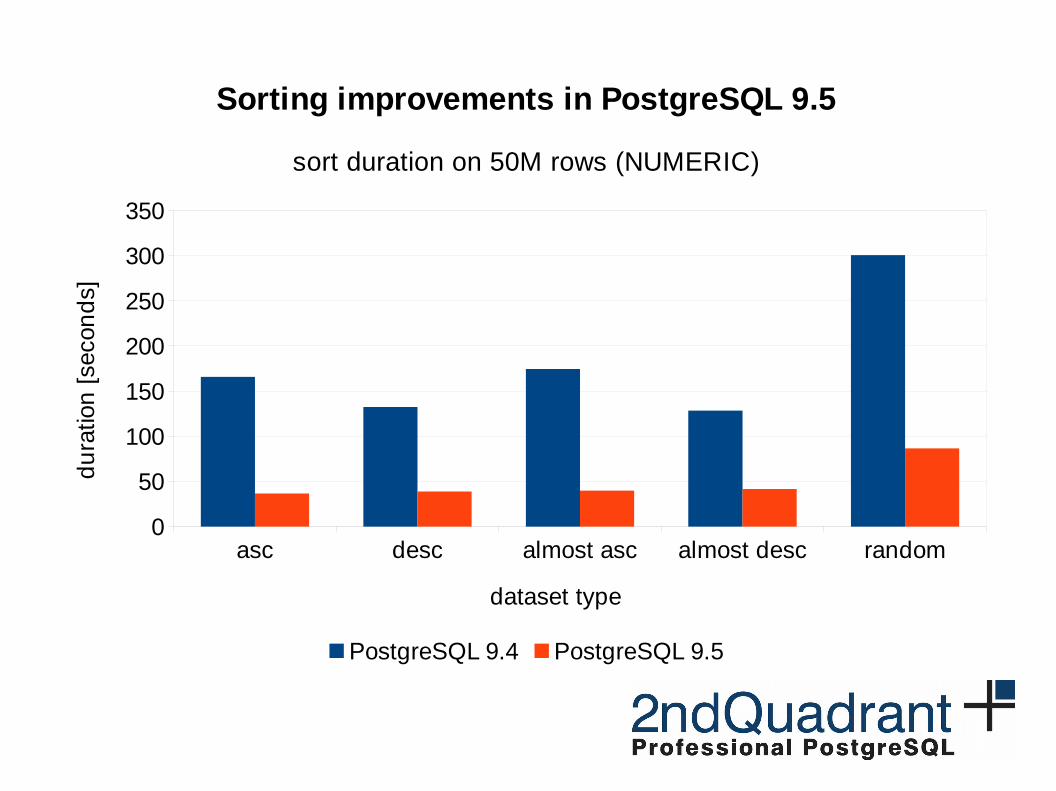
● use abbreviated keys for faster sorting (strxfrm)– VARCHAR, TEXT, NUMERIC
– does not apply to CHAR values!
● places using “Sort Support” benefits from this– CREATE INDEX, REINDEX, CLUSTER
– ORDER BY (when not evaluated using an index)
Sorting
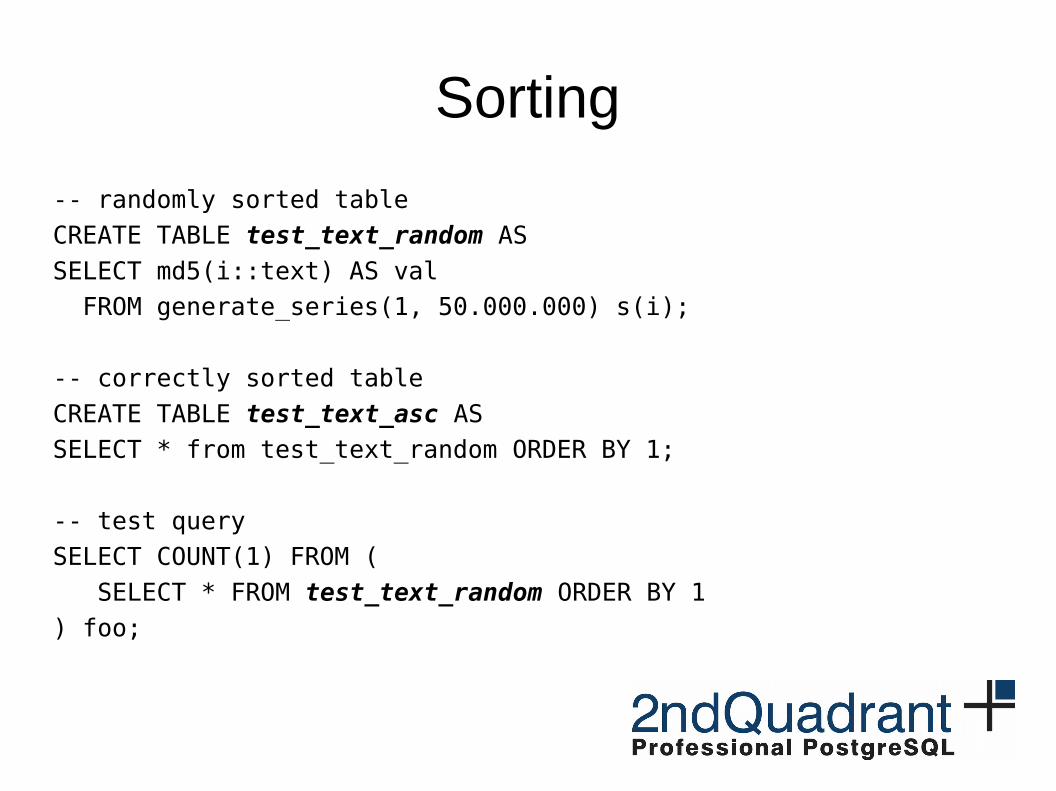
-- randomly sorted tableCREATE TABLE test_text_random AS
SELECT md5(i::text) AS val FROM generate_series(1, 50.000.000) s(i);
-- correctly sorted table
CREATE TABLE test_text_asc ASSELECT * from test_text_random ORDER BY 1;
-- test querySELECT COUNT(1) FROM (
SELECT * FROM test_text_random ORDER BY 1) foo;
asc desc almost asc almost desc random0
50100150200250300350400450500
Sorting improvements in PostgreSQL 9.5
sort duration on 50M rows (TEXT)
PostgreSQL 9.4 PostgreSQL 9.5
dataset type
du
ratio
n [
seco
nd
s]
asc desc almost asc almost desc random0
50
100
150
200
250
300
350
Sorting improvements in PostgreSQL 9.5
sort duration on 50M rows (NUMERIC)
PostgreSQL 9.4 PostgreSQL 9.5
dataset type
du
ratio
n [
seco
nd
s]
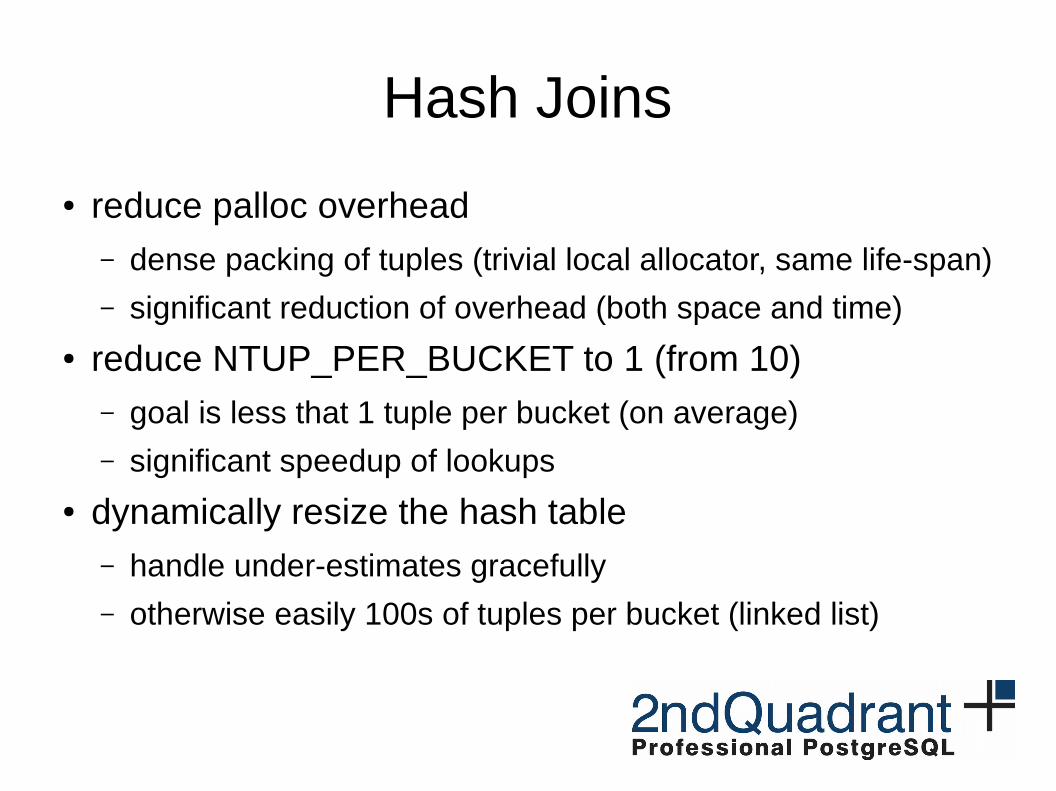
Hash Joins
● reduce palloc overhead– dense packing of tuples (trivial local allocator, same life-span)
– significant reduction of overhead (both space and time)
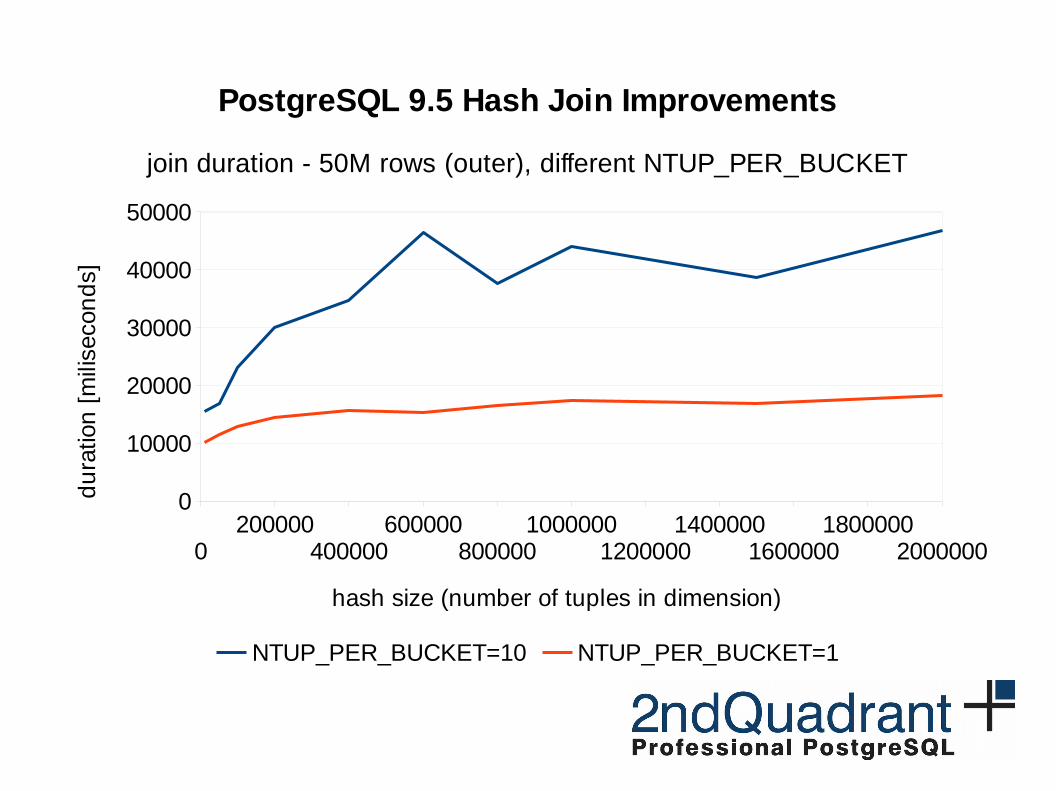
● reduce NTUP_PER_BUCKET to 1 (from 10)– goal is less that 1 tuple per bucket (on average)
– significant speedup of lookups
● dynamically resize the hash table– handle under-estimates gracefully
– otherwise easily 100s of tuples per bucket (linked list)
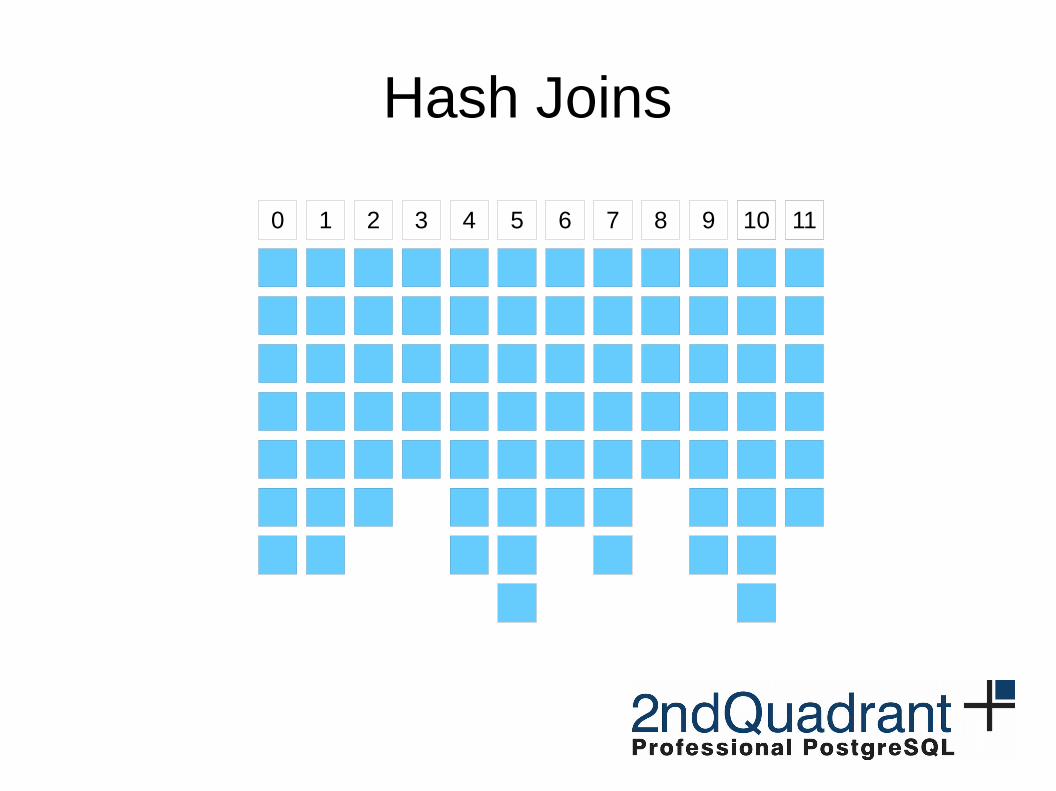
Hash Joins
0 1 2 3 4 5 6 7 8 9 10 1110 11

Hash Joins
0 1 2 3 4 5 6 7 8 9 10 1110 11
Hash Joins
-- dimension table (small one, will be hashed)
CREATE TABLE test_dim AS
SELECT (i-1) AS id, md5(i::text) AS val
FROM generate_series(1, 100.000) s(i);
-- fact table (large one)
CREATE TABLE test_fact AS
SELECT mod(i, 100.000) AS dim_id, md5(i::text) AS val
FROM generate_series(1, 50.000.000) s(i);
-- example query (join of the two tables)
SELECT count(*) FROM test_fact
JOIN test_dim ON (dim_id = id);
0200000
400000600000
8000001000000
12000001400000
16000001800000
2000000
0
10000
20000
30000
40000
50000
PostgreSQL 9.5 Hash Join Improvements
join duration - 50M rows (outer), different NTUP_PER_BUCKET
NTUP_PER_BUCKET=10 NTUP_PER_BUCKET=1
hash size (number of tuples in dimension)
du
ratio
n [
mili
seco
nd
s]
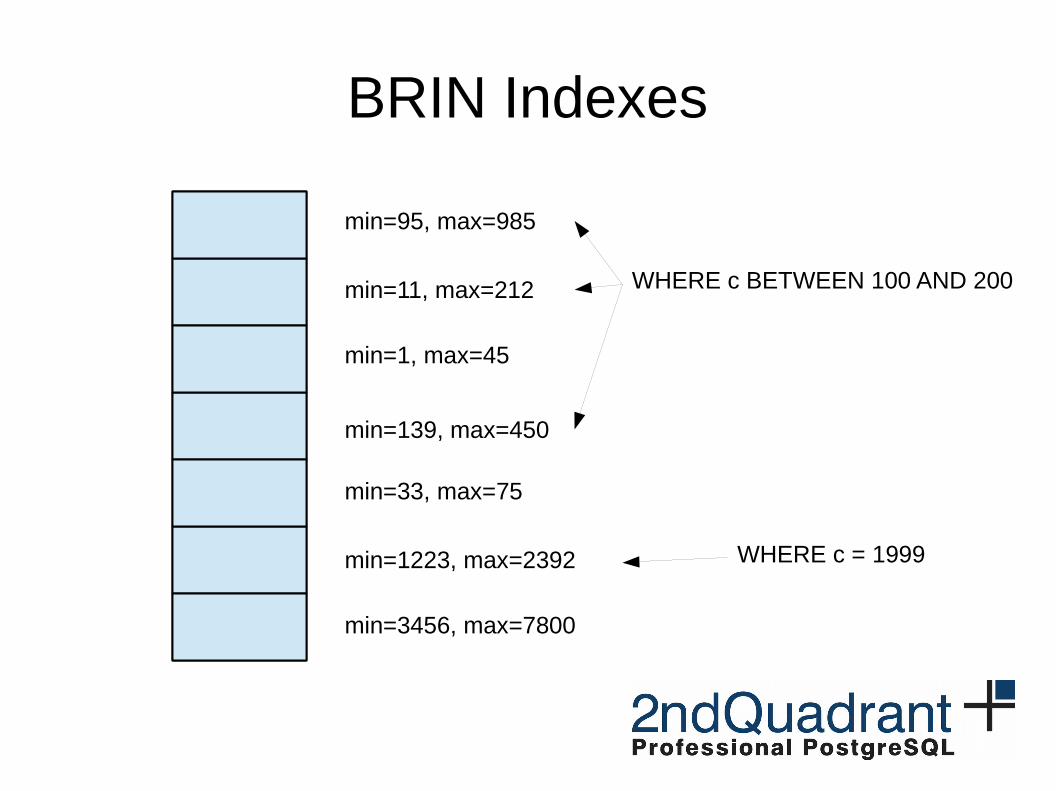
BRIN Indexes
min=33, max=75
min=1223, max=2392
min=3456, max=7800
min=95, max=985
min=11, max=212
min=1, max=45
min=139, max=450
WHERE c = 1999
WHERE c BETWEEN 100 AND 200
BRIN Indexes
table with 100M rowsCREATE TABLE test_bitmap AS SELECT mod(i, 100.000) AS val FROM generate_series(1, 100.000.000) s(i);CREATE INDEX test_btree_idx ON test_bitmap(val);CREATE INDEX test_brin_idx ON test_bitmap USING brin(val);
benchmark (enforce bitmap index scan)SET enable_seqscan = off;SET enable_indexscan = off;
SELECT COUNT(*) FROM test_bitmap WHERE val <= $1;
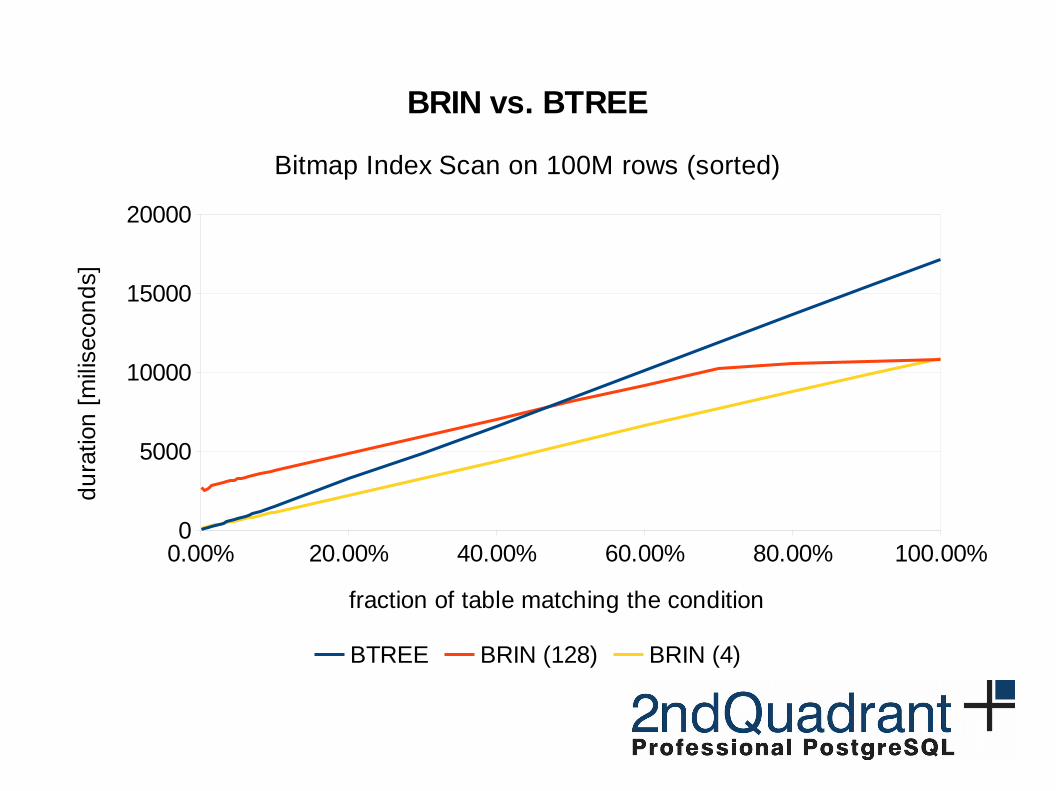
0.00% 20.00% 40.00% 60.00% 80.00% 100.00%0
5000
10000
15000
20000
BRIN vs. BTREE
Bitmap Index Scan on 100M rows (sorted)
BTREE BRIN (128) BRIN (4)
fraction of table matching the condition
du
ratio
n [
mili
seco
nd
s]
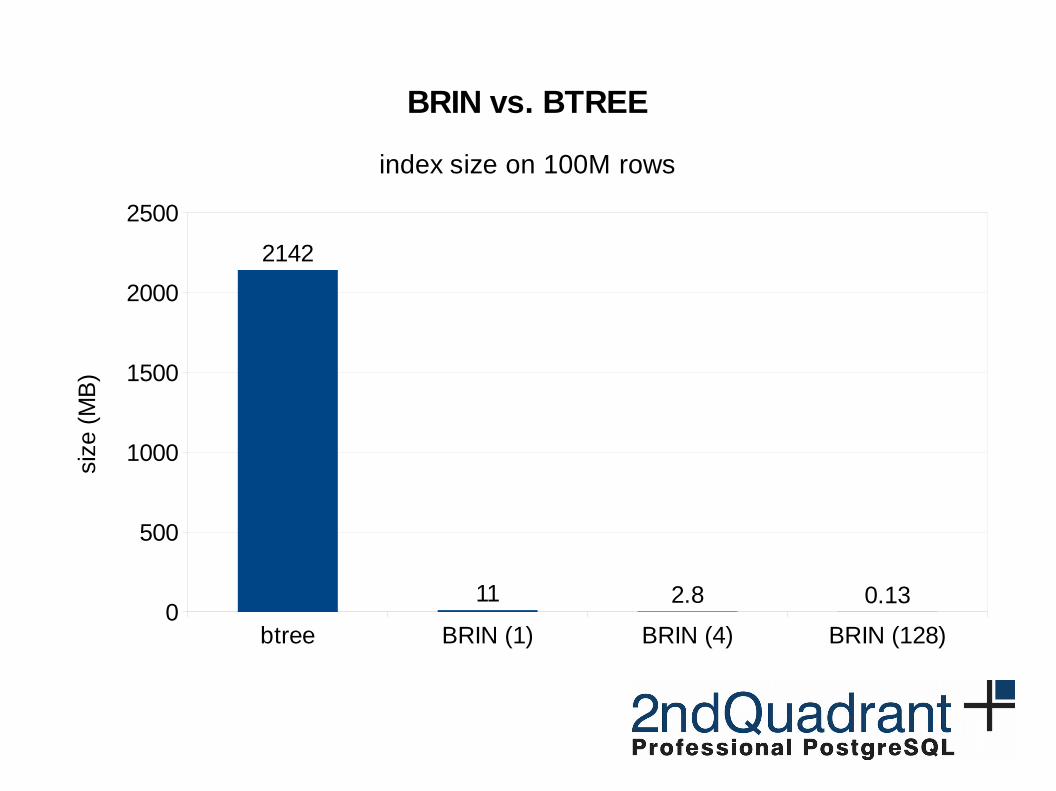
btree BRIN (1) BRIN (4) BRIN (128)0
500
1000
1500
2000
2500
2142
11 2.8 0.13
BRIN vs. BTREE
index size on 100M rows
size
(M
B)

Other Index Improvements
● CREATE INDEX– avoid copying index tuples when building an index (palloc
overhead)
● Index-only scans with GiST– support to range type, inet GiST opclass and btree_gist
● Bitmap Index Scan– in some cases up to 50% spent in tbm_add_tuples
– cache the last accessed page in tbm_add_tuples

Other Improvements
● locking and shared_buffers scalability– reduce overhead, make it more concurrent
– large (multi-socket) systems
– reduce lock strength for some DDL commands
● CRC optimizations (--data-checksums)– use SSE when available, various optimizations
– significantly improved throughput (GB/s)
● planner optimizations– make the planning / execution smarter
● PL/pgSQL improvements
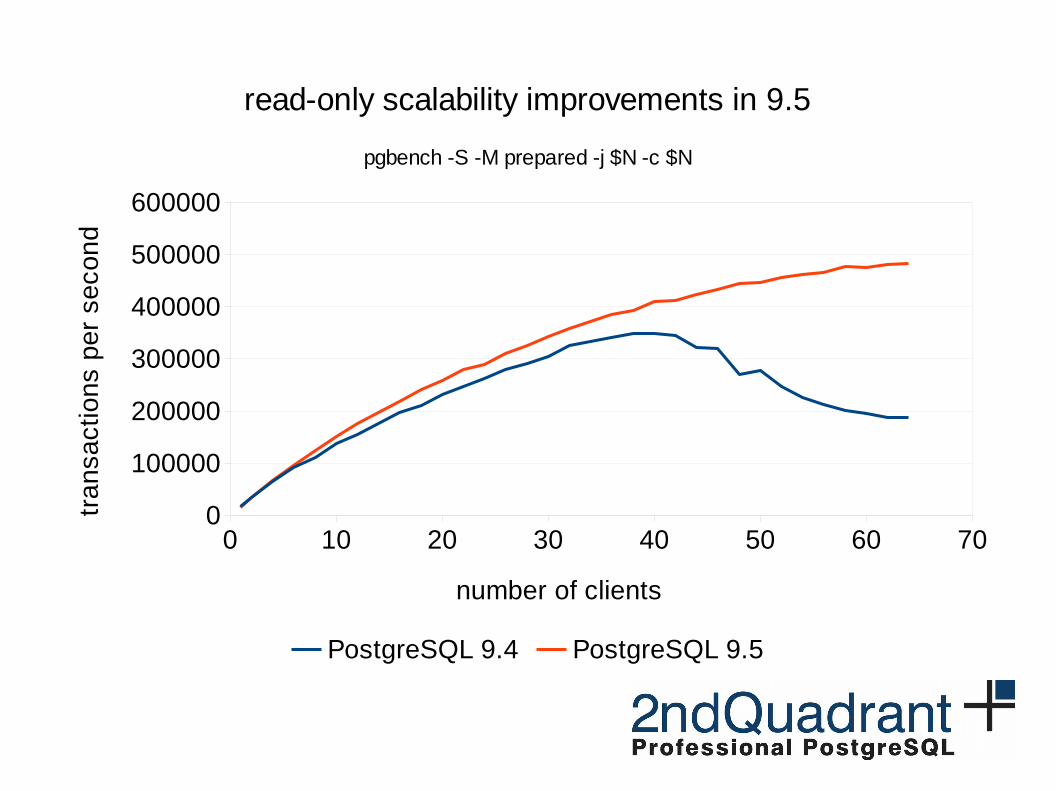
0 10 20 30 40 50 60 700
100000
200000
300000
400000
500000
600000
read-only scalability improvements in 9.5
pgbench -S -M prepared -j $N -c $N
PostgreSQL 9.4 PostgreSQL 9.5
number of clients
tra
nsa
ctio
ns
pe
r se
con
d
PostgreSQL 9.6
Parallel Query
● until now, each query limited to 1 core● 9.6 parallelizes some operations
– sequential scan, aggregation, joins (NL + hash)
– limited to read-only queries
– setup overhead, efficient on large tables
● in the future– utility commands (CREATE INDEX, VACUUM, …)
– additional operations (Sort, …)
– improving supported ones (sharing hashtable in hashjoins)
Parallel Query
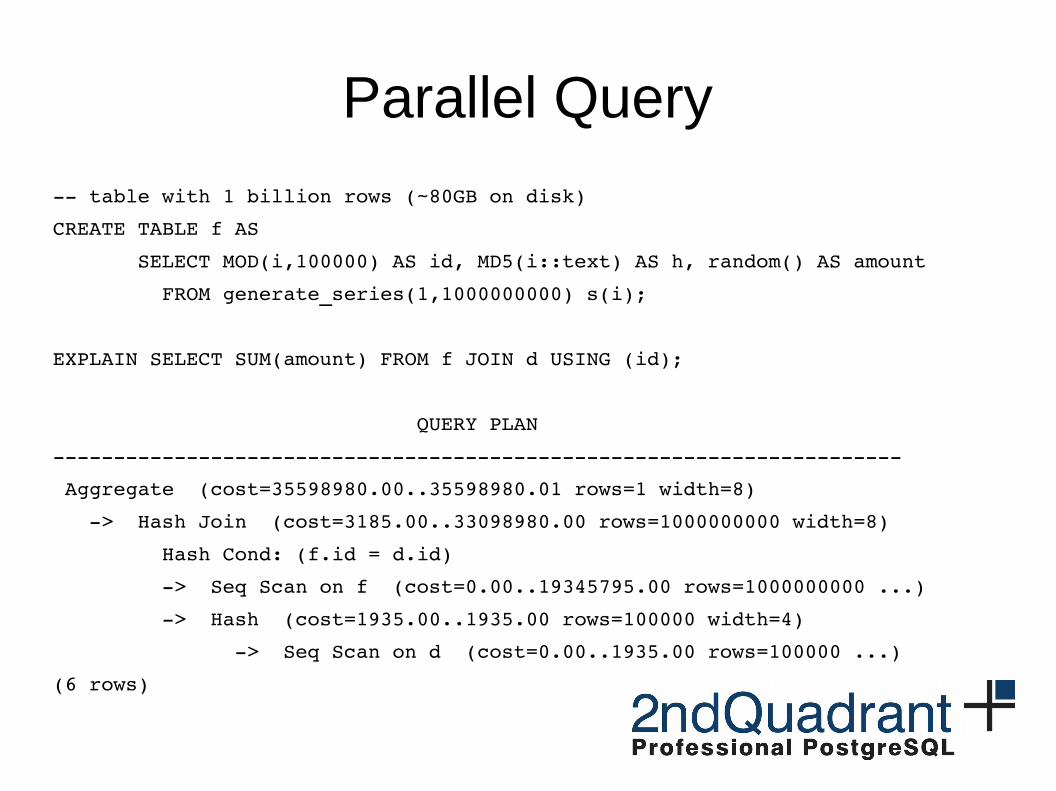
table with 1 billion rows (~80GB on disk)
CREATE TABLE f AS
SELECT MOD(i,100000) AS id, MD5(i::text) AS h, random() AS amount
FROM generate_series(1,1000000000) s(i);
EXPLAIN SELECT SUM(amount) FROM f JOIN d USING (id);
QUERY PLAN
Aggregate (cost=35598980.00..35598980.01 rows=1 width=8)
> Hash Join (cost=3185.00..33098980.00 rows=1000000000 width=8)
Hash Cond: (f.id = d.id)
> Seq Scan on f (cost=0.00..19345795.00 rows=1000000000 ...)
> Hash (cost=1935.00..1935.00 rows=100000 width=4)
> Seq Scan on d (cost=0.00..1935.00 rows=100000 ...)
(6 rows)
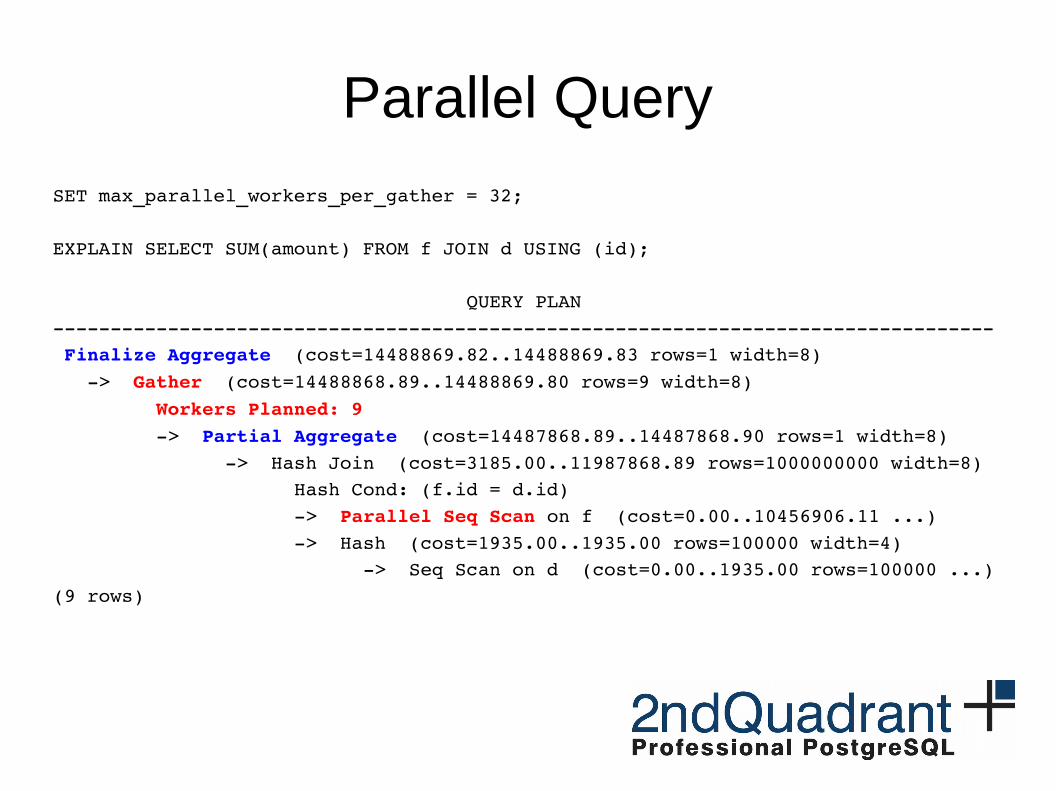
Parallel Query
SET max_parallel_workers_per_gather = 32;
EXPLAIN SELECT SUM(amount) FROM f JOIN d USING (id);
QUERY PLAN Finalize Aggregate (cost=14488869.82..14488869.83 rows=1 width=8) > Gather (cost=14488868.89..14488869.80 rows=9 width=8) Workers Planned: 9 > Partial Aggregate (cost=14487868.89..14487868.90 rows=1 width=8) > Hash Join (cost=3185.00..11987868.89 rows=1000000000 width=8) Hash Cond: (f.id = d.id) > Parallel Seq Scan on f (cost=0.00..10456906.11 ...) > Hash (cost=1935.00..1935.00 rows=100000 width=4) > Seq Scan on d (cost=0.00..1935.00 rows=100000 ...)(9 rows)
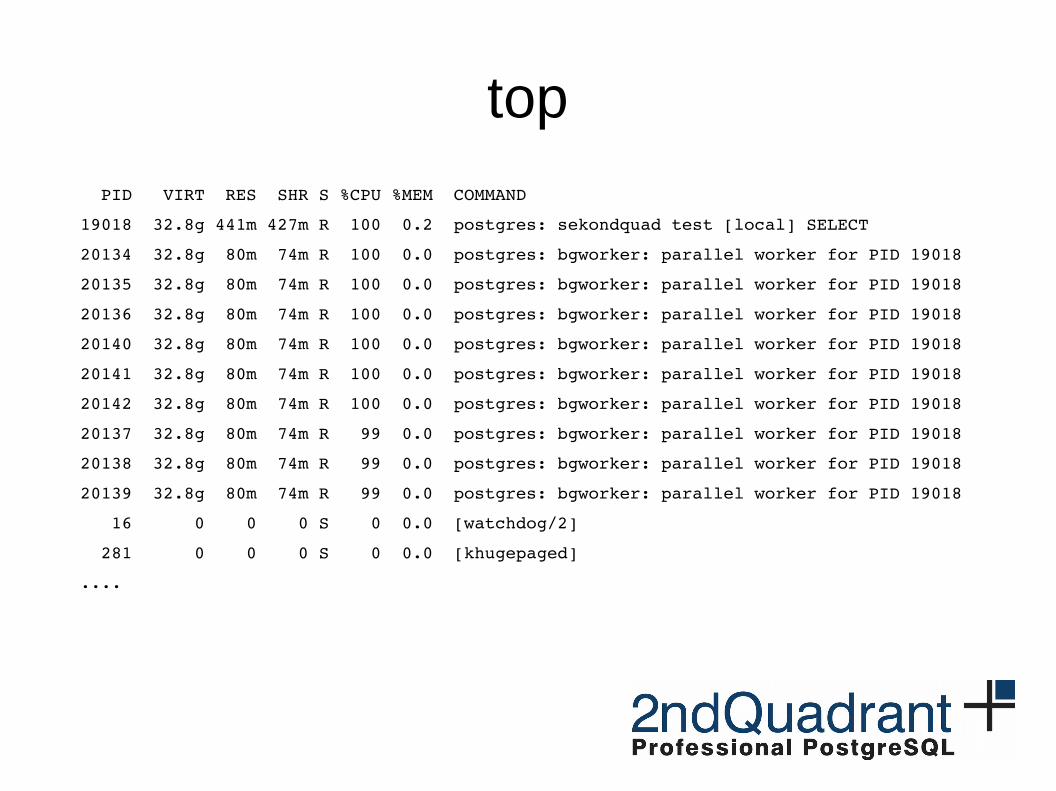
top
PID VIRT RES SHR S %CPU %MEM COMMAND
19018 32.8g 441m 427m R 100 0.2 postgres: sekondquad test [local] SELECT
20134 32.8g 80m 74m R 100 0.0 postgres: bgworker: parallel worker for PID 19018
20135 32.8g 80m 74m R 100 0.0 postgres: bgworker: parallel worker for PID 19018
20136 32.8g 80m 74m R 100 0.0 postgres: bgworker: parallel worker for PID 19018
20140 32.8g 80m 74m R 100 0.0 postgres: bgworker: parallel worker for PID 19018
20141 32.8g 80m 74m R 100 0.0 postgres: bgworker: parallel worker for PID 19018
20142 32.8g 80m 74m R 100 0.0 postgres: bgworker: parallel worker for PID 19018
20137 32.8g 80m 74m R 99 0.0 postgres: bgworker: parallel worker for PID 19018
20138 32.8g 80m 74m R 99 0.0 postgres: bgworker: parallel worker for PID 19018
20139 32.8g 80m 74m R 99 0.0 postgres: bgworker: parallel worker for PID 19018
16 0 0 0 S 0 0.0 [watchdog/2]
281 0 0 0 S 0 0.0 [khugepaged]
....
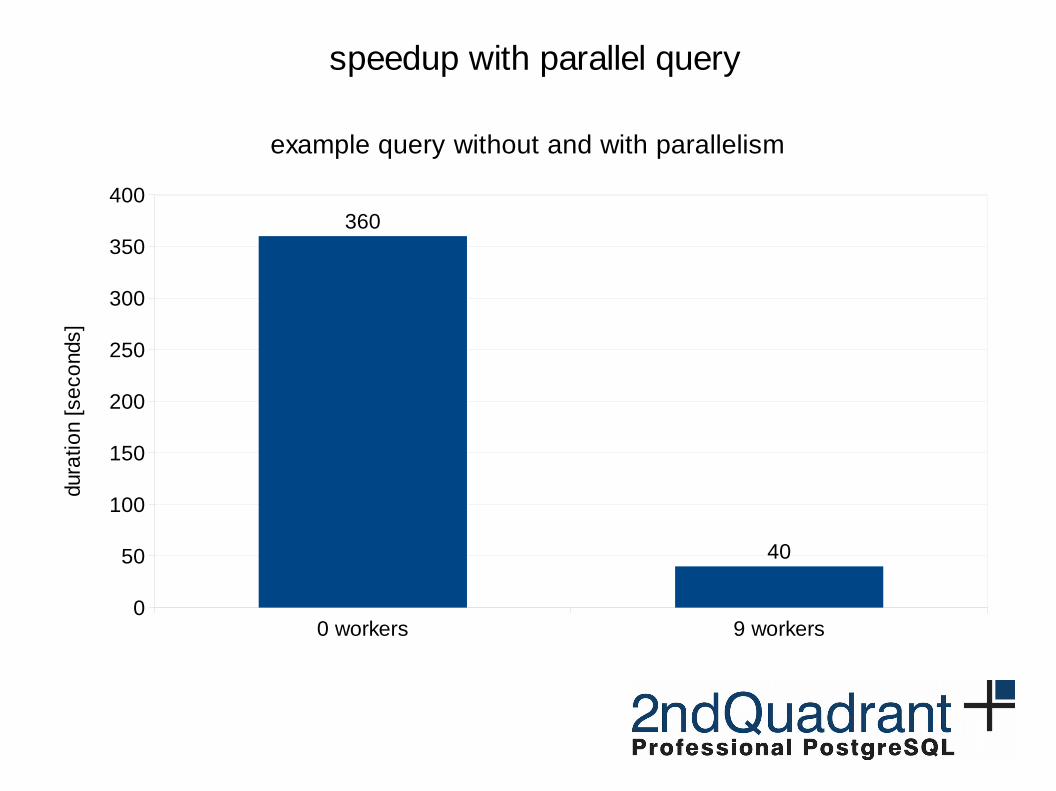
0 workers 9 workers0
50
100
150
200
250
300
350
400360
40
speedup with parallel query
example query without and with parallelism
dura
tion
[sec
ond
s]
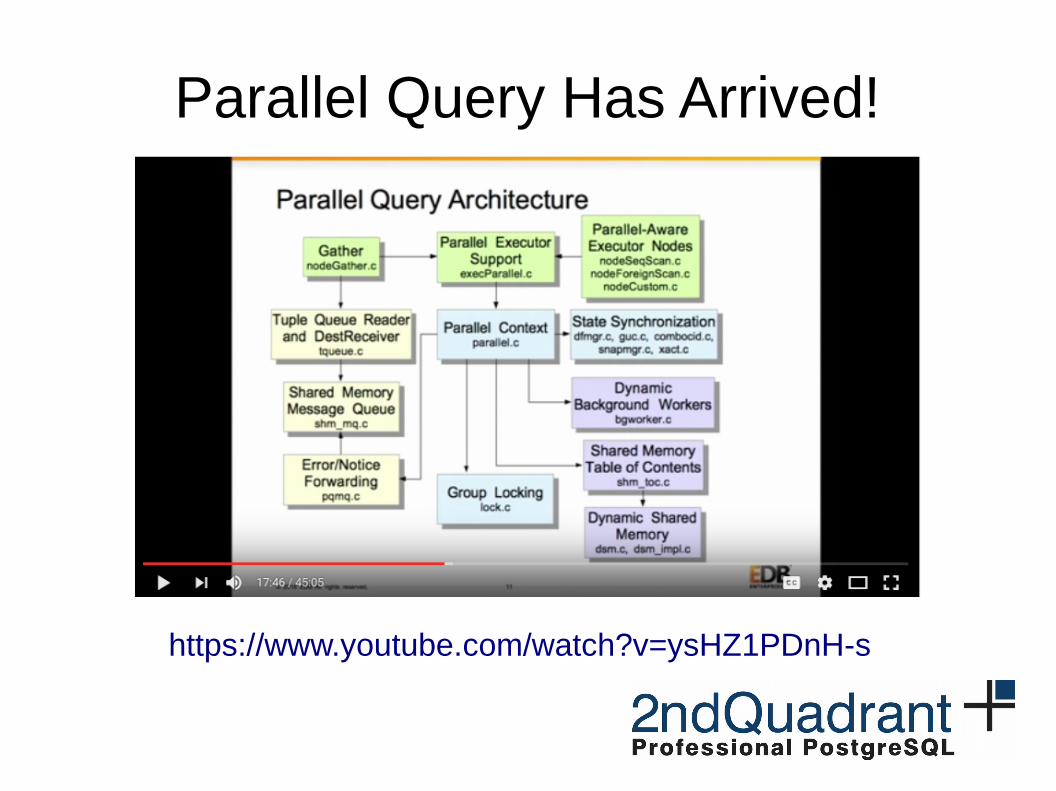
https://www.youtube.com/watch?v=ysHZ1PDnH-s
Parallel Query Has Arrived!

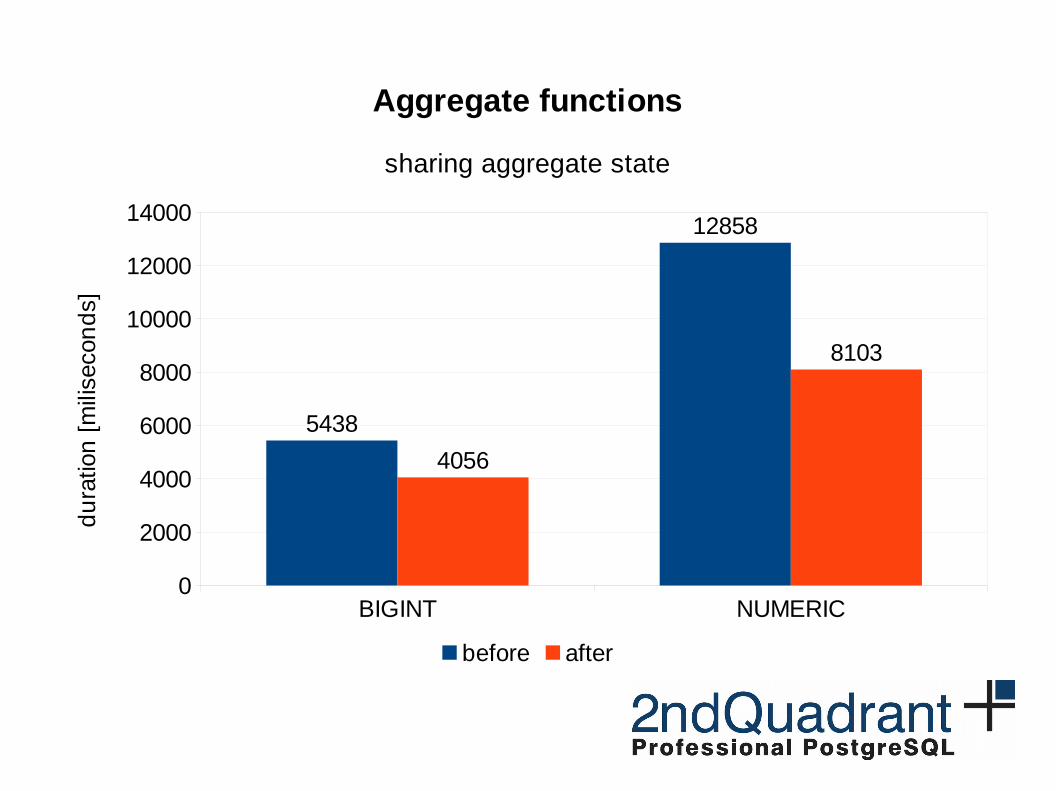
Aggregate functions
● some aggregates use the same state– AVG, SUM, …
– we’re keeping it separate and updating it twice
– but only the final function is actually different
● so …
Share transition state between different
aggregates when possible.
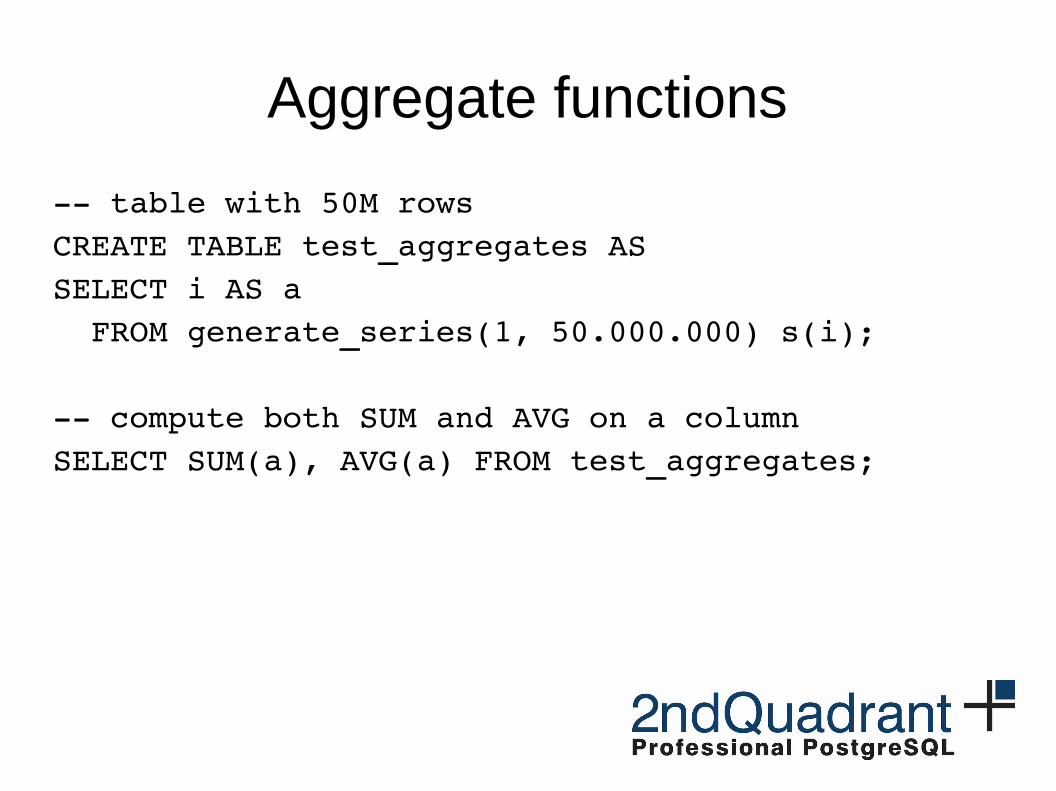
Aggregate functions
table with 50M rowsCREATE TABLE test_aggregates AS SELECT i AS a FROM generate_series(1, 50.000.000) s(i);
compute both SUM and AVG on a columnSELECT SUM(a), AVG(a) FROM test_aggregates;
BIGINT NUMERIC0
2000
4000
6000
8000
10000
12000
14000
5438
12858
4056
8103
Aggregate functions
sharing aggregate state
before after
du
ratio
n [
mili
seco
nd
s]
Checkpoints
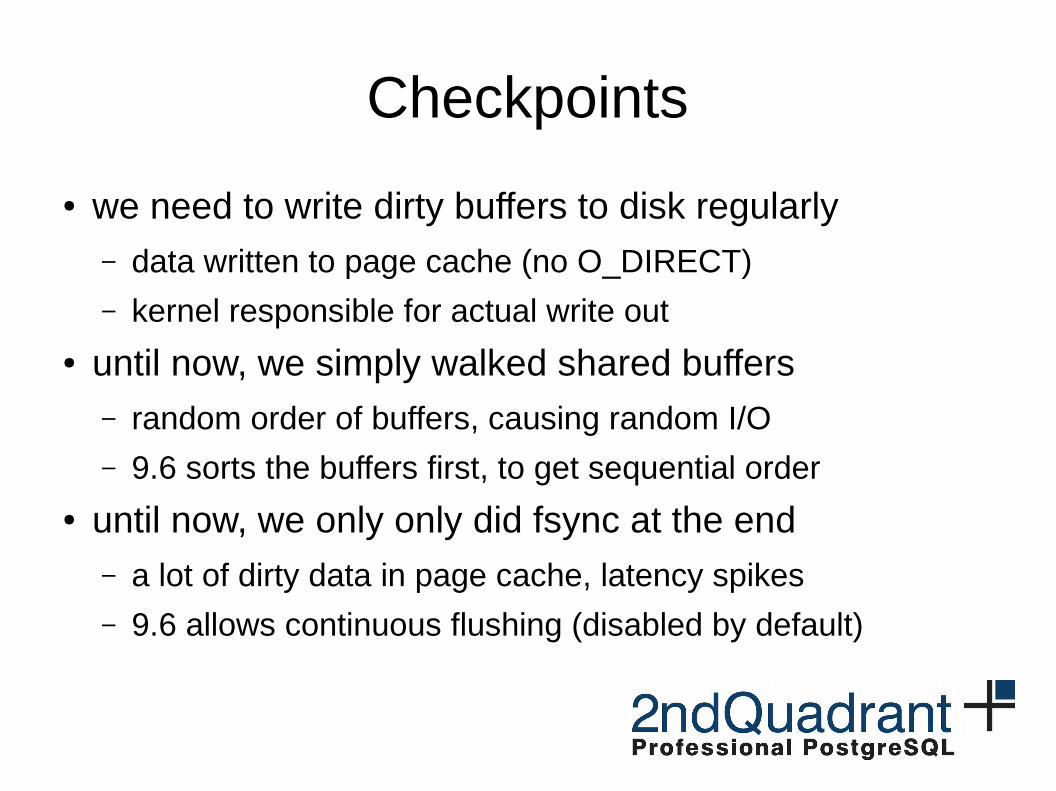
● we need to write dirty buffers to disk regularly– data written to page cache (no O_DIRECT)
– kernel responsible for actual write out
● until now, we simply walked shared buffers– random order of buffers, causing random I/O
– 9.6 sorts the buffers first, to get sequential order
● until now, we only only did fsync at the end– a lot of dirty data in page cache, latency spikes
– 9.6 allows continuous flushing (disabled by default)

Improving Postgres' Buffer Manager
Andres FreundPostgreSQL Developer & Committer
Citus Data – citusdata.com - @citusdata
http://anarazel.de/talks/fosdem-2016-01-31/io.pdf

0
200
400
600
800
1000
1200
1400
1600
1800
2000
0
200
400
600
800
1000
1200
1400
1600
1800
2000
pgbench -M prepared -c 32 -j 32
shared_buffers = 16GB, max_wal_size = 100GB
TPS
Latency
seconds
TP
S
Late
ncy
(m
s)

0
200
400
600
800
1000
1200
1400
1600
1800
2000
0
200
400
600
800
1000
1200
pgbench -M prepared -c 32 -j 32
shared_buffers = 16GB, max_wal_size = 100GB, target = 0.9; OS tuning (no dirty)
TPS
Latency
seconds
TP
S
Late
ncy
(ms)
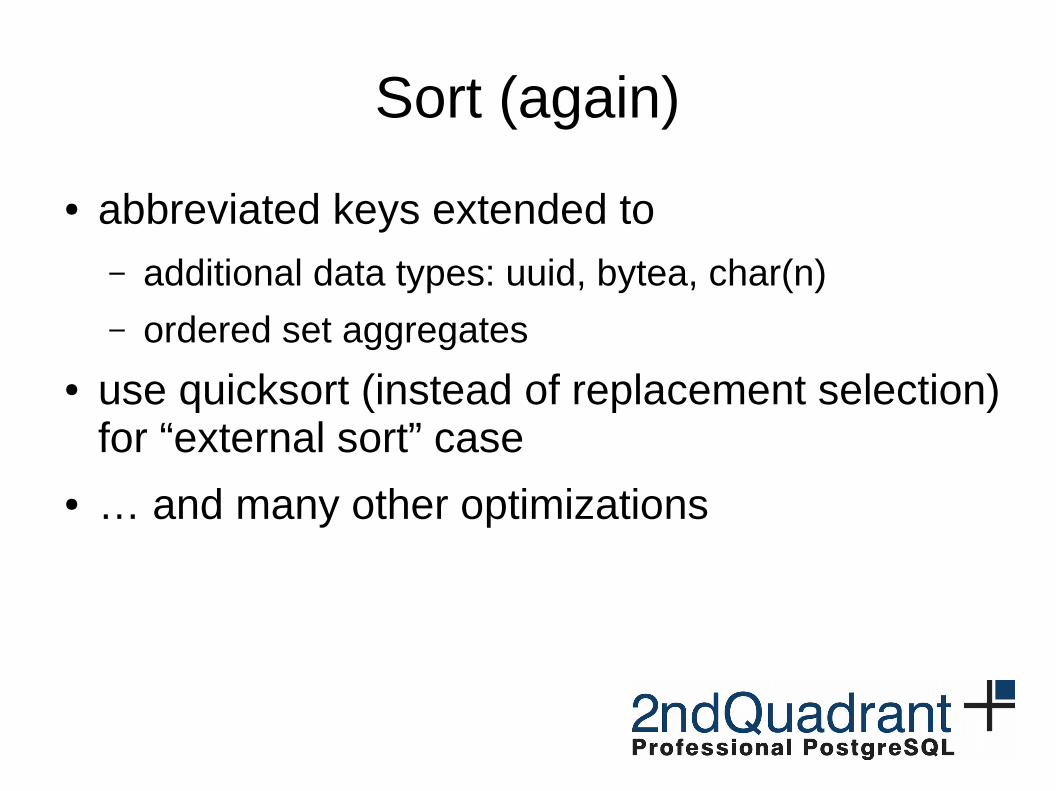
Sort (again)
● abbreviated keys extended to– additional data types: uuid, bytea, char(n)
– ordered set aggregates
● use quicksort (instead of replacement selection) for “external sort” case
● … and many other optimizations

8MB 32MB 128MB 512MB 1GB0
1000
2000
3000
4000
5000
6000
Sort performance in 9.5 / 9.6
PostgreSQL 9.5 PostgreSQL 9.6
work_mem
dura
tion
(se
cond
s)
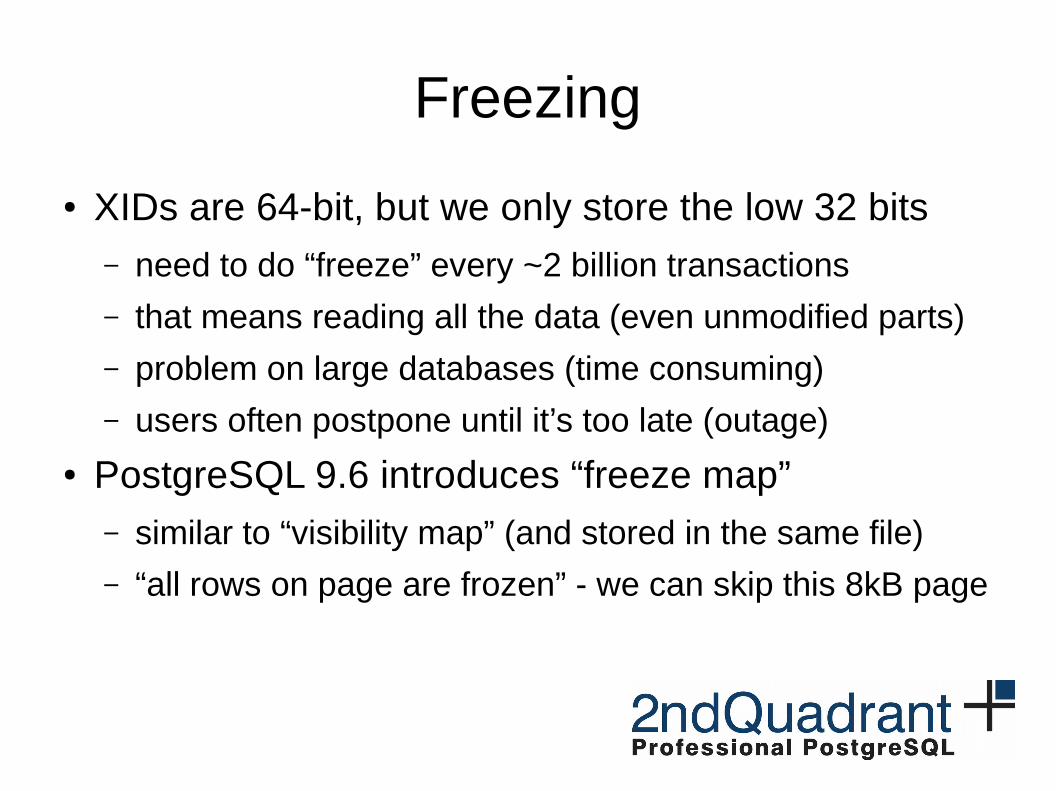
Freezing
● XIDs are 64-bit, but we only store the low 32 bits– need to do “freeze” every ~2 billion transactions
– that means reading all the data (even unmodified parts)
– problem on large databases (time consuming)
– users often postpone until it’s too late (outage)
● PostgreSQL 9.6 introduces “freeze map”– similar to “visibility map” (and stored in the same file)
– “all rows on page are frozen” - we can skip this 8kB page
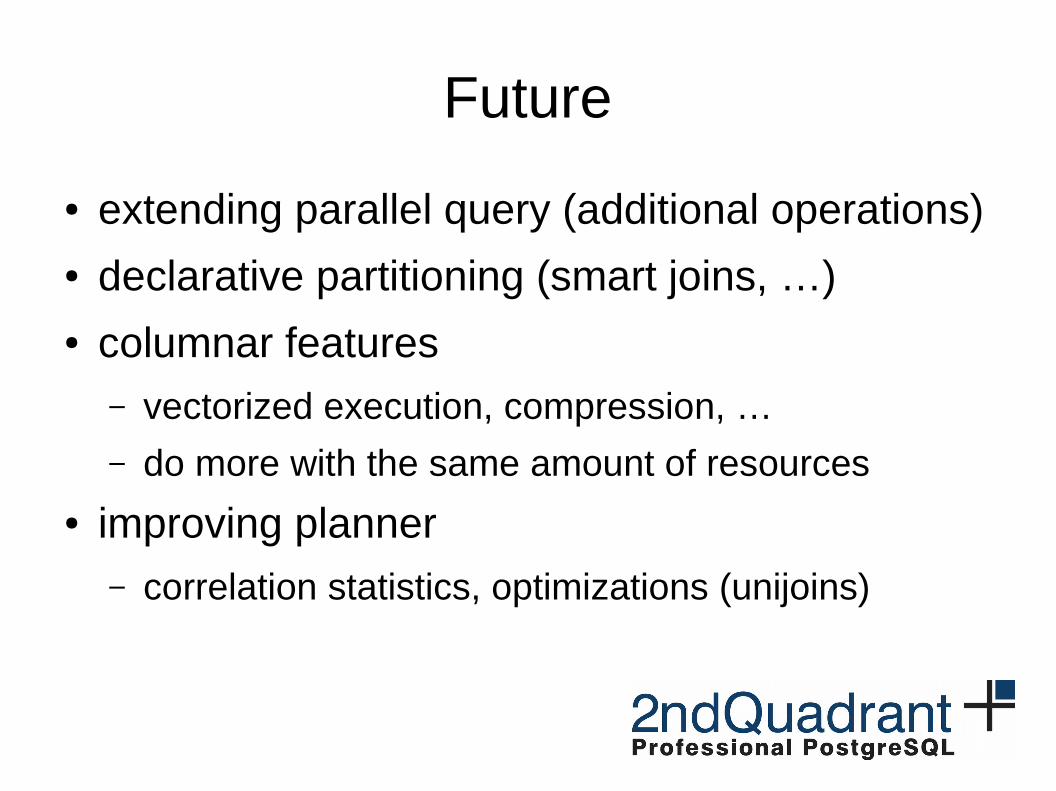
Future
● extending parallel query (additional operations)● declarative partitioning (smart joins, …)● columnar features
– vectorized execution, compression, …
– do more with the same amount of resources
● improving planner– correlation statistics, optimizations (unijoins)

Questions?


