1 1 Potential for CCS in India: Potential for CCS in India: Opportunities and Barriers Opportunities and Barriers Pradeep Pradeep Kumar Kumar Dadhich Dadhich Senior Fellow, TERI, New Delhi, India Senior Fellow, TERI, New Delhi, India Presented United Nations Department of Economic and Social Presented United Nations Department of Economic and Social Affairs : Affairs : “ “ Expert Group Meeting on Carbon Dioxide Capture and Expert Group Meeting on Carbon Dioxide Capture and Storage and Sustainable Development Storage and Sustainable Development ” ” Venue: Two U.N. Plaza, DC2 Venue: Two U.N. Plaza, DC2 - - 2220, New York, NY 10017 2220, New York, NY 10017
Transcript
11
Potential for CCS in India: Potential for CCS in India: Opportunities and BarriersOpportunities and Barriers
PradeepPradeep Kumar Kumar DadhichDadhichSenior Fellow, TERI, New Delhi, IndiaSenior Fellow, TERI, New Delhi, India
Presented United Nations Department of Economic and Social Presented United Nations Department of Economic and Social Affairs : Affairs : ““Expert Group Meeting on Carbon Dioxide Capture and Expert Group Meeting on Carbon Dioxide Capture and
Storage and Sustainable DevelopmentStorage and Sustainable Development””Venue: Two U.N. Plaza, DC2Venue: Two U.N. Plaza, DC2--2220, New York, NY 100172220, New York, NY 10017
22
OutlineOutlineOverview of IndiaOverview of India’’s Energy Sectors Energy SectorGHG mitigation potential GHG mitigation potential –– Scenario Scenario AnalysisAnalysisCost implicationsCost implicationsCCS potentialCCS potentialBarriers to CCS Barriers to CCS ConclusionsConclusions
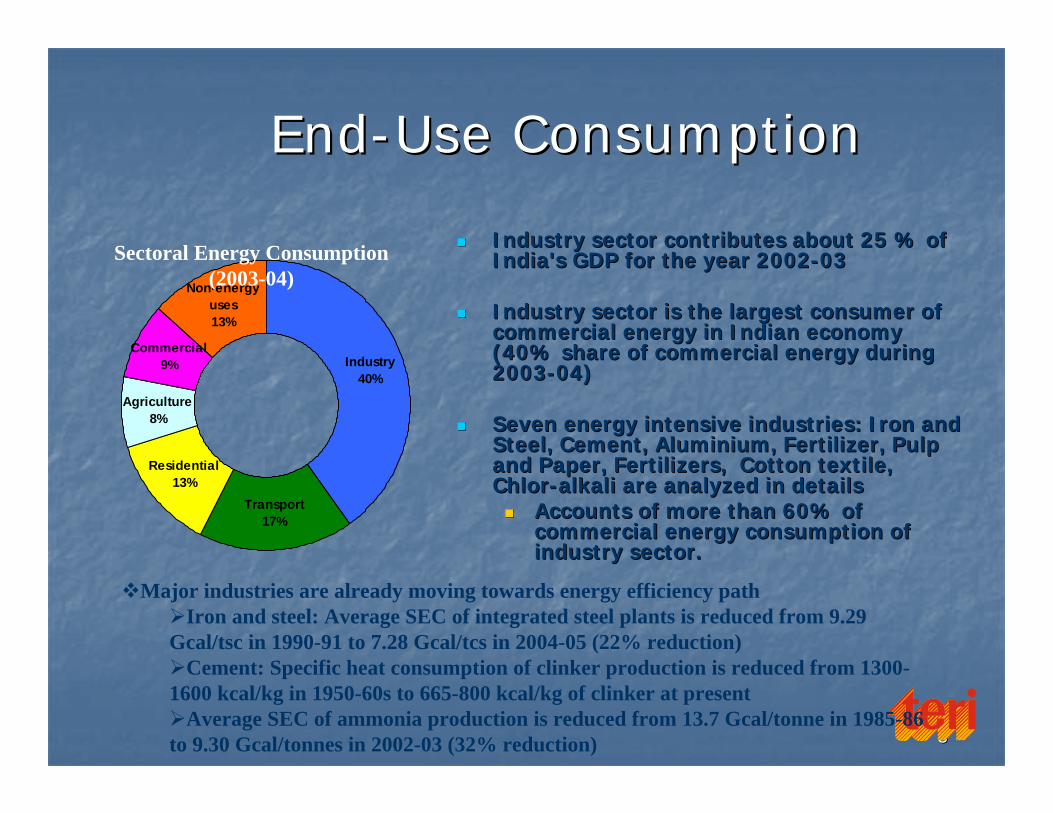
Industry sector contributes about 25 % of Industry sector contributes about 25 % of India's GDP for the year 2002India's GDP for the year 2002--0303
Industry sector is the largest consumer of Industry sector is the largest consumer of commercial energy in Indian economy commercial energy in Indian economy (40% share of commercial energy during (40% share of commercial energy during 20032003--04)04)
Seven energy intensive industries: Iron and Seven energy intensive industries: Iron and Steel, Cement, Aluminium, Fertilizer, Pulp Steel, Cement, Aluminium, Fertilizer, Pulp and Paper, Fertilizers, Cotton textile, and Paper, Fertilizers, Cotton textile, ChlorChlor--alkali are analyzed in detailsalkali are analyzed in details
Accounts of more than 60% of Accounts of more than 60% of commercial energy consumption of commercial energy consumption of industry sector.industry sector.
Industry40%
Transport17%
Residential13%
Agriculture8%
Commercial9%
Non-energy uses13%
Major industries are already moving towards energy efficiency pathIron and steel: Average SEC of integrated steel plants is reduced from 9.29
Gcal/tsc in 1990-91 to 7.28 Gcal/tcs in 2004-05 (22% reduction)Cement: Specific heat consumption of clinker production is reduced from 1300-
1600 kcal/kg in 1950-60s to 665-800 kcal/kg of clinker at presentAverage SEC of ammonia production is reduced from 13.7 Gcal/tonne in 1985-86
to 9.30 Gcal/tonnes in 2002-03 (32% reduction)
Sectoral Energy Consumption (2003-04)
66
Total Primary Commercial Energy Total Primary Commercial Energy RequirementRequirement
Energy use in BAU
0
500
1000
1500
2000
2500
2001 2006 2011 2016 2021 2026 2031
Year
(mto
e)
Solar +w ind
Nuclear
Hydro (large +small)Natural Gas
Oil
Coal
Total primary commercial energy increases 7.5 times 2001 to 2031(285 mtoe to 2123 mtoe) (CAGR: 6.9%)
Share of traditional fuels to total primary energy consumption decreases by 35% to 4% (in year 2001 to 2031)
Coal and Oil remains the dominant fuels
Share of Coal: 55% in 2031
Share of Oil: 36% in 2031
Share of hydro in total commercial supply is only 2% in 2031
77
Energy Security: High Import Energy Security: High Import DependencyDependency
75 222660
1688
285527
1046
2123
27%
42%
63%
80%
0
500
1000
1500
2000
2500
2001 2011 2021 2031
Year
mto
e
20%
30%
40%
50%
60%
70%
80%
90%
Import Consumption Import Dependency
Fuel Import in 2031Coal import: 1438 MT
~4 times of consumption in 2001
Import dependency: 78%
Oil import: 680 MTImport dependency: 93%
Gas import: 93 BCMImport dependency: 67%
Time trend of Import dependency
Maximum indigenous production levels for all fuels is achieved by the year 2016
88
Sectoral Commercial Energy Sectoral Commercial Energy ConsumptionConsumption
Sectorw ise Commercial Energy Consumption in BAU
0
300
600
900
1200
1500
1800
2001 2006 2011 2016 2021 2026 2031
Year
(mto
e)
Industry Transport Residential Agriculture Commercial
Commercial energy consumption from the end-use side increases 7.5 times (in 2001-2031) (CAGR: 7%)
Share of residential sector in total final energy (including non-commercial energy) consumption decreases due to shift towards more efficient commercial fuels
The highest growth rate in oil consumption in the transport sector increases by 13.6 times (CAGR: 9%)
Shift towards more energy intensive modes of transportations both for passenger and freight movement
Trends of Sectoral Shares in Final Energy Consumption (including non-commercial)
40% 44% 49% 53% 56% 58% 60%
9%14%
18%21%
23% 24% 25%45%37%
27%20% 16% 13% 11%
0%
10%
20%
30%
40%
50%
60%
70%
80%
90%
100%
2001 2006 2011 2016 2021 2026 2031
Year
( %)
Industry Transport Residential Agriculture Commercial
Pow er Industry (Process heating ) Ore-reduction Industry (Captive)
Maximum share of power sector in coal consumption across all scenarios followed by the industrial sector for process heating and captive power generation
Coking coal consumption is the highest in the hybrid scenario due to increased iron making through the blast furnace route
Power sector exhibits highest reduction potential, followed by process heating in industry
Difference in coal consumption in the power sector in 2031
Hybrid vis-à-vis BAU: 367 mtoe (55% reduction)
High growth hybrid vis-à-vis high growth scenario: 568 mtoe (49% reduction)
1515
Energy IntensityEnergy Intensity
0.010
0.012
0.014
0.016
0.018
0.020
0.022
0.024
2001 2006 2011 2016 2021 2026 2031 2036Year
(kgo
e/R
s of
GD
P)
LG BAU REN NUC
EFF HYB HG HHYB
BAU: Decline in energy-intensity from 0.022 kgoe/Rs. of GDP in 2001 to 0.017 kgoe/Rs. of GDP by 2031
Decrease of 23%
Even in BAU scenario Indian economy is progressing along an energy-efficient path
Hybrid scenario : Decline in energy-intensity to 0.012 kgoe/Rs. of GDP in 2031 (extent of 29% vis-à-vis BAU in 2031)
High-growth hybrid scenario: Decline in energy-intensity to 0.011 kgoe/Rs. of GDP by 2031 (50% reduction from 2001)
Progression of economy along a declining energy-intensity path if energy-efficiency measures are pursued aggressively even with a high optimistic growth rate of 10% GDP
1616
Analysis of COAnalysis of CO22 EmissionsEmissions
1717
Cumulative COCumulative CO22 EmissionsEmissions
Cumulative CO2 emissions lower to the extent of 25% and 29% in the high efficiency and hybrid scenarios respectively vis-à-vis the BAU scenario
Cumulative CO2 emissions higher by only 8% in the high-growth hybrid scenario vis-a-vis BAU scenario
Cumulative CO2 Emissions Across Various Scenarios (2001-2036)
12.2
16.2 15.8 15.7
12.1 11.5
25.0
17.5
0
5
10
15
20
25
30
LG BAU REN NUC EFF HYB HG HHYB
Scenario
billio
n to
nnes
1818
CO2 Emissions by Fuels (BAU) CO2 Emissions by Fuels (BAU)
60% 57% 54% 55% 54% 59% 64% 67%
34% 37% 38% 38% 37% 34% 32% 30%
6% 7% 7% 7% 9% 6% 4% 3%
0%
20%
40%
60%
80%
100%
2001 2006 2011 2016 2021 2026 2031 2036
Year
Per
cent
age
Gas
Oil
Coal
1919
CO2 Emissions by SectorsCO2 Emissions by Sectors
42% 39% 36% 36% 34% 38% 40%
38% 37% 39% 39% 41% 39% 39%
11% 16% 19% 20% 21% 20% 19%
0%
20%
40%
60%
80%
100%
2001 2006 2011 2016 2021 2026 2031
Year
Perc
enta
ge
Power Industry TransportResidential Agriculture Commercial
2020
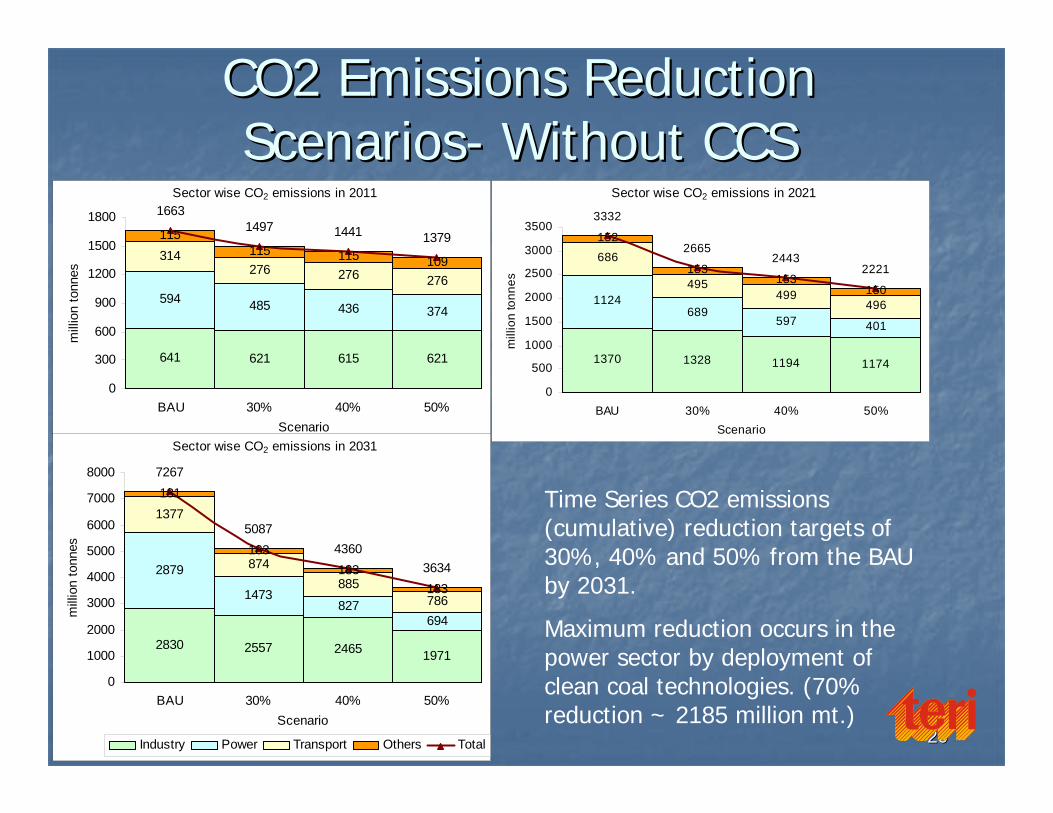
CO2 Emissions Reduction CO2 Emissions Reduction ScenariosScenarios-- Without CCSWithout CCS
Sector wise CO2 emissions in 2011
641 621 615 621
594 485 436 374
314276 276 276
115115 115 109
16631497 1441 1379
0
300
600
900
1200
1500
1800
BAU 30% 40% 50%Scenario
mill
ion
tonn
es
Sector wise CO2 emissions in 2021
1370 1328 1194 1174
1124689
597 401
686
495499
496
152
153153
150
3332
26652443
2221
0
500
1000
1500
2000
2500
3000
3500
BAU 30% 40% 50%Scenario
mill
ion
tonn
es
Sector wise CO2 emissions in 2031
2830 2557 2465 1971
2879
1473827
694
1377
874885
786
181
183183
183
7267
50874360
3634
0
1000
2000
3000
4000
5000
6000
7000
8000
BAU 30% 40% 50%Scenario
mill
ion
tonn
es
Industry Power Transport Others Total
Time Series CO2 emissions (cumulative) reduction targets of 30%, 40% and 50% from the BAU by 2031.
Maximum reduction occurs in the power sector by deployment of clean coal technologies. (70% reduction ~ 2185 million mt.)
2121
Uptake of Power Generating Technologies Uptake of Power Generating Technologies at Various CO2 mitigation scenarios:at Various CO2 mitigation scenarios:
Without CCSWithout CCSPower Generating Technologies in 2011
8054 50 51
3
8 3 0
2326 34
20
00 0
0
6969 69
69
48 8
8
77 7
7
0
40
80
120
160
200
BAU 30% 40% 50%Scenario
GW
Power Generating Technologies in 2021
11255 42 27
5
13 90
114
3830
16
0
49 7396
116
116 116 118
4
11 12 12
21
40 40 40
0
50
100
150
200
250
300
350
400
BAU 30% 40% 50%Scenario
GW
Power Generating Technologies in 2031
327
55 43 28
10
146
22 5
157
86
229
0
49
237 298
158
158 160 160
4
15 15 17
21
70 70 70
0
150
300
450
600
750
BAU 30% 40% 50%
Scenario
GW
Conventional coal Clean coal Gas based H-frame Gas based
Hydro Renewables Nuclear
Power sector presents the greatest opportunity to implement CCS. With the increase of clean coal technology uptake from 10 GW in the BAU Scenario to 146 GW in the 30% reduction scenario.
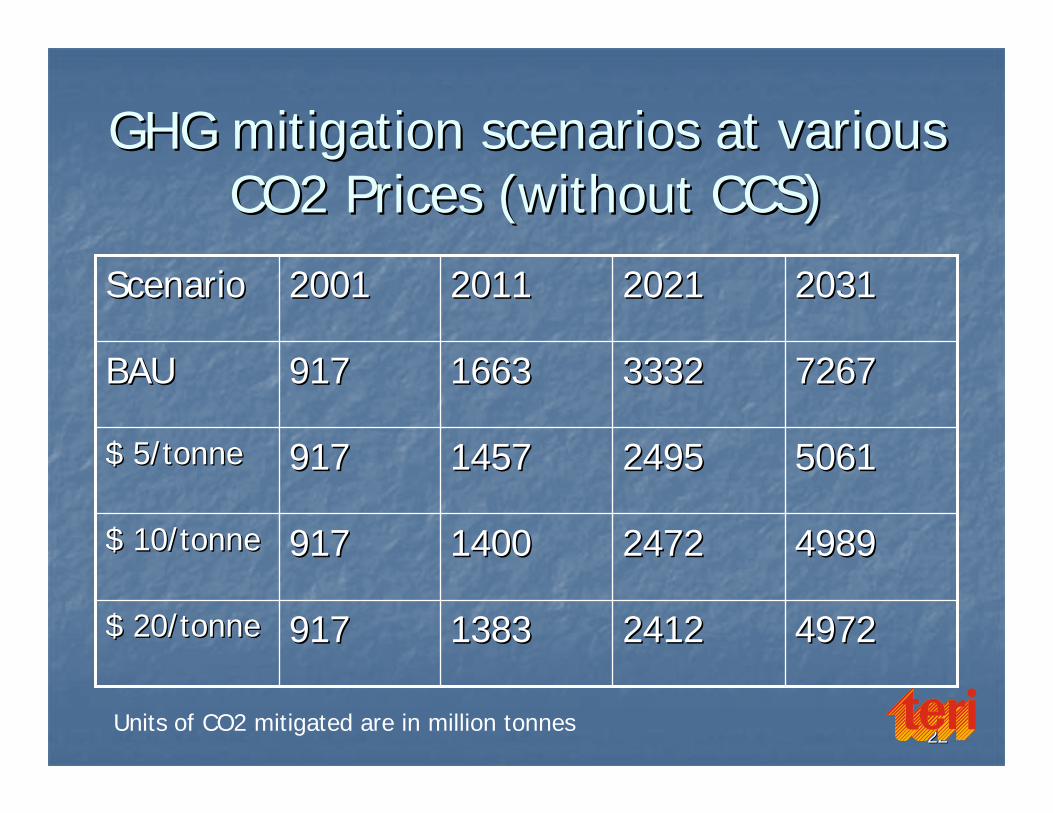
2222
GHG mitigation scenarios at various GHG mitigation scenarios at various CO2 Prices (without CCS)CO2 Prices (without CCS)
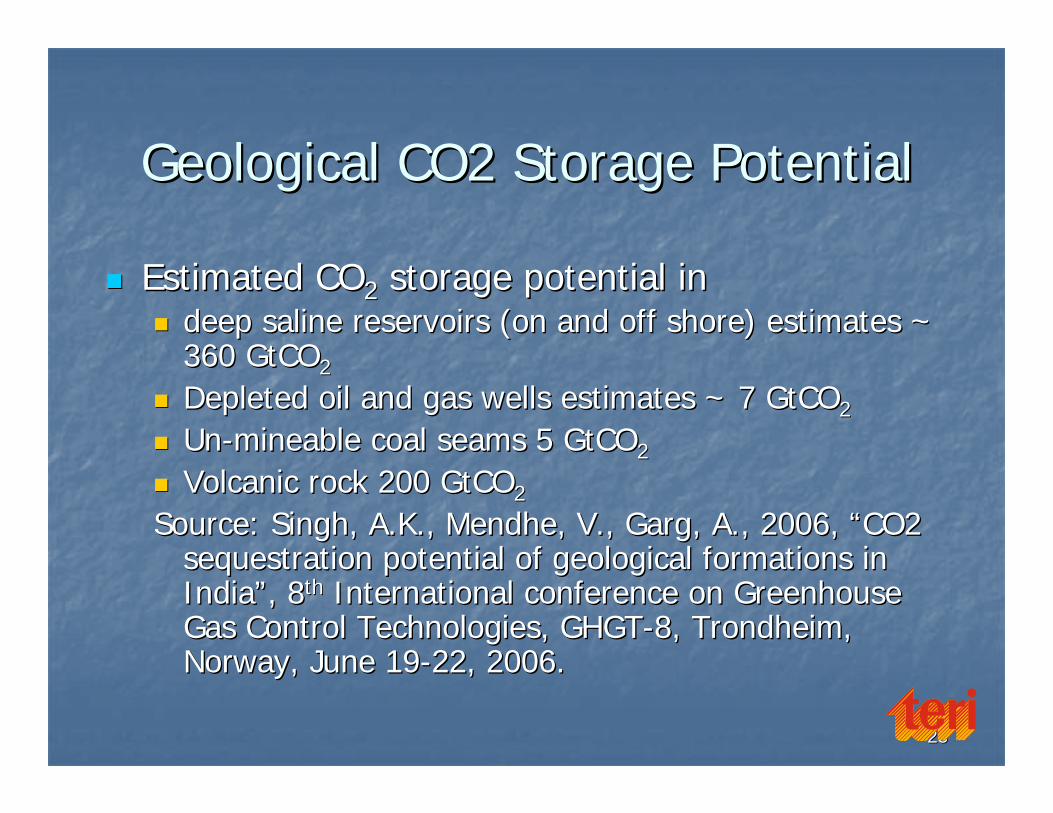
Geological CO2 Storage PotentialGeological CO2 Storage Potential
Estimated COEstimated CO22 storage potential in storage potential in deep saline reservoirs (on and off shore) estimates ~ deep saline reservoirs (on and off shore) estimates ~ 360 GtCO360 GtCO22
Depleted oil and gas wells estimates ~ 7 GtCODepleted oil and gas wells estimates ~ 7 GtCO2 2
Source: Singh, A.K., Source: Singh, A.K., MendheMendhe, V., , V., GargGarg, A., 2006, , A., 2006, ““CO2 CO2 sequestration potential of geological formations in sequestration potential of geological formations in IndiaIndia””, 8, 8thth International conference on Greenhouse International conference on Greenhouse Gas Control Technologies, GHGTGas Control Technologies, GHGT--8, 8, TrondheimTrondheim, , Norway, June 19Norway, June 19--22, 2006. 22, 2006.
2424
Current CCS Activities in India Current CCS Activities in India
India is a member of CSLF & IEA GHG R&D India is a member of CSLF & IEA GHG R&D ProgrammeProgrammeIt is participating in the Future Gen It is participating in the Future Gen ProgrammeProgrammeThe Government of India has plans to invest in CCS The Government of India has plans to invest in CCS related activities in the XI & XII Five Plan (report of the related activities in the XI & XII Five Plan (report of the working group on R&D for the energy sector)working group on R&D for the energy sector)Institute of Reservoir Studies is carrying out CO2 Institute of Reservoir Studies is carrying out CO2 capture and EOR field studies in Gujaratcapture and EOR field studies in GujaratNGRI is testing the feasibility of storing CO2 in basalt NGRI is testing the feasibility of storing CO2 in basalt formationsformations
2525
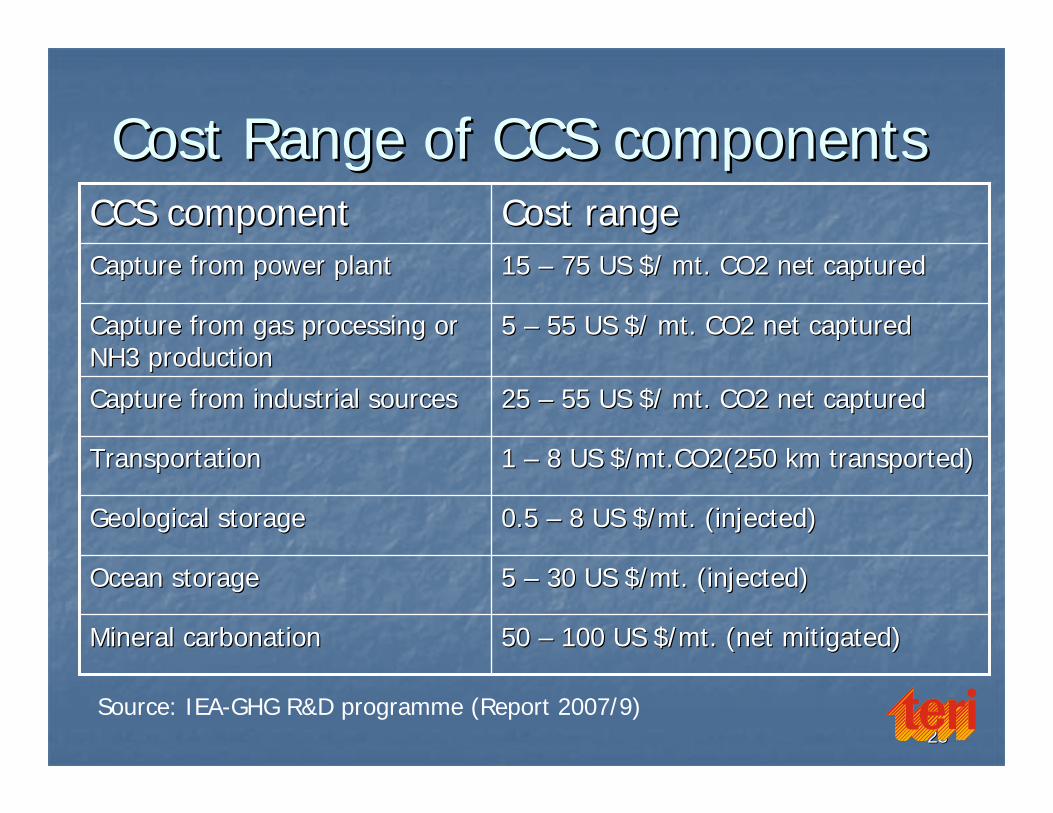
Cost Range of CCS componentsCost Range of CCS components
50 50 –– 100 US $/100 US $/mtmt. (net mitigated). (net mitigated)Mineral carbonationMineral carbonation
5 5 –– 30 US $/30 US $/mtmt. (injected). (injected)Ocean storage Ocean storage
0.5 0.5 –– 8 US $/8 US $/mtmt. (injected) . (injected) Geological storage Geological storage
1 1 –– 8 US $/mt.CO2(250 km transported)8 US $/mt.CO2(250 km transported)TransportationTransportation
25 25 –– 55 US $/ 55 US $/ mtmt. CO2 net captured. CO2 net capturedCapture from industrial sourcesCapture from industrial sources
5 5 –– 55 US $/ 55 US $/ mtmt. CO2 net captured. CO2 net capturedCapture from gas processing or Capture from gas processing or NH3 productionNH3 production
15 15 –– 75 US $/ 75 US $/ mtmt. CO2 net captured. CO2 net capturedCapture from power plantCapture from power plant
Cost rangeCost rangeCCS componentCCS component
Source: IEA-GHG R&D programme (Report 2007/9)
2626
Barriers to Adoption of CCSBarriers to Adoption of CCS
Financial Barriers:Financial Barriers:High capital costs High capital costs
(30 to 40% increase)(30 to 40% increase)Higher Energy penaltyHigher Energy penalty
Does not fit in the overall Does not fit in the overall goal of meeting the goal of meeting the millennium development millennium development goalsgoalsNonNon--productive productive expenditureexpenditure
Does not contribute to Does not contribute to sustainable developmentsustainable development
Technical Barriers:Technical Barriers:Yet to be commercially Yet to be commercially demonstrated in large point demonstrated in large point sources of CO2sources of CO2Capture technologies are not Capture technologies are not standard for all large point standard for all large point sources (ex: power plant & sources (ex: power plant & cement plant)cement plant)Sinks and their capacities to yet Sinks and their capacities to yet be identifiedbe identifiedMany parts of India are Many parts of India are seismically active seismically active –– issue of issue of permanenancepermanenanceEOR/ECBM/EGR potential yet to EOR/ECBM/EGR potential yet to be established in Indiabe established in IndiaPotential & cost for Potential & cost for sequestering in depleted oil & sequestering in depleted oil & gas wells yet to be determined gas wells yet to be determined (off(off--shore and onshore and on--shore)shore)Mapping and matching of sinks Mapping and matching of sinks and sources for optimization of and sources for optimization of cost to be donecost to be done
2727
Other BarriersOther BarriersStorage ( leakage Storage ( leakage –– safety; leakagesafety; leakage--carbon carbon accounting)accounting)Acceptance Acceptance –– general public is unaware of CCSgeneral public is unaware of CCSRegulatory: no international standards as yetRegulatory: no international standards as yet
EC established national standards to allow CCS for EC established national standards to allow CCS for European TradingEuropean Trading
Financial: Lack of business architecture; Financial: Lack of business architecture; Storage business does not existStorage business does not exist
2828
ConclusionsConclusions
Climate change is a global problemClimate change is a global problemIndia needs international cooperationIndia needs international cooperation
Establishment of CCS technologies require major Establishment of CCS technologies require major investments in a country like India, which investments in a country like India, which cannot be handled even by OECD countriescannot be handled even by OECD countriesCCS options will vary from region to region and CCS options will vary from region to region and country to countrycountry to country
Entire value chain needs vigorous analysisEntire value chain needs vigorous analysisInternational cooperation in CCS is a must for International cooperation in CCS is a must for successful deployment of this technology. successful deployment of this technology.