18
Niagara Prosperity Initiative Searching for, Creating and Using Data Information Session May 1, 2015
| Date post: | 21-Aug-2015 |
| Category: |
Documents |
| Upload: | go-open-data-good |
| View: | 25 times |
| Download: | 1 times |
Niagara Prosperity InitiativeSearching for, Creating and
Using DataInformation Session
May 1, 2015

What’s happening?
Putting the Pieces Together
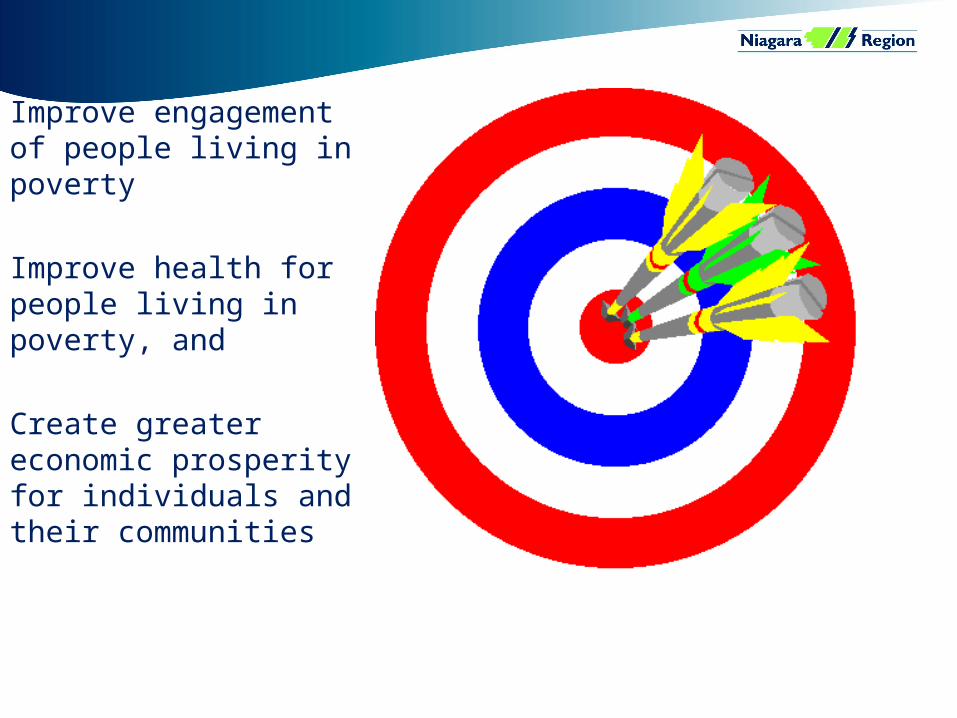
Improve engagement of people living in poverty
Improve health for people living in poverty, and
Create greater economic prosperity for individuals and their communities

What is Poverty?

Who is living in poverty?
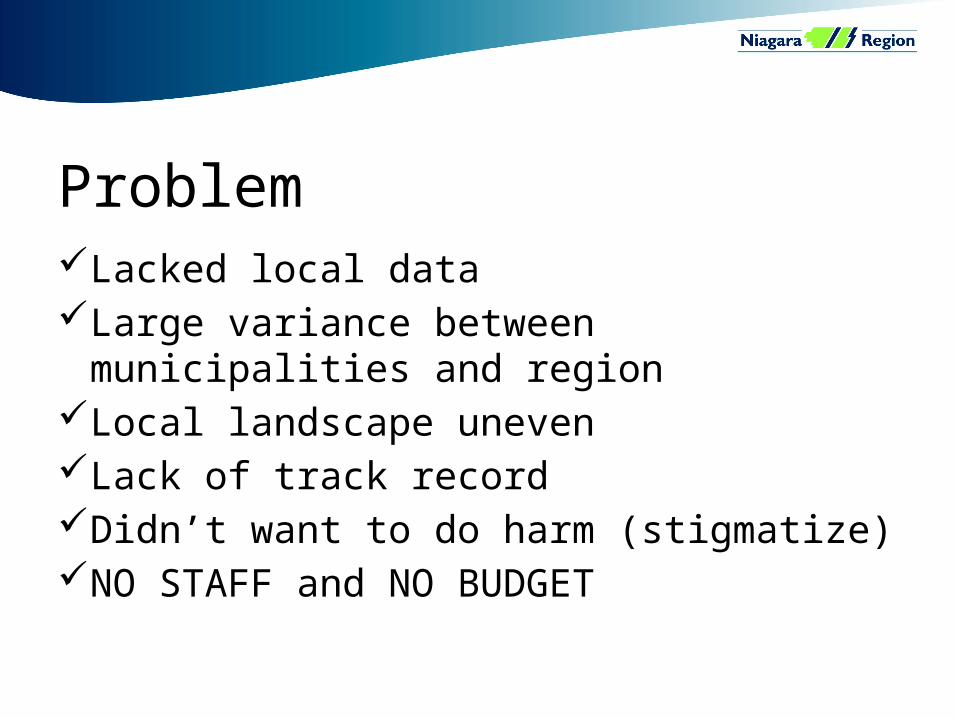
ProblemLacked local dataLarge variance between municipalities and
regionLocal landscape unevenLack of track recordDidn’t want to do harm (stigmatize)NO STAFF and NO BUDGET

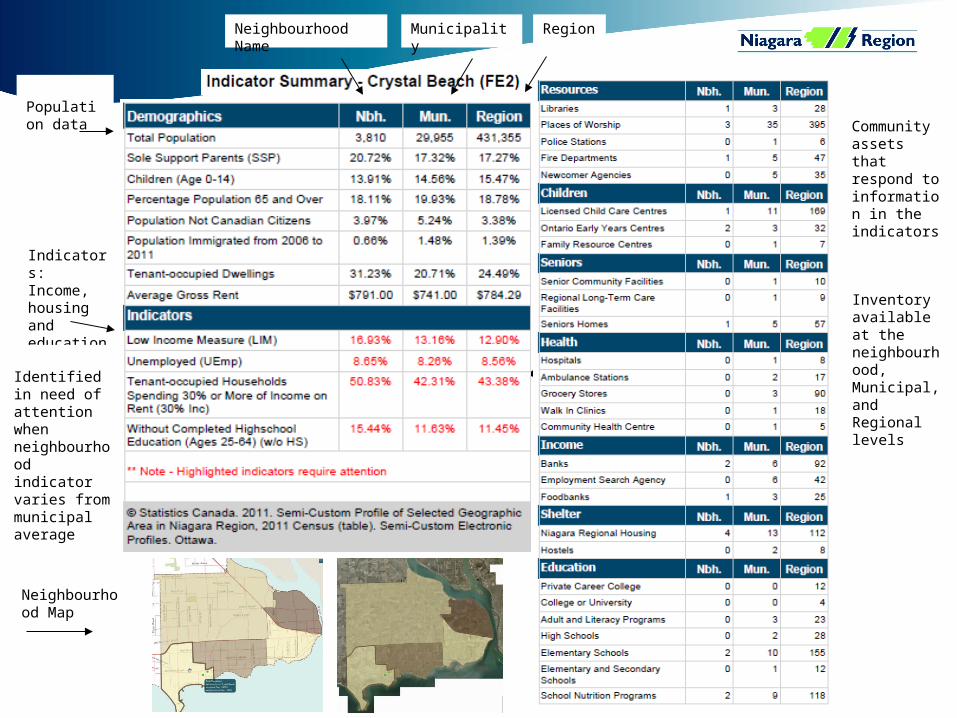
Municipality
Indicators: Income, housing and education
Neighbourhood Name
Community assets that respond to information in the indicators
Identified in need of attention when neighbourhood indicator varies from municipal average
Neighbourhood Map
Population data
Inventory available at the neighbourhood, Municipal, and Regional levels
Region
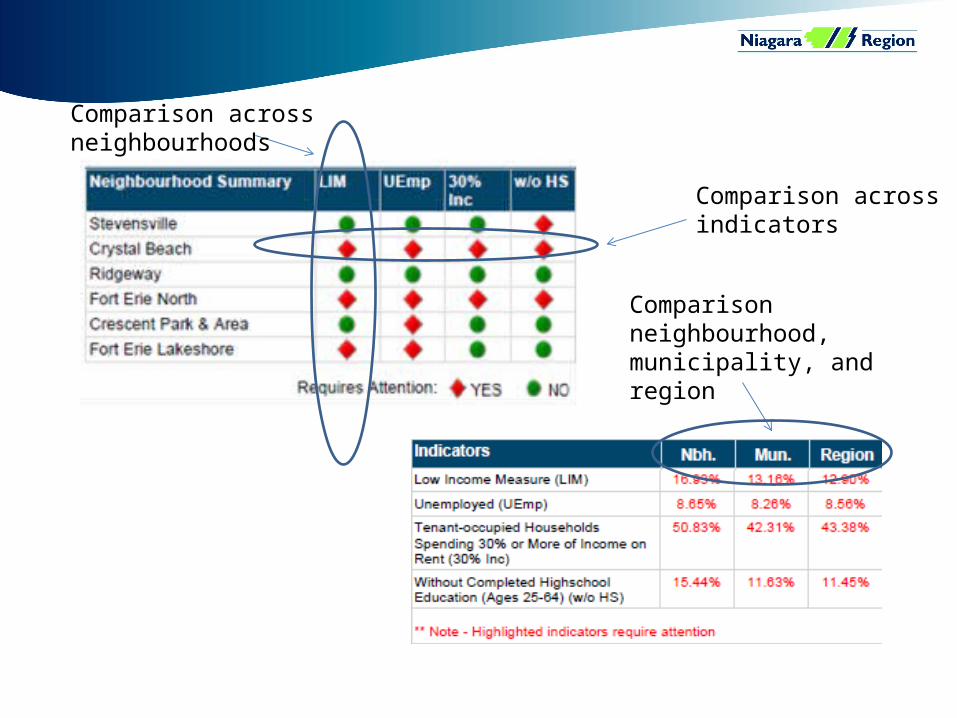
Comparison across neighbourhoods
Comparison neighbourhood, municipality, and region
Comparison across indicators

Connecting the DotsUnemployment in Niagara
– Unemployment rate: 7.0%
– Youth unemployment rate: 18.5% compared to 15.1% in Ontario and 12.9% in Canada
NPI funded projects– 8 job skills programs and 27 Life Skills
programs for adults:• Rock Solid - 40-week life skills
program for young pregnant or parenting women under 21
• Skills of Success (SOS) - pre-vocational program to prepare women for employment
• Ramp It Up - training to support persons with disabilities
• Market Garden – job training for youth

NPI Contracted Amounts by Project Type
Assistance with Shelter - $70,000 (0.8%)Research / Conference /Seminar - $110,909 (1.2%)Transportation Initiatives – $182,738 (2.0%)Job Specific Skills Training – $421,793 (4.7%)Direct Services (i.e. phone, personal needs) - $439,342 (4.9%)Community Gardens - $323,232.38 (3.6%)Back to School Programs - $575,366 (6.4%)Life Skills Programs for Adults - $1,171,126 (13.0%)Access to Food (i.e. grocery cards, food bank, GFB) - $1,141,608 (12.7%)Community Development - $1,855,393 (20.6%)Educational Programs for children/youth (i.e. summer & after school programs - $2,729,156 (30.3%)

How is NPI working?
2011 served 7,147 individuals
29% reported improvements in personal assets 17% reported improvements in physical assets 74% reported improvements in social assets 40% reported improvements in human assets 12% of individuals reported improvements in financial assets.
2010 served 27,306 individuals
14% reported improvements in personal assets 17% reported improvements in physical assets 37% reported improvements in social assets 22% reported improvements in human assets 10% of individuals reported improvements in financial assets

Most significant change
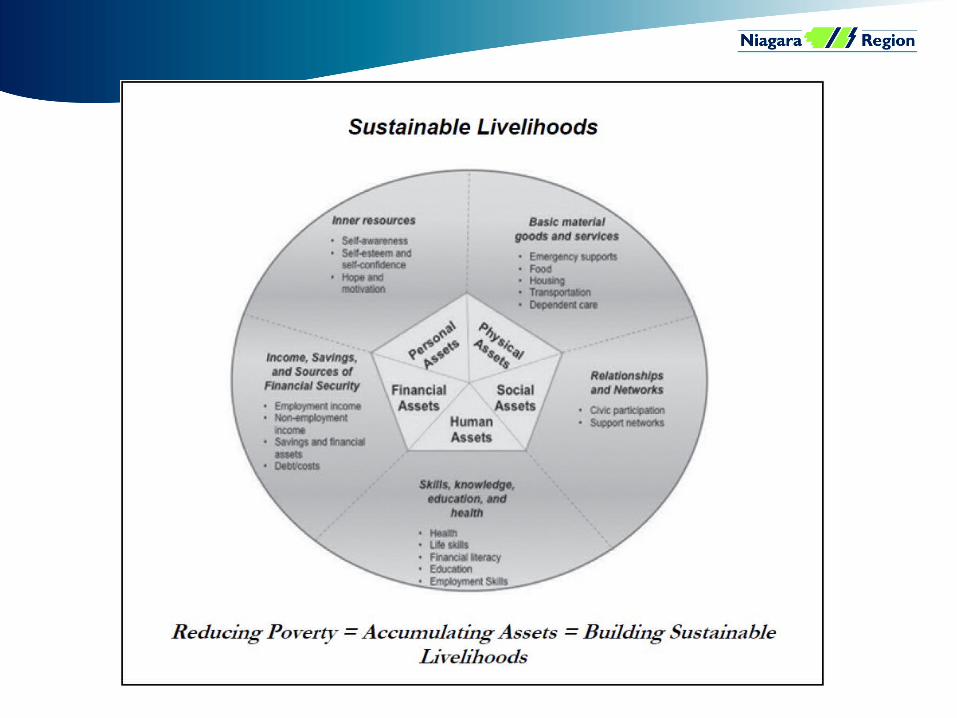
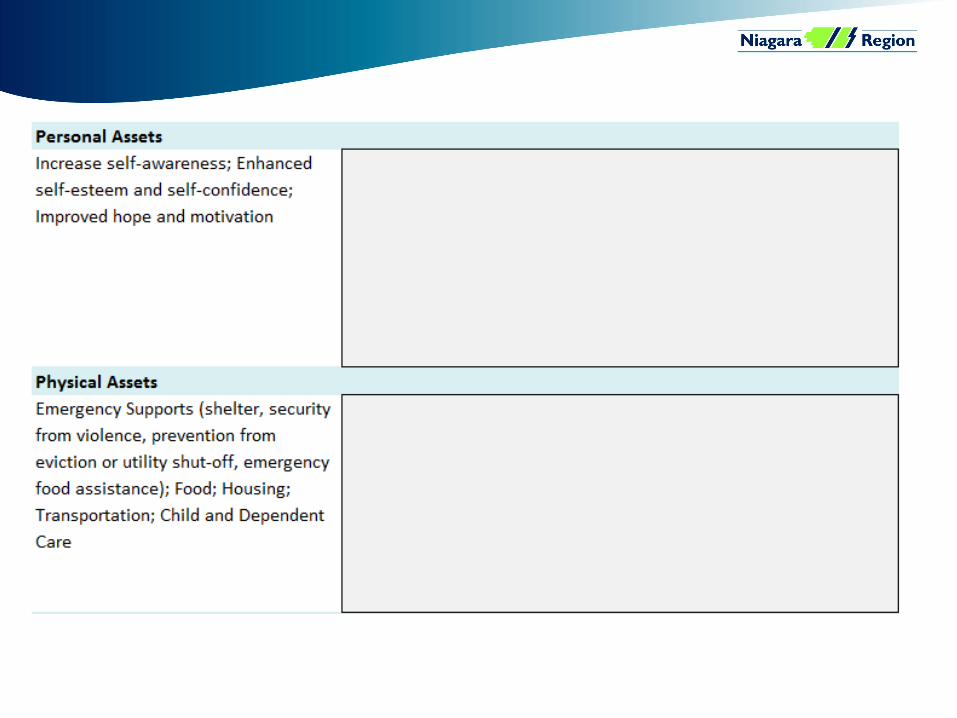
Sustainable livelihoods
# of people
served, # of
partnerships
# of services
& goods
provided
Indicators & neighbourhoods
Individual program evaluation

Ask a question
Gather information
Analyze information
Make a plan
Evaluate impact