Page 1
8/4/2019 Powder Core Apps Emi Filters
http://slidepdf.com/reader/full/powder-core-apps-emi-filters 1/12
Page 1
Powder Core Applications in High Performance EMI Filters
Tim Slattery,
Applications Engineer
The Arnold Engineering Company
Marengo, Illinois
May, 99
The use of molybdenum permalloy, 50% nickel-iron alloy and sendust-type powder cores in
power filter inductors is presented. Power line filtering to reduce differential-mode conducted
EMI is the featured application. The article begins with a simple explanation of filtering and an
example that demonstrates the advantages of using more than one inductor in a filter design.
In addition, power loss and inductance stability with respect to operating current frequency and
magnitude is compared between inductors made with the three different core types. Graphs of
equivalent series inductance, equivalent series resistance and impedance versus frequency
are used to show the effects of winding distributed capacitance and core material eddy cur-
rents.
This paper is a companion to “Powder Core Applications in Switching Amplifier and High
Performance EMI Filters,” an article written by Donald E. Pauly and sponsored by The Arnold
Engineering Company. It also complements “Power Supply Magnetics” (a three-part article) by
Mr. Pauly and published in the January, February and March, 1996 issues of PCIM Magazine.
Copies are available from The Arnold Engineering Company.
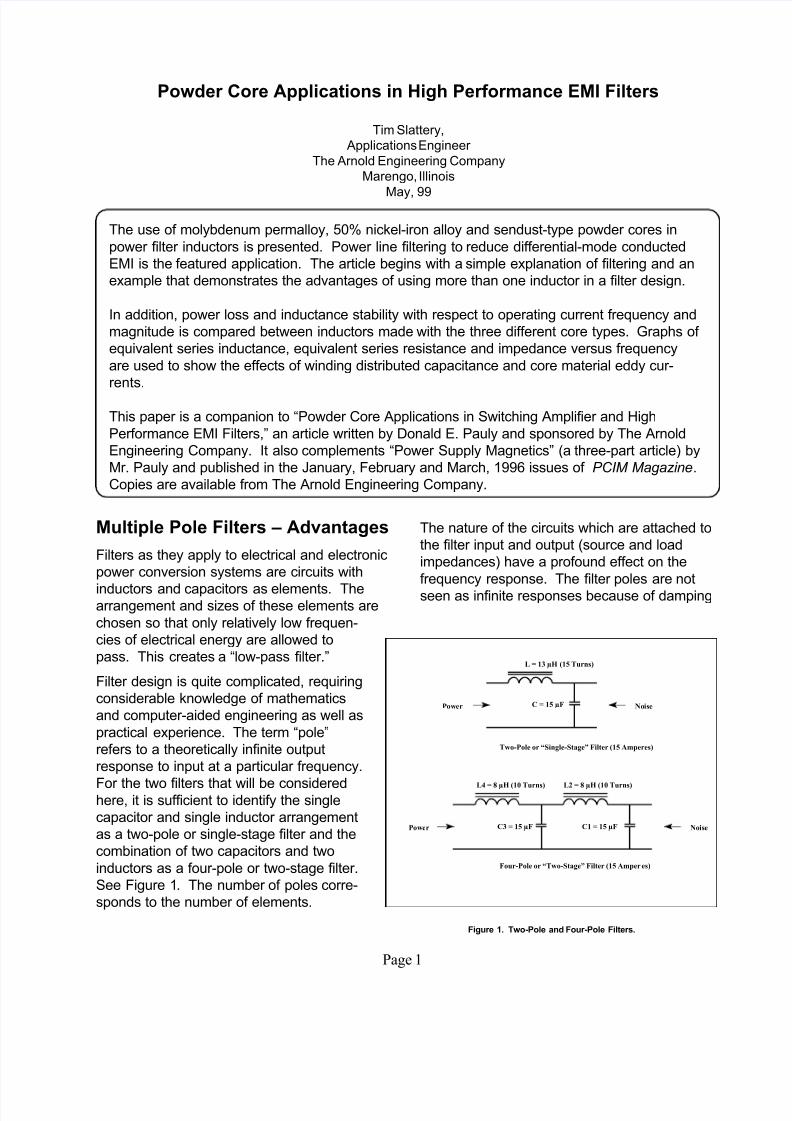
Multiple Pole Filters – Advantages
Filters as they apply to electrical and electronic
power conversion systems are circuits with
inductors and capacitors as elements. Thearrangement and sizes of these elements are
chosen so that only relatively low frequen-
cies of electrical energy are allowed to
pass. This creates a “low-pass filter.”
Filter design is quite complicated, requiring
considerable knowledge of mathematics
and computer-aided engineering as well as
practical experience. The term “pole”
refers to a theoretically infinite output
response to input at a particular frequency.
For the two filters that will be consideredhere, it is sufficient to identify the single
capacitor and single inductor arrangement
as a two-pole or single-stage filter and the
combination of two capacitors and two
inductors as a four-pole or two-stage filter.
See Figure 1. The number of poles corre-
sponds to the number of elements.
The nature of the circuits which are attached to
the filter input and output (source and load
impedances) have a profound effect on the
frequency response. The filter poles are not
seen as infinite responses because of damping
Two-Pole or “Single-Stage” Filter (15 Amperes)
L4 = 8 µH (10 Turns)
C = 15 µF
L = 13 µH (15 Turns)
C1 = 15 µFC3 = 15 µF
L2 = 8 µH (10 Turns)
Power Noise
Four-Pole or “Two-Stage” Filter (15 Amper es)
Power Noise
Figure 1. Two-Pole and Four-Pole Filters.
Page 2
8/4/2019 Powder Core Apps Emi Filters
http://slidepdf.com/reader/full/powder-core-apps-emi-filters 2/12
Page 2
Figure 3. Single-Stage Filter Construction and
Test Leads. Figure 4. Two-Stage Filter Construction and TestLeads.
by the load and source. In practice, the filter
elements include resistance associated with
inductor winding and core losses as well as
capacitor lead, electrode and dielectric losses.
Higher frequency loss provides additional
damping that is desirable for stability.1 Also,
parasitic elements such as capacitor lead
inductance and inductor winding distributedcapacitance influence filter performance.
These parasitic elements are shown in Figure 2
along with the equivalent series resistance of
the inductor, Rs, and capacitor, Rc.
Stand-alone constructions of the two types of
filters for testing are shown in Figure 3 and
Figure 4. The single-stage filter uses a 15 µF
polypropylene capacitor and a 13.2 µH inductor.
The inductor core is Arnold Engineering part
number MS-130060-2, a sendust-type core with
a permeability of 60. (Arnold manufactures and
sells this type of core under the trade name
Super-MSS.) The conductor is made from
three strands of 18 AWG magnet wire and
results in a DC resistance of 4.5 mΩ.
The two-stage filter uses two of the same 15 µF
capacitors as in the single-stage design. Each
of the two inductors has a value of 7.95 µH and
is based on a smaller core of the same material
and permeability, Arnold part number
MS-106060-2. The conductor is the same size
as for the larger inductor but only ten turns are
used. The total resistance for the inductors
1 See Mitchell, Daniel M., DC-DC Switching Regulator Analysis,
McGraw-Hill, New York, 1988, ISBN 0-07-042597-3, Chapter 7,
“Effects of EMI Input Filtering.”
LsRs
Cl Lc
Rc
Cs
50 S
50 S
0.0 dBm
Test(Output)
Reference(Input)
HP 4194A Gain-Phase Analyzer
Figure 2. Single-Stage Filter Model Showing Parasitic Elements and Test and Source Load.
50 ΩΩΩΩΩ
50 ΩΩΩΩΩ
Page 3
8/4/2019 Powder Core Apps Emi Filters
http://slidepdf.com/reader/full/powder-core-apps-emi-filters 3/12
Page 3
10 100 1000 10000
Frequency (kHz)
-20
-10
0
10
20
-16.67
-13.33
-6.67
-3.33
3.33
6.67
13.33
16.67
L s ( µ H )
0
2000
4000
6000
500
1000
1500
2500
3000
3500
4500
5000
5500
R s ( Ω )
2 3 4 5 6 7 8 9 2 3 4 5 6 7 8 9 2 3 4 5 6 7 8 9 2 3 4
Rs Single Stage
Rs 2 Stage
Ls Single Stage
Ls 2 Stage
Figure 5. Equivalent Series Inductance and Resistance versus Frequency for Single and Two-Stage
Inductors.
connected in series is 5.4 mΩ. Because of the
fewer turns, the magnetizing force on the
smaller cores is 14.5% less for the same value
of current.
Figure 5 shows how the equivalent series
inductance and resistance varies with fre-
quency for each type of inductor. The larger
one self resonates at about 26 MHz whereas
the smaller one is still inductive beyond
40 MHz. A wider frequency range is typical of
smaller inductors. There will be more on
inductor characteristics at high frequency in the
next section.
10 100 1000 10000
Frequency (kHz)
-40
-20
0
20
40
-30
-10
10
30
C p ( µ F )
0
100
200
300
400
50
150
250
350
R p ( Ω )
2 3 4 5 6 7 8 9 2 3 4 5 6 7 8 9 2 3 4 5 6 7 8 9 2 3 4
Cp
Rp
Figure 6. Equivalent Parallel Capacitance and Resistance versus Frequency for the 15 µF Capacitor.
A similar graph for the capacitor is shown in
Figure 6. In this case, parallel capacitance and
resistance are plotted against frequency. Note
that the capacitor resonates with the inductance
of its leads at about 250 kHz.
All of the frequency response graphs in this
paper are based on data from a
Hewlett-Packard 4194A Impedance/
Gain-Phase Analyzer. For each inductance
and capacitance measurement, the test signal
voltage used was nominally 0.5 V rms.
Page 4
8/4/2019 Powder Core Apps Emi Filters
http://slidepdf.com/reader/full/powder-core-apps-emi-filters 4/12
Page 4
1e-005 0.0001 0.001 0.01 0.1 1 10 100
Frequency (MHz)
-80
-60
-40
-20
0
-70
-50
-30
-10
G a i n ( d B )
-240
-180
-120
-60
0
60
120
180
240
P h a s e ( d e g )
2 4 6 8 2 4 6 8 2 4 6 8 2 4 6 8 2 4 6 8 2 4 6 8 2 4 6 8
Single - Stage Gain
Single - Stage Phase
Figure 7. Gain and Phase versus Frequency for the Single-Stage Filter.
1e-005 0.0001 0.001 0.01 0.1 1 10 100
Frequency (MHz)
-80
-60
-40
-20
0
-70
-50
-30
-10
G a i n ( d B )
-240
-180
-120
-60
0
60
120
180
240
P
h a s e ( d e g )
Two - Stage Gain
Two - Stage Phase
2 4 6 82 4 6 8 2 4 6 8 2 4 6 8 2 4 6 8 2 4 6 8 2 4 6 8
Figure 8. Gain and Phase versus Frequency for the Two-Stage Filter.
To show the advantage of multiple-pole filtering,
the frequency response for the single-stage
(two-pole) and two-stage (four-pole) examples
are presented in Figure 7 and Figure 8. The
most significant departures from a power circuit
application are the 50 Ω source impedance and
50 Ω load, which are provided by the
“gain-phase” part of the Hewlett-Packard 4194AAnalyzer. In a typical switching-type power
supply, the impedances are variable, not
matched and usually much lower in value at low
frequencies. The test does provide useful
information for comparison even though the
application conditions differ.
For example, the maximum attenuation (mini-
mum gain) for each filter is the result of series
resonance of the capacitor and its lead induc-
tance. It is especially noticeable at about
175 kHz for the single-stage filter. The impor-
tance of minimizing lead length is apparent.
Attenuation decreases at higher frequency
because lead inductance is impeding the flow of return current through each capacitor.
Another important observation with regard to
filter behavior is the lower damping of the
two-stage configuration around 20 kHz. Theo-
retically, the four poles are two double poles at
Page 5
8/4/2019 Powder Core Apps Emi Filters
http://slidepdf.com/reader/full/powder-core-apps-emi-filters 5/12
Page 5
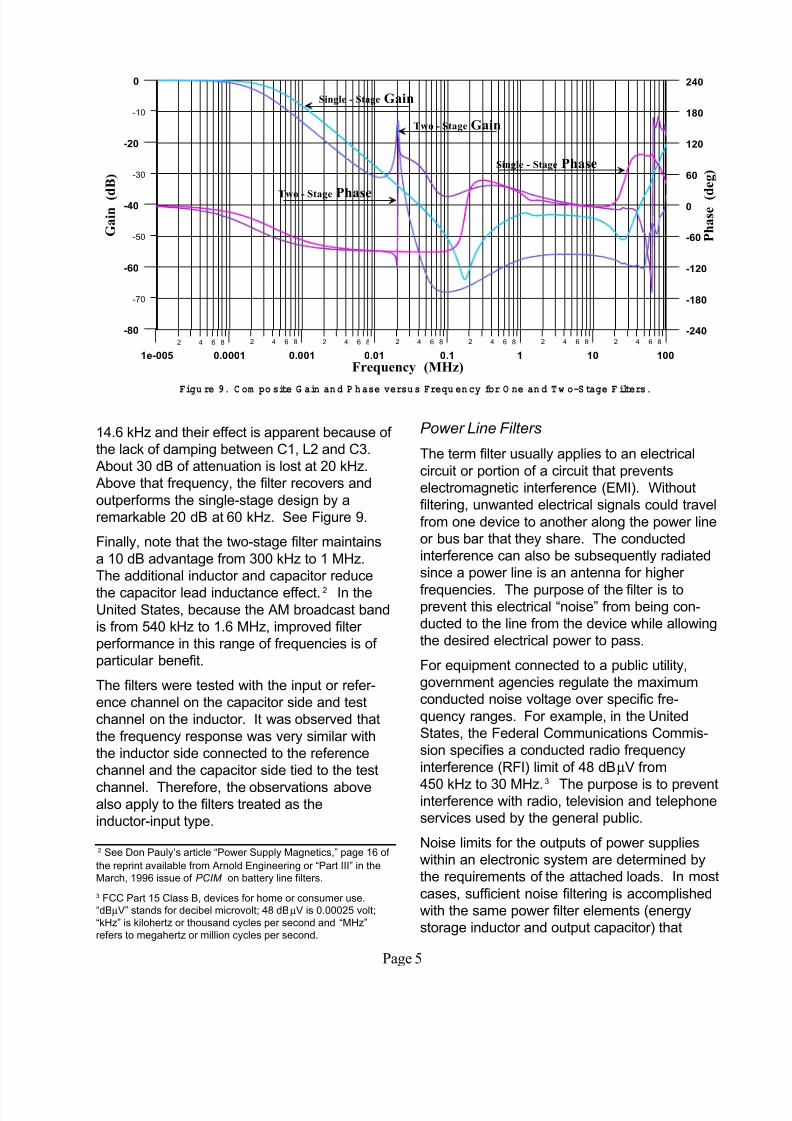
Figu re 9. C om po site G ain an d P hase versus Frequ en cy for O ne an d T w o-S tage F ilters.
1e-005 0.0001 0.001 0.01 0.1 1 10 100
Frequency (MHz)
-80
-60
-40
-20
0
-70
-50
-30
-10
G a i n ( d B )
-240
-180
-120
-60
0
60
120
180
240
P h a s e ( d e g )
Two - Stage Gain
Two - Stage Phase
2 4 6 82 4 6 8 2 4 6 8 2 4 6 8 2 4 6 8 2 4 6 8 2 4 6 8
Single - Stage Gain
Single - Stage Phase
14.6 kHz and their effect is apparent because of
the lack of damping between C1, L2 and C3.
About 30 dB of attenuation is lost at 20 kHz.
Above that frequency, the filter recovers and
outperforms the single-stage design by a
remarkable 20 dB at 60 kHz. See Figure 9.
Finally, note that the two-stage filter maintains
a 10 dB advantage from 300 kHz to 1 MHz.
The additional inductor and capacitor reduce
the capacitor lead inductance effect.2 In theUnited States, because the AM broadcast band
is from 540 kHz to 1.6 MHz, improved filter
performance in this range of frequencies is of
particular benefit.
The filters were tested with the input or refer-
ence channel on the capacitor side and test
channel on the inductor. It was observed that
the frequency response was very similar with
the inductor side connected to the reference
channel and the capacitor side tied to the test
channel. Therefore, the observations abovealso apply to the filters treated as the
inductor-input type.
Power Line Filters
The term filter usually applies to an electrical
circuit or portion of a circuit that prevents
electromagnetic interference (EMI). Without
filtering, unwanted electrical signals could travel
from one device to another along the power line
or bus bar that they share. The conducted
interference can also be subsequently radiated
since a power line is an antenna for higher
frequencies. The purpose of the filter is toprevent this electrical “noise” from being con-
ducted to the line from the device while allowing
the desired electrical power to pass.
For equipment connected to a public utility,
government agencies regulate the maximum
conducted noise voltage over specific fre-
quency ranges. For example, in the United
States, the Federal Communications Commis-
sion specifies a conducted radio frequency
interference (RFI) limit of 48 dBµV from
450 kHz to 30 MHz.3 The purpose is to preventinterference with radio, television and telephone
services used by the general public.
Noise limits for the outputs of power supplies
within an electronic system are determined by
the requirements of the attached loads. In most
cases, sufficient noise filtering is accomplished
with the same power filter elements (energy
storage inductor and output capacitor) that
2 See Don Pauly’s article “Power Supply Magnetics,” page 16 of
the reprint available from Arnold Engineering or “Part III” in the
March, 1996 issue of PCIM on battery line filters.
3 FCC Part 15 Class B, devices for home or consumer use.
“dBµV” stands for decibel microvolt; 48 dBµV is 0.00025 volt;
“kHz” is kilohertz or thousand cycles per second and “MHz”
refers to megahertz or million cycles per second.
Page 6
8/4/2019 Powder Core Apps Emi Filters
http://slidepdf.com/reader/full/powder-core-apps-emi-filters 6/12
Page 6
control the output voltage ripple. However,
some designs include a second stage of filtering
to control EMI on the output of the supply.4
Equipment that contains continuously switching
components, such as the power transistors and
diodes of a switched-mode power supply,
require conducted EMI filtering on the input
side. The abrupt changes of current in the
circuit cause brief voltage rises or “spikes”
either across the input conductors or on both
conductors to ground. (“Ground” includes
ground return wires, ground planes and
grounded enclosures.)
EMI voltage between input conductors is called
differential-mode noise. Noise from both
conductors to ground is termed common-mode.
An inductor for common-mode noise utilizes the
opposing currents in the input conductors (two
windings on one core) and a high permeabilitycore material.
In contrast, a differential-mode inductor requires
a core material that can maintain permeability
with a bias field. Refer to the graphs in Fig-
ure 11 showing inductor current, voltage and
core magnetic fields. Note that the source in
Figure 11 is either a power line (via a wall outlet,
for example) or a battery such as the 48 volt
battery for telephone central office equipment. In
a battery system, the magnetizing current
is a constant DC. For an AC system withhigh power factor, the magnetizing current
is nearly sinusoidal. With a low power
factor AC system, the current is a series
of alternating pulses.
Powder cores are appropriate for differen-
tial-mode, sometimes referred to as
“series-mode,” inductors or “chokes,”
because of their extraordinary capability
to maintain inductance with bias. The
50% nickel-iron alloy powder is particu-
larly useful at high flux densities. (ArnoldEngineering’s trade name for this material
is Hi-Flux.) For comparison, permeabil-
ity versus DC bias curves for the three
types of powder cores are shown in
Figure 12.
The test data in Figure 12 and the data that
follows came from the same three cores. Each
has a permeability of 60 and is the same size as
the core used in the single-stage filter. For
reference, the Arnold part numbers are
A-291061-2, HF-130060-2 and MS-130060-2,
representing the molybdenum permalloy (MPP),
50% nickel-iron and sendust-type powders,respectively.
An example of a “fully” wound core is shown in
Figure 10. Fully wound means that one-half of
the core inside diameter remains. Usually, at
least this much room must be provided for a
hook or shuttle to place the last turn. In this
case, the inductance value is 1.9 mH and is
typical for power line applications. Inductance
requirements generally range from a few
microhenries to several millihenries.
Low core loss at power line frequency is neces-sary to take advantage of the core material’s
high saturation flux density. Measurements are
presented for Hi-Flux in Figure 13. Hi-Flux has
the most loss so it can be used as a worst-case
reference. Even at 400 Hz and 9000 gausses,
the core loss density is low at 200 mW/cm3. For
50 and 60 Hz applications, the flux density limit
is determined by the change in permeability as
shown in Figure 14.
4 See Billings, Keith H., Switchmode Power Supply Handbook ,
McGraw-Hill, New York, 1989. ISBN 0-07-005330-8. pp. 1.151
and 1.152.
Figure 10. Example of “Fully” Wound Core.Figure 10. Example of “Fully” Wound Core
Page 7
8/4/2019 Powder Core Apps Emi Filters
http://slidepdf.com/reader/full/powder-core-apps-emi-filters 7/12
Page 7
I
+ V - SwitchingPower Circuitand Load
Common-ModeInductor
Differential-ModeInductor, L
Two-Pole or “Single-Stage”Filter for Differential-ModeConducted EMI.
Capacitor, C
50/60 Hz Current Pulses (Low Power Factor)
0
H
t
B
V
IBatteryCurrent
t
50/60 HzHysteresisLoop
BDC
HDC
Switching N oise Voltage
0Battery DCOperatingPoint
50/60 Hz Sinusoidal Current(High Power Factor)
Figure 11. Typical EMI Filter Configuration and Differential-Mode Inductor Voltage, Currentand Magnetic Field Waveforms.
Figure 11. Typical EMI Filter Configuration and Differential-Mode Inductor
Voltage, Current and Magnetic Waveforms.
Page 8
8/4/2019 Powder Core Apps Emi Filters
http://slidepdf.com/reader/full/powder-core-apps-emi-filters 8/12
Page 8
1 10 100
2 3 4 5 6 7 8 9 20 30 40 50 60 70 80 90
D. C. Magnetizing Force (Oersteds)
40
60
80
100
45
50
55
65
70
75
85
90
95
P e r c e n t P e r m e a b i l i t y
40
60
80
100
45
50
55
65
70
75
85
90
95
P e r c e n t
p e r m e a b i l i t y
100 % = 60µMPP
Hi-Flux
SMSS
Figure 12. Permeability versus DC Bias.
Another important consideration is the
variation of inductance with frequency. Thefrequency responses of single layer 60 µH
inductors made with each type of core are
shown in Figure 15 through 17.
The absence of the series inductance peak
for the Hi-Flux inductor indicates that its
core permeability is dropping with fre-
quency. Higher eddy current loss in the
50% nickel-iron powder is responsible. As
mentioned before, loss at higher frequency
can be an advantage in filters because of
the additional stability the damping pro-vides. Greater detail regarding series
inductance and resistance in the frequency
range of 100 kHz to 1 MHz is given in Figure
18. The relatively low eddy current loss in
Super-MSS is apparent.
10 100 1000 10000
Flux Density (Gauss)
-20
-10
0
10
-17.5
-15
-12.5
-7.5
-5
-2.5
2.5
5
7.5
% C
h a n g e o f P e
r m e a b i l i t y
-20
-10
0
10
-17.5
-15
-12.5
-7.5
-5
-2.5
2.5
5
7.5
60µ Hi - Flux
2 3 4 5 6 7 8 9 2 3 4 5 6 7 8 9 2 3 4 5 6 7 8 9
Figure 14. Modulation of Permeability with Flux Density.
1000 100002000 3000 4000 5000 6000 7000 8000 9000
Flux Density (Gauss)
1
10
100
2
3
4
5
6
7
89
20
30
40
50
60
70
8090
200
300
C o r e L o s s D e n s i t y ( m W /
c m 3 )
60µ Hi - Flux
1 2 0 H
z 2 0
0 H z
4 0 0 H
z
Figure 13. Core Loss versus Flux Density.
Page 9
8/4/2019 Powder Core Apps Emi Filters
http://slidepdf.com/reader/full/powder-core-apps-emi-filters 9/12
Page 9
10 100 1000 10000
Frequency (kHz)
-150
-100
-50
0
50
100
150
-125
-75
-25
25
75
125
L s ( µ H )
MPP
SMSS
Hi-Flux
2 3 4 5 6 7 8 9 2 2 23 3 34 4 45 56 67 78 89 9
Figure 15. Equivalent Series Inductance versus Frequency, Single-Layer Winding.
10 100 1000 10000
Frequency (kHz)
0
4000
8000
12000
16000
20000
2000
6000
10000
14000
18000
R s ( Ω )
2 4 6 8 2 2 24 4 46 68 83 5 7 9 3 3 35 57 79 9
MPP
SMSS
Hi-Flux
Figure 16. Equivalent Series Resistance versus Frequency, Single Layer Winding.
10 100 1000 10000
Frequency (kHz)
1
10
100
1000
10000
100000
I m p e d
a n c e ( Ω )
SMSS
MPP
Hi-Flux
2 3 4 5 6 7 8 9 2 3 4 5 6 7 8 9 2 3 4 5 6 7 8 9 2 3 4
2
4
6
8
2
4
6
8
2
4
6
8
2
4
6
8
2
4
6
8
Figure 17. Impedance versus Frequency, Single Layer Winding.
Page 10
8/4/2019 Powder Core Apps Emi Filters
http://slidepdf.com/reader/full/powder-core-apps-emi-filters 10/12
Page 10
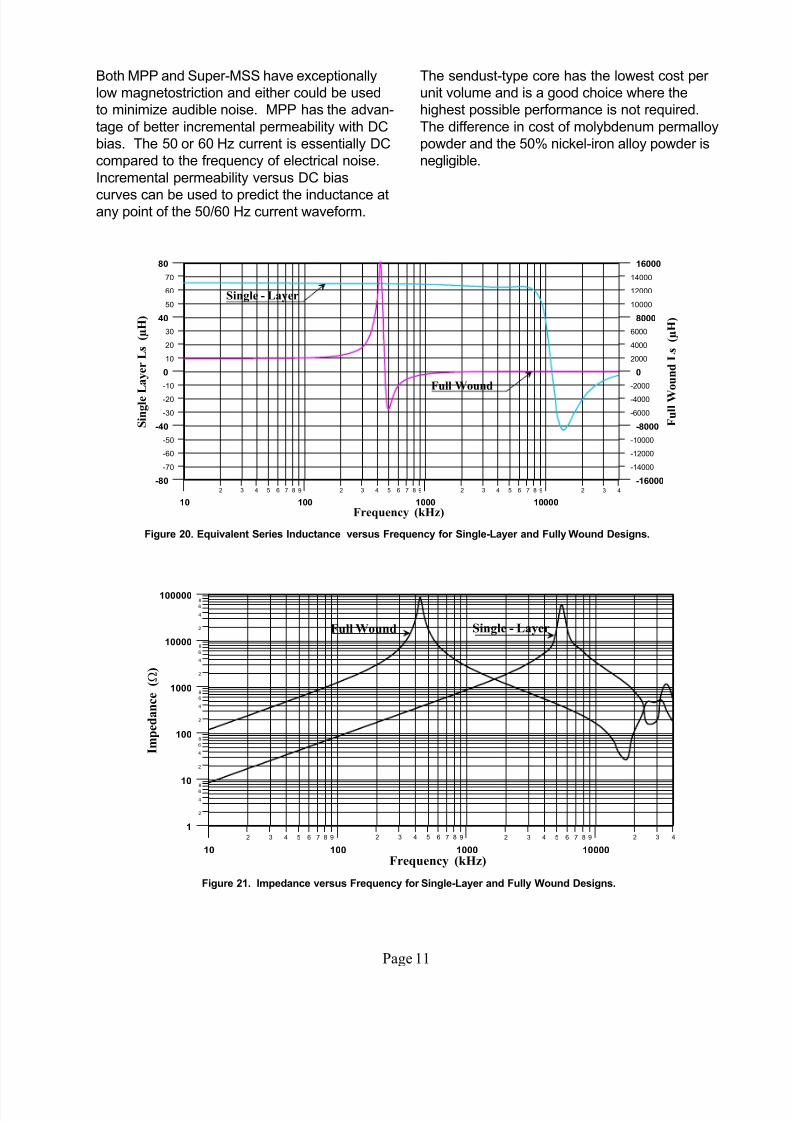
Finally, the effect of greater distributed capaci-
tance with overlapping conductor turns (multiple
layers of magnet wire) is shown graphically in
Figure 20 and Figure 21. Beyond 1.6 MHz, this
stray capacitance actually causes the
high-value, multiple-layer inductor to have a
lower impedance than the low-value
single-layer inductor.5
In conclusion, each of the powder core types is
applicable to power line filtering. The 50%
nickel-iron material performs the best because
Figure 18. Equivalent Series Inductance and Resistance versus Frequency, 100 kHz to 1 MHz.
100 1000200 300 400 500 600 700 800 900
Frequency (kHz)
-10
0
10
20
30
40
-5
5
15
25
35
R s ( Ω )
60
61
62
63
64
65
60.5
61.5
62.5
63.5
64.5
L s ( µ H )
Ls Hi-Flux
Ls MPP
R s S M S S
R s H
i - F l u
x
R s M P P
Ls SMSS
of its ability to sustain inductance with higher
magnetizing current. It also provides some
desirable damping at higher frequencies.
Another important consideration is acoustic
noise caused by magnetostriction of the mag-
netic metal alloy. A 50% nickel-iron alloy core
can make a humming sound at high 50 or
60 Hz flux levels. Of course, DC magnetizing
current does not cause audible noise so the
50% nickel-iron is usually the best material for
battery power line filters.
5 The multiple-layer winding is 170 turns of 18 AWG magnet wire.
100 1000200 300 400 500 600 700 800 900
kHz
10
100
1000
20
30
40
50
60
70
80
90
200
300
400
500
600
700
800
900
I m p e d a n c e
HI-Flux
MPP
SMSS
Figure 19. Impedance versus Frequency, 100 kHz to 1 MHz.
Hi-Flux
Page 11
8/4/2019 Powder Core Apps Emi Filters
http://slidepdf.com/reader/full/powder-core-apps-emi-filters 11/12
Page 11
Both MPP and Super-MSS have exceptionally
low magnetostriction and either could be used
to minimize audible noise. MPP has the advan-
tage of better incremental permeability with DC
bias. The 50 or 60 Hz current is essentially DC
compared to the frequency of electrical noise.
Incremental permeability versus DC bias
curves can be used to predict the inductance atany point of the 50/60 Hz current waveform.
10 100 1000 10000
Frequency (kHz)
-80
-40
0
40
80
-70
-60
-50
-30
-20
-10
10
20
30
50
60
70
S i n g l e L
a y e r L s ( µ H )
-16000
-8000
0
8000
16000
-14000
-12000
-10000
-6000
-4000
-2000
2000
4000
6000
10000
12000
14000
F u l l W o u n d L s ( µ H )
Single - Layer
Full Wound
2 3 4 5 6 7 8 9 2 3 4 5 6 7 8 9 2 3 4 5 6 7 8 9 2 3 4
Figure 20. Equivalent Series Inductance versus Frequency for Single-Layer and Fully Wound Designs.
10 100 1000 10000
Frequency (kHz)
1
10
100
1000
10000
100000
I m p e d a n c e ( Ω )
2 3 4 5 6 7 8 9 2 3 4 5 6 7 8 9 2 3 4 5 6 7 8 9 2 3 4
2
4
68
2
4
6
8
2
4
6
8
2
4
6
8
Full Wound Single - Layer2
4
6
8
Figure 21. Impedance versus Frequency for Single-Layer and Fully Wound Designs.
The sendust-type core has the lowest cost per
unit volume and is a good choice where the
highest possible performance is not required.
The difference in cost of molybdenum permalloy
powder and the 50% nickel-iron alloy powder is
negligible.
Page 12
8/4/2019 Powder Core Apps Emi Filters
http://slidepdf.com/reader/full/powder-core-apps-emi-filters 12/12
Page 12
Acknowledgements
The author thanks Jim Motley for his careful and
skillful work in preparing all of the data curves in
the paper and Jean Wickman for assisting him.
Don Pauly was a very helpful and encouraging
proofreader and his insights regarding filter
design were essential.References
Billings, Keith H., Switchmode Power Supply Hand-
book , McGraw-Hill, New York, 1989.
ISBN 0-07-005330-8.
Mitchell, Daniel M., DC-DC Switching Regulator
Analysis, McGraw-Hill, New York, 1988,
ISBN 0-07-042597-3
Reference Data for Engineers: Radio, Electronics,
Computer, & Communications, Eighth Edition, Mac
E. Van Valkenburg, Editor-in-Chief, Sams Publishing,
Carmel, Indiana, USA, 1995, ISBN 0-672-22753-3
Pauly, Donald E., “Power Supply Magnetics, Part III,”
PCIM Magazine, March, 1996. (Available from The
Arnold Engineering Company.)
Pauly, Donald E., “High Fidelity Switching Audio
Amplifiers Using TMOS Power MOSFETs,” AN1042/
D, 1989, Motorola Technical Information Center,
Phoenix, AZ.
Brown, Paul, “Not All Millihenries Are Equal,” pre-
sented at an IEE Colloquium on Capacitors and
Inductors for Power Electronics, Savoy Place,
London, March, 1996. Paper available as variousabstracts through Almag Ltd, Braintree, Essex,
England (e-mail: [email protected] )