34
Florida Power Electronics Center Florida Power Electronics Center http://FloridaPEC.engr.ucf.edu Issa Batarseh [email protected] 8 th August, 2002

Florida Power Electronics CenterFlorida Power Electronics Centerhttp://FloridaPEC.engr.ucf.edu
Issa Batarseh
8th August, 2002

Outline
• UCF’s Research Activities• Fuel Cell Basics• Fuel Cell Technical Issues• High Frequency Link Inverter• Simulation and Experimental Results• Concluding remarks

OrlandoArea
WELCOME TO FLORIDA
Power Factor Correction (PFC) Circuits - NASA
Soft-Switching DC-DC Converters - Florida and Industry
Low voltage AC-DC and DC-DC Converters - NSF
Dynamic Modeling and Control - NSF
Electromagnetic Interference and Compatibility - NSF
Inverter Application / Fuel Cell, Photovoltaic Cell - Florida and Industry
Dr.Issa Batarseh – DirectorDr.Wenkai Wu – Asst DirectorDr.Shiguo Luo – Asst Director (ret.)11 Graduate Students
High Frequency AC DPS - NSF & Florida
Florida Power Electronics Center

Classification : Based on electrolyte employed: Phosphoric Acid (PA), Proton Exchange Membrane (PEM), Molten Carbonate (MC), Solid Oxide (SO), Alkaline, Zinc-Air (ZA)
Benefits : Environmental Friendly and quite, Efficient, Cogeneration, Distributed Capacity, Fuel flexibility, Modular, Scalable, Federally Approved System
Applications : Stationary ( Buildings, Hospitals,…), Residential ( Domestic Utility), Transportation ( Fuel Cell Vehicle), Portable Power ( Laptop, cell phone), Landfill/ Wastewater treatment,..etc
Operation : Fuel cells force two fuels (H & O) to produce electrical energy by means of chemical reaction. Unlike combustion engines, no moving partsand unlike batteries, no charging required
Fuel Cell Overview
DC Output : 1~2 V/Cell, hence stacking is required.
Efficiency : Fuel Cells have 40% efficiency and could reach 80% in co-generation
Control : Fuel Cells can operate with or without regulated fuel flow to the stack, i.e. constant or variable fuel flow.
Invented in 1838

Residential Application Issues
• Fuel Cell based power distribution is viable solution for backup generation
• Prices are expected to drop at a much faster rate• The distributed generation for residential application
represents large size of market share• Power electronic interface system are critical to the
success of any residential power distribution application.
• The interface system must be inexpensive and reliable, small size and light weight.
• UPS applications to replace lead batteries (1/7 the size)• Target of a maximum of $40/kW as a manufacturing
cost

Portable Applications
• There is a genuine economic demand for scaled down fuel cell designs to replace battery technology
• Multi billion dollar market share and unit sales of portable electronics device on the rise
• Ever increasing burden on battery life• Increased portable device complexity and application
flexibility with more power requirements. Example: cell phones with added features such as Wireless Application protocol (WAP)
• The distributed generation for residential application represents large size of market share

Fuel Cell Technical Issues
I) Basic physical understanding of Fuel Cells:• Fuel Cell Modeling to determine the optimum
operating conditions• Fuel Cell reaction to load changes, thermal
transients• Understanding operational difficulties involving fuel
cell stacks and it’s V-I characteristic curve.• Filtering requirements due to strict current ripple
specifications• Fuel cell Stack and it’s auxiliary systems such as:Air
compressor, water cooling, valve to control fuel flow, humidifiers
• Understand Power Consumption in Auxiliary Systems

V-I Characteristic of Fuel Cell
Cell Current (Amps)
Cel
l Pot
enti
al (V
)
00 0.5 1.0
0.5
1.5
1.0
Cell Potential Losses dueto lack of electrocatalysis
Mass transport losses due todecrease of cell potential to zero
Linear drop in cell potentialdue to ohmic losses in
solution between electrodes
The ideal cell potential-currentrelation
Thermodynamicreversible cell potential
Fuel Cell Technical Issues
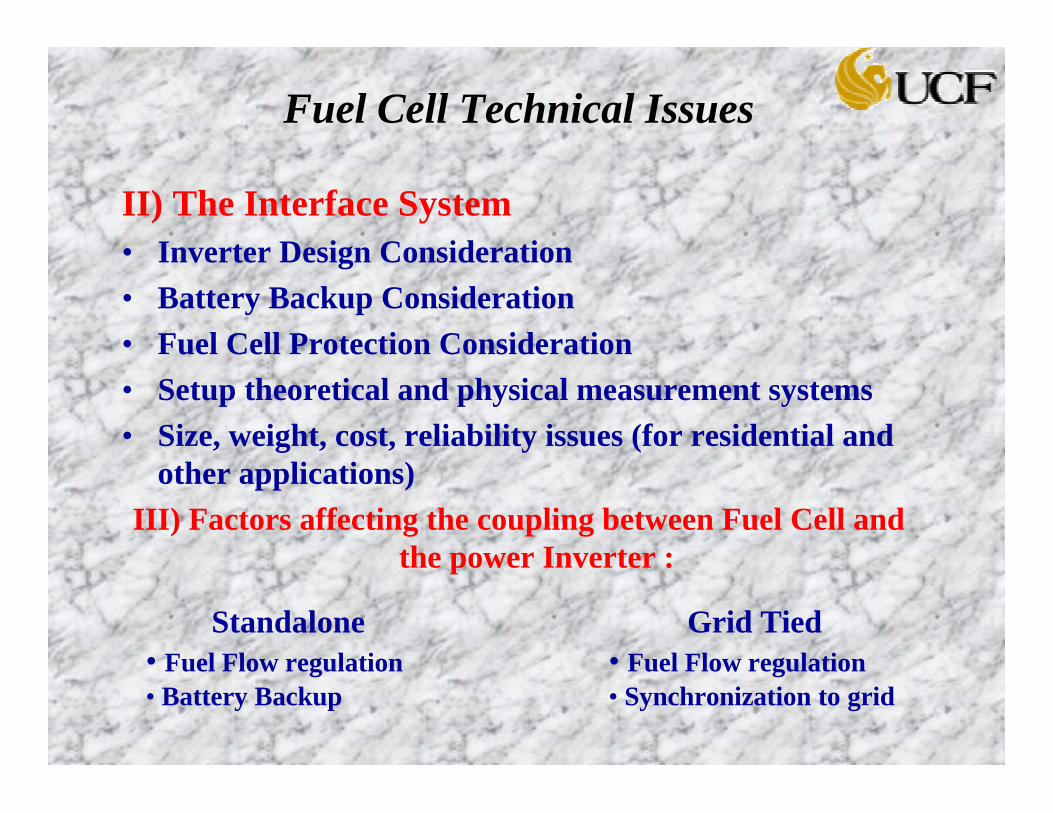
II) The Interface System• Inverter Design Consideration• Battery Backup Consideration• Fuel Cell Protection Consideration• Setup theoretical and physical measurement systems• Size, weight, cost, reliability issues (for residential and
other applications) III) Factors affecting the coupling between Fuel Cell and
the power Inverter :
Standalone• Fuel Flow regulation• Battery Backup
Grid Tied• Fuel Flow regulation• Synchronization to grid

2001 Future Energy Challenge as a design example
• Uses the Proton Exchange Membrane (PEM) type fuel cell
• Uses Hydrogen Gas. Operating temperature 60-100o C• Fuel flow regulation system to fully utilize the
consumption of hydrogen as it reacts to changing load demand
• Nominal 48V. Range 42-72 V• 1.8kW power testing• Open circuit voltage 72 V• Slow response time ( chemical v/s electrical process )
FuelCell
Inverter
120Vac
N
-120Vac

Handshaking Signals
Fuel CellController
InverterController(DSP Based)
0-5V ON/OFF (Digital)
0-5V Ready/Trip (Digital)
0-5V AnalogPower Request
0-5V AnalogPower Available
If Power Request > Power Available : Battery Buffers the transientIf Power Request < Power Available : H2 flow is reducedBattery is used for start-up.
* Source : FEC2001

Review of the existing inverter topology
• Bulky transformer.• Large volume, High
cost.
DisadvantagesDisadvantages
Conventional sinusoidal output inverter topology Conventional sinusoidal output inverter topology solutionsolution

• Complex Structure. • High cost.• Low Efficiency.
DisadvantagesDisadvantages
Improved sinusoidal output inverter topology solutionImproved sinusoidal output inverter topology solution
Review of the existing inverter topology

Concept of High Frequency Link Transmission Technique
The objective is to reduce the size of transformer by The objective is to reduce the size of transformer by stepping up the switching frequencystepping up the switching frequency
The conventional bipolar SPWM waveform with low frequency component ( the reference ) included
High frequency link technique transforms the conventional SPWM waveform into high frequency format, small sized transformer is allowed

Concept of High Frequency Link Transmission Technique
The theoretical analysis of the harmonicsThe theoretical analysis of the harmonicsThe conventional SPWM waveform transmitted by bulky line frequency transformer ( fc=2kHz, fr=60Hz )
The waveform transmitted by compact high frequency transformer ( fc=2kHz, fr=60Hz)
∑=
++−
+=
k
i
wi
ww
wdc iin
iin
in
nV
nV1
)2
)()((sin)
2)(
)((sin)2
)(sin()
2()( π
θθ
θθ
θπ
∑=
++−
+−=
k
i
wi
ww
wdci iin
iin
in
nV
nV1
)2
)()((sin)
2)(
)((sin)2
)(sin()
2()1()( π
θθ
θθ
θπ
0 1000 2000 3000 4000 5000 6000 7000 8000 90000
200
Frequency (Hz)
Har
mon
ics
Am
plitu
de(V
)
300
0
V n( )
8.16 103×60 n f o⋅
0 1000 2000 3000 4000 5000 6000 7000 8000 90000
200
Frequency (Hz)
Har
mon
ics
Am
plitu
de (
V)
280
0
V1 n( )
8.16 103×60 n f o⋅
Since the waveform contains no low frequency component, a compact transformer is suitable for power transmission.

The Proposed Inverter Topology
The topology of high frequency link inverter
Drive Signal
Vdc
S1
S2
S3
S4
T1
LOAD
C1
S7 S8
S5 S6L
HighFrequency
Inverter
HighFrequency
TransformerCycloconverter Output Filter

Characteristics of the High Frequency Link Inverter
• No low frequency component exists in the waveform transmitted by transformer. A compact high frequency transformer is allowed for the transmission.
• The four switches in the secondary side of the transformer is operated mostly in line frequency which leads to low switching loss and high efficiency.
• The phase-shift control is used for the full bridge to realize the ZVS turning of the switches. The switching loss is greatly reduced compared with the conventional control scheme.
• Simple structure, lower loss and higher efficiency.

Operation Mode Analysis
State 1 State 2 State 3
State 4 State 5 State 6
State 7
+
-
+
-
+
-Vdc
S1
S2
S3
S4
S5 S6
S7 S8
HFTransformer
+
-
+
-Vdc
S1
S2
S3
S4
S5 S6
S7 S8
HFTransformer
0
+
-Vdc
S1
S2
S3
S4
S5 S6
S7 S8
HFTransformer
-
+
+
-Vdc
S1
S2
S3
S4
S5 S6
S7 S8
HFTransformer
+
-Vdc
S1
S2
S3
S4
S5 S6
S7 S8
HFTransformer
+
-
+
-
Vdc+
-
S1
S2
S3
S4
S5 S6
S7 S8
HFTransformer
0
+
-Vdc
S1
S2
S3
S4
S5 S6
S7 S8
HFTransformer
+
-
+
-
Duration I: positive output voltage, positive output current.
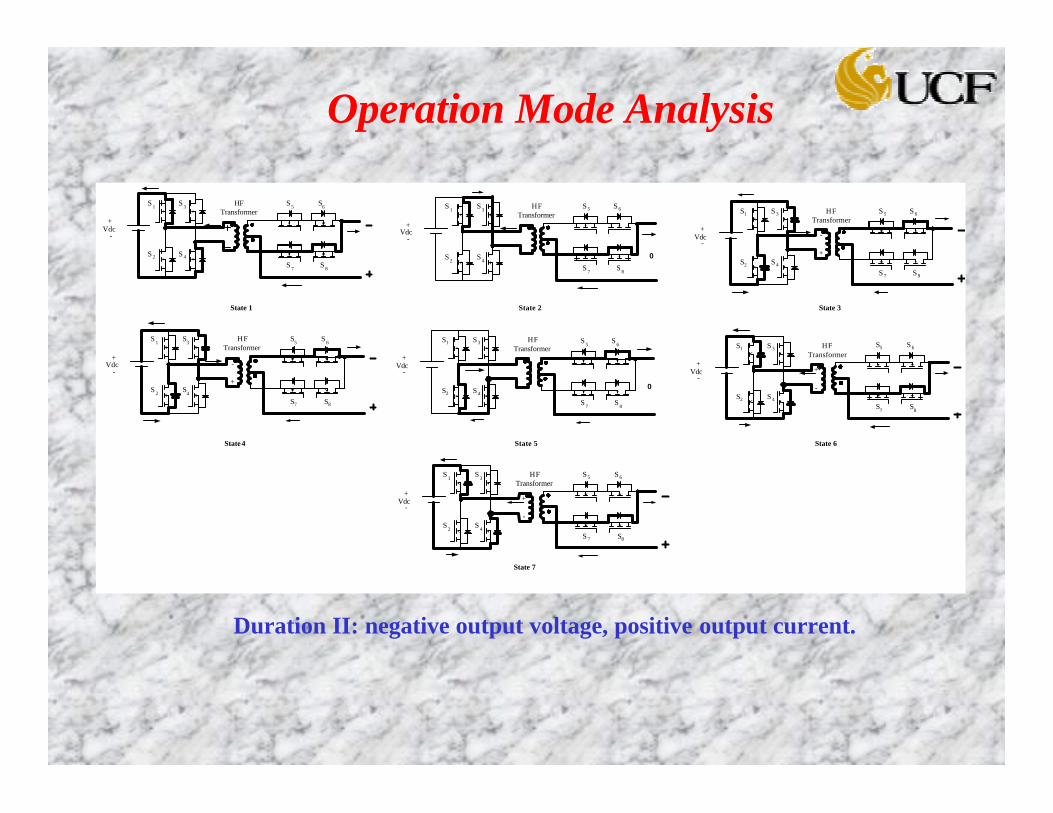
Operation Mode Analysis
Duration II: negative output voltage, positive output current.
State 1 State 3
State 4
State 2
State 5 State 6
State 7
+
-Vdc
S1
S2
S 3
S 4
HFTransformer
-
+
S 5 S 6
S 7 S 8
+
-Vdc
S1
S2
S 3
S 4
HFTransformer
S5 S 6
S7 S8
+
-
+
-Vdc
S 1
S 2
S3
S4
HFTransformer
-
+
S5 S 6
S7 S8
+
-Vdc
S 1
S 2
S 3
S 4
HFTransformer
S 5 S 6
S 7 S8
+
-
+
-Vdc
S 1
S 2
S 3
S 4
HFTransformer
S 5 S6
S 7 S 8
+
-Vdc
S 1
S 2
S 3
S 4
HFTransformer
S 5 S 6
S 7 S 8
0
+
-Vdc
S1
S2
S 3
S 4
HFTransformer
S 5 S 6
S 7 S 8
0

Simulation Circuit
3.8
0
-1
TR2
400u
P1
Logic Unit
U4
AND2
1
23
C1
10u
Cycloconverter
R11
1k
0
HF Transformer
K K1
COUPLING = 1K_Linear
L1 = Tr1L2 = Tr2L3 = Tr3
V13-0.1
+-
+
-
SC1
S
VON = 1mVVOFF = 0.0V
R10
12k
R8
200
TR1
5mH
0
0
0
ABS
0
0
+-
+
-
SP3
S
VON = 0.1VVOFF = 0.0V
DbreakD4
R16
1k
S1
Dbreak
D3
+-
+
-
SP2
S
VON = 0.1VVOFF = 0.0V
Filter
+-
+
-
S7
S
VON = 0.05mVOFF = 0.0V
D2
Current Sensing
D1
R2
1n
U3
OR2
1
23
R410
SB
Dbreak
DP1
R17
200
+ -
+ - S3 R71n
R6
1n
+-
+-
S2
V104V
S3
0
V61V
DbreakDP4
0
0
+ -
+ -S1
U9
AND2
1
23
V3-0.15V
0
+-
+-
S4
SA
0
0
C2
1000u
R15
1k
V8
+-
+
-
SP1
S
VON = 0.1VVOFF = 0.0V
U10
INV
1 2
S2
R14
1k
30
U8
OR2
1
23
DbreakDP3
S4
R18
200
R121k
U1
OR2
1
23
Pp
U2
AND2
1
23
R51000k
+-
+
-
SI1
S VON = 0.1VVOFF = 0.0V
R1
1n
U7
XOR
1
23
U5
OR2
1
23
V5
V7
DbreakDP2
+-
H1
H
(V(%IN1)-V(%IN2) ) *10000
13
2
Sda
TR3
5mH
V114V
U6
AND2
1
23
V148V
0.026
L2
100m0
V9
+-
+
-
SP4
S
VON = 0.1VVOFF = 0.0V
Full Bridge
R3
100k
0
Sdb
0
0
0
+-
+
-
S6
S
VON = 0.05mVOFF = 0.0V
0
R13
200
V24V
L1
3m
P2
PI Controller
Power stage includes full bridge inverter, HF transformer, cycloconverter and output filter. Control circuit includes output current&voltage sampling, PI controller and logic unit.

Simulation Result
Waveform transmitted by high frequency transformer
Spectrum of the waveform through transformer(Switching Frequency: 30kHz)
Output voltage and current
The spectrum of the transmitted waveform shows that only high frequency component exists. Therefore, a compact high frequency transformer can be used for power transmission.

Output Voltage Waveform Harmonic Analysis
Total Harmonic Distortion ( THD )= 2%
The close loop control provides clean output voltage waveform.
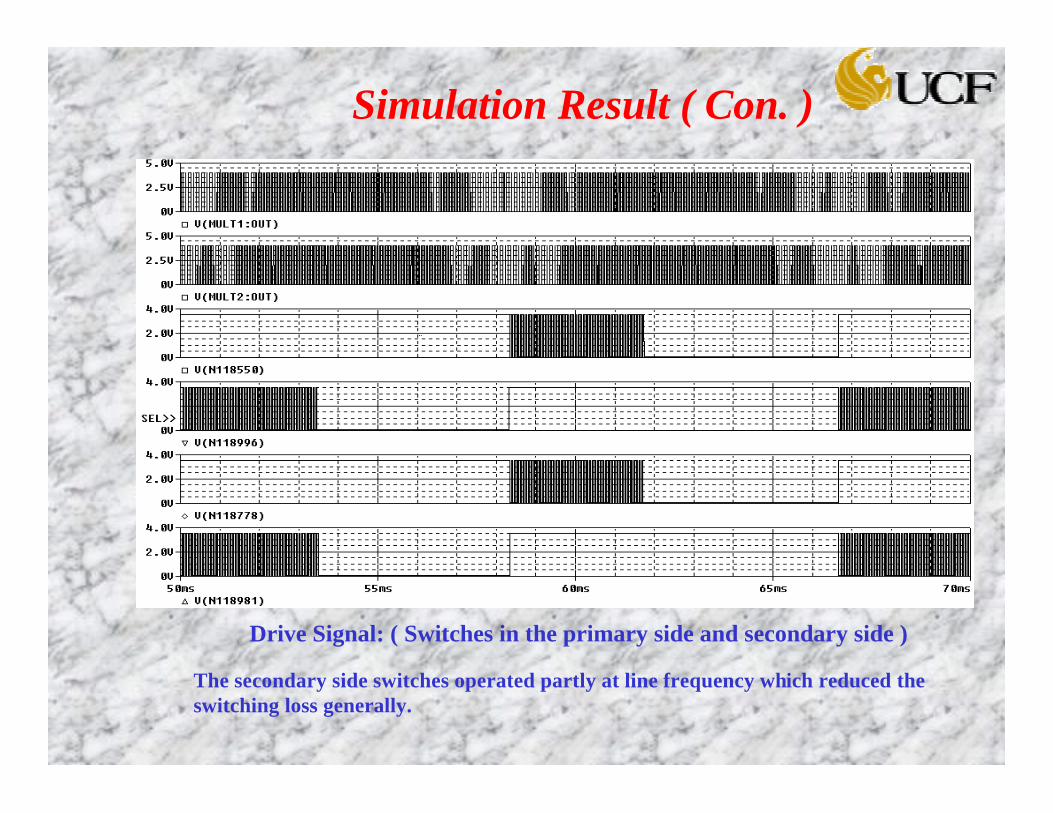
Simulation Result ( Con. )
Drive Signal: ( Switches in the primary side and secondary side )
The secondary side switches operated partly at line frequency which reduced the switching loss generally.

Voltage across the switches
No huge spikes found across the switches.
Simulation Result ( Con. )

Design Specifications for Inverter•• Output power ratingOutput power rating 400W continuous, single phase.400W continuous, single phase.•• Output voltageOutput voltage 120V nominal120V nominal•• Output FrequencyOutput Frequency 60 Hz 60 Hz ±± 0.1 Hz. 0.1 Hz. •• Carrier frequency Carrier frequency 42kHz42kHz•• Input source Input source Nominal rating of 48 V dc.Nominal rating of 48 V dc.•• Overall efficiencyOverall efficiency Higher than 90% for resistive load.Higher than 90% for resistive load.•• Total harmonic distortion Total harmonic distortion Output voltage THD: less than 5%Output voltage THD: less than 5%
when supplying a standard nonlinear when supplying a standard nonlinear test loadtest load
Device Used for the prototype
•• Primary full bridge MOSFET Primary full bridge MOSFET SSH10N90A•• Secondary side IGBT Secondary side IGBT IRG4BC30UD•• Transformer Center tapped at the secondary Transformer Center tapped at the secondary side side
Power stage:
Control circuit:•• Phase shift controller Phase shift controller UC3875 UC3875 phase shift controller for full bridgephase shift controller for full bridge•• Driver IC Driver IC IR2110IR2110 for primary full bridgefor primary full bridge
UC1708JUC1708J for secondary for secondary cycloconvertercycloconverter•• Optoisolator Optoisolator 4N254N25 for the for the cycloconverter cycloconverter driverdriver
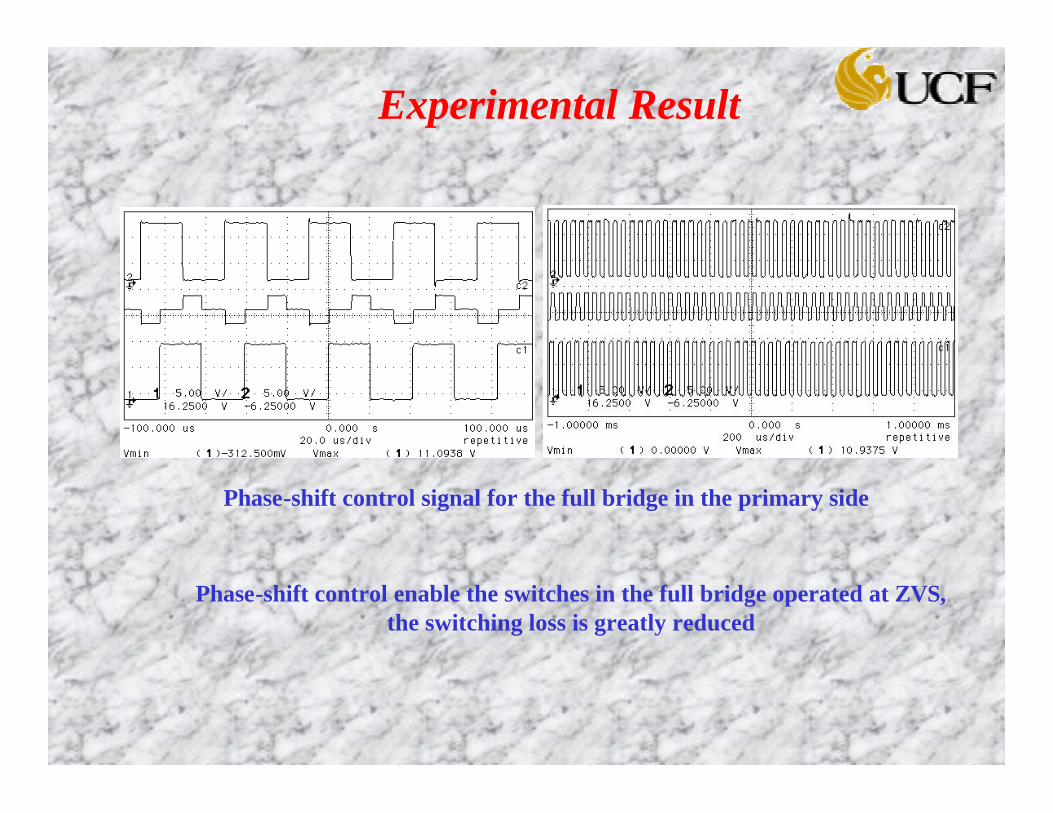
Phase-shift control signal for the full bridge in the primary side
Phase-shift control enable the switches in the full bridge operated at ZVS, the switching loss is greatly reduced
Experimental Result

Waveform transmitted by HF transformer
The waveform contains no low frequency component which facilitate the power transmission
Experimental Result ( Con. )

The unipolar SPWM waveform and the output voltage waveform
The output filter converts the unipolar SPWM pulse series into the sinusoidal output waveform
Experimental Result ( Con. )

The future for cycloconverter in fuel cell application
• The phase shift control scheme enable the switches shift at ZVS, the total switching loss is generally reduced. The cycloconverter enable the swtiches operated mainly at line frequency. The switching loss dropped furtherly. The whole system efficiency is high compared with the conventional cycloconverter system.
• The high frequency operation reduced the size of the transformer, the whole system size is greatly reduced.
• The front side communication between the inverter and the fuel cell enable them work in harmony in the case of load variation.
• No high component current and voltage spikes. Together with the low loss of the switches, the inverter is expected to handle high power and suitable for high power applications.

How to accelerate the deployment of fuel cell distributed generation for home applications ?
• Increased funding and awareness programs by state and federal agencies.
• Industry must play a major role in funding fuel cell based projects and pursue aggressive fuel cell R&D strategies.
• Educational campaign is needed to generate student interest in fuel cells (example: Future Energy Challenge)
• Fuel Cell experts need to speak more.• Increase the role of professional organizations
(IEEE,IEE…etc) to promote special issues on fuel cell applications, modeling, inverter design,…etc

Research Focus at UCF
• Develop an understanding of Fuel cell modeling • Identify and understand issues that affect the coupling
between the fuel cell and the power inverter.• Explore new inverter topologies and suitable controls• Expand the above finding to similar sources like
photovoltaics• Participate in FEC 2003 Inverter Competition.• Minor detail: $$$ - Secure funding - $$$ ?

FEC2003 Inverter Specifications for UCF
• Input Voltage : 22-41 VDC, 29 VDC nom. ,275 A max. from fuel cell.
• Output Voltage : 120 V/240 V nominal (split-phase)., 60 Hz ±0.1 Hz.
• Output power capability – nominal : 10 kW continuous, total (5 kW continuous @ displacement factor 0.7, leading or lagging, max.
• Output voltage harmonic quality : (THD) - less than 5% when supplying a standard nonlinear test load
• Maximum input current ripple : 3% rms of rated current • Overall energy efficiency : Higher than 90% for 5.0 kW resistive load with
minimal efficiency degradation up to peak power and down to minimum power.
• Protection : Industry standard• Communication interface : Control communication between fuel cell and
inverter is through RS232 • Manufacturing cost : Less than US$40/kW for the 10 kW design in
high-volume production.
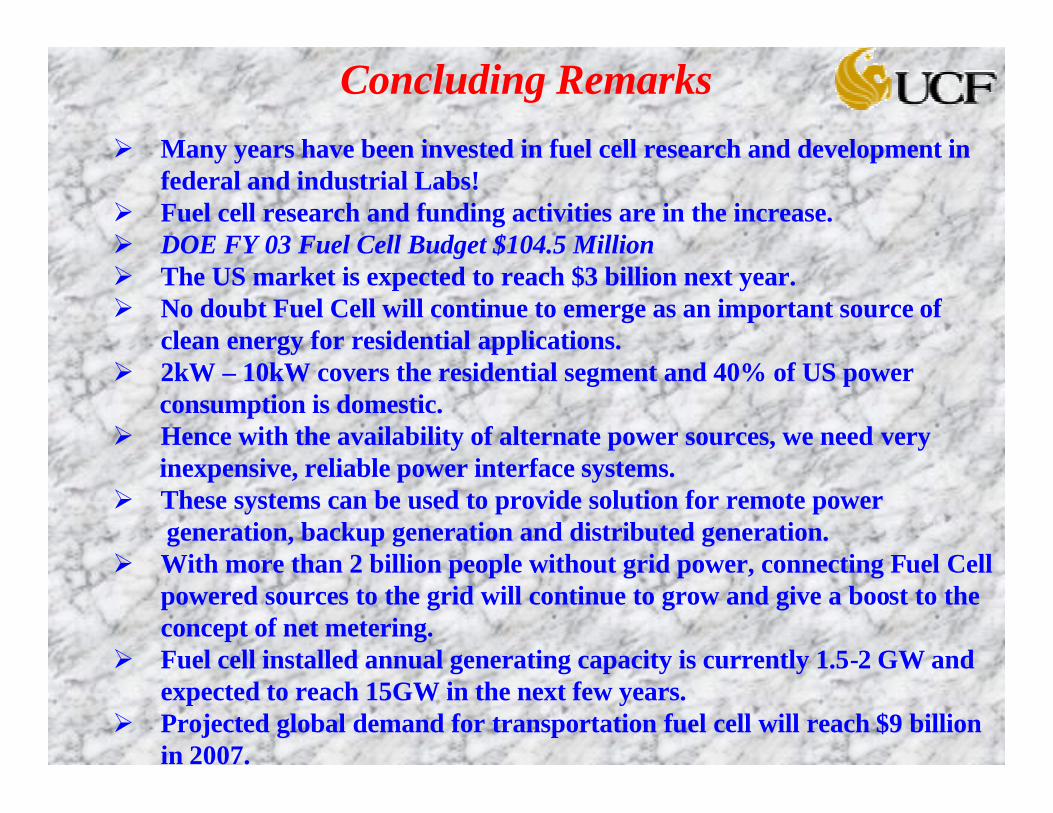
Concluding RemarksØ Many years have been invested in fuel cell research and development in
federal and industrial Labs!Ø Fuel cell research and funding activities are in the increase.Ø DOE FY 03 Fuel Cell Budget $104.5 MillionØ The US market is expected to reach $3 billion next year.Ø No doubt Fuel Cell will continue to emerge as an important source of
clean energy for residential applications.Ø 2kW – 10kW covers the residential segment and 40% of US power
consumption is domestic.Ø Hence with the availability of alternate power sources, we need very
inexpensive, reliable power interface systems.Ø These systems can be used to provide solution for remote power
generation, backup generation and distributed generation.Ø With more than 2 billion people without grid power, connecting Fuel Cell
powered sources to the grid will continue to grow and give a boost to the concept of net metering.
Ø Fuel cell installed annual generating capacity is currently 1.5-2 GW and expected to reach 15GW in the next few years.
Ø Projected global demand for transportation fuel cell will reach $9 billion in 2007.


