14
Power Laws Otherwise known as any semi-straight line on a log-log plot
| Date post: | 21-Dec-2015 |
| Category: |
Documents |
| View: | 217 times |
| Download: | 0 times |

Power Laws
Otherwise known as any semi-straight line on a log-log plot


Self Similar
• The distribution maintains its shape
• This is the only distribution with this property

Fitting a line
• Assumptions of linear Regression do not hold: noise is not Gaussian
• Many distributions approximate power laws, leading to high R2 indepent of the quality of the fit
• Regressions will not be properly normalized
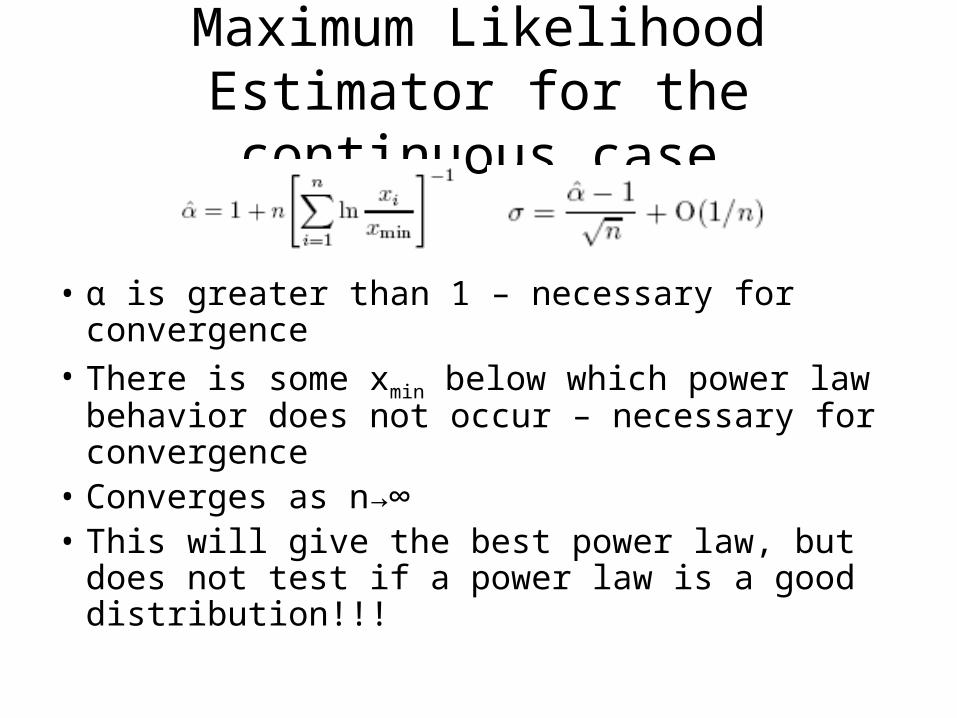
Maximum Likelihood Estimator for the continuous case
• α is greater than 1 – necessary for convergence• There is some xmin below which power law
behavior does not occur – necessary for convergence
• Converges as n→∞• This will give the best power law, but does not
test if a power law is a good distribution!!!

How Does it do?
Actual Value: 2.5
Continuous
Discreet

Error as a function of Xmin and n
For Discreet Data For Continous Data
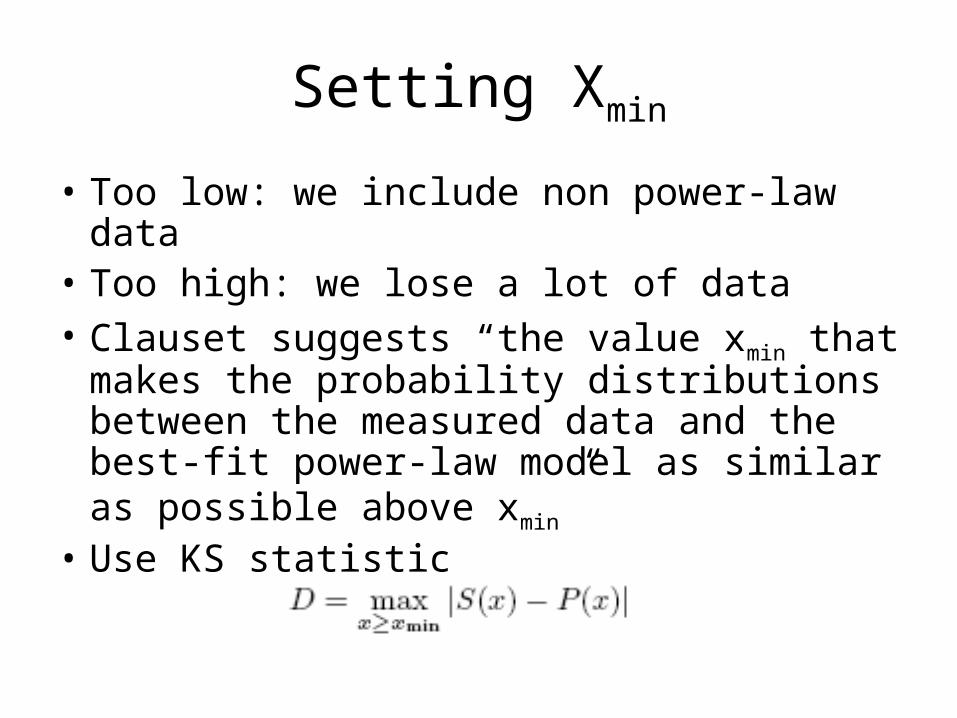
Setting Xmin
• Too low: we include non power-law data• Too high: we lose a lot of data• Clauset suggests “the value xmin that
makes the probability distributions between the measured data and the best-fit power-law model as similar as possible above xmin”
• Use KS statistic

How does it perform?

But How Do We Know it’s a Power Law?
• Calculate KS Statistic between data and best fitting power law
• Find p-value – theoretically, there exists a function p=f(KS value)
• But, the best fit distribution is not the “true” distribution due to statistical fluctuations
• Do a numerical approach: create distributions and find their KS value
• Compare D value to best fit value for each data set• We can now rule out a power law, but can we conclude
that it is a power law?
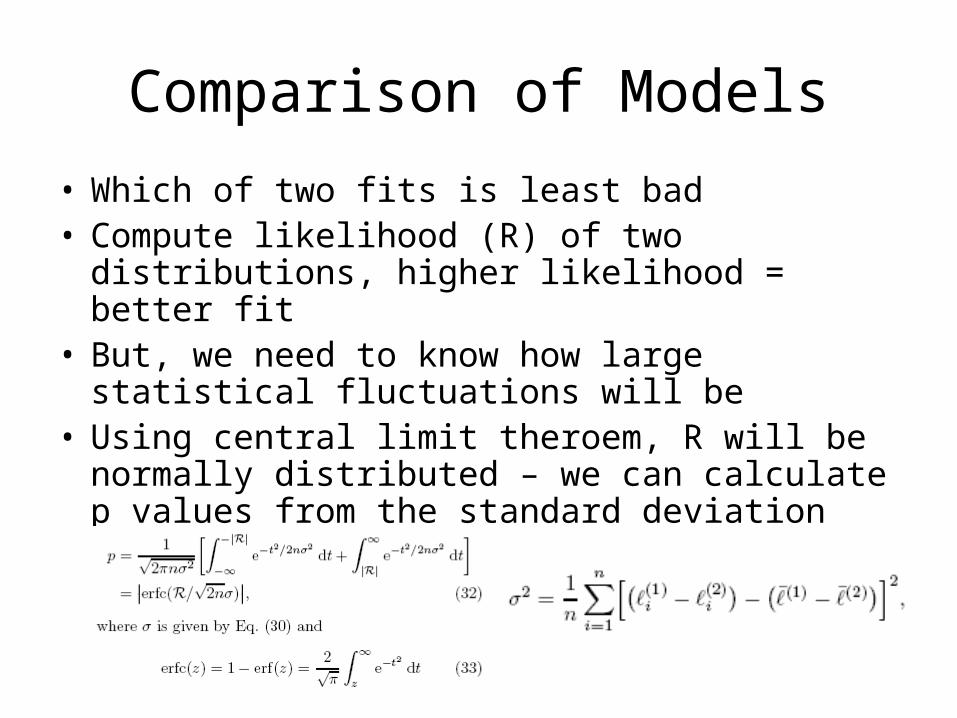
Comparison of Models
• Which of two fits is least bad• Compute likelihood (R) of two distributions,
higher likelihood = better fit• But, we need to know how large statistical
fluctuations will be• Using central limit theroem, R will be normally
distributed – we can calculate p values from the standard deviation

How does real world data stack up?
Mechanisms
• Summation of exponentials
• Random walk – often first return
• The Yule process, whereby probabilities are related to the number that are already present
• Self-organized criticality – the burning forest
Conclusions
• It’s really hard to show something is a power law
• With high noise or few points, it’s hard to show something isn’t a power law


