112
Vol. 157 • No. 5 • May 2013 The Fall of Coal in Ontario Germany’s Energy Policy Gamble Combatting Cooling Water Microbes Small Hydro, Big Opportunity TVA Buys Two B&W SMRs
| Date post: | 12-Nov-2014 |
| Category: |
Documents |
| Upload: | orlando-barrios |
| View: | 76 times |
| Download: | 1 times |

Vol. 157 • No. 5 • May 2013
The Fall of Coal in Ontario
Germany’s Energy Policy Gamble
Combatting Cooling Water Microbes
Small Hydro, Big Opportunity
TVA Buys Two B&W SMRs

Your search for expertise ends
with us. We build better boilers.
Satisfied customers discover the power of our practical knowledge – the ability to design and build
boilers that operate efficiently, safely and cleanly in a variety of industrial applications, including
refining, petro-chemical and power generation. The know-how of our engineers and technicians –
combined with our expanded facilities and equipment, including a new membrane panel welding
machine – results in economic value and competitive advantage for you. We’ve been designing
and building boilers for people who know and care since 1996.
WWW.RENTECHBOILERS.COM
CIRCLE 1 ON READER SERVICE CARD

May 2013 | POWER www.powermag.com 1
ON THE COVEROntario’s Lakeview Generating Station was the first plant to be shut down under the prov-ince’s policy to phase out all coal-fired generation. The four stacks were demolished June 12, 2006; the remainder of the plant was demolished June 28, 2007. Courtesy: Richard Lautens/GetStock.com
COVER STORY: ENERGY POLICY26 Ontario Goes Coal-Free in a Decade
By the end of this year, the Canadian province of Ontario will have gone from 25% to virtually 0% coal-fired generation in just 10 years. Though the policy path wasn’t entirely smooth, the transition happened remarkably fast—for the power industry. Here’s a look at why Ontario made the switch, how it landed on its feet with a healthy capacity surplus, and what this achievement might mean for other regions and na-tions with coal-free aspirations.
SPECIAL REPORTS
ENERGY POLICY
34 Germany’s Energy Transition ExperimentGermany’s recent energy policy developments have attracted worldwide attention because they have been dramatic, swift, and full of implications for this industrial and economic powerhouse. From massive distributed solar power deployments to a nuclear phaseout to a generous feed-in-tariff, the results have been applauded by some and decried by others. Germany’s situation is complicated—and worth under-standing for anyone wishing to make policy comparisons.
NUCLEAR POWER
54 OPG Proposes New Nuclear Construction at DarlingtonWith one eye on the 2020 retirement date for its Pickering Nuclear Generating Sta-tion and the other on long-term baseload capacity needs, Ontario Power Generation is moving ahead with plans to build two new units at its Darlington site. We review the project status and regulatory process.
RENEWABLES
60 Small Hydro, Big OpportunityBig hydropower projects may be a thing of the past—in the U.S., at least—but there’s plenty of potential for new small and micro hydropower projects. More remarkable is that developing unconventional hydro resources has bipartisan political support.
26
Established 1882 • Vol. 157 • No. 5 May 2013
Connect with POWERIf you like POWER magazine, follow us online (POWERmagazine) for timely industry news
and comments.
Become our fan on Facebook Follow us on Twitter
Join the LinkedIn POWER magazine Group
34
54

www.powermag.com POWER | May 20132
FEATURES
NUCLEAR POWER
68 Are SMRs U.S. Nuclear Power’s Last, Best Hope?Babcock & Wilcox’s mPower is the first small modular reactor to garner Department of Energy support, and the first deployment of this new-generation reactor, with Tennessee Valley Authority, involves a surprising twist in the licensing process.
POWER VIEW
74 mPower: It’s Now or NeverChristofer Mowry, president of Babcock & Wilcox mPower Inc. and CEO of Genera-tion mPower LLC, discusses his company’s candidate in the new nuclear power race as well as the market for small modular reactors.
POWER IN CHINA
76 China Wrestles with Power ShortagesSince 1978, China has experienced three periods of nationwide power shortages that have severely restricted its economic and social development. The first two “hard shortages” were easier to address than the current “soft shortage.”
WATER TREATMENT
80 Microbial Control in Cooling Water Improves Plant PerformanceThe installed cost of a new chemical feed system at an AEP plant was approximately $106,000—less than the $203,000 cost savings enjoyed by just a single unit during a 45-day trial period of an improved biocide control program.
INSTRUMENTATION & CONTROL
88 Mexico Uses Nuclear Plant Simulator for Safe TrainingLaguna Verde Nuclear Power Plant in Veracruz introduced a stand-alone process simulator that allows trainees to practice a wide variety of plant operations and responses to incidents without putting the plant itself at risk.
EMISSIONS
92 CFB Scrubbing: A Flexible Multipollutant TechnologyIn an era of regulatory ambiguity, selecting the most flexible air quality control sys-tem looks like the prudent choice. Foster Wheeler Global Power Group makes the case for circulating fluidized bed scrubbing as a contender.
DEPARTMENTS
SPEAKING OF POWER6 Bait and Switch
GLOBAL MONITOR8 India’s First Coal Mine–Integrated Supercritical Plant Synchronized9 Construction Begins at Two U.S. Nuclear Reactors 10 THE BIG PICTURE: Critical Energy Agendas11 Solar Thermal Gains in UAE, Spain, and California14 First Power for 1-MW Tidal Stream Turbine16 POWER Digest
FOCUS ON O&M18 Performance-Driven Maintenance21 Lithium-Ion Batteries: A Potential Fire Hazard
LEGAL & REGULATORY24 EPA Not Backing Down on Title V Source Rules By Thomas W. Overton, JD
102 NEW PRODUCTS
COMMENTARY108 A Safety Milestone at NV Energy By Dariusz Rekowski, NV Energy executive over power generation
Get More POWER
on the WebOnline, associated with this issue (on our
homepage, www.powermag.com, during
the month of May, or in our Archives any
time), you’ll find the latest installment
of Too Dumb to Meter: Follies, Fiascoes,
Dead Ends, and Duds on the U.S. Road to
Atomic Energy with the chapters “Out of
Sight and Mind” and “Holey Kansas.”
And remember to check our What’s
New? segment on the homepage regu-
larly for just-posted news stories cover-
ing all fuels and technologies.
68
88
9

www.rolls-royce.com
A natural fit for any environment.
...support today’s energy markets with outstanding adaptability
and flexibility making it a natural fit for any environment. It is
the most efficient and powerful aeroderivative gas turbine
designed for cyclic operation, fast starting and restarting,
unsurpassed load rates and environmental performance.
The Trent 60 with its unrivalled availability and reliability
combines these formidable traits to blend seamlessly and profitably
into your operating conditions.
Trent 60 attributes...
Trusted to deliver excellence
CIRCLE 2 ON READER SERVICE CARD

www.powermag.com POWER | May 20134
EDITORIAL & PRODUCTION Editor-in-Chief: Dr. Robert Peltier, PE
480-820-7855, [email protected]
Managing Editor: Dr. Gail Reitenbach
Executive Editor: David Wagman
Gas Technology Editor: Thomas Overton, JD
Senior Writer: Sonal Patel
European Reporter: Charles Butcher
Contributing Editors: Mark Axford; David Daniels; Steven F. Greenwald; Jeffrey P. Gray;
Jim Hylko; Kennedy Maize; Dick Storm; Dr. Justin Zachary
Graphic Designer: Joanne Moran
Production Manager: Tony Campana, [email protected]
Marketing Director: Jamie Reesby
Marketing Manager: Jennifer Brady
ADVERTISING SALES Sales Manager: Matthew Grant
Southern & Eastern U.S./Eastern Canada/
Latin America: Matthew Grant, 713-343-1882, [email protected]
Central & Western U.S./Western Canada: Dan Gentile, 512-918-8075, [email protected]
UK/Benelux/Scandinavia/Germany/
Switzerland/Austria/Eastern Europe: Petra Trautes, +49 69 5860 4760, [email protected]
Italy/France/Spain/Portugal: Ferruccio Silvera, +39 (0) 2 284 6716, [email protected]
Japan: Katsuhiro Ishii, +81 3 5691 3335, [email protected]
India: Faredoon B. Kuka, 91 22 5570 3081/82, [email protected]
South Korea: Peter Kwon, +82 2 416 2876, +82 2 2202 9351, [email protected]
Thailand: Nartnittha Jirarayapong, +66 (0) 2 237-9471, +66 (0) 2 237 9478
Malaysia: Tony Tan, +60 3 706 4176, +60 3 706 4177, [email protected]
Classified Advertising
Diane Burleson, 512-250-9555, [email protected]
POWER Buyers’ Guide Sales
Diane Burleson, 512-250-9555, [email protected]
AUDIENCE DEVELOPMENT Audience Development Director: Sarah Garwood
Fulfillment Manager: George Severine
CUSTOMER SERVICE For subscriber service: [email protected], 800-542-2823 or 847-763-9509
Electronic and Paper Reprints: Wright’s Media, [email protected], 877-652-5295
List Sales: Statlistics, Jen Felling, [email protected], 203-778-8700
All Other Customer Service: 713-343-1887
BUSINESS OFFICE TradeFair Group Publications, 11000 Richmond Avenue, Suite 690, Houston, TX 77042
Vice President and Publisher: Brian K. Nessen, 713-343-1887, [email protected]
Vice President, Energy and Engineering Events: Daniel McKinnon
ACCESS INTELLIGENCE, LLC 4 Choke Cherry Road, 2nd Floor, Rockville, MD 20850
301-354-2000 • www.accessintel.com Chief Executive Officer: Donald A. Pazour
Exec. Vice President & Chief Financial Officer: Ed Pinedo
Exec. Vice President, Human Resources & Administration: Macy L. Fecto
Divisional President, Business Information Group: Heather Farley
Senior Vice President, Corporate Audience Development: Sylvia Sierra
Senior Vice President & Chief Information Officer: Robert Paciorek
Vice President, Production & Manufacturing: Michael Kraus
Vice President, Financial Planning & Internal Audit: Steve Barber
Vice President/Corporate Controller: Gerald Stasko
Visit POWER on the web: www.powermag.com
Subscribe online at: www.submag.com/sub/pw
POWER (ISSN 0032-5929) is published monthly by Access In-
telligence, LLC, 4 Choke Cherry Road, Second Floor, Rockville,
MD 20850. Periodicals Postage Paid at Rockville, MD 20850-
4024 and at additional mailing offices. Ride-Along Enclosed.
POSTMASTER: Send address changes to POWER, P.O. Box
2182, Skokie, IL 60076. Email: [email protected].
Canadian Post 40612608. Return Undeliverable Canadian
Addresses to: PitneyBowes, P.O. BOX 25542, London, ON
N6C 6B2.
Subscriptions: Available at no charge only for qualified ex-
ecutives and engineering and supervisory personnel in elec-
tric utilities, independent generating companies, consulting
engineering firms, process industries, and other manufactur-
ing industries. All others in the U.S. and U.S. possessions:
$87 for one year, $131 for two years. In Canada: US$92 for
one year, US$148 for two years. Outside U.S. and Canada:
US$197 for one year, US$318 for two years (includes air
mail delivery). Payment in full or credit card information is
required to process your order. Subscription request must
include subscriber name, title, and company name. For new
or renewal orders, call 847-763-9509. Single copy price: $25.
The publisher reserves the right to accept or reject any order.
Allow four to twelve weeks for shipment of the first issue on
subscriptions. Missing issues must be claimed within three
months for the U.S. or within six months outside U.S.
For customer service and address changes, call 847-763-
9509 or fax 832-242-1971 or e-mail powermag@halldata
.com or write to POWER, P.O. Box 2182, Skokie, IL 60076.
Please include account number, which appears above name
on magazine mailing label or send entire label.
Photocopy Permission: Where necessary, permission is
granted by the copyright owner for those registered with
the Copyright Clearance Center (CCC), 222 Rosewood Drive,
Danvers, MA 01923, 978-750-8400, www.copyright.com, to
photocopy any article herein, for commercial use for the flat
fee of $2.50 per copy of each article, or for classroom use
for the flat fee of $1.00 per copy of each article. Send pay-
ment to the CCC. Copying for other than personal or internal
reference use without the express permission of TradeFair
Group Publications is prohibited. Requests for special per-
mission or bulk orders should be addressed to the publisher
at 11000 Richmond Avenue, Suite 690, Houston, TX 77042.
ISSN 0032-5929.
Executive Offices of TradeFair Group Publications: 11000
Richmond Avenue, Suite 690, Houston, TX 77042. Copyright
2013 by TradeFair Group Publications. All rights reserved.

35,000 hours.Zero varnish.
In the battle against time and varnish, next-generation Diamond Class® Turbine Oil is a clear winner, proven to resist varnish
formations for more than 35,000 hours in lab tests. Also monitored in severe-duty turbines in power plants in Texas and South
Carolina, reformulated Diamond Class Turbine Oil has produced no varnish deposits after 15,000-plus hours of continuous service.
And counting. Get long-lasting turbine protection. Call 877.445.9198 or visit phillips66lubricants.com to learn more.
© 2013 Phillips 66 Company. Phillips 66, Conoco, 76, Diamond Class and their respective logos are registered trademarks
of Phillips 66 Company in the U.S.A. and other countries. T3-TRI-14280B
CIRCLE 3 ON READER SERVICE CARD

www.powermag.com POWER | May 20136
SPEAKING OF POWER
Bait and Switch
The Boxer-Sanders “Climate Protection Act” and its sister bill, the “Sustainable Energy Act” are the latest, and perhaps
the most onerous, in a series of legislative proposals that seek to tap the immense rev-enue stream promised by taxing carbon.
Sen. Barbara Boxer (D-Calif.), chair of the Environment and Public Works Committee, recently signed on as a co-sponsor of Sen. Bernie Sanders’ (I-Vt.) “fee and dividend” carbon tax legislative proposal. The law would impose a “fee” on carbon emissions at their source and rebate a “dividend” to “legal residents of the U.S.” for a portion of the cost impact of the tax, along with other incentives. The legislation carefully substi-tutes the more benign “fee” in place of the more pejorative “tax,” which it is. The gov-ernment will also slice off a healthy portion of the carbon tax revenue for its own use.
The legislative proposals enable collec-tion of the tax beginning at $20 per ton of carbon or methane equivalent emissions, rising at a rate of 5.6% a year for 10 years (effectively a 72.4% compounded increase). The tax would be extracted at the point of sale as well as from fossil fuel import-ers. Sanders estimates his carbon tax plan would generate about $1.2 trillion in new government revenue over the first 10 years covered by the legislation, although the legislation is written with a much longer effective period in mind, through 2050.
The legislation also directs the govern-ment how to spend its newly collected bounty. A portion of the proceeds will be used for infrastructure improvements, about 60% would be distributed to resi-dents in the form of rebates and other ef-ficiency projects, and the balance, about 25% of the revenue, will go to the federal government for deficit reduction, which is a meaningless gesture unless matching expenditures are simultaneously curbed. The scheme has a little something for al-most everyone, no doubt intended to at-tract the necessary votes for passage.
The Rest of the StoryThe sales pitch obviously self-identifies as the old bait-and-switch scheme. The “bait” for legislators is each gets to “bring home the bacon” in the form of rebate checks to
voters and huge new tax revenues for the federal government. For carbon control pro-ponents, the bait is found in the Sanders/Boxer Climate Legislation summary: “setting a long-term emission reduction goal of 80 percent or more by 2050 as science calls for.” For the rest of us, we are being asked to defer to the “experts” and believe that anthropogenic emissions cause an increase in global average ambient temperatures, an assumption that current facts don’t support (see “Where’s the Warming?” February 2013).
This statement is a standard rhetorical de-vice known as an argument from authority, certainly not the foundation upon which to build a multi-trillion-dollar tax structure.
The “switch” part of the scheme comes in two parts. The first part is found in the body of the legislation. Sanders’ response to the “crisis facing our planet [that] is much more serious than they [scientists] had previously believed” is to propose baby steps for the first 10 years, when huge leaps in emissions reductions are required, if you believe the rationale for the legislation. Yet, over the first 10 years the proposed carbon tax will have no discernible impact on global average temperatures, ostensibly the basis of the legislation.
The second part of the switch is what happens in the out years. Assuming emis-sions decrease by 20% during the first decade, the tax rate will necessarily sky-rocket to achieve the overall goal of 80% reduction by 2050. Physics reminds us that the difficulty and cost of the last 20% will be exponentially higher than the relatively easy first 20% reduction. After a decade, the carbon tax will metastasize through-out the economy and the government will be addicted to the cash.
NERA Economic Consulting has also studied the potential effects of a carbon tax based on a more conservation 4% an-nual increase of the introductory $20/
ton carbon tax rate plus a projection of the large increase in the carbon tax rate necessary to achieve the 80% reduction by 2050 goal and prepared its analysis in the report “Economic Outcomes of a U.S. Carbon Tax.” NERA concludes that a “car-bon tax would have a devastating impact” on the economy due to higher prices for natural gas and electricity and other energy commodities causing “output in energy in-tensive industries [to] drop by as much as 15 percent and 7.7 percent in non-energy
intensive sections,” according to National Association of Manufacturers Vice President Ross Eisenberg, quoting report findings. For example, the report predicts the price of gasoline will be $14.57 per gallon in 2053, with $9.06 in tax, compared to $5.51 per gallon with no carbon tax baseline. NERA concluded that a carbon tax under an “80% reduction tax case” would cost the econo-my up to 20 million jobs by 2053 and would reduce wages about 7% and wage growth over 8% due to increased cost of energy.
Practice PatienceThe most current Environmental Protection Agency data shows that U.S. greenhouse gas (GHG) emissions were 11.8% less in 2012 than in 2005 (the proposed baseline year). The trend in emissions reductions already has a negative slope without a carbon tax. In fact, fuel switching from coal to gas will surely further depress GHG emissions in the coming years.
A sense of urgency is noticeably absent in this legislation. I also counsel patience. Allow the economy to recover and encour-age its continuing transition to domestic oil and gas production, and we’ll watch the carbon emissions continue to decline. A soft landing is always preferable to a crash and burn. ■
—Dr. Robert Peltier, PE is POWER’s
editor-in-chief.
[The carbon tax] sales pitch obviously self-
identifies as the old bait-and-switch scheme.

The Cat® team shares your focus on protecting your customers – and your
good name. You’ll have a total power solution that delivers the 100 percent
uptime data centers require, with easy installation and the lowest total cost
of ownership. See why the world’s largest search engines, social media
sites and software companies rely on Cat power systems. We keep the
power on, so you can keep your mind on getting things done.
www.catelectricpowerinfo.com/POWER
CAT, CATERPILLAR, their respective logos, “Caterpillar Yellow,” the “Power Edge” trade dress, as well as corporate
and product identity used herein, are trademarks of Caterpillar and may not be used without permission.
© 2013 Caterpillar. All Rights Reserved.
WE BOTH HAVE A REPUTATION TO UPHOLD. YOURS.
INTRODUCING THE CAT C175-20, THE WORLD’S FIRST 4 MW HIGH-SPEED GENERATOR SET.
CIRCLE 4 ON READER SERVICE CARD

www.powermag.com POWER | May 20138
India’s First Coal Mine–Integrated Supercritical Plant Synchronized India’s Reliance Power in March synchronized the first of six 660-MW units of its Sasan Ultra Mega Power Plant (UMPP) in the state of Madhya Pradesh, readying it to supply power to 14 distribu-tion companies across seven states. The plant (Figure 1) has been hailed as India’s first supercritical project to integrate a coal mine—an important achievement in a country that is battling chronic coal shortages. Though India has large coal reserves, do-mestic mining companies are struggling to keep up with demand needed to sustain its existing coal plants, which account for 55% of its generation.
Located in Singrauli—India’s emerging energy capital and a locale that has installed nearly 10 GW of coal projects because it is near an artificial lake and rich coal deposits—the Sasan pit-head plant has been allocated three captive coal mine blocks, which have reserves of more than 750 million tons. The com-pany says it could complete the 4,000-MW plant’s five other units within the next 15 to 20 months, ahead of schedule.
The project was the first of India’s UMPPs prioritized by the power- and fuel-short country’s government under a program to inject increased private investment into power generation. A ma-jor initiative of the 11th Plan (which ran from 2007 to 2012), power purchase agreements have so far been signed for four UMPPs of 4,000 MW each on a build-own-operate basis and competitive tariff-based bidding.
Between 2007 and 2009, Reliance Power won bids for three of these projects: In addition to the Sasan project in Madhya Pradesh, it is also building the six-unit 3,960-MW Krishnapatnam plant in Andhra Pradesh and the similar 3,960-MW Tilaiya project in Jharkhand.
A source at India’s Ministry of Power told POWER this March that Reliance has halted all work at the Krishnapatnam project site while it awaits a decision from the Indian Arbitrator Coun-cil on an appeal of a crippling June 2012 decision by the Delhi High Court. The court denied a petition from Reliance to block 11 state utilities from imposing $73 million in fines, cashing in $55 million in bank guarantees, terminating power purchase agreements, and recovering land allotted for the coal plant for Reliance’s failure to implement the project on time. Reliance had declared “force majeure,” arguing that the project was not viable because new rules by the Indonesian government resulted in a 150% surge in imported coal prices. At Tilaiya, meanwhile, con-struction of the plant awarded to Reliance in 2009 has been held up because land had not been handed over to the developer by the Jharkhand state government.
The fourth UMPP, in Mundra, Gujarat, is owned by Tata Power. Four of the five 800-MW units were commissioned between March 2012 and January 2013. The fifth unit has been synchronized to the grid and is expected to be commissioned soon.
Both Tata Power and Reliance have recently approached the country’s Central Electricity Regulatory Commission seeking high-er power tariffs, citing increased generation and operation costs that are pegged to higher water prices in some states. Federally owned coal mining company Coal India’s increased prices for do-mestic coal, renewables surcharges, and an excise duty by the Indian government also add to costs, they say.
India’s acute energy shortage stems from severe supply side con-straints, particularly coal and gas shortages, that are expected to
continue in the near future. Even so, the country’s planning com-mission last September increased its new generating capacity target from 76 GW to more than 88.4 GW—the bulk from new coal capac-ity—over its 12th Plan period, which runs from 2012 to 2017. The new capacity would “bridge the gap between peak demand and peak deficit, and provide for faster retirement of the old energy inefficient plants,” the commission’s planning document says.
The 11th Plan sought to add 78.6 GW—but only achieved close to 52 GW. Observers note that nearly 90 GW is under construc-tion, however. The 12th Plan should see additions of up to 11.9 GW of new hydro, 5.3 GW of new nuclear, and imports of 1.2 MW of hydropower from Bhutan.
About 50% of planned coal-based capacity for the 12th Plan is expected to use supercritical technology. Only 11 supercritical plants, with a total capacity of 7.4 GW, had been installed as of December 2012, but the government blames delays on the “un-certainties” regarding imported fuel supply. Even so, at least 12 supercritical UMPPs are planned for the states of Chhattisgarh, Gujarat, Tamil Nadu, Andhra Pradesh, Odisha, Maharashtra, and Karnataka, the government notes.
Meanwhile, in March, India established a target to install 30 GW of renewable power during its 12th Plan. A total of 27 GW of renewable capacity has so far been installed across the coun-try, bringing renewables’ share to about 12.5% of India’s total in-stalled power capacity of 213 GW. More than half (12.4 GW) of that renewable capacity was added over the past three years. The newly formulated Integrated Energy Policy calls for 15 GW of new wind power installation, most (about 7 GW) in the southern state of Tamil Nadu. About 19 GW of wind has already been installed. Plans also call for 10 GW of new solar and 2.1 MW from small hydro. The balance is expected to be made up by planned biomass power.
The Indian Ministry of New and Renewable Energy said it would provide various fiscal and financial incentives—such as capital/interest subsidies, accelerated depreciations, and customs du-ties—to promote renewable capacity additions. Utilities are also expected to receive “preferential” tariffs for renewable power pur-chase agreements, and the government said it would introduce re-newable energy certificates and a renewable purchase obligation.
1. A pit-head plant. India’s Reliance Power synchronized the first
of six supercritical units of its Sasan Ultra Mega Power Plant (UMPP)
in Madhya Pradesh. The plant has been allocated three captive coal
mine blocks. That is significant because, though India has large coal
reserves, domestic mining companies are struggling to keep pace with
demand from existing coal plants, which account for 55% of the na-
tion’s generation. Courtesy: Reliance Power

May 2013 | POWER www.powermag.com 9
The planning document says energy ef-ficiency will be India’s most cost-effective option for achieving short- to medium-term energy savings. India recently initi-ated the National Mission for Enhanced Energy Efficiency under the National Ac-tion Plan for Climate Change, outlining necessary technologies, financing, and fiscal incentives, and even creating en-ergy efficiency as a market instrument.
Construction Begins at Two U.S. Nuclear Reactors In the U.S., where construction of new nuclear reactors has stalled for three decades, two separate nuclear projects completed placement of basemat struc-tural concrete for new AP1000 reactors a few days apart this March. SCANA Corp.’s South Carolina Electric & Gas Co. (SCE&G) marked the milestone on March 11 (Figure 2), completing concrete placement of the nuclear island basemat for its V.C. Summer Unit 2 in Fairfield, S.C., while Southern Co.’s Georgia Power completed placement for a nuclear island at its Vogtle Unit 3 nuclear expansion site near Waynesboro, Ga., on March 14 (Figure 3).
Each company has proposed two West-inghouse AP1000 reactors for its chosen site. The basemat provides a foundation for the containment and auxiliary build-ings that are within the nuclear island. About 6 feet thick, it requires 7,000 cu-
bic yards of concrete, taking—in SCE&G’s case at least—51.5 hours of continuous concrete pour to cover a surface total-ing about 32,000 square feet. Units 2 and 3 at V.C. Summer are scheduled to enter commercial operation in 2017 and 2018,
©2
01
3 B
ran
d S
erv
ice
s, L
LC
All R
igh
ts R
ese
rve
d.
Providing you access to
the safest, smartest and
most efficient specialty
services.
Brand is the leading provider of integrated specialty services to the power industry.
Our unique multi-service approach delivers significant savings to our clients on their
maintenance, outages and capital projects by reducing manpower requirements,
improving communication through a single point of contact, and ultimately, delivering
enhanced productivity.
For more information contact us at:
281.404.9397 or [email protected]
SCAFFOLDING | COATINGS | INSULATION | REFRACTORY | FIREPROOFING | CUI MANAGEMENT
HOT TAPPING | CATHODIC PROTECTION | FORMING AND SHORING | FIELD MACHINING
Creating Client VALUE is our Business
CIRCLE 5 ON READER SERVICE CARD
2. A long haul. Within one week this
March, SCANA Corp. and Southern Co. sepa-
rately completed placement of nuclear island
basemat for the first AP1000 reactors under
construction at the V.C. Summer site in South
Carolina and the Plant Vogtle site in Georgia.
This image shows workers laying the 6-foot-
thick basemat for the nuclear island of V.C.
Summer Unit 2. The task required about 7,000
cubic yards of concrete to cover an area 250
feet long and 160 feet at its widest section.
The pour lasted 51.5 hours. Courtesy: SCE&G
3. Pressing on. Placement of basemat
structural concrete for the nuclear island at
Vogtle Unit 3 near Waynesboro, Ga., was
completed in March. Georgia Power said full
outlines of both nuclear islands at Vogtle have
been completed to “grade level.” The first full
components for erecting the Unit 3 contain-
ment vessel are completed and staged for
installation once the basemat concrete has
cured, including the CR10 cradle and the
containment vessel bottom head. Courtesy:
Georgia Power

www.powermag.com POWER | May 201310
THE BIG PICTURE: Critical Energy AgendasThe global energy sector will need to invest half of current world gross domestic product over the next two decades in order to address a number of critical issues and expand and adapt the energy infrastructure, the London-based World Energy Council (WEC) says in its recently released World Energy Issues Monitor. Here are the most pressing issues affecting three regions. The top-left quadrant of each regional map represents issues of high uncertainty and high impact; the top-right quadrant covers issues of high impact but of higher certainty—things that keep energy leaders busy. The bottom-left quadrant represents issues of perceived lesser importance (or those that are poorly understood), and the bottom-right quadrant presents issues of low impact and high certainty. Bubbles are proportional to the urgency of an issue. Source: WEC (www.worldenergy.org)
–Copy and artwork by Sonal Patel, senior writer
Macro-economic GeopoliticalBusiness
environment
Vision/
technology
EUROPE ASIANORTH AMERICA
IMPA
CT
UNCERTAINTY
ENERGY
EFFICIENCY
ENERGY
PRICES
CLIMATE
FRAME-
WORK
CCS
HYDROGEN
ECONOMY
ELECTRIC
STORAGE
EU
COHESIONBRAZIL
CORRUPTION
U.S.
POLICY
BUSINESS
CYCLE
LARGE-
SCALE
ACCIDENTS
COMMODITY
PRICES
NUCLEAR LARGE
HYDRO
TALENT
TRADE
BARRIERS
RENEWABLES
REGIONAL
INTERCONNECTIONS
ENERGY
SUBSIDIES
CHINA/
INDIA
SMART
GRID
HYDROGEN
ECONOMY
TRADE
BARRIERS
ENERGY-
WATER
NEXUS
CORRUPTION
BRAZIL
ENERGY-
WATER
NEXUS
BUSINESS
CYCLE
COMMODITY
PRICES
CCSU.S.
POLICY LARGE
HYDRO
TALENT
ELECTRIC
VEHICLES
SMART
GRID
EU
COHESION REGIONAL
INTERCONNECTIONS
ENERGY
SUBSIDIES
NUCLEAR
CLIMATE
FRAME-
WORK
ENERGY
PRICES
RENEWABLES
CHINA/
INDIA
RUSSIA
LARGE-
SCALE
ACCIDENTS
ENERGY
EFFICIENCYUNCONVENTIONALS
NUCLEAR
TALENT
BRAZILEU
COHESION
RUSSIA
CORRUPTION
RENEWABLES
COMMODITY
PRICES
CCS
LARGE
HYDROREGIONAL
INTERCONNECTIONS
TRADE
BARRIERS
U.S.
POLICY
ENERGY
EFFICIENCY
BUSINESS
CYCLE
ENERGY
PRICESSMART
GRID
HYDROGEN
ECONOMY ELECTRIC
STORAGE
CHINA/
INDIAELECTRIC
VEHICLES
ENERGY
SUBSIDIES
ENERGY-
WATER
NEXUS
CLIMATE
FRAME-
WORK
LARGE-
SCALE
ACCIDENTS
ELECTRIC
STORAGE
UNCONVENTIONALS
UNCONVENTIONALS
ELECTRIC
VEHICLES

May 2013 | POWER www.powermag.com 11
and Units 3 and 4 at Plant Vogtle are to begin operation in 2017 and 2018.
Solar Thermal Gains in UAE, Spain, and CaliforniaSolar thermal technologies are experiencing increased popularity around the world. Three recent deployments illustrate how the technology and plant size specifics are tuned to local needs.
The United Arab Emirates (UAE) this March saw the inaugura-tion of the 100-MW Shams 1 concentrated solar power (CSP) plant, a $600 million project that took three years to build in the western emirate of Abu Dhabi, at the heart of the coun-try’s hydrocarbon industry. Spanning a square mile, the project is currently the world’s largest CSP plant, in terms of both power capacity and size. It features more than 58,000 mirrors mounted on 768 tracking parabolic trough collectors.
By concentrating heat from direct sunlight onto oil-filled pipes, Shams 1 (Figure 4) produces steam, which drives a turbine, and generates electricity. The solar project reportedly uses a natural gas–fired superheater to boost steam temperatures (from 380C to 540C) before it enters the turbine to dramatically increase the cycle’s ef-ficiency. It also includes a dry-cooling system that significantly re-duces water consumption—“a critical advantage in the arid desert of western Abu Dhabi,” said its developer, which is a joint venture comprising UAE renewables firm Masdar, France’s Total, and Spain’s Abengoa Solar. At least 66 national companies reportedly contrib-uted with direct contracts to different phases of the project.
The UAE is seeking to vastly increase its power supplies to fuel a rapidly growing economy and expected population surge (the popu-lation shot up from 2.4 million in 1995 to 7 million in 2011). The country also suffers an extreme climate, with summer temperatures well over 50C, and water scarcity, which means all drinking water must be desalinated. The Abu Dhabi and Dubai emirate govern-ments have backed renewables as a means to reduce dependence on their fossil fuel revenues. Another reason is that domestic con-sumption of produced units of oil and gas, which fetch stellar prices when exported, represent a substantial loss.
Abu Dhabi means to source 7% (1,500 MW) of its total capacity from renewables by 2020, while Dubai has a target of 5% (1,000 MW) by 2030. Several other massive solar plants are in the off-ing. This year will see the start of operations at the 100-MW Noor 1 photovoltaic plant in Abu Dhabi, for example. The UAE is also
SOME THINK LONG-DISTANCE TRANSPORT IS INFRASTRUCTURE- INTENSIVE. WE THINK DIFFERENT.Transporting materials from remote locations has tradition-ally required signifi cant infrastructure investments in road or rail links, vehicles, personnel and fuel. BEUMER o ers an economical, e cient and environmental alternative – long-distance overland conveying. This gives you a dedicated, around-the-clock transport link at the fraction of the cost of infrastructure development. The reduced noise and air pollution minimises environmental impact and improves personnel safety. Add to that a high degree of design fl exi-bility and customisation and you can see why overland conveying makes a big di erence to operational e ciency and environmental protection.For more information, visit www.beumergroup.com
Visit us!POWER-GEN EuropeVienna, Austria4 – 6 June 2013Hall A, Stand 1343
CIRCLE 6 ON READER SERVICE CARD
4. A desert giant. The 100-MW Shams 1 concentrating solar
power project in Madinat Zayed, in western Abu Dhabi, was officially
opened this March. One of the world’s largest parabolic trough proj-
ects in terms of power capacity and size, the plant uses dry cooling to
reduce water consumption. Courtesy: Abengoa Solar

www.powermag.com POWER | May 201312
looking to kick-start a nuclear program, awarding a South Korean consortium $20 billion to build four commercial nuclear power re-actors totaling 5.6 GW by 2020. Construction of Barakah Unit 1 by Emirates Nuclear Energy Corp. began in July 2012.
In March, Spain’s CSP industry group announced that two new twin parabolic trough plants, Termosol 1 and 2, came online at Navalvillar de Pela. Built by U.S.-based NextEra, the plants have a nominal output of 50 MW each (Spain’s government has limited the size of CSP plants to 50 MW) and feature a thermal storage sys-tem of up to 9 hours. At least six more parabolic trough plants are under construction in Spain. Set to become operational later this year, the plants will bring the nation’s CSP capacity to 2,354 MW.
And in the U.S., BrightSource Energy, a developer of the 377-
MW Ivanpah solar thermal plant under construction in California’s Mojave Desert, said the plant’s Unit 1 (Figure 5) reached a “first flux” in February, a major milestone that is achieved when a sig-nificant amount of sunlight is reflected off more than 1,000 solar field mirrors and onto the solar receiver. “The flux slowly heated the water inside the boiler to just below the point of steam gen-eration,” BrightSource said in an update. “Before [February’s] first flux, the maximum amount of heliostats aimed at the boiler was 5-10 at a time for heliostat calibration.” The solar plant is owned jointly by NRG Energy, BrightSource, and Google. Unit 1 is more than 90% complete, according to Bechtel Corp, BrightSource’s en-gineering, procurement, and construction partner at Ivanpah. Unit 2 is 80% complete; Unit 3 is about 70% complete.
CIRCLE 7 ON READER SERVICE CARD
5. First flux. At about 4 p.m. on Feb. 25, more than 1,000 heliostats focused onto the Unit 1 solar receiver at BrightSource Energy’s 377-MW
Ivanpah solar thermal plant under construction in California’s Mojave Desert. The “first flux” is a major milestone in the construction of a solar
power plant, designating when a significant amount of sunlight is reflected off the solar field mirrors. Courtesy: BrightSource Energy
www.victoryenergy.com | tel : 918.274.0023 | hot l ine: 877.783.2665
F O L L O W A L E A D E R
Patented HRSG design solutions
for combustion turbine and
process exhaust streams
Shop-assembled modular solutions
minimizeconstruction/ieldcost
Industry’s highest steam production
eficienciesforreinementand processing applications
Long-term reliability under the most
extreme demands
Full line of economizers and
industrial-duty air pre-heaters
Thermal oil heaters and other
secondary heat recovery
equipment
Modularization minimizes time and
laborcostsintheield
Unparalleled in-house engineering
staffbringsapplicationspeciic expertise to every project
COMPLETE MODULARIZATION
Specializing in advanced steam generation technology and heat recovery applications.
INNOVATIVE BOILER DESIGN
C0GENERATION EXPERTISE
PROVEN EFFICIENCIES

F L E X C O . C O M
Name:
Dan Wagoner, Superintendent
Engineering & Maintenance,
Dominion Terminal Associates
On Partnering With Us:
“I don’t think you can do any better than Flexco.”
Dan relies on Flexco because he knows lost material is lost revenue.
Dominion Terminal Associates, the second-largest coal exporter in the U.S., was
experiencing problems with spillage at its transfer points. As Dan put it, “We looked
into it and we saw we were losing a lot of time and money with cleanup and lost
coal.” He decided to talk to Flexco.
Our team designed and installed transfer chutes that worked within Dominion’s
existing stacker-reclaimer units. The new systems not only cut down on spillage and
delivered soft, centered loads to the belts –– they also reduced dust, plugging and
wear. Today, reclaimed tonnages are up and transfer issues are down.
“We feel comfortable moving more tons per hour now,” Dan says. “Two million tons
have gone through the Flexco system, and it’s worked very well.” To increase the
performance of your system, call 1-800-541-8028 or visit our website today.
Dave Wood - Flexco - North American Sales Manager; Dan Wagoner - Dominion Terminal Associates - Superintendent Engineering & Maintenance;
Steve Kaluzny - Flexco - Project Manager; Wesley Simon-Parsons - Dominion Terminal Associates - Civil & Environmental Supervisor
Transfer Chute Systems
With over 25 years of design
experience, Flexco’s solutions
optimize material transfer for
reliable throughput.
VISIT US AT ELECTRIC POWER 2013, BOOTH #233, MAY 14 - 16, ROSEMONT, ILCIRCLE 8 ON READER SERVICE CARD

www.powermag.com POWER | May 201314
First Power for 1-MW Tidal Stream Turbine
In a milestone for the fledgling marine power sector, Alstom’s 1-MW tidal turbine (Figure 6) generated power for the first time at the European Marine Energy Centre’s tidal test site in Orkney, Scotland.
Alstom recently acquired the company that had spearheaded development of the tidal stream turbine, Tidal Generation Ltd., from Rolls-Royce. The company had previously tested a 500-kW tidal turbine successfully. The 1-MW device is in Scotland as part of the Energy Technologies Institute–commissioned and cofunded ReDAPT (Reliable Data Acquisition Platform for Tidal) consortium project. Detailed testing and analysis in different op-erational conditions off Orkney will continue throughout 2013 over an 18-month period in order to further improve tidal power technology. The next step is to install pilot arrays prior to full commercial production, Alstom said in early March.
The tidal turbine consists of a three-bladed, pitch-controlled rotor, with a diameter measuring 18 meters (m); a standard drive-train; and power electronics inside the nacelle. The 22-m-long nacelle is installed onto a separate seabed-mounted foundation and weighs less than 150 metric tons. Alstom said the turbine has other notable features, including that it is “easy to trans-port” in a single tidal cycle using small vessels. Also, it has an “intelligent” nacelle: “Thrusters rotate the nacelle to reflect the direction of the tide, managing ebb and flood tides seamlessly as well as maximising energy production.”
Making a marked departure from the traditional tidal barrage system, tidal stream turbines are massive stand-alone turbines that work much like wind turbines—but with a much higher en-ergy density, because saltwater is 850 times denser than air.
The first commercial tidal stream turbine, a 122-foot-long inverted windmill with a nameplate capacity of 1.2 MW, dubbed the SeaGen, was installed in Strangford Laugh, a shallow inlet in Northern Ireland and began producing power in 2008. Siemens last year fully acquired that device’s developer, Marine Current Turbines. SeaGen’s performance has reportedly prompted Siemens to push two new SeaGen demonstrations. The 8-MW Kyle Rhea project in Scotland and
CIRCLE 9 ON READER SERVICE CARD
6. Streaming ahead. Alstom’s 1-MW tidal stream turbine began
generating power for the first time at the European Marine Energy Cen-
tre’s tidal test site in Orkney, Scotland this March. Courtesy: Alstom
T eam is a world-class service company with the right people, technology and experience needed to keep your plants online
and in production. Our highly skilled technicians work to earn your continued trust and conf idence one job at a time.
Satisfying customer needs since 1973 True 24/7/365 availability More than 100 worldwide locations 3,200+ trained and certif ied service specialists Worldwide stock of in-house service equipment Bundled approach helps you realize cost savings Improved productivity meets or exceeds your goals
+1-800-662-8326 | www.teamindustrialservices.com
Scheduled maintenance, inspections, emergency response…Team delivers
Leak RepaiRs
FieLd HeattReating
FieLd MacHining
VaLVeinseRtion
Hot taps /Line stops
tecHnicaL BoLting
VaLVe RepaiR
nde/ndt inspection
eMissions contRoL
pipe RepaiRseRVices
tuRnaRoundseRVices
pipeLine seRVices
CIRCLE 10 ON READER SERVICE CARD

www.powermag.com POWER | May 201316
the 10-MW Anglesey Skerries project in Wales are said to be in the advanced stages of development.
POWER DigestCuadrilla Delays UK Fracking Project to Conduct More Assessments. The UK’s largest shale gas explorer, Cuadrilla Resources Holdings, on March 14 said it would delay hydraulic fracturing operations at its Anna Road project until 2014, after
data it had gathered from exploration of the Bowland Basin Shale in Lancashire con-firmed assessments that the 1,200-square-kilometer license area holds at least 200 trillion cubic feet of gas. Postponing the operation will give Cuadrilla time to con-duct more extensive environmental assess-ments and to engage local communities around the project, the company said. An application to drill at the Anna Road proj-ect site is under consideration by the local Lancashire County Council.
Japan Proposes Solar Tariff Cut as Equipment Prices Plunge. Japan’s Min-istry of Economy, Trade, and Industry on March 12 said the price Japan’s power utilities must pay independent solar power producers would be cut by 10% beginning April 1. The cost of nonresidential solar has fallen 14% since October last year compared to the amount used to set the solar tariff for the year ending March 31, according to the ministry. The price for so-lar power from systems with a capacity of 10 kW of less would be cut to 39¢/kW. Pur-chase prices for other types of renewables would not be affected by the proposal.
Australia Backs Renewables Target Plan. Australia’s government in late March opted to maintain a nationwide renewable energy target (RET) that seeks to procure at least 20% (41,000 GWh) of its power from solar, wind, and hydro by 2020. The nation rich in fossil fuel resources estab-lished the RET in 2001, and it has report-edly drawn A$10 billion (US$10.5 billion) into large-scale renewable ventures. The Gillard government rejected calls from in-dustry to cut back the target, saying after a statutory review by the Climate Change Authority that the RET would “position Australia well to respond to the challenges of climate change.”
Turkish Grid Auctions Valued at Around $3.5 Billion. Privatization auc-tions of Turkey’s four remaining power grids—AYEDAS, Toroslar Elektrik, Van Gölü, and Dicle—in March 15 brought in bids totaling nearly $3.5 billion. Enerjisa (jointly owned by Turkey’s second-largest company, Sabanci, and German energy firm E.ON) won the tender for the two largest grids, AYEDAS and Toroslar Elek-trik. AYEDAS operates on the Asian side of Istanbul, and Toroslar operates in the Adana region in the southern part of Tur-key. The highest bid for privatization of Dicle Elektrik, the electricity distributor operating in Turkey’s southeastern prov-inces, was won by the Iskaya Dogu joint venture. Construction company Türkerler won the tender for Vangölü Elektrik.
Russian Energy Efficiency and En-ergy Development. On March 11, Russia unveiled a plan, entitled “Energy Efficiency and the Development of Energy to 2020,” for modernizing the country’s energy indus-try. The plan calls for major investments in energy efficiency, renewable energy, and ex-panded extraction of oil, gas, and coal for export. The goal is to reduce Russia’s energy intensity by 40%. For more on the Russian power sector, see “The Russian Power Revo-lution” in the January 2013 issue. ■
—Sonal Patel is POWER’s senior writer.
More Control. More Effi ciency. Fewer Resources. Less Stress.
Keep your staff focused on your critical tasks.
® R
egis
tere
d t
radem
ark
of
Mart
in E
ngin
eering C
om
pany in t
he U
S a
nd o
ther
sele
ct
locations.
© 2
013 M
art
in E
ngin
eering C
om
pany.
For
additio
nal in
form
ation v
isit m
art
in-e
ng.c
om
/tra
dem
ark
s.
call 800.544.2947
visit martin-eng.com
email [email protected]
Benefi ts• Experienced technicians provide
faster, more error-free installations.
• Packaged service options keep
budgeting fl at and controlled.
• Or time and material options let you
control service spending.
• Proactive service extends component
life and minimizes breakdowns.
VISIT US at booth #613
to learn more about how
Martin Services can be a
solution for you!
ServicesMARTIN®
A Global Company
CIRCLE 11 ON READER SERVICE CARD

Mechanicals:P35352_EML_I01_V5.indd懇
Gas engines are built to run. But what if they could fl y?
© 2013 Exxon Mobil Corporation.All trademarks used herein are trademarks or registered trademarks of Exxon Mobil Corporation or one of its subsidiaries.
What if trouble-free operations were the norm, not the exception? What if your gas engines were able to help you reach
optimum productivity? With ExxonMobil as your supplier, they can. Equipment builders worldwide trust Mobil™-branded
industrial lubricants for premium oils designed with advanced technology — such as Mobil Pegasus™ 1005, with over
40,000 hours in proven service fi eld-testing. It provides not only peace of mind, but the chance to ignite outstanding
productivity. Visit mobilindustrial.com for more.
T:7”
T:10”
CIRCLE 12 ON READER SERVICE CARD

www.powermag.com POWER | May 201318
Performance-Driven Maintenance
My career began as a results engineer testing large utility boilers. Ever since that first assignment, I have remained interested in the details of how the measurement and control of the furnace fuel and air inputs can make a huge difference in overall boiler performance. Given that plant operations and maintenance (O&M) budgets are slimmer today than in recent memory, my experience is that targeted performance testing can provide important feedback for prioritizing maintenance expenditures. The combination of plant testing and targeted O&M expenditures provide the best opportunity for efficient and reliable plant operations. I call this approach to plant efficiency improvement “performance-driven maintenace.”
Performance testing of the entire plant and each system is very expensive and impractical. Instead, target your testing on the equipment that has the greatest potential positive impact on plant emissions and efficiency. Specifically, focus your testing on the pulverizer system, boiler air in-leakage, and boiler ash to achieve the greatest performance return at the least cost (Figure 1).
Begin with the PulverizersThe pulverizer is the heart of the coal combustion system. Efficient coal combustion requires precise fuel fineness and proper distribu-tion of the required air/fuel mixture to the burners (see the sidebar “Looking for More Pulverizer and Coal Fineness Resources?”).
Some plants are content with overhauling a pulverizer at the prescribed maintenance interval (usually 7,000 hours, 500,000 tons throughput, or a certain number of months) and placing it back into service without testing its performance. The overhaul often includes
extensive procedures such as replacing the grinding elements, re-placing worn areas of the classifier cones and blades, “blueprinting” the clearances and dimensions, and checking spring tension.
However, a successful overhaul requires much more than as-sembling the parts to specification. The final step of the overhaul should be a test that demonstrates that the leaving coal fineness is up to standard (at least 75% passing a 200-mesh sieve). With-out the correct fuel fineness, the remainder of the combustion system cannot efficiently burn the fuel.
For example, following an MPS-89 pulverizer overhaul, the plant staff determined fuel fineness was poor. The principal reason was identified as high primary airflow, the most common cause of poor fuel fineness. The primary air/fuel ratio was at 2.3 pounds of air per pound of fuel. When the primary airflow was lowered to the optimum air/fuel ratio, fineness improved from a value in the mid-60% range passing a 200-mesh sieve to the mid-70% range.
Undesirably high primary airflow not only contributes to poor fuel fineness but also to longer flames, increased fuel imbalance, higher CO levels, and higher peak flame temperatures at the superheater. Also, pockets of the products of combustion in a reducing atmosphere are
Typical HVT
testing location
Post-combustion
leakage
Flash sampling
location
Primary airflow venturis and
test location
1. Three plant tests to perform. Three performance tests
often produce the greatest return on your testing dollar: the pulverizer
system, boiler air in-leakage, and unburned fuel or loss on ignition in
the fly ash. The results of these tests often show where maintenance
dollars should be invested. Source: Storm Technologies Inc.
Looking for More Pulverizer and
Coal Fineness Resources?
The POWER online archives are an excellent resource for
those researching pulverizer and related combustion system
operation and maintenance topics. For example, the follow-
ing are 12 articles on these topics.
■ “Pulverizers 101, Part I,” August 2011
■ “Pulverizers 101, Part II,” October 2011
■ “Pulverizers 101, Part III,” December 2011
■ “Pulverized Coal Pipe Testing and Balancing,”
October 2010
■ “Four Methods of Fly Ash Sampling,” December 2009
■ “Measuring Coal Pipe Flow,” October 2009
■ “Finessing Fuel Fineness,” October 2008
■ “Boiler Optimization Increases Fuel Flexibility,”
June 2008
■ “ ‘Blueprint’ Your Pulverizer for Improved Performance,”
March 2008
■ “Managing Air to Improve Combustion Efficiency,”
October 2007
■ “To Optimize Performance, Begin at the Pulverizers,”
February 2007
■ “Applying the Fundamentals to Improve Emission
Performance,” October 2006
You can search the archives by issue (at the Archives
link) or by keyword, using the Search box in the upper
right corner of our homepage, www.powermag.com. The
updated search feature automatically searches POWER and
all sister publications—COAL POWER, GAS POWER, MANAG-
ING POWER, and POWERnews.

May 2013 | POWER www.powermag.com 19
often found in the upper furnace, which contributes to slagging when a fuel with high iron content ash is fired (Figures 2 and 3).
At another plant, the pulverizers were equipped with dynamic classifiers and were periodically tested at 170 rpm by the plant staff. Strangely, the day-to-day operation of the pulverizer classi-fier was at 160 rpm or less. The problem was that plant staff didn’t understand that a pulverizer outfitted with a dynamic classifier operating at lower than design speed produces poor fuel fineness, which also lowers combustion efficiency. When the classifier speed was increased to ~170 rpm, the fly ash carbon content dropped to 15% in loss on ignition (LOI, or unburned fuel).
Check Furnace Oxygen LevelsOne of the most common problems that creates opportunities for improvement is insufficient combustion air in the furnace. Most large utility boilers use oxygen analyzers installed at the boiler economizer exit gas ducts. Because of the age of the boilers and the reduced fre-quency of overhauls, many boilers have significant air in-leakage be-tween the furnace exit and the oxygen analyzers. Any air that seeps into the furnace post-combustion does not take part in combustion, yet it registers on the oxygen analyzers as “excess oxygen.”
40
35
30
25
20
15
10
5
0
Fue
l fl
ow
ba
lan
ce
(%
)
1.8 1.9 2.0 2.1 2.2 2.3 2.4
Air/fuel ratio
2. Pipe-to-pipe fuel flow balance. The test data illustrate
how minor coal pulverizer and primary air/fuel ratio adjustments of-
ten result in a dramatic change in boiler performance. Source: Storm
Technologies Inc.
72
71
70
69
68
67
66
65
64
63
Pe
rce
nt
pa
ssin
g 2
00 m
esh
1.8 1.9 2.0 2.1 2.2 2.3 2.4
Air/fuel ratio
3. Effect of excess primary airflow on fuel fineness. At this plant, reducing primary airflow improved fuel fineness and
reduced undesirable combustion losses in the boiler. Source: Storm
Technologies Inc.
800.787.7325e-mail: [email protected] 9001 Certiied
For more than 25 years, Sealeze has helped design and manufacturing engineers design solutions.
Adaptive Brush Seal Solutions for
Air Preheaters
High performance. Long life.
Sealeze’s patent-pending brush-based sealing system delivers reliability and extended functional service life.
Replace seals less often
• Consistent effective sealing, 2-5 times longer than standard seals
• Inherent high elasticity allows dissipation of stress under deformation; reducing drag, wear and sudden failures.
More effective than other seal
• Conforms to sealing surface
• Each ilament is lexible, conforming to varying gap sizes and surface irregularities for a continuous seal
• Thousands of ilaments, nestle tightly together creating a high integrity seal. Under pressure these ilaments pack even tighter.
XtraSeal HT
CIRCLE 13 ON READER SERVICE CARD

Is Your Plant or Smart Grid Project a Winner?
Has your plant distinguished itself by innovative design, producing power more reliably or
economically than comparable plants, or demonstrating a new generation or environmental
control technology? Then you should nominate it for one of these awards:
» Plant of the Year
» Marmaduke Award (for operations & maintenance excellence)
» Top Plants (coal, gas, nuclear, renewable categories)
Has your utility or country demonstrated stellar results from a smart grid program?
Nominate it for our Smart Grid Award.
Visit www.powermag.com and look under “Also from POWER Magazine”
for links to nomination forms, award criteria, and past winners.
Last Chance to Enter!
Deadline: May 24, 2013.
2012 Plant of the Year: AES Gener’s Angamos Power Plant, Chile

May 2013 | POWER www.powermag.com 21
We often find the excess oxygen increase from the furnace to the economizer outlet to be more than 2% oxygen. This repre-sents the equivalent of about 10% of the total combustion air. When a boiler is operated with the furnace exit as low as 2% oxygen, the CO levels are usually extreme, into the 4,000+ ppm range. Carbon monoxide will still burn out as the flue gases pass through the convection pass and cool down to about 1,350F. The result is reasonable, yet close to the limit stack CO levels even when the furnace is starved for oxygen.
Perform Periodic Fly Ash SamplingPeriodic sampling of fly ash at the boiler exit can be very informa-tive about combustion efficiency. The key is to obtain representa-tive fly ash samples, which is easier said than done. First, don’t use electrostatic precipitator or baghouse hopper samples, which aren’t as representative as the fly ash captured directly from the gas stream. Instead, use a fly ash sampler to sample fly ash in the flue gas. This approach ensures that the sample reflects the true carbon content of the fly ash that is useful to monitor pulverizer performance. Permanent mounting of the fly ash sampler with pul-ley hoists for lowering the probes and permanent compressed air piping can make the sampling task much easier.
After the fly ash sample is collected, apply the three-part fly ash LOI test. The first part measures the fly ash LOI collected from each duct. Next, sieve a portion of the ash through a 200-mesh sieve and determine the LOI of both the fine ash (passing the 200-mesh sieve) and the coarse ash (remaining on 200-mesh sieve). The final task is to analyze the test results. If the composite ash (fines and coarse) is, for example, 10% LOI and the fine ash is 2% LOI, then the problem causing the poor LOI is likely pulverizer related. If the
fine particles (less than 200-mesh size) have high carbon content, then the problem is not pulverizer related but more likely is caused by insufficient furnace oxygen or poor fuel balancing.
—Contributed by Dick Storm ([email protected]), president of Storm Technologies Inc.
Lithium-Ion Batteries:
A Potential Fire Hazard
The proliferation of battery technologies in modern industry is presenting fire professionals with new sets of challenges. Confu-sion exists as to the correct approach for protecting industrial batteries from fire, whether that be in battery manufacturing, battery storage, or battery-powered applications.
Lithium-ion (Li-ion) cells are distinctly different from lithium (primary) cells and are used in large numbers in power grid stabi-lization systems, containerized battery systems, and other large-scale applications. These types of systems have thousands to tens of thousands of Li-ion cells integrated into a single space. The uses of Li-ion cells in these applications need to be reviewed for potential fire hazards, and fire protection strategies must be applied and implemented to reduce the risk (Figure 4).
Potential fire protection strategies include using gaseous fire suppression agents, such as FM-200, 3M Novec 1230 fire protection fluid, and/or Argonite to protect large arrays of Li-ion cells.
What You Should Know About Li-ion BatteriesLi-ion batteries do not contain lithium in its metallic form. There-fore, these batteries do not pose a Class D fire risk, as compared with batteries that do contain metallic lithium.
Electrolytes used in Li-ion batteries are complex formulations con-
the
company
torque guntm
CIRCLE 14 ON READER SERVICE CARD

www.powermag.com POWER | May 201322
sisting of lithium salts, such as LiPF6, LiBF4, or LiClO4 in an organic solvent, such as ethylene carbonate (EC), dimethyl carbonate (DMC), diethyl carbonate (DEC), or ethyl acetate (EA). A liquid electrolyte allows movement of lithium ions between the cathode and the anode when a battery passes an electric current through an external circuit.
If overheated or overcharged, Li-ion batteries can suffer in-ternal mechanical damage, leading to electrical shorting and in-
ternal heating. Overheating and overcharging can also result in a thermal runaway event that can lead to cell rupture and leak-age of combustible electrolytes. Electrolytes are Class B materials (flammable liquid) and the design concentration should be deter-mined by test for the particular composition present.
Fire-Extinguishing SolutionsRupture of Li-ion cells may result in the ejection of electrolyte, a Class B flammable or combustible liquid. Gaseous agents will extinguish flames due to burning leaked electrolyte but have little or no effect on mitigating or preventing a thermal run-away occurring within Li-ion cells. These reactions are internal to the cell, and although the charging array will likely have preventative measures incorporated into its design, the reac-tion may still occur.
Despite the potential for Class B material discharge, there are two possible approaches to the use of a gaseous fire suppression agent for hazards involving Li-ion batteries:
■ Based on a risk assessment, hazard survey, and customer/end user strategy, protect the space based solely on the Class A materials present and/or the Class C energy source(s). This approach chooses not to specifically protect against the Class B (electrolytic material) contained within the battery, which would only be introduced into the hazard upon a catastrophic failure of the battery cell itself.
■ Based on a risk assessment, hazard survey, and customer/end user strategy, protect the space based on the Class A materials present, the Class C energy source(s), and the Class B (electro-lytic material). This approach provides protection in the event that ejection of the electrolyte material occurs, which could ignite if an ignition source is present.
Cup burner and other tests were completed in accordance with the requirements and guidelines of NFPA 2001 (2012 edition). Based on the results of these tests, Kidde Fire Systems has de-termined the minimum agent design concentration necessary to suppress a fire involving some of the most commonly used Class B compounds found in electrolytes (Table 1).
The growing use of Li-ion batteries in industrial and other large-scale applications requires an increasing awareness of the potential fire hazards posed by such batteries and the most ef-fective fire protection systems to mitigate the risk. ■
—Contributed by Jonathan Ingram, director of product market-ing–Kidde Fire Systems, part of UTC Climate,
Controls & Security.
4. Be aware of new fire risks. Industrial use of Li-ion batteries has
grown substantially over the past few years, but knowledge of appropriate
fire protection agents has not kept pace. Courtesy: Kidde Fire Systems
Materials
Novec 1230 Fire
protection fluid
(FK-5-1-12)
FM-200
(HFC-227ea)
Argonite
(IG-55)
Ethyl acetate (%) 6.2 8.9 52.9
DiEthyl carbonatem (%) 6.4 8.5 52.9
DiMethyl carbonate (%) 6.3 8.8 52.9
Ethyl methyl carbonate (%) 6.6 NA 52.9
Propylene carbonate (%) 6.7 NA 52.9
Notes: All values are percentage by volume. NA = data not available.
Table 1. Several fire protection agent options. This table
presents the appropriate fire protection agent and the mixture needed
to suppress a fire involving the most common types of materials found
in Li-ion batteries. Source: Kidde Fire Systems
FSE Energy ensures the success of our woldwide customer base through the delivery of the highest quality heat and energy equipment solutions. Product details at www.fseenergy.com.
CIRCLE 15 ON READER SERVICE CARD

Founded in 1988, PIC has been a leader in the
power generation industry for over 20 years. We
are experts at managing multi-faceted projects
including start-up and commissioning, operations
and maintenance, installation, turbine outages,
mechanical services and technical services.
Combine these capabilities with our responsive
approach and global resources, and it’s easy to
see why those who know choose PIC.
25“The Best Of The Best®”
www.picworld.com
YEARS EXPERIENCE
READY TO MANAGE
YOUR NEXT POWER PROJECT.
Founded i
n 1
98
8
CIRCLE 16 ON READER SERVICE CARD

www.powermag.com POWER | May 201324
EPA Not Backing Down on Title V Source RulesBy Thomas W. Overton, JD
If you were hoping that the U.S. Environmental Protection Agency’s (EPA’s) defeat last summer on aggregating small emissions sources under Title V of the Clean Air Act (CAA)
meant a less-aggressive stance going forward, the agency has some bad news for you.
Last August, critics of the EPA were heartened when the Sixth Circuit Court of Appeals rejected the agency’s determination that a natural gas sweetening plant in Michigan and its associated wells and flares constituted a single pollution source under Title V of the CAA (see “EPA’s Title V Source Policy Takes a Hit” in the November 2012 issue of POWER). Aggregating the total emissions allowed the agency to define the plant as a major source under Title V, thus requiring an emissions permit.
Splitting HairsThe Sixth Circuit ruling in Summit Petroleum Corp. v. EPA turned on the definition of “adjacent” in the EPA regulations enforc-ing Title V. The regulations allow multiple pollution-emitting activities to be treated as a single source if they are under common control, part of the same industrial activity, and “are located on one or more contiguous or adjacent properties.” Summit’s activities did not take place on contiguous properties but were spread over an area of 43 square miles, with the vari-ous wells and flares being located anywhere from 500 feet to 8 miles away from the sweetening plant. Thus, the question was whether these rather widely spread operations were “adjacent” to one another for the purposes of Title V.
It’s important to keep in mind here that the court was construing regulations written by the EPA itself. As might be expected, federal courts give fairly large deference to an agen-cy’s interpretation of its own rules. However, the boundaries of that deference can be unpredictable. The federal Adminis-trative Procedure Act bars a court from interfering unless the interpretation is plainly erroneous or inconsistent with the regulation.
But—and this is a very large but—no deference is in order if the language of the regulation is plain and unambiguous. The rationale behind this rule is that allowing an agency to interpret a regulation beyond its plain meaning is tantamount to allowing it to create a new de facto regulation outside the official rule-making process.
Naturally, Summit argued that “adjacent” was unambiguous, while the EPA argued that it was not. The agency based its argu-ment on the fact that it had never defined a specific distance for this section of the regulations. It wanted to consider both physi-cal proximity and “functional interrelatedness” in determining whether two sources were adjacent, something it insisted it has been doing for decades. The court, looking simply to the diction-ary, agreed with Summit. Thus, it held that Summit’s facility,
spread over 40-plus square miles, was not “adjacent” within the plain meaning of the word.
The EPA sought a rehearing en banc, but this was denied.
Not So FastFederal circuit court rulings are binding precedent only within that circuit, and merely persuasive authority outside it. Still, it’s not unusual for a decision like this to prompt an agency to change its approach in the interest of maintaining consis-tency nationwide.
Those hoping for such a response from the EPA, however, got an early lump of coal in their Christmas stockings when the agen-cy announced on Dec. 21 that it was limiting its compliance with the Summit ruling to the boundaries of the Sixth Circuit (Ken-tucky, Tennessee, Michigan, and Ohio). Elsewhere, said the memo from Stephen Page, director of the Office of Air Quality Planning and Standards, “the EPA does not intend to change its longstand-ing practice of considering interrelatedness in the EPA permitting actions.” Further, the EPA “is still assessing how to implement this decision in its permitting actions in the 6th Circuit.”
The memo is a clear shot across the bow of anyone hoping the EPA would drop the “functional interrelatedness” standard. Until another court says otherwise, it intends to stick to the same ap-proach that was rejected in Summit in permitting actions outside the Sixth Circuit.
As worrisome as that may sound, there may be a more signifi-cant response on the way.
Remember that Summit was based on regulations written by the EPA. Folks I’ve talked to with an ear on the ground in Wash-ington believe the EPA is in the process of rewriting those regu-lations to include the functional interrelatedness standard, in effect reversing the decision on its own. And there’s little anyone outside the administration can do to stop it. Once the new rule is in place (a process that can take several years), the Summit deci-sion becomes obsolete. While agency rulemaking can be—and frequently is—challenged in court, opponents will be starting from scratch and under a different standard of review. Congress could revise the CAA to include the Summit rule, of course, but the likelihood of that happening is probably nil.
What all this means is that Summit will likely serve as more of a speed bump than a change in course for the EPA. Those hoping the decision would herald a less-aggressive stance against small emis-sion sources would probably be best served by continuing to fol-low the existing rules until more is known. And those in the Sixth Circuit would be advised not to make any major changes as a result of the Summit decision, lest it be drafted out of existence.
Final resolution of this dispute, it appears, is still a long way away. ■
—Thomas W. Overton, JD is POWER’s gas technology editor.

CIRCLE 17 ON READER SERVICE CARD

www.powermag.com POWER | May 201326
ENERGY POLICY
Ontario Goes Coal-Free in a DecadeBy the end of 2013, one year ahead of its goal, the province of Ontario will be virtually coal-free—a first for a North American jurisdiction. How did the most populous part of Canada go from 25% to 0% coal-fired generation in just a de-cade, and what does this phaseout mean for the rest of the world?
By Gail Reitenbach, PhD
A decade ago, the Canadian province
of Ontario supplied one-quarter of
its electricity from coal-fired power.
In early January this year, the province an-
nounced that it would meet its goal of phas-
ing out coal-fired generation a year early. By
the end of 2013, coal-fired generation will be
less than 1%, and 17 of the 19 units that exist-
ed in 2003 will be shut down; the remainder
(backup units) will be eliminated by the end
of 2014 (Table 1). The province’s Ministry of
Energy calls the phaseout the “single largest
greenhouse gas reduction measure being un-
dertaken in North America.”
Rather than compromising the province’s
power supply, decisions over the past decade
regarding everything from supply to conserva-
tion to grid enhancements have resulted in an
installed capacity that exceeds the province’s
peak demand. According to numbers provided
to POWER by the Ontario Power Author-
ity (OPA), peak demand (July 13) in 2005 was
26,160 MW, while capacity stood at 30,662
MW. In 2012, peak demand dropped, to 24,636
(July 17), while capacity increased to 35,736
MW, giving the province an enviable surplus.
That “healthy and stable supply is in contrast to
2003, when Ontario paid $900 million import-
ing power to meet the electricity demand of resi-
dents and businesses,” said OPA spokesperson
Courtesy: Ontario Power Generation
Table 1. Going, going, gone. This table shows the amount of coal-fired generation in
the decade following the first efforts to phase out coal-fired power in Ontario. Schedules for
2013 and 2014 are projected. Atikokan and Thunder Bay Generating Stations are currently oper-
ated only as back-up reliability sources. Atikokan is being converted to biomass; the province’s
Long-Term Energy Plan calls for converting Thunder Bay to burn natural gas. Note that when
all eight units of Nanticoke were operational, it was the largest coal-fired power plant in North
America, with a capacity rating of 3,964 MW, as well as the nation’s largest single source of
greenhouse gas emissions. Sources: Ontario Ministry of Energy, OPA
Year Coal (TWh) Coal (% of total generation) Coal unit retirements/conversion
2003 36.6 25%
2004 26.8 17%
2005 30.0 19% Lakeview, 4 units
2006 25.0 16%
2007 28.4 18%
2008 23.2 15%
2009 9.8 7%
2010 12.6 8% Nanticoke, 2 units
Lambton, 2 units
2011 4.1 <3% Nanticoke, 2 units
2012 NA NA
2013 NA NA Lambton, 2 units
Nanticoke, 4 units
2014 0 0 Atikokan, 1 unit
Thunder Bay, 2 units
Note: NA = not available.
Mitsubishi Power Systems Americas, Inc. • 100 Colonial Center Parkway • Lake Mary, FL 32746 USA • 1-407-688-6100 •

our Power Evolution... your Energy Solution
Visit mpshq.com for
Rewarding Career
Opportunities
J-Series Gas Turbines / Next-Generation Technology…Today
Inlet Temperature up to 2,912°F (1,600°C)
…approximately 200°F higher than previous designs
Combined Cycle Efficiency of 61.5% LHV
…surpassing any other world-class turbine
Greater than 10,000 actual operating hours on the first installed unit...
with 18 more units currently booked as of 2013.
G-Series Calendared Success
To date, Mitsubishi has recorded over 1,951,000 actual operating hours from
61 G-Series turbine units…with 16 additional units booked.
Steam Turbine Technology
For over a century, Mitsubishi has evolved into one of the world’s leading
steam turbine manufacturers for major Power Producers…as well as providing
turbines for various In-house Power Generation needs.
SCR Catalysts and Systems Designs
Today, more than 600 SCR systems meet emissions requirements for Industrial
Process and Power Plants around the world and in the Americas.
Comprehensive Manufacturing, Repair and Monitoring Services:
Gas and Steam Turbine component manufacturing, Service and Repair; Product
Assembly, Modifications and Upgrades; Rotor, Generator and Valve Services Long
Term Service Programs with Remote Performance Monitoring for Mitsubishi and
other OEM equipment...from new and expanded facilities in the Americas.
Efficiency and reliability are the life cycle results of Mitsubishi’s
evolutionary disciplines that yield leadership in power generation
products and services around the world.
Mitsubishi Power Systems Americas, Inc. • 100 Colonial Center Parkway • Lake Mary, FL 32746 USA • 1-407-688-6100 • www.mpshq.com
CIRCLE 18 ON READER SERVICE CARD

ENERGY POLICY
www.powermag.com POWER | May 201328
Tim Butters. (All currency is in Canadian dol-
lars unless the reference is to U.S. prices. U.S.
and Canadian dollars were near parity in early
2013.)
Why Eliminate Coal?Ontario’s population of 13,505,900 (as of
July 2012) is 38.7% of Canada’s total. It
is close in resident size to the state of Illi-
nois, with which it shares a heavy reliance
on nuclear power. Given that it is home
to major population and business centers,
Ontario cannot afford to be capricious
when it comes to electricity supply avail-
ability and reliability decisions. So what
prompted the major supply shift? Public
pressure, legislative action, and fuel avail-
ability all played a role.
As in other regions and countries, pub-
lic pressure for cleaner, renewable energy
sources started the ball rolling. The On-
tario Clean Air Alliance (OCAA) coali-
tion, established in 1997, was the primary
public interest group to bring pressure on
politicians and industry to make a shift to
cleaner energy. The alliance consists of
“approximately 90 organizations (health
and environmental organizations, faith
communities, municipalities, utilities,
unions and corporations) that represent
over six million Ontarians.”
Pressure from the OCAA is seen as hav-
ing been instrumental in nudging politi-
cians to consider a coal-free diet. (It should
be noted that although the group’s name
focuses on clean air, the OCAA also calls
for a phaseout of nuclear power and em-
phasizes the opportunities for efficiency,
renewables, importing hydropower from
Quebec, and small-scale gas-fueled com-
bined heat and power projects.)
Then, in August 2003, the eastern North
American blackout got everyone paying at-
tention to the grid. Ontario’s response in-
cluded creating an Electricity Conservation
and Supply Task Force (ECSTF), which
recommended developing a long-term plan
for generation and conservation. That fall,
the provincial government followed ECSTF
recommendations and enacted the Ontario
Electricity Restructuring Act, which, in
part, created the Ontario Power Authority,
whose responsibilities include addressing
power system planning issues.
Divesting the province of coal was seen as
a way to meet multiple goals: fight climate
change by reducing greenhouse gas (GHG)
emissions, reduce smog and mercury and
other emissions to protect human health, and
develop more renewable/free-fuel generation
sources. The relative emphasis given to each
of these rationales depended on which group
was making the pitch.
Fuel prices and availability played a less-
critical role. Most of the coal for power gen-
eration had been imported from the U.S.,
whereas gas for power generation comes
from western Canada.
How Ontario Switched Off 25% of Baseload Generation in a DecadeEliminating a quarter of dispatchable baseload
generation in 10 years is no small feat for any
sizable power grid. The short answer to the ques-
tion of how Ontario has been able to achieve
this is that it has had a provincial government
responsive to pressure applied by the public,
including the OCAA, and a hybrid energy in-
frastructure ownership and control system that
enabled smooth execution of the plan—once it
was developed and as it was modified.
Government Backing. The Ontario Min-
istry of Energy has legislative responsibility
for the following entities:
■ The Independent Electricity System Op-
erator (IESO), the grid operator.
■ Hydro One, a provincially owned compa-
ny that operates the majority of Ontario’s
transmission lines and serves as a local
distribution company in some areas of the
province.
■ The Ontario Energy Board (OEB), an in-
dependent adjudicative tribunal respon-
sible for regulating Ontario’s natural gas
and electricity sectors. Part of the OEB’s
mandate is to protect the interests of con-
sumers with respect to prices and the reli-
ability and quality of electricity service.
■ The Ontario Power Authority, an inde-
pendent crown corporation (a hybrid
government/private entity that is owned
by the government but operates at arm’s
length—comparable to “federal govern-
ment chartered and owned corporations”
like Tennessee Valley Authority in the
U.S.) that works to develop a reliable,
cost-effective, and sustainable electricity
system in the province.
■ Ontario Power Generation (OPG), a pro-
vincially owned electricity generation
company whose hydroelectric, nuclear,
and fossil fuel stations generate approxi-
mately 70% of Ontario’s electricity (the
remainder is privately owned). It is also
the sole operator of coal-fired plants.
As a 2012 paper by University of Toronto
authors explains, the shift away from coal was
in part initiated late last century, when the prov-
ince’s electricity sector went through liberaliza-
tion and moved to an open market system under
the Progressive Conservative government led by
then-premier Michael Harris.
In “The Coal Industry and Electricity
Policy,” Jodi Lea Adams, Douglas Mac-
Donald, and David Houle explain that
“Before Ontario Hydro was dismantled
[1998] though, environmental regulations
for stationary combustion turbines and
regulations on nitrogen oxide and sulfur
dioxide emission had already come into
place, the former applying to all new gen-
erators installed after November 1994 and
the later [sic] applying to corporate sourc-
es of emissions in manufacturing and en-
ergy, including Ontario Hydro from 1994
onward. . . . Thus a regulatory framework
that was discouraging conventional ther-
mal coal was already taking shape as the
decade came to a close.”
The authors also note that government’s
ownership of coal plants, the absence of
long-term power purchase agreements, the
age of existing coal plants, and the lack of
coal mining in the province all eased opposi-
tion to the phaseout.
However, getting from 25% to 0% didn’t
happen as quickly as originally planned.
Nanticoke Generating Station, for example,
was repeatedly scheduled for closure by On-
tario Power Generation. Though originally
slated for retirement in 2009, that plan was
dropped in 2006 when OPG was unable to
develop replacement power sources.
Major legislative developments spanned
nearly a decade:
■ 2001: Regulation requiring phaseout of
coal burning at the Lakeview Generating
Station by April 2005.
■ 2003: Plan to phase out all coal plants by
2007.
■ 2005: Phaseout target pushed to 2009 over
reliability concerns.
■ 2006: Target 2009 phaseout abandoned.
■ 2007: Government issues legally binding
regulation requiring complete phaseout of
coal burning by Dec. 31, 2014.
■ 2009: Green Energy Act passed: major
emphasis on renewable generation, energy
conservation, clean energy job creation,
demand-side management, access to trans-
mission and distribution for renewables,
and development of a feed-in-tariff (FIT)
program.
An Effective (but Expensive) FIT. It’s one
thing to declare that you want more renew-
able power. It’s quite another to make those
resources materialize. An important element
in renewables development for Ontario has
been its feed-in tariff program, introduced as
part of the 2009 Green Energy Act. Ontario’s
FIT, administered by the OPA, is recognized
as the first and most comprehensive in North
America. In fact, Ontario’s FIT was one of
the most generous worldwide, offering up to
80.2¢ per kWh.

ENERGY POLICY
May 2013 | POWER www.powermag.com 29
The FIT program’s two-year review, con-
ducted in October 2011, concluded that “the
FIT Program has been key to making On-
tario a leader in clean energy production and
manufacturing. The more than 2,500 small
and large FIT projects approved to date will
produce enough electricity to power 1.2 mil-
lion homes. FIT has also attracted more than
$27 billion in private sector investment, wel-
comed more than 30 clean energy companies
to the province, created more than 20,000
jobs and is on track to create 50,000 jobs.”
Among the recommendations were that, to
reflect lower costs, FIT prices for solar should
be reduced more than 20%, on average, and
by approximately 15% for wind. Prices for
other sources are to remain the same. The re-
view report shows the following original and
new FIT prices, in cents/kWh:
■ Solar rooftop (price varies by project size,
with higher rates for smaller projects):
53.9 to 80.2, lowered to 48.7 to 54.9.
■ Solar groundmount (price varies by
project size): 44.3 to 64.2, lowered to
34.7 to 44.5.
■ Wind (all sizes): 13.5, lowered to 11.5.
However, as with many accelerated re-
newables plans worldwide, Ontario’s hasn’t
always run smoothly. A December 2012
story in the Toronto Globe and Mail reported
that “in Ontario’s rush to develop renewable
energy, a significant obstacle emerged for
many small power producers, particularly in
Southwestern Ontario: There wasn’t enough
capacity on the aging grid to accommodate
all of their built projects.” Stranded solar and
wind projects—many of them small, privately
owned ones—have been the result. The OPA
has offered owners of such projects various
options that include relocating the solar pan-
els, combining with other projects to create
larger ones, and entering into an agreement
for someone else to take over the project.
Other FIT-related growing pains have in-
cluded the government’s inability to keep up
with renewable project applications, localized
opposition to wind farms, some short-lived
solar-parts manufacturers, questions about
oversight of renewables contracts, and, most
recently, a December 2012 World Trade Or-
ganization ruling (under appeal as of this writ-
ing), in a dispute brought initially by Japan,
that Ontario was giving preferential treatment
and subsidies to renewable generation equip-
ment originating in the province. The govern-
ment’s FIT-linked obligations have also been
partially blamed for Ontario’s budget deficit
(close to $12 billion for the fiscal year that be-
gan April 2012, according to Finance Minister
Dwight Duncan in late January).
As with most other FIT programs, the bot-
tom line seems to be that they do spur devel-
opment (which is their primary goal), but they
always have unanticipated consequences.
Conservation and Smart Grid Ef-
forts. Conservation is the cheapest energy
resource, and Ontario has shifted from hav-
ing no conservation plan in 2003 to generat-
ing over 1,700 MW of peak demand savings
over the past five years, according to the
Ministry of Energy. Conservation measures
include updated building codes, building en-
ergy audits and retrofits, and demand-side
management (DSM) programs enabled by
the roll-out of smart meters and time-of-use
(TOU) pricing. Earlier this year, the OPA
released results showing that in 2011, OPA
and local distribution company programs re-
sulted in 645 MW of demand reduction and
717 GWh of energy savings.
It should be noted that, because electricity
prices in Ontario are relatively low, there is
less built-in incentive to reduce consumption
Visit us at Electric Power in booth 814
CIRCLE 19 ON READER SERVICE CARD

ENERGY POLICY
www.powermag.com POWER | May 201330
than there might be in a locale like Hawaii
or Germany, where retail prices are compara-
tively higher.
Ontario is a North American smart grid
leader and has installed smart meters in a
majority of homes and small businesses,
which has enabled it to introduce automatic
TOU rates that encourage peak load-shifting.
(Residential and small business customers
also have the option of fixed rate contracts by
purchasing electricity from licensed energy
retailers.) Both large and small customers
can participate in DSM programs; large cus-
tomers can participate in both voluntary and
contractual demand response programs.
The goal is to reduce peak demand 6,300
MW by 2025 and 7,100 MW by 2030, and
the province says it is on target to hit those
numbers. It also claims that “Over the next
20 years, Ontario’s conservation targets and
initiatives are projected to save about $27
billion in ratepayer costs on the basis of a
$12 billion investment.” When asked about
the amount of last year’s peak load reduc-
tion made possible by smart meters and TOU
rates, the OEB responded that those numbers
were not yet available.
Fuel-Switching. A primary concern of any
grid operator is the availability of dispatchable
generation, so it’s no surprise that rather than
simply shutter all coal plants within a decade,
Ontario has explored fuel-switching.
In October 2012, work began on con-
verting the Atikokan Generating Station
from a coal-burning plant to a 200-MW one
equipped to burn 100% biomass—the first in
North America. That project is scheduled for
completion in 2014.
The province’s Long-Term Energy Plan
calls for converting two units at the Thun-
der Bay Generating Station to natural gas
to ensure system reliability in northwest-
ern Ontario, “particularly during periods
of low hydroelectricity generation and
until the proposed enhancement to the
East-West tie enters operation.” The plan
also considers conversion of some units at
Nanticoke and Lambton to natural gas, “if
necessary for system reliability.” As of this
writing, no decision had been made to be-
gin these conversions.
Swift Solar Development. Despite
the red tape and interconnection diffi-
culties encountered by several privately
owned micro-generation projects, Ontario
has managed to substantially increase the
amount of new non-hydro renewables.
Among the solar power projects devel-
oped since the decision to phase out coal
is the 80-MW Sarnia Photovoltaic Plant,
which was the world’s largest when it went
online in 2010. (This plant was a POWER
Top Plant Award winner in the renewables
category in 2011. See “Sarnia Solar Proj-
ect” in our December 2011 issue.) An Octo-
ber 2012 government statement noted that
the province is home to the 25 largest solar
projects in the country and has more than
550 MW of solar photovoltaic (PV) capac-
ity online and more than 1,800 MW of ad-
ditional solar PV capacity under contract.
Even with these new developments, solar
(in the “Other” category) is practically in-
visible in the chart of energy output by fuel
source in 2012 (Figure 1).
Increasing Wind Generation. Accord-
ing to the Ministry of Energy, Ontario’s
grid-connected wind capacity was 15
MW in 2003. At the end of 2012 it was
over 1,500 MW. Some stories earlier this
year trumpeted the role of wind power
in making the coal phaseout achievable,
noting that in 2012, wind generated more
power (3%) than coal (2.8%). Given that
the province had 25% coal generation in
2002, when the IESO market opened, and
that wind at the end of 2012 supplied 3%
of Ontario’s generation (roughly the same
as wind power’s contribution in the U.S.
overall), such claims seem overstated.
As in other places, wind power has its
vocal opponents in Ontario, some of whom
did more than voice opposition to a turbine
under construction at the 124-MW Sum-
merhaven project in mid-January, when
they painted graffiti on a disassembled
tower and blades, and damaged a turbine
that was set on fire, according to news
reports citing a release by the Ontario
Provincial Police. Earlier protests had oc-
curred because an as-yet-unoccupied eagle
nest had been removed to enable building
of an access road.
Holding Hydro Steady. Hydroelec-
tric generation supplies roughly 26% of
Ontario’s power. (Neighboring provinces
Manitoba and Quebec are almost totally
hydropowered.) Hydro capacity increases
have been marginal, growing from a to-
tal of 8,100 MW in 2005 to 8,400 MW in
2012 and 8,900 MW (projected) by 2015,
according to the OPA.
Powering Up Nuclear. Nuclear power
supplies more than 50% of Ontario’s elec-
tricity. OPG owns and operates the Picker-
ing and Darlington Nuclear Power Stations,
which have a combined generating capac-
ity of about 6,600 MW. (See the story on
p. 54 in this issue about plans for new units
at Darlington.) OPA also owns the Bruce
Nuclear Generating Station, which Bruce
Power operates under a lease agreement.
The Bruce station, the largest nuclear facil-
ity in the world, has eight operating units
totaling 6,300 MW and supplies roughly a
quarter of the province’s power.
OPA data show nuclear supplying 79
TWh in 2005, 85 TWh in 2012, and 93
TWh (projected) in 2015. Interestingly, the
Long-Term Energy Plan projects nuclear
power, which supplied 56% of all genera-
tion in 2012, supplying only 46% of total
generation by 2030.
Filling the Narrowing Gaps with
Gas. Ontario has limited natural gas re-
serves, so it imports most of the fuel
from Saskatchewan, Alberta, and British
Columbia. Despite the availability of Ca-
nadian gas, and in contrast to projections
of increasing gas-fired generation south
of the border, OPA actually projects that
gas-fired generation will drop in the next
few years. Though gas-fired generation
supplied 12 TWh in 2005 and 22 TWh in
2012, it is expected to supply only 9 TWh
in 2015. The drop in gas generation is ex-
pected to be offset by increases in nuclear,
hydro, and the nonhydro renewables men-
tioned above.
Early Results from a Coal-Free GridAlthough the province isn’t 100% coal-free
yet, it’s close enough to make some prelimi-
nary assessments of the results. The govern-
ment’s January 2013 announcement noted
that, according to a 2005 independent study,
“Cost Benefit Analysis: Replacing Ontario’s
Coal-Fired Electricity Generation,” phasing
out coal-fired generation is expected to save
the province “approximately $4.4 billion
annually when health and environmental
costs are taken into consideration.” Though
such assessments may be open to debate,
it is possible to evaluate other early results
more squarely.
On the Grid and Fuel Mix. In Septem-
ber 2012, the IESO said the supply outlook
was good at least through 2014: “Over the
next 18 months, more than 3,000 mega-
1. Energy output by fuel type, 2012. For the first time in the province’s his-
tory, wind generation exceeded coal genera-
tion in 2012. Source: IESO
Nuclear, 56.4%Hydro, 22.3%
Gas, 14.6%
Wind, 3.0%
Coal, 2.8%
Other, 0.8%

Sulzer Turbo Services Houston Inc
11518 Old La Porte Road
La Porte, TX 77571
USA
Tel: +1 713 567 2700
Fax: +1 713 567 2830
www.sulzer.com
Increased reliability for F-technology gas turbines
Sulzer Turbo Services can make your power train more
reliable with our expert field overhauls on advanced
F-technology gas turbines. We invest continuously in our
innovative repair processes and in-house technologies to
provide the optimal solution for your needs.
We also provide a wide range of balance of plant services for
rotating equipment not directly involved with the power train.
Innovative
Service Solutions
www.sulzer.com
Scan the code
for more
information
Download the
TS Solutions App
from the App store
CIRCLE 20 ON READER SERVICE CARD

ENERGY POLICY
www.powermag.com POWER | May 201332
watts (MW) of capacity will be added to
the grid, comprising approximately 1,500
MW of nuclear generation and 1,500 MW
of grid-connected renewable generation.
By February 2014, total wind and solar
generation connected to the transmission
and distribution systems in Ontario will
reach approximately 4,800 MW.” Over the
longer term, a combination of renewables
and conservation is expected to meet ad-
ditional demand (Table 2).
To date, the grid has suffered no ill effects
and, in fact, has a healthy reserve margin and
has been a net power exporter.
In November 2012, the IESO project-
ed a yearly reserve margin of 20.2% for
2013 and reserve margins at or above 18%
through 2017—easily meeting the resource
adequacy criterion for the next five years
“assuming all new resources and transmis-
sion development projects are delivered on
time.” Ontario’s required reserve margin
averages approximately 18.7% without re-
liance on emergency operating procedures
or imports. Note that in the modeling for
Ontario’s most recent projection, 13% of
installed wind capacity was assumed to be
available at the time of summer peak, and
33% at the winter peak.
The IESO says that the province has the
capacity to import or export “approximately
4,800 MW at any one time, depending on
system conditions.” Its high-voltage trans-
mission grid is connected to Manitoba, Que-
bec, New York, Michigan, and Minnesota.
Net imports or exports have varied from year
to year since 1997, when net imports were
–2.6 TWh, followed by 3 TWh in 1998. In
2003, net imports were 4.1 TWh, followed
by 0.3 TWh in 2004. Ontario has been post-
ing higher net exports ever since, with a high
of 10.9 TWh exported in 2008 and 9.9 TWh
most recently, in 2012.
As for managing increased variable
resources on the grid, that hasn’t posed
insurmountable problems. In a January To-
ronto Star piece, Tyler Hamilton, energy
and technology columnist, quoted Bruce
Campbell, vice-president of resource in-
tegration at the IESO, as saying that the
province hasn’t yet had to increase back-
Installed capacity 2003 MW
2010 MW
(projected) 2012 MW (actual)
2030 MW
(projected)
Nuclear 10,061 11,446 12,998 12,000
Renewables:
hydroelectric
7,880 8,127 7,947 9,000
Renewables: wind,
solar, bioenergy
155 1,657 1,633 10,700
Gas 4,364 9,424 9,987 9,200
Coal 7,546 4,484 3,293 0
Conservation 0 1,837 NA 7,100
Total 30,006 36,975 35,858 48,000
Note: NA = not available.
Nol-Tec Systems, Inc.
425 Apollo Drive Lino Lakes, MN 55014
651.780.8600 [email protected] www.nol-tec.com
MATS and MACT compliant mitigation of • Hg SO
2 SO
3 HCI HF
Customized innovation based on proven technology•
Make sure you’ve got
the right equipment for the job.
Call 651-780-8600 today to begin an analysis
of your pollution mitigation needs.
With Nol-Tec’s Sorb-N-Ject on-site, self-contained testing systems, you can be sure to
choose the right sorbent (including activated carbon) and the right equipment.
And Nol-Tec’s testing process ensures that our experts design the system best suited to your
precise requirements when you’re ready for your permanent pollution control solution.
Sorb-N-Ject®Dry sorbent injection portable test systems
One of Nol-Tec’s portable
dry sorbent injection systems
Flexible design to meet your precise needs•
Reliable, automated operation and control•
Scalable installation to to cover scope of any system•
CIRCLE 21 ON READER SERVICE CARD
Table 2. Historic and projected capacity, by fuel. Projections were made in the
2010 “Ontario’s Long-Term Energy Plan.” Sources: Ministry of Energy (projections), IESO (2012)

ENERGY POLICY
May 2013 | POWER www.powermag.com 33
up reserves because of the amount of wind
power on the grid. Hamilton notes, “If we
were to stick with our coal phase-out strat-
egy without wind, we would need to burn
more natural gas. The reality is that when
the wind blows it gives us the opportunity
to burn less natural gas when it’s being
used to displace coal. This is partially why
greenhouse-gas emissions associated with
electricity generation in Ontario have fall-
en by two-thirds since 2003.”
On Retail Prices. Just as in the U.S.,
there has been considerable debate about
how cutting coal and adding variable re-
newable capacity will affect retail electric
rates. Even the provincial government has
acknowledged that rates will increase,
saying, “Over the past 20 years, the price
of water, fuel oil and cable TV have out-
paced the price of electricity. Over the
next 20 years, Ontario can expect stable
prices that also reflect the true cost of
electricity.” About 40% of the province’s
generation is subject to price regulation,
“contributing significantly to predictable
prices for Ontario consumers,” the gov-
ernment says.
As of January 2013, with less than 3%
coal-fired capacity, the IESO had posted
the following rates: Under the regulated
rate plan, consumption of up to and in-
cluding 1,000 kWh/month: 7.4¢/kWh;
more than 1,000 kWh/month: 8.7¢/kWh.
TOU rates varied from 6.3¢/kWh to 11.8¢.
Residential customers with smart meters
(the majority) have three different TOU
rates: 6.3¢/kWh for off-peak, 9.9¢/kWh
for mid-peak, and 11.8¢/kWh for on-peak.
TOU prices are reviewed every May 1 and
November 1 by the OEB.
It’s always difficult to compare rates
and plans across different regulatory re-
gimes and nations, but given the virtual
parity of the U.S. and Canadian dollars in
early 2013, it’s worth comparing Ontario’s
rates with those in Illinois.
Illinois has a similar population
(12,875,255 for 2012), its major popula-
tion centers share a similar climate, and
it also has substantial nuclear generation.
The state, which in 2010 ranked third in re-
coverable coal reserves at producing mines
in the U.S., generated 6,208 GWh from
coal, second only to nuclear (7,557 GWh)
for power generation as of September 2012
U.S. Energy Information Administration
data. The state’s average retail rate year-to-
date October 2012 was 11.45¢/kWh resi-
dential (8.58¢ for all sectors). That average
is higher than all Ontario residential rates
except for on-peak TOU pricing. Simply
having more coal than variable renewables
on your grid doesn’t guarantee lower rates.
The Ontario government anticipates
that prices for residential and small busi-
ness customers will increase about 3.5%
annually through 2030. The biggest jump,
according to the 2010 Long-Term Energy
Plan, will be over the five years follow-
ing the plan, when “residential electric-
ity prices are expected to rise by about
7.9 per cent annually (or 46 per cent over
five years). This increase will help pay for
critical improvements to the electricity ca-
pacity in nuclear and gas, transmission and
distribution (accounting for about 44 per
cent of the price increase) and investment
in new, clean renewable energy generation
(56 per cent of the increase).” A program
for eligible low-income consumers pro-
vides a benefit equal to 10% of the total
cost of electricity.
The rate for industrial users is expected
to increase about 2.7% annually through
2030. The province says it is working to
mitigate the effects of the increase through
efficiency programs.
It may surprise some south of the Canadi-
an border that prices aren’t the only concern
for the public. As a blog post by Ontario
environmental lawyer Dianne Saxe on June
7, 2010, noted: “Hamilton City Council
passed a motion on May 12, 2010, request-
ing Ontario’s Government to order OPG to
put its coal plants on standby and only oper-
ate them as a last resort. . . . Kitchener and
Guelph have recently passed similar resolu-
tions. . . . Such resolutions have no legal
force, but who would ever have thought that
we’d see municipalities calling for cleaner,
more expensive power?”
On GHGs and Other Emissions.
Though the province’s greenhouse gas
emissions have dropped two-thirds since
2003, then-premier Dalton McGuinty ac-
knowledged in January that Ontario’s coal
phaseout wouldn’t stop coal plant devel-
opment elsewhere in the world. However,
local emissions of GHGs will drop, along
with other byproducts of coal combustion,
thereby improving local air quality and
health for Ontarians.
The government’s January announce-
ment said that “The closure of coal plants
has already produced significant health
and environmental benefits for Ontarians.
For example, 2011 sulfur dioxide and ni-
trogen oxides emissions were 93 per cent
and 85 per cent lower, respectively, than
they were in 2003. And in 2011, Ontario’s
coal plants emitted 43 kilograms of mercu-
ry, the lowest on record in over 45 years.”
Model Program or Isolated Case?So what does Ontario’s coal phaseout mean
for the rest of Canada, other developed
nations, and the developing world? The
availability and price of fuels—whether
they be fossil-derived or renewable ones—
will continue to play a powerful role in the
short term. But global power industry in-
cumbents may be setting themselves up for
unwelcome surprise if they fail to realize
the power of example.
Whether you think Ontario’s energy
policy is a good one or not may depend on
where you stand on energy policies gener-
ally and what role you play in the global
energy industry. If you are a vendor to just
the North American coal-fired generation
sector, you won’t like the fact that Ontario
has proven a large geographic area with a
substantial population can—at least under
supportive policy—go coal-free. If you
serve a global client base, you’ll see de-
veloping nations, which plan to build con-
siderable coal capacity, as more promising
markets. On the other hand, if you are
looking for examples of decreasing a car-
bon footprint by way of generation portfo-
lio adjustments and grid upgrades, you’ll
see Ontario’s experience as a model.
Regardless of one’s policy stance, On-
tario’s experience demonstrates that even
under the most supportive political and
economic conditions, accelerated renew-
ables and smart grid programs will en-
counter unexpected hurdles. To expect
zero difficulties would be unrealistic.
It’s also unrealistic to think that others
won’t attempt to follow Ontario’s exam-
ple. A January article in Mother Jones had
former Minister of Energy Chris Bentley
commenting that, even though the U.S. has
its unique challenges in dealing with coal,
“he learned one thing from his experi-
ence cutting it out that can apply to his US
counterparts: ‘There are far more people
who are supportive than the critics would
like you to believe.’”
The debate about whether or not Ontar-
io’s grand plan to eliminate coal power was
worthwhile—in terms of GHG emissions,
health effects, grid stability, economic im-
pact, and consumer prices—is bound to
continue long past 2014. Though the ef-
fects on grid reliability and retail prices
to date have been benign, only time will
tell if the long-term consequences are any
harder to bear than those felt by provinces,
states, and nations that defer the develop-
ment of cleaner generation and modern
grids even longer.
One thing that can’t be debated is that
when the last Ontario coal-fired plant stops
sending power to the grid, naysayers won’t
be able to say it can’t be done. ■
—Gail Reitenbach, PhD is POWER’s managing editor.

www.powermag.com POWER | May 201334
ENERGY POLICY
Germany’s Energy Transition ExperimentGermany has chosen to transform its energy system within a few decades—an
ambition that has evoked equal admiration and confusion. Has Europe’s largest economy embarked on a rational path to an energy future that will make it the bellwether for global acceptance of renewables, or will the complex array of current challenges encumber its grand transformation?
By Sonal Patel
A comprehensive legislative package passed by Germany’s federal cabinet and its bicameral legislature (com-
prising the Bundesrat, the federal council, and the Bundestag, the federal parliament) in the summer following Japan’s Fukushima nuclear catastrophe in 2011 adopted 120 in-dividual measures previously proposed in a 2010-unveiled “Energy Concept” and laid the groundwork for Germany to set its en-ergy supply system on a new footing by the middle of the century.
The transition to a new energy era—de-scribed by the German term Energiewende—will be a “Herculean task,” German Chancellor Angela Merkel has admitted, bigger, perhaps, than efforts to bridge the infrastructure devel-opment gap following German reunification. But if the transition is successful, Germany could model how an export-oriented indus-trial nation staking its future on a high share of renewables can be globally competitive. If it stalls, the nation with the world’s fourth-largest economy by nominal gross domestic product could flounder economically, miring grandiose ambitions in the European Union (EU)—and around the world—to combat cli-mate change with renewables.
Making an Energy TransitionThe goals of the transition are certainly “am-bitious” for Germany, an industrial heavy-weight, but they are “clear,” Federal Minister of Economics and Technology Philip Rösler contends in a recent policy brochure. Along with a complete withdrawal from nuclear power by 2022, the country will strive to replace 80% of electricity generated today by conventional sources with renewables by 2050 and shave energy consumption by a fifth. Complex hurdles will have to be overcome, Rösler acknowledges. “[The transition] goes hand in hand with the necessary grids, power stations and storage technologies, and there-fore involves the development of a complete-ly new energy system,” he says. And the only
way to achieve it without putting an “undue burden” on businesses and consumers and to ensure long-term acceptance of the transition is to prioritize “technology-neutral, market-oriented, and cost-effective instruments.”
It helps that Germany has been on a sus-tainability trajectory for awhile, some industry observers point out. The term Energiewende was coined three decades ago, in response to the oil shocks of the 1970s, by Öko-Institut, an ecological think tank that defined the tran-sition as “growth and prosperity without oil or uranium.” That idea took root in political discourse during the 1980s, and in 1991, the first feed-in-tariff (FIT) policy backing renew-ables was introduced. After it was revised and extended in 2000, Germany enacted the Re-newable Energy Sources Act (Erneuerbare-Energien-Gesetz, or EEG)—the policy that perhaps most forcefully drives Germany’s post-Fukushima energy transition.
Nuclear’s Slow DeathIn 2000, under then-Chancellor Gerhard Schröder, Germany’s first center-left coali-tion of Social Democrats (SDP) and the Green Party implemented a nuclear phase-out with the passage of Atomausstieg, a con-troversial policy change that stymied nuclear generators’ unlimited lifetime licenses and strong legal guarantees. Under that law, the country’s 19 then-operational nuclear plants were allotted a specific amount of electric-ity (2,623 billion kWh, or an average of 32 years) of lifetime production that they could feed to the grid before mandatory shutdown. It allowed those hefty allowances to be sold or transferred to other power plants for a profit, however, ameliorating protests from nuclear generators—particularly newly born E.ON, which amassed ownership of 12 of the 19 reactors after the merger of Germany’s biggest utilities, Veba and Viag. The indus-try-government compromise also included a government commitment not to introduce any “one-sided” taxation measures.
Just a decade later, in an attempt to lay the groundwork for future German energy policy to mitigate climate change, and—as a global recession raged—to reap a portion of tremen-dous profits utilities said they would earn if re-actor lifetimes were extended from the average 32 years to 60 years (as in the U.S.), the coali-tion government of Chancellor Angela Merkel agreed to levy a €2.3 billion annual tax on the country’s four nuclear owners—RWE, E.ON, EnBW, and Vattenfall Europe. In return they got permission to operate reactors on average 12 years beyond 2021. The tax was to be used to subsidize renewables until at least 2016.
Merkel—a former environment minister in the mid-1990s under conservative Chancel-lor Helmut Kohl—was in September 2010 the head of a grand center-right coalition govern-ment that included her own liberal-conservative Christian Democratic Union (CDU), the Chris-tian Social Union (CSU), and the business-friendly Free Democratic Party (FDP). She had then called the reactor lifetime extension com-promise “a reasonable technical solution,” not-ing that at the time, nuclear power accounted for about 22.6% of net electricity consumption. Merkel’s assessment that the renewable sec-tor was not capable of filling the energy gap if Germany was entirely rid of nuclear power was directly in line with the coalition’s newly unveiled “Energy Concept”—the ambitious en-ergy policy with a 40-year trajectory that called for, by 2050, greenhouse gas cuts of at least 80%, increasing renewables to 80% in electric-ity supply, and a 50% reduction in primary en-ergy consumption compared to 2008 levels.
The PushbackThen the natural and nuclear disaster at Fuku-shima happened. In the whirlwind of events fol-lowing the Japanese catastrophe in March 2011, Merkel’s government reversed its stance on nuclear power and, citing safety concerns, im-mediately instituted a three-month moratorium on all nuclear plant operation for safety checks. Merkel later decreed that seven of Germany’s
•
•
•••••
•

©2012 Baldor Electric Company
Fluid PerformanceDrive Down Your Energy UseIn a motor-pump system, the life
cycle cost of the motor is about
2% of the total expense with
electricity consumption comprising
over 97% of the motors total
cost. By upgrading to a Super-E®
NEMA Premium® efficiency motor,
substantial energy can be saved…
immediately. Since most pump
systems are oversized for worst
case conditions and are operated
well below that point, adding an
adjustable speed drive to operate
the motor at a lower speed (instead
of using a valve) can, in most cases,
save over 60% of the energy used.
These applications can pay for the
cost and installation of the drive
in less than a year with rebates
available from most utilities, while
reducing energy consumption for
many years afterwards. Both the
U.S. Department of Energy and
Natural Resources Canada accept
Baldor’s Super-E motors as an
energy-saving upgrade.
and API 547
compliant designs
are available.
ABB brand IEC
metric motors
are offered in
standard or ATEX
configurations
for export or
replacement
on imported
equipment through
100,000 Hp.
OEM pump
manufacturers and pump
assemblers will find a wide range of
Baldor•Reliance stock and custom
motor configurations to meet your
specific application requirements.
For OEMs that manufacture their
own submersible pumps, Baldor
can supply stator-rotor sets in many
different frame sizes and ratings for
low and medium voltage use.
All Baldor•Reliance motors are
made in America and distributed
through 32 stocking warehouses
in North America, giving you the
fastest stock motor delivery in the
industry.
Motor-driven pump systems
represent 30% of all motors used in
North America.
Baldor Electric
Company
recognizes
the need for robust, energy efficient
motors for this application and
offers a wide range of motors for
practically any pump application:
• 56J
• Close-coupled
• Explosion-proof
• Vertical P-base with solid shaft
• Submersible and immersible
designs
…plus, an unlimited number of
custom designs.
With medium voltage motor
horsepower ratings to 15,000 and
stock motor voltages in 115/230
and 230 for single phase and 200,
230/460, 460, 575 and 2300/4000
volt for three phase designs, there’s
a Baldor•Reliance® pump motor
for your next pump system design
or retrofit replacement need. For
special applications and strict
industry specification requirements,
IEEE 841-2009, API 610, API 541
Lifetime Cost of an Electric Motor
Energy 97.3% Initial Purchase 2%
One Rewind 0.7%
www.baldor.com
479-646-4711
CIRCLE 22 ON READER SERVICE CARD

www.powermag.com POWER | May 201336
ENERGY POLICY
plants, which began operation in 1980 or ear-lier (and later, another one already in long-term shutdown), would be shuttered (Figure 1).
In June 2011, the cabinet and parliament passed a set of six laws and one ordinance—the so-called “Energy Package”—that adopted 120 individual measures of the 2010 “Energy Concept” and cemented a plan to permanently decommission all 17 of the nation’s reactors by 2022—without abolishing the nuclear fuel tax agreed to in September 2010. Energiewende was officially under way,
giving the power-intensive nation just over a decade to increase renewable generation from 17%, as it stood then, to 35%. Saying the coun-try’s grid would remain “controllable,” the Federal Network Agency (Bundesnetzagentur) urged states to approve more than a dozen new coal and gas plants and transmission upgrades over the next several years.
In the aftermath of the nuclear moratorium, the country’s four major nuclear plant operators called foul, loudly. Robbed of allowances to pro-duce the considerable remaining gigawatt-hours awarded by the Schröder government, RWE head Jürgen Grossmann called the phase-out de-cision a gross breach of property rights. E.ON’s CEO Johannes Teyssen warned of substantial financial losses, and Vattenfall CEO Oystein Loseth demanded “fair compensation” for losses as a result of the decision, based on “writing off” the plants, cancelled upgrades scheduled after September 2010, and decommissioning costs.
The utilities have turned to the courts and since won some crucial victories. Challenges that the nuclear fuel tax—which amounted to €1.5 billion by January 2013 within two years—could not qualify as a consumption tax were granted by the Hamburg Tax Court in September 2011, leading to refunds of €74 mil-lion for E.ON and €96 million for RWE. The federal government, however, later contested the tax court’s ruling and resumed collection of the tax, prompting the Hamburg court to rule more definitively that the German tax on nucle-ar fuel was simply “to siphon off the profits of the nuclear plant operators.” The Constitutional Court is now reviewing the case.
The German government is meanwhile strug-gling to fend off generator requests for more than €30 billion in compensation for confisca-tion of generating rights and costs associated with closure of the eight reactors. In February 2013, the administrative court for the German state of Hesse found the state ministry had no legal grounds when it ordered, on decree from the Merkel administration, shutdown of RWE’s Biblis A and B reactors. Damages are set to be decided in upcoming civil court proceedings.
A Renewable LifelineIn 2011 critics denounced the decision to phase out nuclear and replace it with renew-
ables as a “moral imperative” rather than an economic one. An assortment of think tanks warned of a “cost-tsunami” that was about to hit Germany and increase industrial operating costs by nearly a fifth in the country that al-ready had one of the highest power prices in the EU. Meanwhile, the term “green-paradox” was coined and went viral, expressing a much-maligned support for renewables that had little impact on carbon emission mitigation.
But against the backdrop of the decade-long nuclear contests, the FIT system (as established by the EEG in 1991) that obligated supply companies to purchase wind, solar, and bio-mass power and then pass costs to consumers was fueling tremendous growth of renewables. Between 2000 and 2010—under a looming ur-gency to secure energy supplies posed by the Schröder nuclear phaseout—the share of re-newables in Germany’s power profile soared from 6.4% (37 TWh) to 17% (103 TWh), and
installed nameplate capacities surged by almost 500%, from 12 GW to 56 GW. Photovoltaics (PV) fared the best, buoyed by the highest FIT of all technologies, with an average compensa-tion of 47¢/kWh in 2010, bringing in a total €3.9 billion that year.
According to government statistics, the closure of the eight reactors in March 2011 prompted another mammoth wave of new re-newables installations. The share of renewable capacity in the total generation mix increased from 34% at the end of 2010 to a stunning 41% in July 2012 (Figure 2). Comparatively, the to-tal amount of power generated by renewables was 115.2 TWh (Figure 3), or about 20.9% of the nation’s 551.4 TWh. About 91.2 TWh was eligible for remuneration under the EEG.
That may all be poised to change, however. This year, a renewable surcharge on private consumer electricity bills rose to a record 5.28¢/kWh, up 50% from 2012, 3.530¢/kWh in 2011,
SchwerinHamburg
Bremen
Hannover
Düsseldorf
Wiesbaden
Erfurt
Dresden
Magdeburg
Stuttgart
Kiel
Berlin
Potsdam
Neckarwestheim
I:
II:
1979 2009 2019
1979 2022 2036
2011
2022
Shut down
Operational
Provisionally scheduled shut-down (2000)
2010-agreed shutdown
Commercial operation
2011 closure plan
Isar
I:
II:
1979 2011 2019
1988 2020 2034
2011
2022
Gundremmingen
B:
C:
1984 2016 2030
1985 2016 2030
2017
2021
Biblis
A:
B:
1975 2008 2016
1977 2011 2018
2011
2011
Phillipsburg
I:
II:
1980 2012 2026
1985 2018 2032
2011
2019
Grafenrheinfeld
1982 2014 2028 2015
Grohnde
1985 2017 2031 2021
Emsland
1988 2021 2035 2022
Kruemmel
1984 2016 2030 2011
Brokdorf
1986 2019 2033 2021
Unterweser
1979 2012 2020 2011
Brunsbüttel
1979 2009 2018 2011
1. A nuclear snub. In 2010, Germany’s nuclear fleet comprised 17 operating reactors (six
boiling water reactors and 11 pressurized water reactors, all built by Siemens-KWU), the last of
which began commercial operations in 1989. After Fukushima, the government shuttered eight
reactors, and the remaining nine are scheduled to close by the end of 2022. Sources: POWER,
World Nuclear Association
800-624-8765 • [email protected]
© 2
013
Mag
netr
ol I
nter
natio
nal,
Inco
rpor
ated
• Rangespring’s1.25”rangeofmotionandturbulence-andvibration-dampeningeffectdeliveroutputs4xmorestablethantorquetubes
• Torquetubetravelsonly0.63”intocontrollerandisnegativelyimpactedbyturbulenceandvibration
• Rangespringnotsusceptibletofriction,eliminatingwear
• Enclosingtubeis0.09”thick,forrobust,corrosion-resistantpressureboundary
• Staticpressuresealpreventsfatiguefailure
• Knife-edgebearingscreatefrictionasthedisplacermoves,inducingwearandtear
• 0.01”thickenclosingtubepronetocorrosion• Flexingtorquetubeservesasprocesspressure
seal,promotingfatiguefailure
• Compactverticaldesignandremovable/rotatableheadeasytoinstallandmaintain
• Heavyassemblyandlargetube-armfootprintdifficulttohandle

Get
one
thing
straight
Outstanding output stability, structural
integrity and ease of use make the
E3 Modulevel® displacer transmitter
a better level control solution than
torque tubes.
Avoid the twists and turns of torque tube technology’s performance, durability and maintenance. The E3 Modulevel’s LVDT range spring technology is the straightforward choice for accurate, reliable liquid level measurement and control.
Contact Magnetrol®, the level control experts, for straight talk about E3 Modulevel displacer transmitters.
www.magnetrol.com
800-624-8765 • [email protected]
© 2
013
Mag
netr
ol I
nter
natio
nal,
Inco
rpor
ated
TR
UE
B
LU
E RE
LIA
BILIT
Y
E3 Modulevel® Torque Tube
Output Stability
• Rangespring’s1.25”rangeofmotionandturbulence-andvibration-dampeningeffectdeliveroutputs4xmorestablethantorquetubes
• Torquetubetravelsonly0.63”intocontrollerandisnegativelyimpactedbyturbulenceandvibration
Structural Integrity
• Rangespringnotsusceptibletofriction,eliminatingwear
• Enclosingtubeis0.09”thick,forrobust,corrosion-resistantpressureboundary
• Staticpressuresealpreventsfatiguefailure
• Knife-edgebearingscreatefrictionasthedisplacermoves,inducingwearandtear
• 0.01”thickenclosingtubepronetocorrosion• Flexingtorquetubeservesasprocesspressure
seal,promotingfatiguefailure
Ease of Use
• Compactverticaldesignandremovable/rotatableheadeasytoinstallandmaintain
• Heavyassemblyandlargetube-armfootprintdifficulttohandle
CIRCLE 23 ON READER SERVICE CARD

www.powermag.com POWER | May 201338
ENERGY POLICY
and 2.407¢/kWh in 2010. Meanwhile, the dif-ferential cost between the compensation agreed to under the EEG and the revenue from selling renewable electricity supplied to the grid has risen from €0.9 billion in 2000 to roughly €13 billion in 2011. Reports estimate that the aver-age German household currently pays €180 ($242) per year to subsidize renewable energy, highlighting that no upper limit on Germany’s subsidies for renewables has been set.
Responding to a renewed outcry about the
burden of the EEG on consumers, Environ-ment Minister Peter Altmaier and Econom-ics Minister Rösler proposed a short-term amendment of the EEG to rein in runaway costs, attempting to put a lid on the surcharge at 5.28¢ through 2014 and limiting its rise to 2.5% per year beginning in 2015.
Critically, the measure includes a €1.2 bil-lion saving measure that would see FITs for new renewables (with the exception of PV) commissioned after August 2013 that would
be equal to the market value of electricity for the first five months after commissioning and slashes FITs for onshore wind power to 8¢/kWh (compared to the current 8.8¢/kWh). For all other existing plants commissioned before August 2013, a 1.5% flat-rate reduction will apply in 2014 and is limited to that year.
No changes are planned for PV, experts point out, because existing policy mechanisms con-tain a volume-responsive degression model de-signed to keep annual PV installations within a target “corridor” of 2.5 GW to 3.5 GW. PV rates change on a monthly basis, and as of October 2012, degression is adjusted every three months based on the amount of PV capacity installed during the prior 12-month period. Exceeding the target corridor sets off a standard decrease that starts at 1% per month. This means, technically, the FIT price could decrease by a maximum of 29% or increase by up to 6% over a 12-month period. And it’s working: Following a record 7.5 GW of new PV installations in 2011, new instal-lations fell three months in a row at the end of 2012—though last year still saw another record of 7.6 GW in new PV installations (Germany’s FIT-eligible PV total in January 2013 was 32.7 GW). The 2012 record means solar FITs will see a 2.2% reduction each month from February to April 2013.
Although stakeholders seem to agree that surging power prices could capsize Ener-
giewende, the proposal has been met with skepticism by industry and lambasted by en-vironmental groups, which say it would mas-sively unsettle investors.
Experts, meanwhile have largely dismissed the move by the two ministers as a ploy to score points for conservatives running in the upcoming Sept. 22 federal elections. “Altmai-er’s plan is both, at best half-cooked, but also clever. It does not address important topics such as the further integration of renewables into the German/European energy system, the future design of the electricity market or adverse distribution effects,” wrote Frankfurt-based Deutsche Bank in a note to investors in March. In light of the current SDP/Green majority in the Bundesrat, moreover, “it is doubtful whether the ruling CDU/CSU/FDP coalition will be able to find the necessary majorities for this proposal. In addition, the constitutionality particularly of the proposed 1.5% reduction of feed-in tariffs for existing plants in 2014 will surely be questioned,” Dr. Matthias Lang, an energy lawyer at Bird & Bird LLP in Düsseldorf and author of the “German Energy Blog,” said in February.
Lang noted that the umbrella organization of German industry (BDI) had also presented a proposal to check rising EEG surcharges. Among five measures it proposes are those that abolish compensation that renewable genera-tors receive per the EEG if grid operators must
Geothermal energy
Sewage gas
Multiple energy sources (renewable)
Offshore wind
Landfill gas
Dammed water (excluding pumped storage)
Run of the river
Biomass
Onshore wind
Solar
Pit gas
Other energy sources (nonrenewable)
Waste
Mineral oil products
Pumped storage
Nuclear
Multiple energy sources (nonrenewable)
Brown coal
Natural gas
Hard coal
0 5,000 10,000 15,000 20,000 25,000 30,000 35,000
8
86
125
188
260
260
375
1,309
4,002
5,493
29,252
30,459
1,147
1,176
9,229
12,068
14,817
18,467
19,721
20,547
MW
2. Capacity on the German power grid. As of July 2012, Germany’s total installed
generation capacity of 67.5 GW was characterized by 30.5 GW of net nominal solar power
capacity, followed by wind power at 29.3 GW. The two renewable sources soar well ahead of
hard coal’s 20.5 GW, the third-highest installed capacity. More nonrenewable energy sources (a
total of 101.182 MW) were installed than renewable sources (71.181 MW), however. Sources:
Federal Network Agency, Federal Cartel Office
0 20 40 60 80 100 120 140TWh
Offshore wind
Multiple energy sources (renewable)
Dammed water (excluding pumped storage)
Run of the river
Solar
Biomass
Onshore wind
Mineral oil products
Other energy sources (nonrenewable)
Waste
Pumpled storage
Natural gas
Multiple energy sources (nonrenewable)
Hard coal
Nuclear
Brown coal
0.6
1.7
1.8
15.5
19.3
28
48.3
4
5.8
5.9
9.1
60.6
61.1
79.5
95.7
114.5
3. Net total power generated in 2011. Of a total 551.4 TWh generated by German
power plants in 2011, renewable energy sources (in dark green) generated 115.2 TWh, or about
21%. Nonrenewable energy sources generated the remaining 435.2 TWh, led by brown coal
(21%), and followed by nuclear power (17%), hard coal (14%), and natural gas (11%). Sources:
Federal Network Agency, Federal Cartel Office
PENNGUARD® Block Lining System
Tel: [email protected] www.hadek.com
Hadek is the expert on power plant chimney and ductwork protection, and a global distributor of thePennguard® Block Lining System.
We deliver:
• Research and feasibility studies
• Detail engineering
• Installation supervision
• Lifetime Performance Monitoring System
• 10 year limited warranty
Tomorrow’s chimneydesign: lighter, cheaper,built to last
The New Chimney Design from Hadek is a revolution in powerplant chimney construction.
It’s slim and lightweight, but built to last – even in seismicregions. It’s normally around five months faster and 20% less expensive to build than traditional chimneys.
The design is simple: a smooth reinforced concrete shell, withthe Pennguard® Block Lining System applied directly to itsinside surface. So there’s no need for a separate internal flue.
Why is the New Chimney Design the future?
It’s low maintenance, with minimal risk of component failure.It’s long-lasting – the Pennguard® lining has a projected servicelife of at least 20 years. It has outstanding seismic tolerance.Also it is designed specifically for a wide range of operatingconditions including low temperature FGD operation.
Make the New Chimney Design part of your plans. Contact Hadek now: 412 204 0028, [email protected]
Pennguard® is a registered trademark of Henkel KGaA and is used with their permissionThis advertisement is not to be considered a warranty concerning product performance

PENNGUARD® Block Lining System
PROTECTING POWER
PLANT CHIMNEYS
Tel: 412 204 0028
[email protected] www.hadek.com
Hadek is the expert on power plant chimney and ductwork protection, and a global distributor of thePennguard® Block Lining System.
We deliver:
• Research and feasibility studies
• Detail engineering
• Installation supervision
• Lifetime Performance Monitoring System
• 10 year limited warranty
Tomorrow’s chimneydesign: lighter, cheaper,built to last
The New Chimney Design from Hadek is a revolution in powerplant chimney construction.
It’s slim and lightweight, but built to last – even in seismicregions. It’s normally around five months faster and 20% less expensive to build than traditional chimneys.
The design is simple: a smooth reinforced concrete shell, withthe Pennguard® Block Lining System applied directly to itsinside surface. So there’s no need for a separate internal flue.
Why is the New Chimney Design the future?
It’s low maintenance, with minimal risk of component failure.It’s long-lasting – the Pennguard® lining has a projected servicelife of at least 20 years. It has outstanding seismic tolerance.Also it is designed specifically for a wide range of operatingconditions including low temperature FGD operation.
Make the New Chimney Design part of your plans. Contact Hadek now: 412 204 0028, [email protected]
Pennguard® is a registered trademark of Henkel KGaA and is used with their permissionThis advertisement is not to be considered a warranty concerning product performance
Concrete shell
Ambient temperature
15ºc (59ºF)
44ºc (111ºF)
23ºc(73ºF)
Pennguard® Block Lining System protects against acid condensate, high temperatures and thermal shock
Flue gas stream
44ºc
23ºc(
130ºc (266ºF)
50ºc (122ºF)
CIRCLE 24 ON READER SERVICE CARD

www.powermag.com POWER | May 201340
ENERGY POLICY
curtail renewables input that stem from grid
bottlenecks. It also calls for a strong signal on
the EU level for proper functioning of the Euro-
pean Emissions Trading System (EU-ETS) and
a new market-oriented electricity market design
on the federal level and in the states.
The current system resulted in conventional
power plants, particularly gas-fired generators,
that were increasingly unprofitable, the BDI
asserted. Federal figures estimate that of a to-
tal 172.4 GW of Germany’s installed capacity,
about 2.7 GW of non-intermittent generation
capacity is in cold reserve status—mostly in the
north. This capacity is unable to relieve the in-
creasingly tense supply situation in the south, but
could become operational within six months.
A Cloudy OutlookPermanent shutdown of the eight nuclear reac-
tors in March 2011 resulted in an immediate
“loss” of about 32.5 TWh of nuclear generation
in 2011 and, experts estimate, could result in a
loss of 41 TWh over 2012 and 2013. Reduced
nuclear generation as a result of the moratorium
was compensated for mostly by increased re-
newables generation (5 TWh) and a significant
reduction in net exports (6 TWh). Between
July 2011 and June 2012, however, data show
a gradual adapting of the demand and supply
FESSENHEIM - Feedwater Heater for CNPE - France
TAVAZZANO - HRSG for Power Plant - Italy
Porto CORsini - hrsg for Power Plant - Italy
SIDI KRIR - Steam Surface Condenser - Egypt
Heat Recovery Steam GeneratorsIndustrial BoilersHeat Transfer Products for Nuclear PlantsFeedwater HeatersSteam Surface CondensersPower Plant Service
Utility BoilersUSC BoilersBiomass Fired BoilersLow-NOx BurnersRegenerative Air Preheaters and Gas-Gas HeatersPower Plant Service:• inspections•recommendations•engineering solutions
STF S.p.A. Via Robecco, 20 20013 Magenta (MI) Italia Tel: +39 02 972091 Fax: +39 02 9794977 www.stf.it e-mail: [email protected]
BWE
Burmeister & Wain Energy A/S Lundtoftegårdsvej 93A DK-2800 Kgs. Lyngby - Denmark Tel: +45 39 45 20 00 Fax: +45 39 45 20 05 www.bwe.dk e-mail: [email protected]
BWE Energy India Pvt. Ltd No. 43, KB Dasan Road Teynampet Chennai - 600 018 TamilNadu, India Tel: +91 44 24 32 8101/2 Fax: +91 44 24 32 8103 e-mail: [email protected]
CIRCLE 25 ON READER SERVICE CARD
2010
TWh
350
300
250
200
150
100
50
02011 2015 2020 2025
Actual Transmission service operators (2011) Federal Environment Ministry (2012)
Federal Ministry of Economics and Technology (2011) National renewable energy action plan (2012)
Sum of federal targets (2011)
4. Comparison of renewable generation projections through 2025. Scenario
studies commissioned by the federal ministries of Environment (BMU) and Economy (BMWi), and
one from a German grid operator project that renewable generation will range between 199 TWh and
315 TWh by 2020. Compared with 2011, when renewables generated about 115.2 TWh, that repre-
sents a 72% to 173% increase. Sources: POWER, Federal Network Agency, DENA, BMU, BMWi

May 2013 | POWER www.powermag.com 41
ENERGY POLICY
balance to the new situation: By mid-2012, renewable generation reached 11 TWh—a level projected to be reached this year—and net exports increased again to 2010 levels. At the same time, electricity demand did not increase.
Renewable generation is expected to surge to between 231 TWh and 283 TWh by 2025 under separate scenarios from the federal ministries of Environment and Economy. More ambitious po-litical targets from the federal states, explained partly by different expectations for the growth of onshore wind power, project renewable gen-eration could reach 315 TWh as early as 2020 (Figure 4). If these projections are achieved by 2020, technically, renewables could exceed the roughly 140 TWh generated by Germany’s op-erational nuclear fleet in 2010.
A bevy of studies since 2011 examining the effect of the nuclear phaseout on power gen-eration, cost, emissions, and security of sup-ply in Germany concede that Germany’s best chances of replacing its nuclear power capaci-ty while meeting long-term climate protection targets (and most studies conclude that it is possible) will require substantially decreased exports to the Netherlands and Austria, in-creased imports from France and the Czech Republic, a grid expansion, and increased reli-ance (about 21 GW) on coal and gas plants.
As evidenced over the two winters since the announced nuclear phaseout, Germany’s supply issues will be most critical in the winter, when France typically relies on imports from Ger-many (because it relies on power for domestic heating). But it will likely also rely on imports to meet certain demand conditions, analyses from the European Network of Transmission System Operators (ENTSO-E) and research firm Prognos show. A number of scenario anal-yses forecast tight generation capacity in the southern regions, where most of the phased-out nuclear power is concentrated, and suggest ex-cess power from the north should be rerouted to the south—a recommendation strongly ad-vocated by the Federal Network Agency and ministries involved with the transition.
The Grid DilemmaIn the immediate aftermath of eliminating nearly 5 GW of secured generation capacity in the southern German region alone following Fukushima, the Federal Network Agency, in conjunction with German transmission system operators, warned that failure of key network equipment or a major power plant—caused by potential overloading of transmission routes and by voltage control in the southern region—could critically jeopardize security and reli-
ability of the German power supply. But when asked to decide by parliament by August 2011 whether one of the decommissioned reactors should be designated as a “cold reserve” plant to ensure security, the Federal Network Agency claimed that even with the disturbances it had warned about, system security in the transmis-sion network could be guaranteed—if a variety of measures were taken into account.
In May 2012, at the German Energy Agen-cy’s (DENA’s) behest, the nation’s four grid operators (TSOs)—50Hertz, Amprion, TenneT TSO, and TransnetBW—drew up a joint net-work development plan identifying necessary expansions to help transmit power from the North and Baltic Sea, where many offshore wind parks are being planned and built, to industrialized areas in southern and western Germany. Assuming wind power was the pri-mary driver of the expansion and increased from 27 GW in 2012 to 51 GW by 2020, at minimum, 4,400 km of existing lines would need to be optimized and 3,800 km of power lines (1,700 km of new alternating current and 2,100 km of new direct current) would need to be built. This could cost in the vicinity of €20 billion over the next decade, the TSOs said.
The urgency of an accelerated grid expansion has been underlined several times since last May
Potential is limitless.
An idea has no momentum until talented people start chasing it. It’s then that
one begins to glimpse what’s possible, and the future begins to take shape.
Today, we are thousands of people sharing ideas, dedicated to finding new
ways to meet the needs of an ever-demanding Power sector. Which is why,
when it comes to nuclear, natural gas, coal, renewables, hydroelectric and
electric delivery systems, more people are turning to us to get it done.
We are URS.
For more information, please contact 609.720.2000.
FEDERAL
OIL & GAS
INFRASTRUCTURE
POWER
INDUSTRIAL
URS.COM
CIRCLE 26 ON READER SERVICE CARD

www.powermag.com POWER | May 201342
ENERGY POLICY
by individual grid operators—as well as by the Federal Grid Agency, which warned that nuclear plant closures had brought the nation’s transmis-sion grids “to the edge of their resilience.” Over the past two years, the network has seen several near-misses, the most worrisome among them the periods between Christmas and New Year’s Eve in 2011 and in the midst of a February 2012 cold spell. And this March, 50Hertz revealed in its full-year results for 2012 that it had to curtail generation from renewable power producers (the last tactic to maintain reliability after reducing generation from conventional plants) to avoid oversupply on 77 days last year—almost double the 45 days in 2011.
The government has responded by making grid expansion a priority. The TSOs’ so-called “Grid Development Plan” forms the basis of the “Federal Requirement Plan for Transmis-sion Networks,” which identifies as “urgent” under the German Energy Act a total of 36 projects, including three north-to-south elec-tricity highways and 21 projects that traverse state or country borders. The cabinet in De-cember 2012 agreed to fast-track construction (within four years) of 2,800 km of new power lines and upgrade of 2,900 km by designating, with approval from the country’s 16 federal states, the Federal Grid Agency as the only competent planning authority and allocating
legal disputes concerning the expansion to a single federal administrative court. The plan will cost, without accounting for costs of un-derground cables, about €10 billion, the gov-ernment claims.
Meanwhile, distribution grids, which connect smaller renewables installations and convention-al power stations, will also require considerable expansion and modernization, the scale of which will depend on specific tasks assigned to the na-tion’s 800-plus distribution grid operators when developing smart grids. With liberalization of the electricity market and expansion of renew-able sources, distribution grid mandates have mounted, requiring, for example, that operators ensure their grids remain stable despite increased levels of intermittent generation.
Yet progress has all but stopped. An evalu-ation of TSO data from October 2012 shows a large portion of the planned power lines prioritized to be newly built or upgraded much earlier, under the 2009 Power Grid Ex-pansion Act (EnLAG), have been stalled by delays (Figure 5): Of the total 1,834 km of extra-high-voltage power lines, just 214 km (nearly 12%) have been completed. During 2012, only 35 km were expected to be added. This year could see the much-needed com-pletion of a key line that could secure system reliability in the greater Hamburg region and all of northern Germany, which is absorbing the impact of decommissioning the closed Krümmel and Brunsbüttel nuclear reactors.
Security of SupplyDirectly tackling unpredictability in supply to the grid from renewables, the government is enforcing a number of measures, includ-ing passage of an ordinance that requires nearly 400,000 older PV systems over 10 kW to be upgraded to avoid simultaneous shutdown when a frequency of 50.2 Hz is exceeded. Reaching a frequency of 50.2 Hz is unusual—but it could happen, experts say, especially in situations where electricity pro-duction is higher than demand due to a grid disturbance. In November 2006, frequencies reached 50.2 Hz in Germany when power failed first in Cologne, Germany, before shut-ting down across parts of France, Italy, Spain, and Austria and cutting power to 15 million people across the rest of Europe.
Major power consumers are also able to make loads available to grid operators for load reduction and shutdowns, to provide TSOs with an added means of balancing electricity fluctuations. “The Ordinance on interruptible loads has opened up new pos-sibilities for developing load management potential,” the Economics Ministry said in a statement. And the Federal Network Agency and grid operators had reportedly contract-ed adequate reserve capacities for winter
5. Super-charged ambitions. As this October 2012 map from the Federal Network
Agency shows, of 1,834 kilometers (km) of Germany’s extra-high-voltage lines that are on the
fast track to be newly built or upgraded under the 2009 Power Grid Expansion Act, just 215
km—about 12%—have been completed. In 2012, only 35 km were expected to be added.
Germany’s existing extra-high-voltage grid of 17,610 km is webbed over its 16 federal states.
The grid is overseen by the four transmission system operators whose areas are shown here.
Source: Federal Network Agency

May 2013 | POWER www.powermag.com 43
ENERGY POLICY
months, increasing from about 1 GW in 2011 to about 2.6 GW earlier this year.
Efforts are also under way to upgrade distri-bution grids to accommodate smart grid tech-nologies and prepare for a high percentage of renewables. The Economics and Environment ministries recently completed a €140 million four-year study in six pilot regions, testing in-formation and communication technologies, including smart grids in rural areas and virtual power plants (a list of the projects is available at http://bit.ly/11k3hgH). The “E-Energy” program reportedly demonstrated that the en-ergy consumption of private households could be reduced by up to 10% using intelligent sys-tems and appropriate incentive mechanisms.
On the generation side, the government has boosted incentives for investment in com-bined heat and power generation. To enhance reliability, it has also established liability rules for delays and disruption to the connec-tion of offshore wind parks. A tremendous amount of offshore wind—from 100 MW to 13,000 MW—is expected to play a major role in Energiewende through 2050.
Grid operator TenneT, which bought the 11,000-km-long grid network from E.ON in 2011 and has been tasked with connecting all wind parks in the North Sea, has warned of looming bottlenecks stemming from “major difficulties in planning and building prog-ress.” Showing symptoms suffered generally by the global offshore wind sector, growth of Germany’s offshore wind market has been stunted as participants “reached the limits of their resources,” facing “severe prob-lems with financing,” TenneT said. German politicians blame the Dutch company for the repeated delays, however, saying TenneT ap-parently lacks both the right management and necessary equity capital to establish urgently needed connections to the wind farms owned by major utilities like RWE and E.ON.
The issue has also prompted calls for the creation of a national grid company with public investment, and many—among them, power companies and pro-industry politicians—rec-ognize its possible benefits. If grid owners that oversee the country’s four grid zones—which suffer different line prices and individual control stations and control centers—were combined, both administrative costs and electricity prices could be slashed, say executives at E.ON.
A Desperate Need for StorageGermany also must deal with a huge tem-poral power surplus, extremely large load gradients, and long “calms”—periods of low wind, typically experienced in the winter. Holger Gassner, head of markets and politi-cal affairs at RWE Innogy GmbH, estimates that in 2050, a 10-day span when wind farms generate less than 10% of capacity would re-
quire 313 times the current pumped storage capacity to bridge the “calm.”
In its first crucial step to address this pre-dicament, the government in the summer of 2011 defined grid fee exemptions for electrical energy storage facilities and existing pumped storage; it later attempted to improve policy conditions for investments in pumped storage plants. As have other industry observers, Jens Hobolm of the European Center for Economic Research and Strategy Consulting points out that pumped storage potential in neighboring
Scandinavian reservoirs is 2,300 times that available in Germany, where 30 pumped stor-age plants have a capacity of 6.8 GW; when magazines are fully loaded, they can run for 4 to 8 hours and produce a total of 0.04 TWh.
Noting that surplus electricity—to the tune of 38 TWh by 2050—reserve power, and ancillary services would be Germany’s foremost challenges over latter period of the transition, Hobolm suggests 7 GW to 12 GW of new interconnectors between Germany, Norway, and Sweden, of mutual economic
Sturtevant’s Whirlwind Air Classifier...
The Whirlwind Air Classifier is a mechanical centrifugal air classifier specifically designed to not only eliminate fine powders, but also to remove fiber from shredding/ground tire rubber at a higher throughput. Airflow is self-contained and recycled by return air vanes. Unlike Gravitational Inertial classifiers, the Whirlwind does not require the additional expense of cyclones, dedicated bag houses, airlocks, external fans or ductwork and do not experience any binding problems, like fine screens do.
Sturtevant, Inc.
348 Circuit StreetHanover, MA 02339T (800)992-0209F (781)829-6515
��
ceramic
,
the
Due
generate
secondary
Circulating Fan
Separating Zone
Selector Blades
Fines Cone
Fines DischargeCoarse Discharge
Coarse Cone
Distributing Plate
Control Valves
Fineness Control
Feed Spout
Return Air Vanes
Efficiently removes fine powders and fibers from
tire rubber at 40-60 mesh.
• Lowers capital cost• Operates at low speeds• Provides 40 - 50 years
of operating life
• Wear areas are protected with replaceable steel, rubber or ceramic liners
The Whirlwind Air Classifier:
CIRCLE 27 ON READER SERVICE CARD

www.powermag.com POWER | May 201344
ENERGY POLICY
benefit, could be built so that about 10 TWh to 20 TWh (26% to 52%) of Germany’s sur-plus electricity could be stored there.
That front, too, is seeing progress. In March, Norwegian and Dutch power grid operators, Statnett and TenneT, along with German development bank KfW, announced plans to build NORD.LINK, a 1,400-MW high-voltage undersea connection. A final de-cision wouldn’t be made until 2014, though developers have announced planning of a second €2 billion link, NorGer, that could possibly materialize within a decade.
Meanwhile, it has been suggested that un-til at least 2020, storage capacities in the Alps could help store surplus PV electricity from southern Germany. But, notwithstanding the time and cost required to build new pumped storage capacity, several experts have warned that the role Scandinavia can play in such a scenario is unclear. Norway, for example, holds hydro reservoirs of 84 TWh—half of all Europe’s hydro storage capacity—and already acts as a “green battery” for Denmark and the Netherlands. Hydro storage expansion would need political action on Norway’s current elec-tricity policy that far exceeds 2020 and would have to consider a multitude of technical, eco-nomic, and environmental implications.
Carbon Commitments and a Dash to Coal One of the EU’s core member states, Germany has been at the forefront of the continent’s ef-forts to curb carbon emissions, spearheading the European energy and climate package in 2007 under the German EU presidency. The so-called “20-20-20” package called for greenhouse gas reductions of at least 20% of 1990 levels by 2020, increasing use of re-newables to 20% of total energy production by 2020, and cutting energy consumption by 20% of projected 2020 levels by improving energy efficiency. Yet Germany’s own climate targets, driven by environmental movements in the Green Party, are more ambitious than the EU’s: a 40% reduction of greenhouse gas emissions by 2020 and 80% to 95% in 2050.
Though Energiewende was designed to com-plement those goals, Germany’s carbon dioxide (CO2) emissions are on the rise, as the Environ-ment Ministry noted this February, increasing 1.6% (932 million tonnes of CO2 equivalent per year). The ministry, which brushed off the increase, saying the nation had “comfortably” met its Kyoto Protocol targets, coming in 193 million tonnes per year under its target by the commitment date in 2012, pegged the increase on unusually cold weather and heightened use
of coal. Had shuttered nuclear reactors operated as planned, critics pointed out, and Energie-wende not been instituted, Germany could have reduced its carbon emissions to an all-time low of 897 million tonnes per year.
But Germany needs coal, experts say. In the two years since the nuclear moratorium, the nation has urgently needed new baseload power plants to shoulder the country’s annual peak load of 80 GW. Only about 12 GW of the nation’s reliably available capacity of 160 GW is currently met by renewables, which includes wind power to a minor extent, and is mostly hydropower. “How great this need for conventional power plant capacity actually is depends on a number of variables,” says the Economics Ministry, adding that “it is . . . very difficult to put a figure on the power plant capacity needed.” The future expansion of renewable energy plants, the possibility of using an interregional system to balance fluc-tuating supply and demand in the electricity market, and the continued development of storage technologies are just some of the fac-tors that come into play, it adds.
Environmental and citizen groups have launched numerous legal challenges, and suc-cessfully stalled development of several coal projects. Meanwhile, rejection of a draft bill to
• Rigorously tested for over 60 years for exceptional performance
• Resistant to harsh chemicals, high temperatures, and high pressures
• Long service life
• Globally available
CIRCLE 28 ON READER SERVICE CARD
Power & Industrial Services Combustion Improvement Systems
Visit us at the Electric Power Show • Booth #117Brian King, PE, will present a paper on OFA upgrades to reduce NOx on Wednesday, May 15.
800.676.7116 • www.piburners.com • [email protected]
Higher Eiciency.More Reliability.Lower Emissions.
Over Fire Air Systems
Multi Zone Low NOx Burners
Fire Up with Turnkey Combustion Optimization Systems from Power & Industrial Services
Our proprietary Combustion Optimization Systems with Low NOx Burners, Over Fire Air Systems, Comprehensive Testing and Tuning and patent-pending technology ofers the industry’s only one-stop, full-service solution to custom design, engineering, manufacturing and installation, with:
· Comprehensive Coal and Burner System Review· Baseline Testing· New Burner System Design· In-house Manufacturing Facilities· Complete Project and Construction Management· Start-Up and Performance Testing· QSTI Certiied Testing· RATA Testing also available
••
••••••
CIRCLE 29 ON READER SERVICE CARD

www.powermag.com POWER | May 201346
ENERGY POLICY
allow pumping of CO2 underground into former gas storage facilities in 2011 has slowed plans for carbon capture and storage and derailed government plans to curb carbon emissions that way. Vattenfall in December 2011 shelved dem-onstration of an oxy-combustion carbon capture technology at Jänschwalde in Brandenburg, and no efforts have been made to restart it.
A common complaint from industry stake-holders is that a regulatory framework for the conventional power plant market has to be redesigned. An amendment of the German Energy Act that became effective in January provides only for the possibility to postpone planned shutdowns of power plants to im-prove the security of supply, but incentives for new state-of-the-art power plants that can balance the fluctuating input of renewables still have to be set.
That hasn’t deterred conventional hard coal–fired power plants from increasing their share of power production to 19.1% in 2012 (jump-ing from 18.5% in 2011). Lignite-fired plants remain the most important power producers in Germany, increasing their share in the electricity mix to 25.6% (from 24.6% in 2011). And until 2015, most of Germany’s new-build conven-tional power plant capacity will be coal-based, analysts say, pointing at a project pipeline of 8 GW of new coal-fired capacity compared with 1 GW of new gas-fired installations.
The main reason for new coal plants: pure economics. According to early November 2012 estimates from research firm Bloomberg New Energy Finance, German utilities were set to lose an average €11.70/MW but gain €14.22/MW when they combusted coal. Another loom-ing policy change fueling the rush to burn more coal over gas is that in 2016, an EU directive will become effective that will force utilities to either close coal-fired plants that do not meet new environmental standards or install costly pollution control devices.
Of 13 coal plants proposed since 2007, two plants had come online by November 2012: Vattenfall’s €2.2 billion, 675-MW lignite-fired Boxberg plant in Saxony, and RWE’s €2.6 bil-lion, 2.2-GW BoA 2&3 in North Rhine–West-phalia. Eight others were under construction, all fired by hard coal. These include E.ON’s 1.1-GW Datteln plant in North Rhine–Westphalia and Vattenfall’s innovative heat and power 1.6-GW Hamburg-Moorburg plant. Both are expected to begin operations in 2014. Three others are in the planning phase: two lignite plants and a hard coal plant.
Particularly noteworthy is that many plants in Germany’s new coal-fired fleet are designed for flexibility. RWE’s August 2012–commissioned BoA 2&3 (Figure 6) near Cologne, for example, has rapid-response capabilities. Each lignite-fired unit can modify its output by 500 MW in just 15 minutes, the utility says. The plant also uniquely
stores its pulverized coal in a silo to more eas-ily control how much is fed to the boiler. That enables it to power down to as little as 10% of its maximum output. Other companies are ex-ploring manufacturing boiler walls with thinner, special steel alloys that can withstand rapid and extreme changes in temperature occurring when a plant’s output is adjusted up or down.
A Gas DazeA new fleet of power plants fired by natural gas may have better fit the jagged generation gap left by the nuclear phaseout, given gas power’s reduced carbon emissions and flex-ibility to balance feed-in variations. But last year, cheap coal imports and low carbon trad-ing prices negatively impacted spark spreads and squeezed natural gas–fired power plants to the margins or out of the merit order.
Locked into expensive oil-indexed gas sup-ply contracts while still gradually negotiating discounts from producers such as Norway’s Statoil and Russia’s Gazprom, gas generators are seeing adverse market conditions that are driving down negative profit margins. Some are already mothballing or considering decom-missioning existing gas plants in Germany.
E.ON, which spent €400 million just three years ago to build its state-of-the-art Irsching 5 unit, an 847-MW advanced combined cycle power plant near Ingolstadt, is looking to close the plant because last year it operated less than 25% of the time it was designed for. “If the plant keeps putting up red figures, it makes little sense to keep it operational,” an E.ON spokeswoman said. “No decision has been taken to date,” as the plant’s operators were still in negotiations with the Bavarian government and the grid op-erator TenneT, she said. In March, meanwhile, Norwegian generator Statkraft put into cold re-serve its 510-MW Robert Frank plant (Figure 7) in Landesbergen after grid operator TenneT classified it as “non-system relevant.”
“Unfortunately, the market perspectives for gas-to-power in Germany have continued to deteriorate over the past twelve months,” Dr. Jürgen Tzschoppe, senior vice president of continental energy at Statkraft explained in a statement. “Based on the current market status, it is not possible to operate the plant economi-cally. And we cannot justify keeping a reserve unit in the portfolio while the efficient [com-bined cycle] power plants in Knapsack . . . and Herdecke are hardly running.” Statkraft, which is building another “ultra-modern” combined cycle gas and steam turbine plant at Knapsack, would “need to seriously look into the market design . . . yet to be created,” Tzschoppe said.
The effect on utilities with a high thermal power exposure has been devastating. RWE and E.ON have, for example, seen depressed gas businesses for three years even though Europe-an spot gas prices have fallen. And the outlook
looks “bleak,” Josef Pospisil, head of utilities and transport at Fitch Ratings told reporters at a briefing in March. “It’s a fairly weak funda-mental picture, one of weak demand, slight ca-pacity increases, and unpredictable politics,” he said. Anti-coal politics could possibly generate a fundamental shift, but radical reforms are not expected this year, before the Sept. 22 national elections, he pointed out.
Germany’s ability to produce power from unconventional gas remains uncertain. Shale gas drilling has been a headline-making and conten-tious political subject that features prominently
6. A coal irony. The European Union’s car-
bon emissions have been on the rise since the
global recession two years ago, despite man-
dates to cut them to 80% of 1990 levels by
2020 and the prevalence of its emissions trad-
ing scheme. Germany will start up 5.3 GW of
new coal capacity this year alone as its utilities
bank on coal’s cost advantage over more-expen-
sive oil-indexed natural gas. New plants—such
as RWE’s BoA 2&3 (shown here), a 2.2-MW
lignite-fired plant commissioned in August 2012
in Grevenbroich-Neurath near Cologne—will
feature advanced technology. These twin units
are reportedly able to offset the intermittency
of renewables by modifying output by 500 MW
within 15 minutes. Courtesy: RWE
7. A gas suspension. Though gas
power is seen as more efficient and environ-
mentally friendly than coal as a complement
to renewable power in Germany, market
conditions have made it uneconomical for
generators like Statkraft to operate older gas
plants. The Norwegian firm in March put its
510-MW gas-fired Robert Frank plant (shown
here) in Landesbergen, Lower Saxony, into
cold reserve. Formerly owned by E.ON, the
1962-built combined cycle plant with a net ef-
ficiency of 43% was the first large gas power
station in Germany. Courtesy: Statkraft

CIRCLE 30 ON READER SERVICE CARD

www.powermag.com POWER | May 201348
ENERGY POLICY
in the rhetoric of politicians seeking votes, and Merkel’s government in February unveiled a new draft law that permits development of the unconventional fossil fuel through fracking, al-beit with conditions. These include environmen-tal safeguards that outlaw fracking in protected areas and near drinking wells—an area estimat-ed to cover about 14% of German territory.
The Larger ContextGermany’s decision to transition to an al-most purely renewables-based system by 2050 wasn’t exactly abrupt, as some observ-ers point out. It isn’t a Sonderweg—which suggests Germany is going it alone on the fringe of the continent’s mainstream—as Paul Hockenos, a blogger for a nonpartisan think tank, the German Council on Foreign Relations, argues. At least 11 of the EU’s 27 members have no nuclear power at all, while five others, including Italy, have pledged to phase out nuclear reactors altogether. And 18 EU countries have implemented renewable support policies similar to Germany’s.
Others note that Germany is a nation with nine direct neighbors and imports 100% of its consumed uranium, 98% of its oil, 82% of its natural gas, and 77% of its hard coal—and the bulk of oil and gas imports, about
35% each (more than the EU average), come from Russia. Until 2011, Germany had been a net electricity exporter, sending 58 TWh to its neighbors in 2010. After the eight nuclear reactors were shuttered in March 2011 by order of the government, a series of reports released by the Federal Network Agency analyzing scenarios under different condi-tions concluded that Germany would be able to generate sufficient power to cover its own electricity needs, but it could no longer sup-port security of the European interconnected grid to the extent it had done previously.
Consequently, in the EU, Germany’s transi-tion is being viewed with suspicion. A frequent critic of the country’s surging power prices is EU Energy Commissioner Günther Oettinger. The former head of the southern German state of Baden-Württemberg has cautioned that Germany is pushing energy sector reforms too fast, pointing out that investments in solar and wind power don’t match the speed of grid extension and storage capacity. And the transi-tion is occurring without regard for a bigger European framework.
The consequences of Germany’s transition will not be limited to Germany, which borders so many other member nations, Oettinger has argued. In the EU, “All member states are
aware of the need to transform their energy systems to ensure that they are sustainable in the long run and to enable Europe to reach its 20-20-20 targets. Moreover, they know that they need to act in cooperation. In an integrat-ed market, this is the only way to ensure that the transformation will be a success.
“Let me give you an example: the integration of renewables into the grid will be possible only in a fully integrated and interconnected market. In a fragmented market the necessary invest-ments would not be viable and hence would not take place,” he told IP Journal, a publication of the German Council on Foreign Relations.
Oettinger has reportedly suggested that as a first step toward a pan-European policy, some countries (possibly Germany, France, Belgium, the Netherlands, and Luxemburg, which make up the 2010-launched Central Western Europe market region and is the European hub of power trading) could set up joint market mechanisms and expansion targets for renewables.
But challenges remain before Europe can set up an internal electricity market by 2014, as planned, and one frequently cited hurdle is re-solving whether the priority with which renew-able electricity has to be purchased and marketed by grid operators under Germany’s EEG is com-patible with the European Single Market.
CIRCLE 31 ON READER SERVICE CARD

Select Natronx Technologies – the experts in air quality control.
Natronx proudly ofers the EnProve™ product line of sodium sorbents speciically developed
for the optimal removal of acid gases.
Count on Natronx
to deliver reliable sorbents and optimize your Dry Sorbent Injection
system performance.
In the race to compliance...Make the winning choice
Natronx Technologies, LLC
469 North Harrison St. | Princeton, NJ 08543 | 855.285.7652
For removal of HCl,
SO2, SO
3 and HF
emissions, Natronx is
the clear choice.
For more information,
call us today at
855.285.7652 and visit
us at our website at
www.natronx.com.
CIRCLE 32 ON READER SERVICE CARD

www.powermag.com POWER | May 201350
ENERGY POLICY
Solutions are also being sought for insidi-ous and unexpected surges of wind power from northern Germany that find a path of least re-sistance to the power-hungry south through circuitous routes via the grids of neighboring Poland, Hungary, the Czech Republic, and Slo-vakia. These “loop flows” have been blamed for congestion of cross-border transmission ca-pacity and, worse, pose threats to the network security conditions of Germany’s neighbors, the affected countries’ grid operators said in a March 2012 report. Recently, the German In-stitute of Applied Ecology (Öko-Institut) said, however, that it could not confirm those find-ings, noting only that loop flows with Poland exceeded 2.5 GW once, in 2011, when wind production was between 4 GW and 8 GW.
Even so, France and the Netherlands have already installed phase-shifting transformers to redirect electricity by increasing trans-mission resistance as a defense against loop flows, and the Czech Republic and Poland are reportedly considering the same. As some experts point out, if its neighbors limit flows during power surges, the grid stability prob-lem will be shifted back to Germany.
Seeking Future SolutionsAmong Germany’s efforts to secure a reliable
and affordable future energy supply is the adop-tion of a new research program, which has ear-marked funding of roughly €3.5 billion through 2014—75% more than from 2006 to 2009—to support development of sustainable energy technologies. The funds are split among sup-port for nonnuclear energy technologies along the entire energy chain, ranging from high-efficiency production in modern power plants, decentralized energy systems, smart grids, and storage modules to energy usage in energy-op-timized buildings and towns as well as efficient industrial processes.
But even these efforts have been opposed by critics, who say that though the technolo-gies or concepts funded are indeed achiev-able, they are still far from being ready for market. Hampered by excessive costs, their operation could be delayed far beyond the politically desired timeframe due to other deficits, and they won’t play an immediate role in Germany’s energy transformation.
A better investment would have been to open up regenerative energy sources for heating mar-kets instead. “Solar heat and use of the Earth’s warmth should have been advocated more ef-fectively, yet this never came to pass. The use of distant heat from the deep layers of the Earth instead of the absurd unprofitable geothermal
power plants would have been far wiser. . . . Available wind power in this country, where the potential for pump storage is poor, should be used solely to produce hydrogen which can be used in return as fuel or as a chemical com-modity,” energy expert Dr. Günther Keil, as-serts. The bottom line is that “New installations should be prohibited by law, or left to the laws of the free markets,” he says.
A Costly RebalancingUltimately, reforming and restructuring Ger-many’s energy sector by the end of the 2030s could cost as much as €1 trillion, Environ-ment Minister Altmaier said in February 2013. Most of these costs are related to re-newable FITs, which could total some €680 billion by 2020—and increase if the market price of power falls, he warned.
The cost implications are tremendous for Germany, which has seen costs associated with energy consumption double over the past 12 years. Compared with €59 billion in 2000, energy spending spiked to €124 billion in 2011—an increase of 20% over 2010. The Economics Ministry blames higher energy prices for primary energy resources in the international commodity markets. But power prices, central to the competitiveness of Ger-
Comprehensive Gas Turbine service solutions
www.turbocare.com
TurboCare offers a single source for the complete range of
products and services for gas turbines, including field services,
rotor inspections and repairs, hot gas path and
combustion component repairs, and replacement components.
CIRCLE 33 ON READER SERVICE CARD
•••••

Putting Nature to Work
A utility client was looking for ways to reduce selenium
and mercury from the industrial waste stream of a coal-fi red
power plant. Their focus was on fi nding tools to preserve
environmental quality. Chris Snider led the team of client,
academic and Burns & McDonnell professionals in fi nding
the solution: constructed wetlands. At the end of an intensive,
2-acre pilot project — a $3 million investment — the client
has a blueprint to move on to a larger-scale wetlands that
will be a cost-effective, engineered fi lter for reducing
elements to below regulatory compliance levels.
WHERE WATER and POWER MEETCUSTOMIZED WATER SOLUTIONS THAT F IT YOUR POWER PLANT
Chris is a recognized technical leader in landfi ll design and coal
byproduct handling. He has 18 years of experience with solid waste
disposal and landfi ll-related subsurface investigations. He is one
of our experienced power plant professionals who can help you identify the
water alternative that fi ts:
• Zero liquid discharge
• Customized wastewater treatment and water management
• Constructed wetlands
• Landfi ll and pond management
• Bottom ash handling
9400 Ward Parkway
Kansas City, MO 64114
www.burnsmcd.com/water-team
E n g i n e e r i n g , A r c h i t e c t u r e , C o n s t r u c t i o n , E n v i r o n m e n t a l a n d C o n s u l t i n g S o l u t i o n s
CIRCLE 34 ON READER SERVICE CARD

www.powermag.com POWER | May 201352
ENERGY POLICY
man industry, have also surged, on the back of steadily rising taxes and levies—which today make up almost 40% of the price of indus-trial electricity. The expedited nuclear phase-out could add another 0.5¢ to 1.5¢/kWh, an enormous burden for power-intensive indus-tries, for whom a price hike of around 1¢/kWh translates into an increase of roughly 20%. The Economics Ministry estimates ad-ditional costs for a large aluminum producer with a consumption rate of 4,000 GWh, for example, could surge to €40 million.
That’s why, the ministry says, the fed-eral government agreed with the 2011 En-ergy Package to introduce compensatory arrangements for businesses competing at a global level, including measures to offset increases in the price of power stemming from the EU’s carbon emissions trade, and a cap on their renewables allocation charge. Cost reductions in 2012 for some 202 Ger-man firms, including steelmakers and those in the chemicals industry, amounted to €440 million. But that measure, too, is under fire: The EU Commission this March launched a formal probe into whether energy price cuts granted to these energy-intensive consumers constitutes a breach of anti-trust rules to the detriment of German consumers because, it
says, the reductions are rolled over to ordi-nary Germans’ power bills.
According to researchers at the Institute of Economic Structures Research GWS, a private consulting firm in Osnabrück that carried out a cost-benefit analysis of the in-tegration of renewables in Germany between 2008 and 2011, the benefits apparently “more or less” outweigh the costs—though, it cautions, several unresolved questions re-main. It concludes “there is no sign yet of a final unequivocal judgement about the over-all economic costs and benefits” of a renew-able energy expansion. One plus would be added jobs: About 382,000 jobs were added last year to the burgeoning renewables sec-tor (about 1% of the workforce), and by 2030—when renewables should make up at least 35% of Germany’s power profile—renewables jobs should increase to 600,000. Renewables also lower the price of power during the middle of the day by significant amounts—but increase household bills via the EEG surcharge, the group said.
Mounting OppositionEnergiewende’s success is deeply rooted in wide public acceptance, but almost ev-ery facet required to ease the transition has
been opposed by industry, citizen groups, and environmentalists. A substantial num-ber of citizen action groups—Wutbürger (angry citizens)—have fiercely objected to the construction of new wind parks for noise and aesthetic reasons, for example. Pumped storage projects, high-voltage transmission projects, and carbon storage sites have also been protested, some successfully, as has construction of new advanced technology coal-fired power plants. Renewables, too, have been targeted by ecologists, who, un-settled by the effects of the energy transition across the country, protest clearing of forests for biomass or the conversion of tracts of land for solar and wind farms. That conflict has even driven a wedge within the Greens, splitting the political party that championed the nuclear phaseout in the 1980s and rallied for clean energy through the 1990s into pro-ponents of the transition and stewards of the environment.
Rhetoric supporting a wide range of views backing or opposing facets of Energiewende has heightened and will likely get increas-ingly shrill until the September election at least. What happens beyond the election is a lot harder to discern. ■
—Sonal Patel is POWER’s senior writer.
Lower DischargeTemperatures with
RENTAL COOLINGTOWERS
RENTAL SOLUTIONS
888.869.2108www.coolingtower.com
Maintaining discharge temperature limits can be challenging during hot weather or droughts. Aggreko is the world leader in temporary cooling towers and every year we help many of the world’s largest power producers maximize generation and comply with discharge limits with the use of temporary cooling tower modules.
Let us show you how you can lower the temperature of your cooling water today by contacting your local Aggreko rep.
Rental Cooling Towers
Lower Discharge Temperatures
Installations complete inas little as 7 days
24/7/365
CIRCLE 35 ON READER SERVICE CARD

Where does the Industry fi nd its best people?
POWER magazine has served the generation industry for more than 128 years. Now POWER is making it easier than ever for industry professionals to � nd career opportunities and for hiring authorities to � nd the best candidates for open positions. The Careers-in-POWER job board on powermag.com allows visitors to post resumes anonymously, view the latest job positions, post job listings, and set up personal job alerts.
JOB SEEKERS:Access the most recent positions available to engineers, operations and maintenance managers, and corporate and general managers at coal, nuclear, combined-cycle, and renewable power plants.
EMPLOYERS/RECRUITERS:Attract highly quali� ed candidates by posting open positions on the Careers-in-POWER job center.
Visit careersinpower.com to become part of the fastest growing site dedicated to connecting power generation employers and employees.
For more information, contact DIANE HAMMES, 713-444-9939, [email protected]
www.careersinpower.com
CIP10 ad_8.125x11v3.indd 1 2/14/11 2:41:21 PM08_PWR_050113_SR_Germany_p34-53.indd 53 4/12/13 1:03:16 PM

www.powermag.com POWER | May 201354
NUCLEAR POWER
OPG Proposes New Nuclear Construction at Darlington The Canadian Nuclear Safety Commission has issued a License to Prepare
Site for Ontario Power Generation’s Darlington station expansion. This is the first of a series of licenses required to prepare, construct, and operate new nuclear reactors and the first of its kind issued in Canada in over a quarter-century.
James M. Hylko
On August 17, 2012, the Joint Review
Panel (JRP) of the Canadian Nuclear
Safety Commission (CNSC) issued
a License to Prepare Site (LTPS) to Ontar-
io Power Generation Inc. (OPG) for a new
nuclear power plant project at its Darlington
site (Figure 1). The license application cov-
ers up to a four-unit plant expansion called
Darlington B, with a maximum combined
output of 4,800 MWe. However, it should be
noted that the provincial government’s most
recent plans call for development of only two
units for a total of 2,000 MWe. OPG will be
the owner and operator of the new plant if it
is approved by the government.
The Darlington B site is located on the
shore of Lake Ontario, in the Municipality
of Clarington, approximately 65 km east of
Toronto (Figure 2). The adjacent site is cur-
rently home to the four-unit, 3,512-MWe
CANDU Darlington Nuclear Generating
Station (Darlington A), the Darlington
Waste Management Facility, and a licensed
used fuel dry storage facility. The portion
proposed for development of Darlington B
is primarily the eastern third of the plant
site. Built in stages, the Darlington A units
entered commercial service from 1990
through 1993 and now provide about 20%
of Ontario’s electricity needs.
Development of additional nuclear ca-
pacity at the Darlington site is part of a
February 2011 integrated power system
plan that includes refurbishment of the ex-
isting Darlington units and Bruce Nuclear
Generating Station. On March 14, 2013,
OPG received environmental approval for
the Darlington A refurbishment, which is
expected to run from 2016 to 2023 and cost
between C$6 billion and C$10 billion. (The
U.S. and Canadian dollars have been at
virtual parity.) The province’s 2010 Long-
Term Energy Plan (LTEP), which calls for
nuclear supplying about 50% of total gen-
eration going forward, found the new units
are necessary to replace nuclear power
it will lose when its Pickering units shut
down; that shutdown was originally sched-
uled to occur in stages between 2014 and
2016 but has been pushed back to 2020.
The 2010 plan notes that since the 2007
LTEP, which identified a need for new nu-
clear planning, “demand has declined and
renewable generation has become a bigger
contributor to the system. Investment in re-
newables, the reduction in demand, and the
availability of natural gas have all reduced
the immediate need for new nuclear. How-
ever, to preserve the long-term reliability of
the system, particularly for baseload gener-
ation, additional investment in nuclear gen-
eration will be required.” Overall, by 2030,
nuclear capacity is projected to be about
1,000 MW lower than in 2012 (see “Ontario
Goes Coal-Free in a Decade” on p. 26).
In June last year, OPG signed agree-
ments with Westinghouse Electric and SNC
Lavalin’s Candu Energy Inc. for the prepa-
ration of construction plans, schedules, and
cost estimates for two new units at Darling-
ton. Candu Energy will be preparing for an
enhanced Candu 6 reactor, while Westing-
house will be preparing for construction
of its AP1000 reactor. The OPG noted that
“Under the terms of the agreements, each
company will be given 12 months to devel-
op its report. The completed reports will be
analyzed and forwarded to the Province for
its consideration.”
1. Darlington A. Ontario Power Generation (OPG) has received a License to Prepare Site
(LTPS) from the Canadian Nuclear Safety Commission, the first in a series of required licenses.
OPG plans to build up to two new nuclear units on its Darlington site (though the LTPS covers
four potential units), east of the existing units shown here. Courtesy: OPG

FLUOR, WE ARE
PROBLEM SOLVERSWith worldwide energy consumption expected to double to an estimated 2.55 million megawatts by 2030, Fluor’s
experts are committed to providing industry-leading solutions, innovation and technologies that bring strategic
value to our clients’ capital projects. With more than 20 years of experience building gas-ired power plants, Fluor
recently completed Dominion’s 590-megawatt combined cycle project, the Bear Garden Generating Station.
www.luor.com
© 2
01
3 F
luo
r C
orp
ora
tio
n. A
ll R
igh
ts R
ese
rve
d. A
DG
V0
89
41
3
Fluor’s Power Segment –
Fossil Generation, Renewables, Alternate
Technologies, Nuclear, Transmission, and
Operations & Maintenance.
CIRCLE 37 ON READER SERVICE CARD

www.powermag.com POWER | May 201356
NUCLEAR POWER
Meanwhile, the JRP, whose role was to
evaluate the environmental assessment (EA)
portion of OPG’s site license application,
concluded that OPG’s EA met the licensing
requirements of Canada’s Nuclear Safety and
Control Act and issued the LTPS. The JRP
hosted 17 days of public hearings, held from
March 21 to April 8, 2011, in Courtice, On-
tario. Taking part in the hearings were 264
interveners and 14 government departments
that made submissions in response to OPG’s
application. This license is valid for a 10-year
period through August 17, 2022.
The Canadian Regulatory ProcessThe regulatory process to build Darling-
ton B began on September 21, 2006, when
OPG submitted to the CNSC an Applica-
tion for Approval to Prepare a Site. That
application initiated the licensing process
under the Nuclear Safety and Control Act
(NSCA). The CNSC, analogous to the U.S.
Nuclear Regulatory Commission (NRC),
regulates the use of nuclear energy and ma-
terials in Canada. All new licensing appli-
cations or amendments to existing licenses
require approval of the seven-member
Commission Tribunal.
The Darlington B application also trig-
gered the Canadian Environmental Assess-
ment Act (CEAA). Proposed construction
of a nuclear power plant is identified in
CEAA regulations as a project for which
comprehensive EA studies are mandatory.
These studies are used to predict the en-
vironmental effects of a specific project,
and to determine whether these effects can
be mitigated, before a project is started.
EAs consider impacts to components of
2. Expansion zone. Expansion of the Darlington plant is projected to compensate for the
planned decommisioning, by 2020, of the nearby Pickering Nuclear Generating Station, also
owned by OPG. Courtesy: OPG
CIRCLE 38 ON READER SERVICE CARD

May 2013 | POWER www.powermag.com 57
NUCLEAR POWER
the environment, such as air, water, and
soil quality; noise; human health; Ab-
original interest, physical, and cultural
heritage; and use of land resources. The
EA report contains recommendations for
a decision including all appropriate miti-
gation measures and requirements of a
follow-up program.
On March 20, 2008, the federal minis-
ter of the environment announced referral
of the project to a review panel pursuant
to the CEAA and indicated that the CNSC
and the Canadian Environmental Assess-
ment Agency (CEA Agency) should pur-
sue a joint EA review process. An EA
requires information about potential acci-
dents and effects on the environment that
the CNSC regulations require in an LTPS.
Accordingly, the JRP under the authority
of the CEAA and the NSCA was estab-
lished in 2009.
The Commission Tribunal (the Respon-
sible Authority under the CEAA) must
approve the EA before any further licens-
ing action can be considered. In August
2011, the JRP submitted its EA recom-
mendation to the Government of Canada.
The JRP concluded that the project was
not likely to cause significant adverse
environmental effects, when implemen-
tation of proposed mitigation measures
is considered, including effects of acci-
dents, malfunctions, and malevolent acts.
In May 2012, the government agreed with
the JRP’s recommendation and authorized
the project to proceed to the next step,
issuing the LTPS. With approval of the
LTPS, the JRP has met its project review
responsibilities and is no longer involved
with the subsequent licensing steps.
Canada’s Multiphase Licensing ProcessThe NSCA and related regulations require
five separate license applications to be
filed over the lifetime of a nuclear plant.
Note that the license to operate is a sepa-
rate administrative process, much like that
used by the NRC in past years, though now
superseded by the combined (construction
and operation) license process.
License to Prepare Site. The CNSC
must be satisfied that it is feasible to de-
sign, construct, and operate the facility
on the proposed site in a manner that will
meet all health, safety, security, and en-
vironmental protection requirements. As
discussed above, the LTPS for Darlington
B was issued to OPG in August 2012.
Darlington was selected because the site
is large enough to accommodate up to four
new reactors, the site is adjacent to a major
transmission corridor, excellent support is
Clear thewayfor quality air
© Copyright 2013 Atlas Copco Compressors LLC. All rights reserved.
140 years of history, and the present is yoursOptimizing air supply quality is a way of life at Atlas Copco. Our dryers, aftercoolers,filters and oil-mist eliminators help ensure that your air is always clean, dry and readyfor the summer heat.
And it doesn’t stop with quality air because the right air system components also saveenergy. Atlas Copco knows you have challenging targets to reduce energy costs. Weknow because we face those targets, too! With 14 production facilities in the UnitedStates and dozens more globally, we never stop lookingfor ways to help our manufacturing teams, and yours,save energy and increase productivity.
In 2013 Atlas Copco celebrates our 140thbirthday. To celebrate this key milestonewe are offering a series of gifts: startingwith simple air studies for free. We’ll logyour plant’s actual air usage, show youways to save money and compute thepayback on any new investments. Signup now and you’ll receive a limited edition anniversary baseball cap. Register atwww.atlascopco.us/mboxusa or call 866-688-9611. We look forward to serving youfar into the future.
Atlas BDay Dry Air Ad 4.5 625 x 10:Layout 1 3/7/13 1:07 PM Page 1
CIRCLE 39 ON READER SERVICE CARD
www.powermag.com POWER | May 201358
NUCLEAR POWER
available from the host communities, and
there is access to an existing highly skilled
and experienced workforce. In addition,
OPG has extensive knowledge of the site
dating from the development of Darlington
A in the 1970s, including the surrounding
lands and waters. Therefore, a large body of
information already exists on the physical,
biological, and social environments relative
to the site and vicinity, including the near-
shore aquatic environment.
OPG will undertake site preparations
under the “owner-only” approach sanc-
tioned by the Ontario Ministry of Labor.
An engineering, procurement, and con-
struction company (EPC) is responsible for
the physical works to prepare the site and
construct the new nuclear facilities. OPG
noted that it might enter into an EPC con-
tract for site preparation activities only, in
advance of a decision on the specific reac-
tor technology.
License to Construct. OPG must
demonstrate that the proposed design of
the new nuclear plant conforms to regu-
latory requirements and, if constructed as
designed, will provide for safe operation
on the designated site over the proposed
plant life.
Before the license to construct (LTC)
can be prepared, OPG must select a reac-
tor technology. The Province of Ontario is
responsible for procuring the new reactors
and associated construction and installa-
tion services, whereas OPG will operate
the reactors. It is anticipated that each new
reactor will have a 60-year operating life,
including mid-life refurbishment.
Licensing guidance for new nuclear
power plants recognizes that an LTPS ap-
plication may be submitted in advance of
selecting a specific technology. Given that
multiple reactor designs were still under
consideration at the time of the LTPS ap-
plication, OPG is using the “technology
neutral” Plant Parameter Envelope (PPE)
as a means of comparing several nuclear
reactor technologies and bounding plant
parameters, such as cooling water technol-
ogy, natural hazards, and natural and en-
vironmental resources. The features of the
selected design would need to fit within
the bounding envelope prior to obtaining
permission to construct the new plant.
The PPE concept is based on the Ear-
ly Site Permit (ESP) process in the U.S.,
where the NRC has issued the following
ESPs: Clinton ESP Site (Exelon Genera-
tion Co. LLC), Grand Gulf ESP Site (Sys-
tem Energy Resources Inc.), North Anna
ESP Site (Dominion Nuclear North Anna
LLC), and Vogtle ESP Site (Southern Nu-
clear Operating Co.). OPG indicated that
these examples were used in the develop-
ment of its PPE process.
OPG plans to undertake a formal quan-
titative cost-benefit analysis for cooling
tower and once-through condenser cool-
ing water systems as part of the LTC ap-
plication. This analysis may be required
earlier, however, given the relationship
between site layout, reactor technology,
and the choice of the condenser cooling
technology.
License to Operate. The applicant
must demonstrate to the CNSC that it has
established the safety management sys-
tems, plans, and programs that are appro-
priate to ensure safe and secure operation
in order to be awarded a license to operate
the plant.
License to Decommission. The ap-
plicant must have a preliminary decommis-
sioning plan for the activities contemplated
at the end of operation. A financial guar-CIRCLE 40 ON READER SERVICE CARD

May 2013 | POWER www.powermag.com 59
NUCLEAR POWER
antee must provide assurance that adequate
resources will be available to fund decom-
missioning activities. The assurance of such
a guarantee addresses the potential that the
CNSC would find itself responsible for the
decommissioning effort. However, OPG
will continue to operate other licensed fa-
cilities at the site and retain ownership of
the property. OPG has established guar-
antees for those facilities that include re-
mediation costs for the Darlington site to
support decommissioning and return it to a
brownfield state.
License to Abandon. The applicant can
abandon and restore the site to a brownfield
state rather than returning the project site to
its preexisting condition.
Response to FukushimaSeveral environmental groups expressed
concerns about the new-build plans, sug-
gesting that the Darlington site is in an ac-
tive seismic area in their testimony to the
JRP during LTPS public hearings. How-
ever, Natural Resources Canada (NRCan)
described the seismic characteristics of
the area as very low risk of a major seis-
mic event. For instance, the site is located
in the Great Lakes region of Canada, and
Lake Ontario is on the edge of the Canadi-
an Shield, a geologically stable, mid-conti-
nental region, where the rate of occurrence
of earthquakes is low.
The design basis earthquake (DBE)
is defined as the ground motion with an-
nual probability of exceedance of less than
1 in 10,000 years. Accordingly, the peak
ground acceleration for the Darlington site
is 0.209 g. OPG’s proposed designs assume
a DBE as 0.3 g. In addition, a magnitude
9.0 earthquake like the one at Fukushima
is not credible for Canadian inland sites,
and neither is a tsunami. Canadian nuclear
plants are located in areas of much lower
seismic hazard risk than Fukushima. Satis-
fied, the CNSC concluded that there are no
geotechnical issues and the seismic risk is
low in the region.
However, the CNSC previously estab-
lished new plant design requirements to
prevent the failure experiences at Fuku-
shima. Those include preventing station
blackout, mitigating severe accidents, and
preventing hydrogen migration. These re-
quirements must be incorporated in the
plant design basis, beyond design basis,
and severe accident management programs,
consistent with international practices, that
will be incorporated at the time of an LTC
application.
Next Step: License to ConstructOPG will continue to report on the licensed
activities and commitments made during
the EA. CNSC staff will also present an-
nual updates to the Commission Tribunal
as a part of the annual CNSC Staff Integrat-
ed Safety Assessment of Canadian Nuclear
Power Plants Report.
The next step in the regulatory process
is for OPG to submit its application for an
LTC. OPG must demonstrate that the site-
specific characteristics identified in the
LTPS application are considered as part
of the design basis of the reactor technol-
ogy selected for construction. The public
will have an opportunity to comment on
OPG’s application to construct, as well as
its application to operate, at future public
hearings. OPG and CNSC staff will present
their mid-term reports at a public proceed-
ing of the Commission scheduled for Sep-
tember 2017. ■
— James M. Hylko ([email protected]) is a POWER contributing editor.
Cost Effective Solutions.The challenges facing electric utilities can be overwhelming in today’s highly
competitive environment of low energy prices and costly new regulatory
requirements.
At ENERCON, we have developed a reputation for innovative thinking,
uncompromising excellence and unmatched responsiveness. We empower
our people to create and implement strategies that often lead to more
efficient, streamlined solutions. With 25 offices nationally and internationally,
and over 1,400 professionals, we have the capability to take on the most
substantial projects.
Simply put, we will find a way to cost effectively overcome any obstacle. We
have been providing engineering, licensing, environmental and technical
services to the power industry for over 30 years.
500 Townpark Lane · Kennesaw, GA 30144 · 770-919-1930 · enercon.com
Corporate Headquarters: Atlanta. Other locations: Ann Arbor, Baton Rouge, Birmingham, Chicago, Dallas, Denver, Duluth, GA, Germantown, MD, Houston, Humble, TX, Kansas City, Northern New Jersey, Oakland, Oak Ridge, Oklahoma City, Orlando, Pittsburgh, Sacramento, San Clemente, Tampa, Tulsa, Washington, DC. International: Abu Dhabi, Belgium. enercon.com/locations for details.
CIRCLE 41 ON READER SERVICE CARD

www.powermag.com POWER | May 201360
RENEWABLES
Small Hydro, Big OpportunitySmall-scale hydro generation stands to benefit from recent congressional ac-
tion aimed at streamlining what historically has been a challenging federal approvals process. That action, along with technology innovations, could make it easier to develop hydro generating capacity in sources as diverse as navigable rivers, man-made conduits, and water distribution systems.
By David Wagman
For the U.S. House of Representatives to agree on anything these days is unusual. For it to agree unanimously on a bill re-
lated to renewable energy may strike some as just short of a miracle. But in mid-February, House members voted 422-0 to approve H.R. 267, a piece of legislation aimed at stream-lining regulations for small hydropower proj-ects that tap some of the potential generating capacity available in the U.S.
Following passage, the bill moved to the Senate, which is expected to consider it later this year. If passed and signed into law, the bill would promote the development of small-scale hydropower and so-called conduit generation projects, which are powered by the force of water flowing in structures such as irrigation ca-nals and water distribution pipes. It also aims to shorten regulatory timeframes for other low-im-pact hydropower projects, such as adding power generation to existing nonpowered dams and developing closed-loop pumped storage, which can help to balance intermittent renewable re-sources such as wind and solar. Under the cur-rent license approval regime, project developers have to wait years for approval. Such regulatory lag can be deadly to smaller-scale projects.
“There’s incredible potential right now,” said Cherise M. Oram, a partner in the Stoel Rives law firm and vice president of the National Hy-dropower Association (NHA). “The industry believes there have got to be ways to meet exist-ing regulatory standards without taking so long, especially for small projects.”
The trade group’s view is that developers should more easily be able to add power gen-erating equipment at existing dam structures when no incremental environmental impact is expected, said Jeffrey A. Leahy, NHA’s direc-tor of government affairs. “There are no tre-mendous additional environmental impacts, so why go through the same environmental process” as new construction, he asked.
Small is beautiful as the industry focuses attention on developing what could be up to 12 GW of hydro generating capacity across the U.S.—provided regulatory reform that has been recognized as needed for years be-comes a reality.
The current licensing process for a project 50 MW or smaller can be daunting. The Federal Energy Regulatory Commission (FERC) exer-cises licensing authority, but the path to federal licensing involves a lengthy application process that may include environmental impact assess-ments, endangered species and water quality evaluations, and lengthy consultations with state agencies and tribal organizations, with no single decision-maker in the process.
Once a FERC license is obtained, the de-veloper of a project at an existing federal lock or dam must repeat the application process to win approval from the U.S. Army Corps of Engineers or the Bureau of Reclamation, two federal entities whose jurisdiction extends to water resources that include locks, dams, nav-igable waterways, and related infrastructure. Power generation historically has fallen low on their list of priorities, superseded by uses such as commercial navigation, flood control, and recreation. By the time a hydropower ap-plication wins approval from one of these enti-ties, the initial FERC license requirement for the start of construction may have expired.
The net effect has been to dampen small hydro generation development and drive up its cost. And it’s precisely among small-scale de-velopments that much of the potential exists to expand hydroelectric generation in the U.S.
Before there were large-scale wind farms and thin-film rooftop solar, there was hydro. Indeed, the first engines of the Industrial Revo-lution were driven by water power, a use that today might be labeled “distributed generation.” The ancient Greeks made use of “Archimedes’ screw,” a machine historically used for transfer-ring water from a low-lying body of water into irrigation ditches that is being reexamined as a potentially modern power generation source.
In the U.S., 100,000 MW of installed capac-ity accounts for about two-thirds of the nation’s renewable electricity and 6.5% of total genera-tion. Hydropower enjoys even more widespread deployment outside of the U.S. Top producers, according to the International Energy Agen-cy, are led by Norway, with hydro providing nearly 98% of generation, and Brazil, where it provides roughly 78%. And although China
only provides 17% of its total generation from hydro, its 22,500-MW Three Gorges Dam is the world’s largest hydroelectric facility. Large impoundment reservoirs such as Brazil’s Itaipú and China’s Three Gorges garner a lot of head-lines, but the majority of hydroelectric capacity is much smaller in scale.
In the U.S., at least, much of the focus on new hydro capacity is tied to water supplies that include existing reservoirs and man-made conduits, said Rick Miller, senior vice presi-dent of renewable energy services at HDR Inc. Many small-scale hydro power projects can connect directly to the local power distribu-tion network, eliminating the need for signifi-cant transmission capacity. “The small stuff is very much a distributed generation technology similar to distributed solar,” he said.
Assess the CostsA June 2012 report by the International Renew-able Energy Agency, an organization compris-ing 158 member states plus the European Union, said that average investment costs for large hy-dropower plants with storage typically range from as low as $1,050/kW to as high as $7,650/kW, while the range for small hydropower proj-ects is between $1,300/kW and $8,000/kW. Adding additional capacity at existing hydro-power schemes or existing dams that don’t have a hydropower plant can be significantly cheaper and can cost as little as $500/kW.
The report considered annual operation and maintenance (O&M) costs and said these are often quoted as a percentage of the invest-ment cost per kilowatt. Typical values range from 1% to 4%. Large hydropower projects typically have O&M costs averaging around 2% to 2.5%. Small hydropower projects lack scale economies and can have O&M costs of between 1% and 6%, or higher.
The cost of electricity generated by hy-dropower is generally low, although costs are site-specific. The levelized cost of electric-ity (LCOE) for hydropower refurbishments and upgrades ranges from as low as $0.01/kWh for additional capacity at an existing hydropower project to around $0.05/kWh for a more expensive upgrade project, assuming

DO YOU MANUFACTURE
OR PROCESS OR
REFINE OR PRODUCE
OR PROVIDE ?
With a full line of complete Cleaver-Brooks boiler systems – from
burner to stack – available in any size and any capacity, there’s
a Nebraska boiler that will fulfill your needs and exceed your
expectations. Industrial watertubes, HRSGs, waste heat boilers –
we do it all. Whether you need 10,000 lb/h or 1 million lb/h, we
offer the only single-sourced, boiler/burner system in the world.
With Nebraska boilers, NATCOM burners and ERI Energy Recovery
Systems, Cleaver-Brooks provides all the steam you need.
WE MAKE A BOILER FOR THAT.
Visit cleaverbrooks.com/engineered or call 1.402.434.2000
©2012 Cleaver-Brooks, Inc. CIRCLE 42 ON READER SERVICE CARD

www.powermag.com POWER | May 201362
RENEWABLES
a 10% cost of capital. The LCOE for large
hydropower projects typically ranges from
$0.02 to $0.19/kWh, assuming a 10% cost of
capital. The report said this makes the best
hydropower projects among the most cost-
competitive generating options available to-
day. The LCOE range for small hydropower
projects for a number of projects in develop-
ing countries was between $0.02 and $0.10/
kWh, making small hydro a frequently cost-
competitive option to supply electricity to the
grid or to supply off-grid rural electrification
schemes. Very small hydropower projects,
however, can have higher costs and an LCOE
of $0.27/kWh or more for so-called “pico-
hydro” systems.
Many Turbine OptionsThe most suitable and efficient turbine for a
hydropower project depends on the site and
the overall power scheme design, with key
considerations being the head and flow rate
(see the sidebar for definitions).
One type of turbine, known as a Fran-
cis turbine, is a reaction turbine that ranks
among the most widely used hydropower
turbines worldwide. Using guide vanes and
wicket gates to control the water’s flow and
direction on the turbine blades, Francis tur-
bines are highly efficient and can be used for
a wide range of heads and flow rates.
The Kaplan turbine was derived from the
Francis turbine and allows efficient hydro-
power production at heads that are between
33 feet and 230 feet, typically much lower
than for a Francis turbine.
Impulse turbines such as Pelton, Turgo,
and cross-flow (sometimes referred to as
Banki-Michell or Ossberger) designs are also
in widespread use. These turbines are driv-
en purely on the impulse of flowing water.
Among impulse turbines, the Pelton turbine
is most commonly used with high heads and
utilizes nozzles to control the water’s flow to
the runner buckets—much like a high-pres-
sure nozzle at the end of a hose.
“Equipment innovations in the last 15 years
have made it possible to use sites that were
not viable because of low-head conditions,”
said James Borg, group leader of Small Hydro
Projects for MWH Global. Key innovations
include low-rpm turbines using permanent
magnet generators, fish-friendly technology,
and advanced power-converting electronics.
Another factor is the supply of economically
competitive equipment from Asia, he said.
Hydropower plants can be built in a vari-
ety of sizes and with different characteristics.
In addition to the importance of head and
flow rate, hydropower schemes can fall into
one of several categories:
■ Run-of-river hydropower projects have
no, or very little, storage capacity behind
the dam, with generation dependent on the
size of river flows.
■ Reservoir (storage) hydropower schemes
store water behind a dam and so decouple
generation from water inflows. Reservoir
capacities can be small or large, depend-
ing on site characteristics and the econom-
ics of dam construction.
■ Pumped storage schemes use electric-
ity at off-peak times (often overnight) to
pump water from a reservoir located after
the tailrace to the top of a reservoir, thus
enabling the pumped storage plant to gen-
erate electricity at peak times. Fast-reac-
tion pumped storage facilities are being
constructed to provide the grid stability
needed to address the intermittent influx
of energy from wind generation.
Assess the ResourceThe industry has said for years, based upon
the Corps of Engineers’ National Inventory
of Dams database, that only around 3% of the
CIRCLE 43 ON READER SERVICE CARD

Check out the new POWER iPad app!
Go to � e App Store on your iPad and search POWER magazine
Get the latest power industry news, trends, and business & regulatory info right at your � ngertips.
Enjoy our latest complete issues– everything in the print edition and more!
For more information on POWER magazine, visit www.powermag.com
10_PWR_050113_SR_SmHydro_p60-67.indd 63 4/12/13 1:14:56 PM

www.powermag.com POWER | May 201364
Renewables
nation’s 80,000 or so dams have electricity generation associated with them. Oak Ridge National Laboratory (ORNL) published in April 2012 a study of hydropower potential in the U.S. It found that many of the monetary costs and environmental impacts of dam con-struction have already been incurred at these non-powered dams (NPDs), so adding power to the existing structure often can be achieved at lower cost, with less risk, and within a shorter timeframe than through new dam construction. The abundance, cost, and environmental ben-efits of NPDs, combined with the reliability and predictability of hydropower, make these dams a potentially attractive way to expand the na-tion’s renewable energy supply.
Of the more than 80,000 NPDs through-out the U.S., 54,391 dams were analyzed by ORNL, with the remainder eliminated from consideration due to faulty geographic infor-mation or erroneous flow or drainage area attributes. ORNL said that adding power generation to U.S. NPDs has the potential to contribute up to 12 GW of new renewable capacity—a potential that it said is equal to increasing the size of the existing conven-tional hydropower fleet by 15%. Most of this potential lies in just 100 NPDs, which could contribute some 8 GW of hydropower;
ORNL said the top 10 facilities alone could add up to 3 GW of new hydropower.
The ORNL study also found that 81 of the 100 top NPDs are U.S. Army Corps of En-gineers facilities, many of which, including all of the top 10, are navigation locks on the Ohio, Mississippi, Alabama, and Arkansas Rivers, and their major tributaries. The study also suggested that dams owned by the Bu-reau of Reclamation hold the potential to add another 260 MW of capacity.
Three different small-scale hydropower ventures illustrate the range of projects and technologies that could be deployed across the U.S. One is a series of hydropower installa-tions at Corps of Engineers navigation dams. The second is a repowering of a powerhouse in the Rocky Mountains with a high head. The third represents two new technologies that could expand the distributed nature of small-scale power in water supply systems.
Power from the Ohio RiverAmerican Municipal Power-Ohio (AMP) is building five new hydroelectric projects on Corps of Engineers dams along the Ohio Riv-er. Altogether, the projects will add more than 350 MW of hydro generation to the region. Voith Hydro is manufacturing the turbines and
generators for the first four projects, which in-clude run-of-river generating facilities. Nearly 80 AMP member communities are participat-ing in the projects, all of which consist of an intake approach channel, a reinforced concrete powerhouse, and a tailrace channel.
These projects are among the first to be devel-oped on Corps structures in decades, and AMP had to be patient and persistent to win both a FERC license and Corps approval. The process was “a bit painful” but opened the Corps’ eyes to how the approval process might be stream-lined, said Paul Blaszczyk, a vice president and the project manager for MWH, the consulting firm serving as AMP’s engineer for all of the projects. As a nonprofit, AMP was able to se-cure good interest rates for the projects. What’s more, it considers the projects to be 100-year in-vestments, a point of view that helped improve the projects’ economics and keep the lengthy approval process in perspective.
AMP’s Cannelton Project will divert water from the existing Corps Cannelton Locks and Dam through bulb turbines to generate an aver-age gross annual output of roughly 458 GWh. The “bulb” designation comes from the shape of the upstream watertight casing, which con-tains a generator located on the horizontal axis. The powerhouse will house three horizontal
Common Hydroelectric Terms
Cavitation: Rapid changes in pressure result in the formation of bubbles that then collapse when the water passes into higher-pressure regions of a tur-bine. Repeated cavitation can damage turbine blades.Flow: The volume of water passing a point in a given period of time. Head: Vertical change in elevation be-tween the head water level and the tail-water level. Headwater: The water level above the center line of the turbine. Low head: A head of 66 feet or less. Penstock: A closed and pressurized con-duit or pipe for conducting water to the powerhouse. Runner: The rotating part of the turbine that converts the energy of falling water into mechanical energy. Tailrace: The channel that carries water away from a dam. Tailwater: The water downstream of the powerhouse. Ultra-low head: A head of 10 feet or less.
torque isn’t tight (what?)
tension is!
Structural Bolting 101: TR
AI
NI
NG
•F
IE
LD
SU
PP
OR
T•
TE
CH
NI
CA
LE
XP
ER
TI
SE
See why torque isn’t tight!Scan with smartphone.
1 800 552 1999
the best way to bolt!
to ensure proper bolt tension.
use Squirter® DTIs*
*USA’s only Quenched and Tempered DTIs per ASTM, RCSC and the Fastener Quality Act.
circle 45 on reader service card
10_PWR_050113_SR_SmHydro_p60-67.indd 64 4/12/13 1:15:07 PM

May 2013 | POWER www.powermag.com 65
RENEWABLES
29.3-MW turbine and generating units with an
estimated total rated capacity of 88 MW at a
gross head of 25 feet. A 1,000-foot-long, 138-
kV transmission line interconnection is planned
to connect to the Midwest Independent Trans-
mission System Operator (MISO).
The Smithland Project will divert water from
the Smithland Locks and Dam through bulb tur-
bines to generate an average gross annual output
of some 379 GWh. The powerhouse will house
three horizontal 25.3-MW turbine and generat-
ing units with an estimated total rated capacity
of 76 MW at a gross head of 22 feet. A 2-mile-
long, 161-kV transmission line interconnection
is planned to connect to MISO.
The Willow Island Project will divert water
from the Willow Island Locks and Dam through
bulb turbines to generate an average of 239
GWh annually. The powerhouse will house two
horizontal 22-MW turbine and generating units
with an estimated total rated capacity of 44 MW
at a gross head of 20 feet. A 1.6-mile-long, 138-
kV transmission line interconnection is planned
to connect to PJM.
The Meldahl/Greenup projects include the
run-of-river hydroelectric generating facility
currently under construction at the Captain
Anthony Meldahl Dam on the Ohio River
and the existing generating facility at the
Greenup Dam, also on the Ohio River. More
than four dozen AMP member communities
are participating in this project. Under a part-
nership agreement with the member commu-
nity of Hamilton, Ohio, AMP is overseeing
construction of the Meldahl project and will
own 48.6% of the facility when it becomes
operational. Upon commercial operation
of the Meldahl project, AMP will obtain a
48.6% share of the Greenup facility.
The Meldahl Project will divert water from
the existing Corps Meldahl Locks and Dam
through bulb turbines to generate an average
gross annual output of approximately 558 GWh.
The powerhouse will house three horizontal 35-
MW turbine and generating units with a FERC-
licensed rated capacity of 105 MW at a gross
head of 30 feet. If interconnected to MISO,
an 8-mile-long, 138-kV transmission line is
planned. If interconnected to PJM, a 5-mile-
long, 345-kV transmission line is planned.
Rocky Mountain HydroThe Boulder Canyon Hydroelectric Project
(BCH) was built in 1910 by the Eastern Colo-
rado Power Co. to generate electricity. During
the 1950s, the facilities also began providing
water for the City of Boulder’s municipal
water supply. Boulder bought the BCH from
Public Service Co. of Colorado (Xcel Energy)
in 2001. At that time, there were two 63-year-
old, 10-MW turbine/generators in the power
plant, only one of which was operational.
Boulder determined that a new 5-MW tur-
bine/generator, shown in Figure 1, would be
needed to keep the facility in operation. The
smaller unit would be more appropriately
sized for the plant and would extend the life of
the hydroelectric project for at least 50 years.
In addition, even though smaller, the new tur-
bine/generator would be able to produce 30%
more energy because it is more efficient.
In 2009, the U.S. Department of Energy
provided a grant opportunity for projects such
as the BCH modernization project as part of
the American Recovery and Reinvestment
Act. Boulder received $1.2 million toward a
total estimated project cost of $5.2 million.
The project scope included removing one
of the two existing 10-MW turbines, install-
ing a new 5-MW turbine/generator, upgrad-
ing wiring, installing a state-of-the-art turbine
isolation valve, installing remote monitoring
and operation equipment, and removing and
replacing several aging, oil-cooled trans-
formers adjacent to Boulder Creek.
A pressure line drops water more than
1,800 feet from a forebay to the powerhouse
and delivers its water under a static head of
800 pounds per square inch. Because the
water is used as part of Boulder’s drinking
water supply, almost all the pressure needs
to be removed from the flow before it can
be distributed throughout the city. Before
the hydro facility was built, a pressure-relief
valve accomplished this function. Now the
powerhouse can handle this function, pro-
vided water supplies are adequate.
Because the water is not used solely for
power generation, complex water manage-
ment issues come into play, said Jake Gesner,
2. Inside a Pelton turbine. Using a
spare 5-MW Pelton turbine that was supplied
by Canyon Hydro for the Boulder Canyon Hy-
droelectric Project, Jake Gesner, hydroelectric
manager, explains how one or more needle
valves direct water onto clamshell-shaped
buckets on the turbine runner. All of the avail-
able head is thus converted into kinetic energy
that turns the runner and drives the generator
shaft. Source: POWER
1. Smaller but more efficient. The City of Boulder replaced 1930s-vintage hydro tech-
nology with a new 5-MW Pelton turbine, contained in the blue housing. The generator is to the
right in a red housing. The new equipment is smaller but more efficient than the retired 10-MW
unit, which can be seen in the background on the left. Source: POWER

www.powermag.com POWER | May 201366
RENEWABLES
hydroelectric manager, pictured in Figure 2.
For example, environmental considerations
require that the adjacent Boulder Creek have
a minimum water flow equal to 4 cubic feet
per second. During periods of drought—such
as in 2002 as well as early this year—no wa-
ter is available for power generation as water
managers conserve resources in the city’s
64-square-mile mountaintop watershed.
Irrigation and Other Supply SourcesStill smaller technologies are being developed
for use in low-head, high-flow situations that
exist in settings as diverse as irrigation canals
and drinking water distribution pipes.
For example, Alameda, Calif.–based Natel
Energy developed a fully flooded, two-stage
impulse turbine, called the Schneider Lin-
ear hydroEngine or SLH, that resembles a
series of airplane wings on a conveyor belt
(Figure 3). The turbine’s innovation is that it
is optimized around flow, not pressure, said
Gia Schneider, chairman and CEO. Water
conveyed through a pipe or penstock enters
the SLH and encounters a cascade of fixed
foils, called guide vanes. These guide vanes
direct flow into the first cascade of moving
blades. After passing over the moving blades,
the water flows through a second cascade of
guide vanes and then passes through a sec-
ond cascade of blades moving in the opposite
direction. The guide vanes are adjustable in
pitch, allowing for direct control of flow rate,
thus keeping the machine’s efficiency high
across a range of flows.
The company has a 50-kW, 4-foot-tall unit
on the market, as well as a 0.5-MW, 8-foot-
tall unit. Development is under way on a unit
with a capacity between 1 and 10 MW that
is expected to be available in 2015. In 2009,
the company installed a small unit on a canal
owned by the Buckeye Water Conservation
and Drainage District in Arizona. That proj-
ect had 6 feet of head, produced 8 kW, and
is grid connected. The generating system’s
general design is shown in Figure 4.
A second small-scale technology was de-
veloped by Lucent Energy for use inside water
distribution pipes. It uses a vertical-axis tur-
bine similar to a wind turbine with the shaft
perpendicular to the water flow. The turbine’s
design ensures that downstream pressures are
maintained. The turbine allows the water to go
through it, but at the same time, because of the
geometry of the blades, it’s able to turn and lift
like an airplane wing and turn a generator. A
prototype 20-kW system was installed in early
2012 in a water distribution pipe in Riverside,
Calif. A second, four-unit, 200-kW system is
being installed in a 42-inch-diameter water
pipe in Portland, Ore.
“The shaft can go through the pipe wall
without being exposed to water in the pipe,”
said Josh Thomas, engineering program
manager. The components are all certified for
use in drinking water supplies, but Lucent is
mindful of water quality issues such as sedi-
ment and alkalinity that can adversely affect
its equipment.
Two years ago during the economic slow-
down and collapse of the price of natural gas
in the U.S., Hydro Green Energy, a small-
scale hydropower developer, turned its focus
toward Latin America, in particular Chile,
Colombia, and Panama. Efforts are under
way in those markets to shift from fossil fuels
for generation to renewable resources such as
hydro, said Michael P. Maley, president and
CEO. In the U.S., the company has more
than two dozen preliminary licenses to install
up to 340 MW of generating capacity in 13
states. But the company views the licensing
and approval process as inefficient and slow,
with little urgency on the part of the Corps of
Engineers or the Bureau of Reclamation to
evaluate small-scale projects and coordinate
efforts with FERC.
In the case of Hydro Green Energy, the fo-
cus is on modular design using off-the-shelf
equipment that can be readily installed at an
existing structure. Both the turbine and the
generator are in frames that can be easily re-
moved for maintenance and are designed to
run for 75 years, said Maley.
Ready for a RenaissanceTo better enable Hydro Green Energy’s
installation of technology with a 75-year
lifespan, the NHA and its member compa-
nies have to get the Senate to approve the
small-hydro bill that won unanimous House
support in February. Once that happens, the
NHA’s Jeff Leahy said a “renaissance” in
U.S. hydro development could take place.
That’s something of a loaded term in the
power generation industry, which heard
promises in recent years of a nuclear renais-
sance that failed to materialize. But hydro’s
fortunes may be different, buoyed by com-
paratively simple technology, readily adapt-
able existing infrastructure, and an abundant
and renewable fuel source whose value as a
tool has withstood the test of time. ■
—David Wagman is executive editor
of POWER.
3. Wings on a conveyor belt. Water
conveyed through a pipe or penstock enters
the Schneider Linear hydroEngine and encoun-
ters a cascade of fixed foils, which direct flow
into a cascade of moving blades. After pass-
ing over the moving blades, the water flows
through a second cascade of guide vanes and
blades moving in the opposite direction. Cour-
tesy: Natel Energy
4. Power from low-head resource. Water is diverted to an intake conduit before it
passes through the turbine to generate electricity and is returned to the main channel. Source:
Natel Energy
Trash rack
Intake
Bypass flow
Draft tube
Jib crane

Up to 70% less water consumption…
Diamond Power’s
HydroJet®-Retractable Boiler Cleaning Systemthe next generation in furnace wall cleaning
This fully-retractable system provides 3X more cleaning coverage per
device, up to 70% less water consumption, improved heat rate performance
compared to previous water cleaning systems and lower installation costs.
Contact your Diamond Power representative or visit us online to learn more.
Stop by and visit us at Electric Power Booth#337
CIRCLE 46 ON READER SERVICE CARD

www.powermag.com POWER | May 201368
NUCLEAR POWER
Are SMRs U.S. Nuclear Power’s Last, Best Hope? Historic low prices for natural gas and slow demand recovery are the principal
barriers to new nuclear power construction in the U.S. Small modular re-actors (SMRs) may break through those barriers, but only if installed cost targets are met.
By Kennedy Maize
The U.S. nuclear power industry
has seen the future, and it is small,
modular, flexible, and, most of all,
risk resistant in the extreme. To date, that
spells Babcock & Wilcox (B&W), an also-
ran in the first generation of the civilian
nuclear power sweepstakes but now the
front-runner in the new contest. But that
could change.
SMRs Take Center StageB&W’s mPower machine, the very mod-
el of the modern small modular reactor
(SMR), was the star of the show at the an-
nual Platts nuclear gabfest in Washington
in late February. While the 180-MW B&W
reactor isn’t the only SMR, it is the leader
of the pack by virtue of being the Depart-
ment of Energy’s first, and so far only, se-
lection for government support. (On Mar.
11, as this story was in production, the
DOE announced a new funding opportuni-
ty for SMRs. On Mar. 27, NuScale said it
would enter the competition for this fund-
ing round, and a Westinghouse-Ameren
team followed suit on Apr. 8.)
B&W positioned its captain of the
modular flagship, Christofer Mowry, in
a prominent role at the Platts nuke event:
presenter of a paper in a major morning
session, purveyor of more good news at
a B&W-sponsored luncheon, and glad-
hander and nimble responder to a gaggle
of reporters in a noisy hallway press con-
fab. (An interview with Mowry begins on
p. 74.)
Mowry’s various presentations and prof-
fers drew figurative “Ooos” and “Aaas”
from the assembled nuclear luminaries, lit-
eral applause from the luncheon audience,
and only a few skeptical questions from
the ink-stained wretches of the press (most
of whom are steeped in digital delivery
and have little notion of what printer’s ink
is). It was as if B&W had won the nuclear
Grammy awards. Finally, nuclear power in
the U.S. had something to cheer about.
Mowry announced during lunch at the
posh and historic Capital Hilton in down-
town Washington that his firm and Ten-
nessee Valley Authority (TVA) had signed
a formal contract to go forward with site
development for a two-unit B&W plant at
TVA’s Clinch River site in pursuit of a li-
cense from the U.S. Nuclear Regulatory
Commission (NRC) to start construction
(Figure 1). The contract gives a green
light to drill, dig, and scrape into the site
to gather data for a formal environmental
assessment that is necessary for NRC ap-
proval. Let’s ignore the irony in the fact
that this site is where TVA and the federal
government once schemed (and failed)
to build a demonstration liquid metal–
cooled, fast neutron–impelled breeder re-
actor—once the next big thing in nuclear
technology.
The mundane contract with TVA dem-
onstrates the resolve of B&W and TVA,
both of which have had a checkered nu-
clear past, to be very careful and take no
shortcuts in developing what many believe
is the next, maybe only, best hope for new
nuclear power in the U.S. and for regain-
ing supremacy in international markets. It
is what one observer called the “belt and
suspenders” approach to designing a nu-
clear power plant. There is no way B&W
or TVA will let the pants fall down on this
attempt at nuclear energy if they can do
anything about it.
B&W Springs SMR Licensing SurpriseAn example is how the partners want to de-
velop the license for the plant, in the context
of NRC licensing reforms. These reforms
were encouraged by Congress in the 1980s
and were implemented by the commission
several years later, but have not yet been for-
mally tested. The industry’s complaint was
that the way to get a plant operating in the
early days of nuclear enthusiasm was cum-
bersome and costly. Lurking in Part 50 of the
U.S. Code of Federal Regulations that gov-
erns the NRC’s licensing process were two
major hurdles before a plant could generate
power for the grid. First the developer had to
convince the NRC of the virtue of the design
and site, leading to a construction permit.
Then, once the plant was built, the licensee
had to convince the NRC that the plant was
built to specs and would operate safely. It was
complex, costly, and time-consuming.
So Congress approved and the NRC
established a one-stop process. Nuclear
projects henceforth need only apply for
a combined construction and operating
license (COL), a new Part 52 of the U.S.
Code. It was deemed to be necessary, if
not sufficient, if new plants were ever to
be built again in the U.S. after the wor-
risome experience of the first round of
nuclear enthusiasm.
So Part 52 was well and good for the
industry and its assertion that the two-
step license was one of the things holding
back new plant development. But B&W,
as Mowry explained, is going at least an
extra mile to prove the worthiness of its
1. Double your pleasure. B&W has se-
cured its first order, from TVA for two SMRs
to be built at the Clinch River site. This is an
artist’s conceptual drawing of the plant. Cour-
tesy: Babcock & Wilcox

CIRCLE 47 ON READER SERVICE CARD

www.powermag.com POWER | May 201370
NUCLEAR POWER
SMR. B&W and TVA are submitting the
buried-in-the-ground mPower design, in-
cluding features such as exiling the turbine
building outside the nuclear fence, to the
NRC under its Part 50 rules. That means
the partners are looking for the NRC to
sign off on a design that would lead to a
construction permit for the plant under the
old two-step process; that process limited
the risk that show-stoppers could come up
when a first-of-a-kind machine is already
well along in construction.
Then, Mowry told the Platts meeting and
reporters afterward, the mPower partners
will seek to turn that specific approved de-
sign and construction green light under Part
50 into a COL for future mPower plants.
“The Clinch River plant will become the
reference for licensing future plants,” Mow-
ry told the Platts audience. As such, it will
become the standard against which future
mPower pressurized water reactor will be
judged, the beginning of a standardized ap-
proach that the U.S. has historically lacked
(and the French have capitalized upon) in re-
actor design. Future mPower plants, if they
materialize, will be able to use the NRC’s
streamlined procedure.
Nuclear CompetitionIt was fortunate that the mPower reactor was
able to inject some optimism into the Platts
meeting, because it has not been a good time
for nuclear power. After waiting for years
for the rumored nuclear renaissance, the in-
dustry has returned to the Dark Ages, with
little hope for the future. The atomic Godot
never showed up. Instead, the Platts meeting
occurred just a couple of weeks short of the
second anniversary of the catastrophe at Fu-
kushima in Japan.
Richard Myers, policy chief at the indus-
try’s Washington lobbying group, the Nuclear
Energy Institute, gave a downbeat assessment
of the state of the industry. “I’ve been watch-
ing U.S. energy markets for 40-odd years,
and I don’t remember a more wretched year
. . . a more punishing year . . . than 2012,” he
said. “Electricity consumption last year was
down—again—by almost half a percentage
point from 2011. We’re still not back to pre-
recession 2007 levels of electricity demand.
Natural gas spot prices bottomed out at
$1.95 per million Btu in April and, although
they’ve increased since then, the disruption
was enormous.”
Myers added, “Gas-fired generation dis-
placed about 220 billion kWh of coal-fired
generation in 2012. Just to put that in per-
spective . . . that’s more than one-quarter
of U.S. nuclear generation. Wholesale spot
prices across most regional power markets
were at a 10-year low.”
The conventional thinking in the nucle-
ar (and coal and renewables) part of the
generating market is that low gas prices
are a transitory phenomenon. The historic
volatility of gas is the natural condition for
the fuel, they believe, and the current low
prices cannot hold. As Myers put it, “The
number of rigs drilling for natural gas in
the United States has collapsed in the last
12 to 18 months—from about 900 rigs at
work in late 2011 to about 400 today. The
experts tell me that sustaining current natu-
ral gas production takes about 600 rigs . . .
so we expect to see production start to drift
down and expect to see gas prices testing
$5 per million Btu in 2014 and 2015.”
But the conventional (among nuclear
enthusiasts) wisdom may be mostly wish-
ful thinking. A new and rigorous analysis
from the University of Texas’s Bureau of
Economic Geology concludes that the Bar-
nett shale gas formation “will continue to
be a major contributor to U.S. natural gas
production through 2030” (Figure 2). With
funding from the Alfred P. Sloan Founda-
tion, the University of Texas project in-
tends to look at “three other major U.S.
shale gas basins by the end of this year.”
Nuclear Challenges ContinueAdding to the nuclear woes, some of the
high-profile new projects under way are
2. Gas glut continues. The outlook for the Barnett Shale is slowly declining production
through 2030 and beyond but total recovery at greater than three times cumulative production
to date. Each color band represents the cumulative number of wells entering service during a
production year. Source: Bureau of Economic Geology, University of Texas at Austin
2.5
2.0
1.5
1.0
0.5
0.0
Ba
se c
ase
pro
du
cti
on
ra
te (
Tcf/
yea
r)
1995 2000 2005 2010 2015 2020 2025 2030
3. Slow and steady. This was the state of construction at Plant Vogtle on Jan. 31, 2013.
The existing two units can be seen in the background. Courtesy: Southern Company

Powerful Player in PowerTIC is one of the leading industrial contractors serving today’s Power industry. With over 44,000 MW of installed capacity, TIC is consistently ranked in Engineering News-Record (ENR) as one of the Top 10 contractors for Power and/or Cogeneration installations.
TIC’s extensive power experience spans a variety of technologies, fuel types and conigurations, including Gas/Combustion Turbine installations in both combined and simple cycle operation; large Coal-Fired and other fossil fueled plants including both sub-critical boilers and supercritical steam generators, Integrated Gasiication Combined Cycle (IGCC) projects, and Renewable Energy including Wind, Geothermal, Solar and Hydroelectric facilities, plus Alternative Fuels plants.
TIC - The Industrial Company9780 Mt. Pyramid Court, Suite 100Englewood, CO 80112(970) 871-7209
TIC-INC.COMCIRCLE 48 ON READER SERVICE CARD

www.powermag.com POWER | May 201372
NUCLEAR POWER
suffering from delays and cost increases.
In the U.S., Southern Company has an-
nounced that it is pushing back the planned
start for its two-unit Vogtle new build to
the fourth quarter of 2017 and the fourth
quarter of 2018, a year’s delay on top of
earlier delays (Figure 3). SCANA Corp.’s
V.C. Summer two-unit expansion has run
into the same problems with the structural
design of the reinforced concrete basemat
that hit Vogtle, and Summer is running be-
hind schedule. SCANA completed place-
ment of the nuclear island basemat for
Summer Unit 2 on March 11.
The key to the future for nuclear power
in the U.S. undoubtedly will be economics.
The first go-round for nuclear in the U.S.
was a tragicomedy of cost overruns and
sliding schedules, leading to a new indus-
try vocabulary that included phrases such
as “imprudence” and “rate shock.” So far,
with Vogtle in the U.S. and France’s horrif-
ic experience in Finland, not much seems
to have changed. The cost of the 1,600-
MW Olkiluoto unit in Finland, originally
pegged at about $4 billion, has soared to
north of $7 billion (and the project is at
least seven years behind schedule).
SMR skeptics—and they do exist—of-
ten focus on the capital costs of the smaller
machines. The small reactors surrender the
economies of scale that drove the evolu-
tion of the first generations of convention-
al nuclear plants to 1,000 MW and above.
On the other hand, SMRs may gain cost
savings by factory fabricating most of the
parts offsite and assembling them on the
site, reducing construction costs.
B&W’s goal, Mowry said, is to offer
a reactor that is no more expensive than
conventional new large reactor designs.
He pegs that figure at $5,000/kW, which
may strike some as astonishingly high. But
because of the modular nature of the tech-
nology, the capital hit doesn’t come all at
once. For TVA, that would mean bringing
the two 180-MW units in at a capital cost
of under $2 billion. The target date for the
plant going commercial is 2022.
After previously exploring the possibil-
ities for both Germany and, counterintui-
tively, France to get out of nuclear power
entirely, the March-April issue of the Bul-
letin of the Atomic Scientists ponders, in
three separate articles, whether nuclear
power is reaching a dead end in the U.S.
Looking at Dominion’s surprise decision
to close the Kewaunee plant, at a point
where it had recently received a 20-year li-
cense extension, the wobbles at Vogtle and
elsewhere, and the economics of nuclear
energy, Editor John Mecklin summarizes:
“In the United States, policy makers, the
press (in general), and the public at large
have yet to focus significantly on the ques-
tion of whether the country might be better
or worse off if reliance on nuclear power
were curtailed or eliminated.” Mecklin
adds, “The question deserves a serious,
considered answer in every country with a
commercial nuclear power industry.”
Can the SMR rescue nuclear energy in
the U.S., where the conventional approach
to nuclear power plants has so far failed?
Or is nuclear a dead industry walking?
Next year, no doubt, the old geezers and
the young guns of the nuclear endeavor
will again assemble in Washington to as-
sess the state of the industry. Stay tuned
for the next installment of the adventures
of the atom. ■
—Kennedy Maize is a POWER con-tributing editor and executive editor of
MANAGING POWER.
www.zhi .com
ENGINEERING | CONSTRUC TION | NUCLEAR | INDUSTRIAL SER VICES
more
to you.POWER
Today’s power market requires strength, skill and
resilience. In our 90-year history, we’ve dedicated
ourselves to planning, building and renewing
America’s most critical industrial infrastructures,
leading the market in technology, safety and quality
through our direct-hire approach. We consistently
deliver gas-ired, coal, AQCS, nuclear and renewable
projects on time and on budget. Zachry —bringing
the power back to you.
CIRCLE 49 ON READER SERVICE CARD

CIRCLE 50 ON READER SERVICE CARD

www.powermag.com POWER | May 201374
POWER VIEW
mPower: It’s Now or Never
The nuclear renaissance hasn’t quite
fulfilled early expectations. Experts
predicted 20-plus new nuclear units
could be under construction by now, based
on the number of combined construction and
operating license applications submitted and
industry surveys. In hindsight, two events
made the predictions for new nuclear plants
seem incredibly optimistic. First, demand
destroyed by the global economic melt-
down has yet to be recreated. Second, the
enormous scale of unconventional gas finds
over the past few years has exceeded the
most optimistic predictions. The first casu-
alty of our abundant natural gas was nuclear
power construction. Despite these factors,
some are sanguine about U.S. nuclear pros-
pects, particularly for a new generation of
factory-manufactured small modular reactors
(SMRs). Contributing Editor Kennedy Maize
met with Christofer Mowry, president of
Babcock & Wilcox (B&W) mPower Inc. at
February’s 9th Annual Platts Nuclear Energy
Conference for a candid discussion about the
future of his company’s SMR.
The mPower design appears to have many
redundant safety systems, a “belt-and-
suspenders” look. What’s the reasoning
behind the safety features in the design?
Mowry: If you look at overall safety per-
formance of the plant, it’s a combination of
traditional safety-related systems as well as
defense-in-depth features that augment the
plant’s overall safety. This multilayered de-
fense system is designed to take plants to the
next level of safety performance.
We want to drive broad market adoption
of nuclear. So we have to take that additional
step on safety performance. To get there, we
have to have multilevel defense-in-depth—
basically the ability of the plant to be safe by
itself for weeks on end, without any kind of
external support.
One of the lessons from Fukushima was
those plants needed power, they needed peo-
ple, they needed water—all this was provid-
ed from the outside. With our design, these
critical components will be contained under-
ground, in the nuclear island. You will have
a two-week supply, and that’s ample time. In
principle, there’s enough water on site for a
month or so, but that’s not in safety-related
structures, so we don’t count that. I’m just
talking about what is sitting inside that rein-
forced concrete bunker on the ground.
Is that also why you are isolating the turbine
building away from the nuclear island?
Mowry: There are two reasons for that.
One is to drive efficiency and security, to get
everything that has to be protected away from
everything that doesn’t have to be protected.
Number two is that the turbine building is
not nuclear. I am going to make that the same
way I make a turbine for a combined cycle
plant. In fact, we can go make that now. It’s
outside the fence that the Nuclear Regulatory
Commission (NRC) is most concerned about.
You want to reduce the amount of work you
have to do under a nuclear quality assurance
program in a very controlled manner. We
separate those things out, and that helps drive
simplicity and cost-efficiency.
How important is it for B&W to produce
the first SMR?
Mowry: It’s a jungle out there. It’s obvi-
ously important for us. But if I put the big
industry hat on, the DOE wanted teams—and
we’re one of them—to come forward with a
game plan to demonstrate near-term deploy-
ment by 2022.
Do you fear that the money for this pro-
gram could go away?
Mowry: No, not at all. If we keep moving
the ball down the field, the support will be
there, not only from DOE, but continued sup-
port from Congress. One of the things that’s
nice is that, in today’s environment, this
program has strong bipartisan support, and
bicameral support. Being good stewards of
the public’s money, they will look to us, and
if we continue to show the kind of progress
we are making now, we will continue to get
strong support. We, together with Tennessee
Valley Authority, need to focus on this pro-
gram and this project. As long as we do our
part, I’m confident the DOE and Congress
will continue the support.
For our part, B&W and Generation
mPower have spent hundreds of millions
of dollars on this program. Even with the
cooperative agreement with DOE, that’s
not going to cover most of the costs. I have
this conversation with Congress quite a
lot. The question is, “How do you know
this is going to work?” The answer is that
when you make industry pony up more
than half of the money, then the industry
starts looking very closely at whether this
is something somebody is going to buy.
It’s not just R&D funded by the DOE. It’s
a partnership between private industry and
government. One of the goals is making
sure that, at the end of the day, it is a good
use of public money. You do that by mak-
ing private industry pay a substantial part
of it so they are designing a product that is,
in fact, useful.
You have been running your test model up
and down at varying temperatures. Are
you looking at load following?
Mowry: Absolutely. We are trying to cre-
ate a more flexible solution here. As you get
bigger deployment, you are going to want to
be able to do load following. That’s an integral
part of the design, and there are special fea-
tures about mPower, including that it doesn’t
have boron in the reactor cooling; you con-
trol the reactor with control rods, more like
a boiling water reactor, which allows much
more flexibility in terms of ramping.
Christofer Mowry, president of Babcock & Wilcox mPower Inc. and CEO of Generation mPower LLC, a joint company of Babcock & Wilcox and Bech-tel to design and build the mPower small modular reactor that won a competition for a Department of Energy cooperative funding agreement, discusses the machine and the market.

May 2013 | POWER www.powermag.com 75
POWER VIEW
Is that going to be a licensing issue? The
NRC has never looked favorably on load
following.
Mowry: We don’t anticipate it will
be a licensing issue. For the NRC, the
load-following issue has been, Who is at
the controls? In the ’80s, the issue was
whether a load dispatcher from the T&D
side would be able to command from his
offsite location changes in power levels in
the reactor. That’s different than what I am
talking about. We don’t think there will be
a problem allowing a licensed operator.
The challenge here is designing a machine
that can ramp up and down in power and
temperature over the life of the plant. As
long as we’re not asking for nonlicensed
operators to be able to control the plant,
that won’t be an issue.
Do you see a larger market here or over-
seas?
Mowry: Total U.S. energy generation
by 2020 will be a quarter of the total of
the world’s generation, so by definition
the energy market is bigger globally. But
make no mistake about it, mPower Amer-
ica is about the U.S. We are trying to cre-
ate a product that is designed here, is built
here, and helps industry here transition
toward clean energy. That’s job one, right
now. Beyond that, we hope to see a big ex-
port market to drive more high-tech jobs,
the way we export airplanes. I really don’t
think you can say, “this is for export” or
“this is for domestic.” They are comple-
mentary.
How can nuclear compete against gas
with gas prices as low as they have
been?
Mowry: No utility is going to have all
of its power generation assets in a single
fuel, gas. While gas is cheap, it is going
to be a big, probably dominant, part of the
portfolio; it’s not going to be 100%. U.S.
generating capacity is 400 gigawatts. Even
if 20% or 30% of that is nuclear, that’s still
a lot of gigawatts. I don’t need 100% of the
market to make a good business.
And gas isn’t going to stay at $3 forever.
That’s the scenario in the U.S. In Asia gas
is $10 or $12, and nuclear is the cheap-
est for baseload generation by far. If you
go to Europe, it’s $8 to $10 and competi-
tive in Europe. And in the long term, the
only thing we know about gas prices is you
don’t know what it is going to be tomor-
row. It’s all risk management. ■
—Kennedy Maize, POWER contributing editor and executive editor of
MANAGING POWER, conducted and edited this interview.
©2013 Marrone Bio Innovations, Inc. Zequanox is a product and registered trademark of Marrone Bio Innovations, Inc.
got mussels?
GET ZEQUANOX®.
The industry’s only biological molluscicide for zebra and
quagga mussel control that is approved by the U.S. EPA and
Canada’s PMRA.
Chlorine and other chemical treatments, and the risks
that go along with them, can now be a thing of the
past. Zequanox is not only highly effective, it is also
biodegradable, selective, nonvolatile, and noncorrosive.
Get powerful mussel control without risking downtime,
employee injury, equipment damage, or regulatory penalty.
Contact us today and let us design a Zequanox treatment
program to meet your specific mussel control needs.
1-877-664-4476
www.gotmussels.com
CIRCLE 51 ON READER SERVICE CARD

www.powermag.com POWER | May 201376
POWER IN CHINA
China Wrestles with Power Shortages China has gone through three periods of nationwide power shortages since
1978. The previous two shortages were mostly caused by the lack of in-stalled generation capacity. However, the third—which has severely restricted economic development—is a consequence of institutional prob-lems that must be corrected.
By Yu Shunkun, Zhou Lisha, and Li Chen, North China Electric Power University
China’s Reform and Opening Up policy,
introduced in 1978, allowed for pri-
vate power generation businesses and
foreign investment for the first time. China’s
economy responded, posting sustained eco-
nomic growth exceeding 10% for the past
three decades, which increased China’s gross
domestic product 15-fold. Today, China’s eco-
nomic growth leads the global community.
China’s white-hot economy requires ever-
increasing amounts of reliable electricity. (See
“China: A World Powerhouse,” July 2010, for
an overview of China’s demand growth and
power generating resources.) The central gov-
ernment’s focus for the past decade has been
on building new plants of all technologies and
improving the power distribution infrastructure.
In response, China’s installed power generation
has nearly doubled over the past five years, aid-
ed by significant private investment (see “Chi-
na’s 12th Five-Year Plan Pushes Power Industry
in New Directions,” January 2012). Additional
power sector reforms have been proposed that
will encourage continuing private investment
(see “China’s Power Generators Face Many
Business Barriers,” October 2012).
Since 1978, China has experienced three pe-
riods of nationwide power shortages that have
severely restricted its economic and social de-
velopment. Lagging development of generating
capacity was the cause of two very disruptive
nationwide shortages experienced during 1978–
1996 and 2003–2006. Following large-scale
investment in new generating capacity, China
experienced a period of inefficient overcapacity
with many redundant plants. Unfortunately, the
oversupply period was short-lived, as nation-
wide power shortages resumed in 2008 and con-
tinue today, although this time for institutional
reasons. In China, the first two power shortages
are called “hard shortages”; the current shortage
is known as a “soft shortage.”
First Power Shortage: 1978–1996Before 1996, China suffered from nationwide
power shortages and interruptions for nearly
20 years. During this period, many industrial
facilities were able to maintain normal produc-
tion only two or three days a week because of
power interruptions. Across China, lack of an
adequate and reliable power supply seriously
suppressed economic and social development.
The principal cause was China’s slow and
difficult transition from a centrally planned
economy to a more market-oriented economy,
although government-planning authorities still
strictly controlled investment in generating ca-
pacity. The lack of an efficient power market
and private investment were important reasons
why generating capacity was unable to keep
up with rapidly rising power demand.
The Chinese government responded to the
crisis by allowing local investors to invest
in generating capacity. The government im-
posed a tariff of 0.02 yuan (0.32¢)/kWh on
industrial end users to compensate investors.
The tariff approach was very successful in
encouraging local investment in power gener-
ation resources. This approach eased the strain
on the government’s financial resources and
also opened further investment opportunities
in the power industry, which laid the foun-
dation for power market reforms that would
come later. In 1995, the total installed generat-
ing capacity was 3.8 times and generated en-
ergy was 3.9 times that in 1978. The power
shortage problem lasting 18 years was solved.
Second Power Shortage: 2003–2006Nationwide power shortages reappeared from
2003 through 2006. During the worst times,
26 of China’s 34 provinces were plagued
by the shortfalls. Economically developed
provinces in coastal areas, such as Zhejiang,
Jiangsu, and Shanghai, suffered the most se-
rious power shortages (Table 1).
Power supply and demand remained in bal-
ance during the decade following the first power
shortage. However, that balance ended with the
onset of the Asian financial crisis in 1997. Power
demand declined sharply, resulting in a large ex-
cess of generation capacity, which appeared as a
large reduction in power plant utilization. In fact,
the Chinese government banned the building of
new power plants during the period 1997 to 1999
based on its pessimistic forecast of future power
demand. New plant construction stagnated.
Unexpectedly, the economy recovered very
quickly. Power demand by heavy industry and
many other high-energy-consuming industries
quickly rebounded and by 2003 exceeded power
demand predictions prior to the Asian financial
crisis. The result was immediate: Power reserve
margins were quickly consumed and nationwide
power shortages returned across China.
The Chinese government responded by
allowing local governments to make power
generation investment decisions without cen-
tral government approval. Simultaneously,
Province
Power shortage
(MW)
Percent-age of total
shortfall
Zhejiang 8,800 19.0%
Jiangsu 8,700 18.8%
Shanghai 4,000 8.7%
Beijing-Tianjin-Tangshan 2,730 5.9%
Shanxi 2,600 5.6%
Henan 2,590 5.6%
Guizhou 2,500 5.4%
South of Hebei 2,480 5.4%
Sichuan 2,410 5.2%
Fujian 2,400 5.2%
Hubei 2,130 4.6%
Guangdong 2,000 4.3%
Chongqing 880 1.9%
Anhui 800 1.7%
Ningxia 700 1.5%
Qinghai 310 0.7%
Gansu 200 0.4%
Table 1. Power shortage across Chi-na in 2004. Source: State Electricity Regula-
tory Commission (www.serc.gov.cn) and China
Electricity Council (www.cec.org.cn)
• • • •
Capable. Flexible. Dependable.At the core of every relationship and behind each task we perform, you’ll find a culture based on safety, quality and reliability. This is how we serve our customers and why they come back to us year after year. Today, we are bringing these high standards and values to new markets and more customers. Welcome to the new Matrix SME.
Move to a higher standardSM matrixsme.com

• Electrical Infrastructure• Power Generation• Oil, Gas & Chemical
• Storage Solutions
Business Sectors:Capable. Flexible. Dependable.At the core of every relationship and behind each task we perform, you’ll find a culture based on safety, quality and reliability. This is how we serve our customers and why they come back to us year after year. Today, we are bringing these high standards and values to new markets and more customers. Welcome to the new Matrix SME.
Move to a higher standardSM matrixsme.com
CIRCLE 52 ON READER SERVICE CARD

www.powermag.com POWER | May 201378
POWER IN CHINA
the central government began a market-
oriented restructuring of state-owned power
generation assets during which “unbundling”
of generation assets took place.
The former State Power Corp. was separated
into five separate major power generation cor-
porations and two power grid corporations as
part of the central government’s market com-
petition mechanism. The more nimble power
generation corporations worked closely with
local governments to focus investment in new
generation. The result of this more market-
oriented approach was resumed investment and
construction of new plants capable of tracking
the country’s rising power demand. From 2003
to 2006, over 237,500 MW was added to the
Chinese grid. The problems that had caused this
power shortage were solved, again (Figure 1).
Third Power Shortage: Since 2008The period when supply met demand was
short. By the end of 2008, a new type of na-
tionwide power shortage hit portions of China,
becoming severe by 2011 in at least 12 prov-
inces that were each short by 2,000 MW or
more. Zhejiang Province experienced the
worst shortfall in supply at 8,800 MW, or 19%
of demand (Table 2).
The market-oriented restructuring of Chi-
na’s power industry begun a decade ago was
very successful in attracting needed private in-
vestment, which helped finance China’s pow-
er infrastructure growth. Currently, China has
excess capacity available to meet current de-
mand. According to China Electricity Coun-
cil statistics, the average utilization hours for
thermal power plants in 2007 was 5,344 hours,
but in 2008 it fell to 4,885 hours, a decrease
of 459 hours. In contrast, the average utiliza-
tion hours for hydropower increased by 89
hours during the same period. There is plenty
of power capacity available in China, particu-
larly thermal power plant capacity.
Regulation of China’s coal market was fur-
ther relaxed in 2005. Global coal prices have
since risen sharply with the increased domes-
tic demand for coal, as has the global price of
crude oil. However, power generators continue
to be required to supply power to the grid cor-
porations at a fixed “benchmark price,” a price
determined by the central government.
More than 80% of the electricity produced
in China is by thermal power stations, so the
result was inevitable. The cost to produce
electricity at market fuel prices soon exceeded
the government’s benchmark price, and power
800,000
700,000
600,000
500,000
400,000
300,000
200,000
100,000
0
Inst
all
ed
ca
pa
cit
y (M
W)
Gro
wth
ra
te o
f in
sta
lle
d c
ap
ac
ity
(%)
25
20
15
10
5
02002 2003 2004 2005 2006 2007
Year
Installed capacity Growth rate of installed capacity
1. Growth in installed generation capacity, 2002–2007. Source: National En-
ergy Administration (www.nea.gov.cn) and China Electricity Council
Province
Installed capacity
(MW)
Power shortage
(MW)
Percent-age of total
shortfall
Hunan 21,561 4,000 18.6%
Jiangsu 57,310 8,000 14.0%
Anhui 19,073 2,500 13.1%
Jiangxi 10,712 1,300 12.2%
Sichuan 34,322 4,000 11.7%
Zhejiang 37,100 3,860 10.4%
Chongqing 8,954 910 10.2%
Yunnan 22,513 2,100 9.3%
Guizhou 27,274 1,740 6.4%
Guangdong 65,502 4,000 6.1%
Hubei 43,644 2,000 4.6%
Henan 47,151 1,100 2.3%
Shanxi 31,554 700 2.2%
Qinghai 12,632 140 1.1%
Table 2. Installed capacity and power shortages in selected prov-inces/regions in 2011. Source: State
Electricity Regulatory Commission and China
Electricity Council
SCAN for
video!
www.nord-lock.com
The Nord-Lock Group is a world
leader in bolt securing. Our innovative
solutions include wedge-locking
technology and Superbolt tensioners.
Discover safe and easy bolting for
your critical applications today.
Your trusted partner for secure bolted joints
CIRCLE 53 ON READER SERVICE CARD

May 2013 | POWER www.powermag.com 79
POWER IN CHINA
generators are prohibited from passing in-
creased fuel costs to the grid corporations or
consumers, so generating electricity became
an unprofitable business. Many generators
elected to idle units or reduce operating hours
to cut their economic losses. The third power
nationwide power shortage was sudden, and
continues today (Figure 2).
Similarities and DifferencesSince 1978, China has experienced three
separate periods of nationwide power short-
ages. Each period has two common factors:
Each was caused by a shortage of generation
(although for different reasons) and each il-
lustrates that government regulation is less
efficient than open market mechanisms when
balancing power supply and demand with the
cost to generate power.
What has changed are the regions where
the power shortages occur. Traditionally, pow-
er shortages were prone to occur in the south-
ern and eastern parts of China, which are more
highly industrialized and have greater power
demand. Recently, the impacted provinces are
in the central regions, such as Hunan, Jiangxi,
and Henan Provinces as well as Fujian, Anhui,
and Guangxi Provinces, which did not experi-
ence power shortages in the past.
Solving power supply problems in these
regions in the short term will be much more
difficult than in previous shortage periods.
The central provinces have less local natural
resources (from fossil fuels to wind and hy-
droelectric) and limited power grid intercon-
nection with other regions.
China’s power market is more open than at
any time in history, but an open power market
also allows power demand to set the market
price of electricity. The permanent long-term
solution may require substantial rate increas-
es to reflect the actual cost of service based
on the global price of fuel—a solution that is
economically and politically difficult. ■
—Yu Shunkun, Zhou Lisha ([email protected]) and Li Chen are with North China
Electric Power University, Beijing, China.
CIRCLE 54 ON READER SERVICE CARD
2. Utilization of generating equipment decreases. Note the large decrease in
utilization since 2004. Because 80% of generation in China is by thermal power stations, the
average utilization of all power generation sources will generally mirror the thermal power utili-
zation curve. Source: China Electricity Council and State Electricity Regulatory Commission
6,500
6,000
5,500
5,000
4,500
4,000
Op
era
tin
g h
ou
rs
1978
Year
Average utilization of thermal power equipment Average utilization of generating equipment
1980
1982
1984
1986
1988
1990
1992
1994
1996
1998
2000
2002
2004
2006
2008
2010
With over 4,200 MW* of development expertise throughout North America, EDF Renewable Energy is the trusted leader in the development and operations of renewable energy projects.
With 7,000 MW of energy under contract, our O&M affiliate, EDF Renewable Services, is your proven partner to maximize project availability and profitability.
renewable energy
888.903.6926 www.edf-re.com
858.521.3575 | O&[email protected] www.edf-renewable-services.com
*Development activities of EDF EN Group throughout North America
TRUSTED LEADER IN PROJECT DEVELOPMENT AND OPERATIONS & MAINTENANCE
Our sales & support team are here to provide solutions, please contact us
for any assistance on 978-304-3000 or email at [email protected].
www.hawkmeasure.com
HAWK’s highly innovative ORAC Sonar
design has exceeded performance that no
other system can offer! The ORCA can be
used in all applications from water clariiers to mining thickeners.
Advantages
• Improved Underflow• Chemical Control • Overflow Clarity Improvements• Improved Operator Effectiveness
ORCA Sonar System
CIRCLE 55 ON READER SERVICE CARD

www.powermag.com POWER | May 201380
WATER TREATMENT
Microbial Control in Cooling Water Improves Plant Performance Microbial inhibition, as part of a robust cooling water treatment program, pres-
ents a special challenge because of the variability in makeup water sourc-es, plant processes, and discharge permits. Failure to maintain a proper microbial inhibition program will affect your bottom line as a result of heat rate degradation.
By Ryan Forbes, AEP and Kevin Boundreaux and Aaron Haines, Nalco Chemical Co.
AEP’s Conesville Station, located in
Conesville, Ohio, is a coal-fired con-
ventional steam plant rated at 1,695
MW. The plant consists of six units, three of
which (Units 4, 5, and 6) remain in service.
The three active units were commissioned
between 1973 and 1978. Like many plants of
this vintage, the chemical feed systems are
not as reliable as in the past and require addi-
tional maintenance. A loss in plant efficiency
and output often results from a loss in chemi-
cal feed system reliability, particularly the
plant’s biocide program. For example, loss in
condenser performance is directly related to
microbial growth on condenser tubes.
Units 4, 5, and 6 each use a closed cool-
ing water system for their steam surface con-
denser, with makeup water coming from the
nearby Muskingum River. Units 5 and 6 have
separate cooling towers, but their basins are
interconnected, making the two towers es-
sentially one system. Unit 4 uses a separate
cooling tower and recirculating system that is
completely independent of the other units.
The plant had been struggling with main-
taining its oxidizing biocide program for many
years because of equipment deficiencies, as
well as a dated chemistry application strategy.
Consequently, the plant staff struggled with
poor condenser performance that resulted in a
higher-than-design plant heat rate.
The staff of Conesville recently performed
a trial of ways to optimize the plant’s use of its
current biocides to determine the cost savings
of any improved microbial inhibition practic-
es. The microbial control tests were conducted
on the 780-MW Unit 4 cooling water system.
The results of the trial, as well as how those
results were used to justify the costs for new
feed equipment, are discussed below.
Perform Pretrial ResearchPretrial investigation revealed that the plant’s
poor microbial inhibition was caused by two
principal factors:
■ The chemical feed system was inadequate.
The biocide feed system consisted of two
pumps for each chemical that fed all three
cooling towers via a common header. This
configuration of cooling water piping did
not allow for proportional, consistent feed
of the biocide to each cooling tower. Con-
sequently, it was nearly impossible to feed
the appropriate amount of biocide to each
tower.
■ The water permits were restrictive. The
original interpretation of the discharge
permit suggested that the plant is only al-
lowed to chlorinate 2 hours per day. Dur-
ing that time, the total residual chlorine
(TRC) level in the outfall must be less than
0.2 ppm. At this feed rate and duration, the
result was a gross underfeed of biocide,
during which time the system was ripe for
microbial growth.
Further review of the permit indicated that
continuous chlorination was allowed, but the
outfall TRC residual was decreased to 0.038
ppm. This meant that a dechlorination system
on the outfall was a must.
Establish Trial GoalsThe goals for the cooling water treatment tri-
al included completing three specific tasks:
■ Determine the efficacy of feeding oxidiz-
ing biocide continuously at low oxidant
residuals. This approach will minimize the
need for dechlorination at the outfall and
protect the cooling system from corrosion
due to elevated oxidant levels.
■ Determine the lowest, continuous residual
TRC necessary to maintain biological
counts within the industry standard of
<105 colony forming units (CFU)/ml.
■ Design a chemical delivery system ca-
pable of consistently supplying the nec-
essary amount of oxidizing biocide, both
bleach and CB70, to all three towers.
Trial PreparationThe plant staff installed a bisulfite feed skid
before the trial began so that continuous
chlorination was possible while complying
with the discharge permit TRC requirement.
The bisulfite was fed into the blowdown
stream whenever Unit 4’s blowdown was op-
erating. The feed rate was manually adjusted
because the concentration of the bisulfite did
not track the blowdown flow rate. Rather,
it was set to neutralize 1.0 ppm TRC at the
maximum possible blowdown rate.
The operating experience along the Musk-
ingum River suggested a daily usage of bleach
in the Unit 4 cooling tower of approximately
300 to 600 gallons per day, which has a re-
circulation rate of 305,000 gpm and a system
volume of 2 million gallons. The amount of
bleach added also fluctuates with tempera-
ture, organic loading, and plant power setting.
However, this range of expected bleach usage
was a good starting point for estimating the
theoretical size of the chemical feed systems.
Also recall that this biocide program uses a
bleach and stabilized bromine blend (CB70),
so the actual amount of bleach used would be
considerably less.
Testing and Data CollectionThe trial period began July 12, 2012, and ran
until August 20, a total of 45 days. The chem-
icals were manually fed with adjustments
made based on the results of free chlorine
testing because the existing feed system was
incapable of continuously feeding the neces-
sary amount of bleach and CB70 to maintain
a target residual of 0.3–0.5 ppm. The tempo-
rary setup was sufficient to determine the ef-
ficacy of the proposed program and allowed
the close monitoring of biocide inventories,
which in turn aided in designing the ideal
feed system for the application.
For chlorine measurements, the plant be-
gan using the standard Hach DPD method, as
is typical in many applications. However, the

May 2013 | POWER www.powermag.com 81
WATER TREATMENT
fluctuating manganese in the makeup water
source, which is known to contribute to in-
terferences in the DPD method test results,
produced inaccurate results. The decision
was made to use the Hach amperometric test
method (Hach AutoCAT 9000 Method) to
ensure that there was no discharge of TRC
beyond the permit limits. Along with free
chlorine and TRC testing, microbial dipslide
tests (to test for the presence of microorgan-
isms in liquids) were performed weekly to
track the effectiveness of the biocide treat-
ment system.
Data collection consisted of downloading
and aggregating plant historian data plus data
from manual field tests. This historian data is
critical, as it contains important information
regarding overall plant operation, specifical-
ly condenser and cooling tower performance.
Once the data is compiled and analyzed, the
effectiveness of the biocide program can
be quickly determined based on the perfor-
mance of the very systems the program was
designed to protect.
Review Water ChemistryThe target TRC was set as 0.35–0.5 ppm
prior to the trial. However, biological mon-
itoring using dipslides determined that a
constant 0.15–0.2 ppm TRC maintained
the bulk water biocounts well below the
industry standard of less than 104 CFU/
ml (Figure 1). Meeting the biocount stan-
dard is particularly challenging because
the organically loaded makeup water from
the Muskingum River can rapidly change,
1.0
0.9
0.8
0.7
0.6
0.5
0.4
0.3
0.2
0.1
0
Fre
e c
hlo
rin
e (
pp
m)
7/12/2012
7/14/2012
7/16/2012
7/18/2012
7/20/2012
7/22/2012
7/24/2012
7/26/2012
7/28/2012
7/30/2012
8/1/2012
8/3/2012
8/5/2012
8/7/2012
8/9/2012
8/11/2012
8/13/2012
8/15/2012
8/17/2012
8/19/2012
1. Free chlorine in water discharge. The chemical feed rate to maintain permitted
residual chlorine levels in the discharge was established during the 45-day testing period, July
12 through August 20. Source: Nalco Chemical Co.
CIRCLE 56 ON READER SERVICE CARD
Turn Pipe Dreams Into Hard Facts.
KALOCER®—
alumina for extreme abrasion.
Highly resistant to sliding
abrasion, ABRESIST®
improves material flow,
and eliminates periodic
pipe rotation.
KALCOR®—
zirconium
corundum for
applications
up to 1830°F.
ABRESIST® wear resistant basaltlinings help reduce costly main te nance repairs and pro duc tion downtime. Doc u ment ed cas es show Abresist linings perform at optimum levels more than 25-30 years af ter in stal la tion.Abresist Kalenborn offers 75years of experience and:
■ other protective linings include alumina and zirconium corundum
■ linings custom designed for any industrial application
■ field survey service
■ installation assistance
5541 North State Road 13, Urbana, IN 46990 Toll Free: 800-348-0717 • Fax: 888-348-0717
www.abresist.com • E-mail: [email protected]
kalenbornThe Wear Protection People
Abresist Kalenborn Corporation
CIRCLE 57 ON READER SERVICE CARD

www.powermag.com POWER | May 201382
WATER TREATMENT
particularly during the hottest months of
the year.
Understanding how the bleach and bro-
mine chemistry control organics is impor-
tant. As bleach is fed to water, it dissociates
into hypochlorous acid and sodium hydrox-
ide, NaOCl + H2OsHOCl + NaOH. The
hypochlorous acid further dissociates into
hydrogen and hypochlorite ion, HOCl u H+
+OCl–, which is highly dependent on the pH
of the water. According to the FILMTEC Re-
verse Osmosis Membrane Technical Manual
published by Dow Water & Process Solu-
tions, “The germicidal efficiency of free
residual chlorine is directly related to the
concentration of undissociated HOCl. Hy-
pochlorous acid is 100 times more effective
than the hypochlorite ion OCl–. The fraction
of undissociated HOCl increases with de-
creasing pH” (Figure 2).
In practical terms, this means that as the
pH increases, the amount of free available
HOCl decreases. For example, a pH of 8.0,
which is typical for cooling tower applica-
tions, leaves approximately 20% HOCl, with
80% as OCl–. Therefore, it takes considerably
more bleach at elevated water pH to main-
tain a specified TRC. Said another way, the
amount of bleach needed to control micro-
biological activity increases as the water pH
increases.
Furthermore, when bleach reacts with or-
ganics, considerably less-effective biocides
called chloramines are formed. Chloramines
are derivatives of ammonia by substitution of
one, two, or three hydrogen atoms with chlo-
rine atoms. The possible reactions proceed as
follows:
HOCl + NH3– s NH2Cl + H2O
HOCl + NH2Cl s NHCl2 + H2O
HOCl + NHCl2 s NCl3 + H2O
On the other hand, bromine chemistry is
appreciably different than bleach. Because
bromine is typically used in conjunction with
bleach, HOCl + NaBr s HOBr + NaCl.
As with hypochlorous acid, the hypobro-
mous acid (HOBr) will dissociate into the hy-
pobromite ion (OBr–), which, as with bleach,
is also pH dependent: HOBr u H+ + OBr–.
However, the percentage of available
HOBr is much higher at elevated pH rela-
tive to available HOCl. Recall in the previ-
ous example, that at a pH of 8.0, there is
approximately 20% HOCl, with 80% as the
less-biocidal OCl–. At that same pH, there
is approximately 80% HOBr, with 20% as
OBr–, a marked improvement.
In addition to dissociation advantages,
there are also two other notable benefits to
using bromine chemistry: The short-term
biocidal activity of OBr– is very similar to
HOBr, and any bromamines formed have
80
60
40
20
0
Un
-io
niz
ed
ac
id (
%)
Ion
ize
d a
cid
(%
)
20
40
60
80
1004 5 6 7 8 9 10 11
pH
HOCI HOBr
2. Bleach and bromine dissocia-tion are very dependent on pH. Source: Preventive Macrofouling Strategies
for Nuclear and Fossil Fired Power Plants, Ed-
ward W. Ekis, Jr., and Michael G. Trulear, Nalco
Chemical Co.
UDI WHO’S WHO AT ELECTRIC POWER PLANTS
Enhanced PDF version now available
The 2013 UDI Who’s Who Directory covers more than 4,200
U.S. and Canadian generating plants. The directory provides:
• Nearly 8,500 plant management and support contact names, titles, and primary job functions.
• Basic plant operating statistics for more than 1,500 power stations, including:
Generation (MWh)
Availability (%)
Heat rate
Capacity Factor (%)
• Power plant design characteristics
Choose which purchase option that best suits your needs:
• Hardcopy Book
• Enhanced Directory PDF (CD-ROM) - NEW FOR 2013
• Mailing List (CD-ROM), Enhanced Directory PDF & Hardcopy Book
For more detailed information and a list of all available data, visit us online at UDIDATA.COM or contact the UDI Editorial team at [email protected].
EXPERIENCE MATTERSく Wキデエ デエラ┌ゲ;ミSゲ ラa キミゲデ;ノノ;ピラミゲ ;Iヴラゲゲ デエW ェノラHW キミ ゲラマW ラa デエW ┘ラヴノSげゲ デラ┌ェエWゲデ IラミSキピラミゲ ;ミS ;ヮヮノキI;ピラミゲが Oヴキラミ Iミゲデヴ┌マWミデゲイ ヮヴラ┗Wゲ S;キノ┞ デエ;デ ┘W ;ヴW デエW ノW;Sキミェ ゲ┌ヮヮノキWヴ ラa マ;ェミWピI ノW┗Wノ キミSキI;ピラミく Cラミデ;Iデ ┌ゲ デラS;┞ デラ gミS ラ┌デ エラ┘ ┘W I;ミ ;ヮヮノ┞ ORION INSTRUMENTS デWIエミラノラェ┞ デラ エWノヮ ゲラノ┗W ┞ラ┌ヴ ノW┗Wノ ;ヮヮノキI;ピラミゲく
ひ POWER ひ RWgミキミェ ひ CエWマキI;ノ ひ P┌ノヮ わ P;ヮWヴひ Oキノ わ G;ゲ E┝ヮノラヴ;ピラミ わ PヴラS┌Iピラミ ひ Mキノキデ;ヴ┞ ひ W;ゲデW┘;デWヴ
┘┘┘くラヴキラミキミゲデヴ┌マWミデゲくIラマ ひ ヲヱヰヵ O;ニ Vキノノ; Bラ┌ノW┗;ヴS ひ B;デラミ Rラ┌ェWが Lラ┌キゲキ;ミ; ひ ΑヰΒヱヵ ひ ΒヶヶどヵヵどORION ひ ヲヲヵどΓヰヶどヲンヴン ひ aぎ ヲヲヵどΓヰヶどヲンヴヴOヴキラミ Iミゲデヴ┌マWミデゲが M;ェミWデヴラノが A┌ヴラヴ;が ;ミS J┌ヮキデWヴ ;ヴW ヴWェキゲデWヴWS デヴ;SWマ;ヴニゲ ラa M;ェミWデヴラノ IミデWヴミ;ピラミ;ノく Aデノ;ゲ ;ミS RW┗W;ノ ;ヴW デヴ;SWマ;ヴニゲ ラa M;ェミWデヴラノ IミデWヴミ;ピラミ;ノく
SIエWS┌ノW ; ┗キゲキデ デラ ラ┌ヴ マ;ミ┌a;Iデ┌ヴキミェ a;Iキノキデ┞
ISO 9001
AS┗;ミIWS MLI ┘キデエキミデWェヴ;デWS G┌キSWS W;┗WR;S;ヴ ノW┗Wノ デヴ;ミゲマキ─Wヴく
B;ゲキIが エキェエどヮWヴaラヴマ;ミIW MLI ゲ┌キデ;HノW aラヴ ; ┗;ヴキWデ┞ ラa ;ヮヮノキI;ピラミゲく
F W ; デ ┌ ヴ キ ミ ェ
┘キSW キミS キI;デラヴヮ;デWミデ ヮWミSキミェ
M;ェミWデラゲデヴキIピ┗W LW┗Wノ Tヴ;ミゲマキ─Wヴ
What’s your
of conidence?
#1 Magnetic Level Indicator
#1 Magnetostrictive Level Transmitter
CIRCLE 58 ON READER SERVICE CARD

www.powermag.com POWER | May 201384
WATER TREATMENT
the same biocide effect as HOBr. These key
factors make bromine a much more effective
and persistent biocide. Using bromine allows
the plant to maintain a much lower oxidant
residual while maintaining an effective mi-
crobial inhibition program.
Years prior to this particular trial, plant
staff and Nalco consultants performed a
study that compared the performance of
“bleach only” and “bleach/CB70 blend” op-
tions. The study concluded that the blended
biocide program provided a more effective
microbial kill at a much lower TRC residual.
Based on the bleach and bromine chemistry
discussed above, this should be expected,
because the cooling towers typically operate
at a pH between 8.4 and 8.8 (refer to Figure
2), and the Muskingum River organic load-
ing can vary between 2 and 25 ppm. At this
elevated pH and organic loading, it would
take a considerable amount of bleach to re-
duce bio-populations given the amount of
chloramines and OCl– that would be gener-
ated. Therefore, a bromine-based chemistry
program was identified as the best choice to
control microbial activity and produce a con-
tinuous, low TRC residual.
First-Rate ResultsConducting a plant performance test when
control of the unit isn’t possible can be
tricky. Consider the following when re-
viewing the data that follows. First, Unit
4 has a two-pressure, two-compartment,
single-pass condenser, which means the
cooling water flows first into the low-pres-
sure (LP) condenser compartment and then
through the high-pressure (HP) condenser
compartment.
Also, around July 8 the cooling tower
fan performance improved, which in turn
improved the vacuum pump and air remov-
al operation due to lower vacuum pump
seal water temperature. This explains the
sharp performance improvement a few
days before the biocide trial began. Finally,
as the biocide test began, Unit 4 was oper-
ating at less than 85% of rated capacity. It’s
best to run these tests at rated capacity so
the condenser is operating at design tem-
peratures, vacuum conditions, and steam
and water flow rates. When full rated load
isn’t possible, it is common practice to use
performance data when operating at 85%
of rated load and higher, which reflects the
data collected during the trial and used to
prepare the following figures.
The figures of merit selected to present the
performance improvement are the terminal
temperature difference (TTD) and backpres-
sure penalty (BP penalty), arguably the most
important plant parameters when monitoring
condenser performance. The TTD reflects the
heat transfer efficiency across the condenser
tube bundle and is usually affected by air in-
leakage, scale, and microbiological growth.
The BP penalty represents the steam turbine
performance loss caused by poor condenser
performance.
The historian data collected during the
45-day trial was processed using a special-
ly developed condenser performance moni-
toring tool (CPMT) program. The CPMT
takes the raw historian data and uses in-
dustry-accepted calculations to thoroughly
analyze the condenser performance. The
results of those calculations determine the
actual cost of condenser performance deg-
radation.
The split condenser requires care-
ful consideration of the performance loss
(TTD and BP penalty) imposed by scaling,
air in-leakage, and microbial formation in
each compartment. The losses can then be
summed to produce the final lost steam
turbine performance. There is also another
important value in using these two metrics:
They are calculated independent of each
other. The TTD is calculated using actual
measured parameters, while the BP penalty
is calculated using different measured pa-
rameters as well as design data. This ap-
proach reduces the possibility of hidden
interactions where common data sources
are used.
20
18
16
14
12
10
8
6
4
2
0
Low
-pre
ssu
re c
on
de
nse
r T
TD
(F)
6/10/12 6/20/12 6/30/12 7/10/12 7/20/12 7/30/12 8/9/12 8/19/12 8/29/12
Prior to trial Trial period
LP TTD (F) LP design TTD (F)
3. Low-pressure condenser TTD. Note the trend to lower condenser TTD during the
trial, which indicates reduced microbial growth. Source: Nalco Chemical Co.
20
18
16
14
12
10
8
6
4
2
0
Hig
h-p
ress
ure
co
nd
en
ser
TT
D (
F)
6/10/12 6/20/12 6/30/12 7/10/12 7/20/12 7/30/12 8/9/12 8/19/12 8/29/12
Prior to trial Trial period
LP TTD (F) LP design TTD (F)
4. High-pressure condenser TTD. Source: Nalco Chemical Co.

www. RETECH2013.com
5
Where the Renewable Energy Industry Does Business
September 9 - 11, 2013Marriott Wardman Park, Washington, DC
Join us for RETECH 2013: The Renewable Energy Technology
Conference & Exhibition
This September, thousands of business leaders, investors, technology innovators, federal and state government offi cials and university educators – representing every aspect of the renewable energy industry – will unite for three days in Washington, DC.
RETECH educates and informs its international attendee base with a technical program that addresses relevant and cutting-edge topics in renewable energy technologies, power generation, military and government, and business.
RETECH provides plenty of opportunities to connect with other attendees, speakers and exhibitors during the conference. Known as “the place to get business done”, RETECH puts you in touch with the renewable energy experts you need to get in front of to position your company for future success.
NETWORK WITH HUNDREDS OF
RENEWABLE ENERGY EXPERTS
As new developments in renewable energy continue to grow, it’s important for experts like you to stay on top of the ever-changing innovations in the industry. RETECH’s technical program addresses today’s most pressing issues and opportunities facing every discipline of the renewable energy industry: Wind, Solar, Hydro, Geothermal, Biomass, Biofuels, Waste, Smart Grid, Transmission, and Storage.
3 DAYS OF IN-DEPTH
WORKSHOPS AND SESSIONS
RETECH attracts leading industry speakers from the United States Department of Energy, Biomass Power Association, BOEM, FERC, AWEA, National Hydropower Association IBM, Siemens, GE, AT&T, SOLON Corporation, and much more!
HEAR FROM MAJOR PLAYERS IN
RENEWABLE ENERGY
You’ll have the chance to meet with solutions providers on the RETECH exhibit fl oor and fi nd the next generation of renewable technologies in development.
SPEAK WITH INNOVATIVE COMPANIES
ON THE EXHIBIT FLOOR
Save $200 with the Early Bird Discount!Register before May 17.
Use Discount Code: RTMAY1
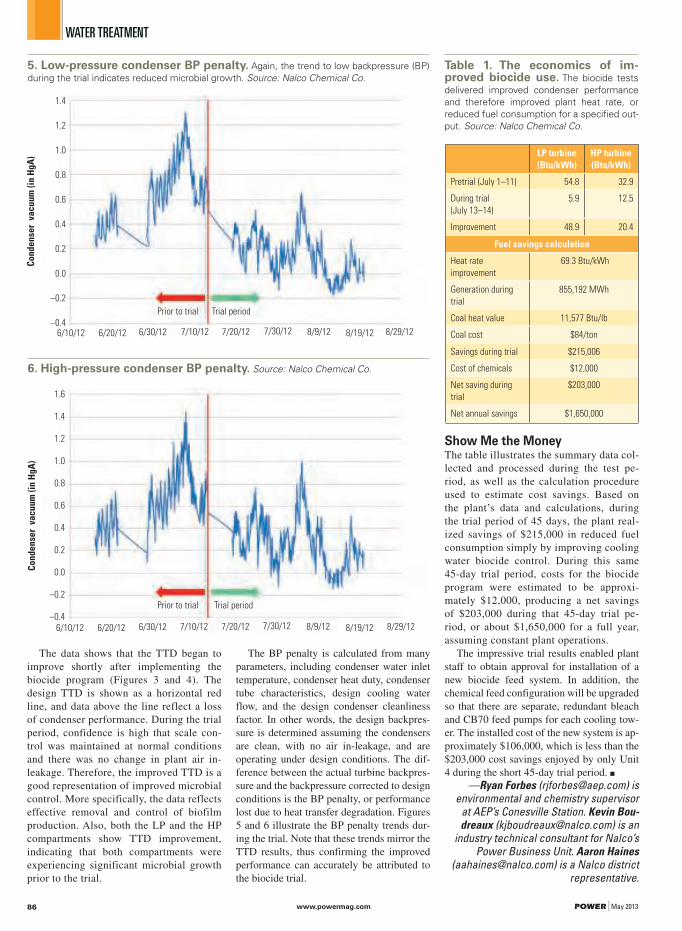
www.powermag.com POWER | May 201386
WATER TREATMENT
The data shows that the TTD began to
improve shortly after implementing the
biocide program (Figures 3 and 4). The
design TTD is shown as a horizontal red
line, and data above the line reflect a loss
of condenser performance. During the trial
period, confidence is high that scale con-
trol was maintained at normal conditions
and there was no change in plant air in-
leakage. Therefore, the improved TTD is a
good representation of improved microbial
control. More specifically, the data reflects
effective removal and control of biofilm
production. Also, both the LP and the HP
compartments show TTD improvement,
indicating that both compartments were
experiencing significant microbial growth
prior to the trial.
The BP penalty is calculated from many
parameters, including condenser water inlet
temperature, condenser heat duty, condenser
tube characteristics, design cooling water
flow, and the design condenser cleanliness
factor. In other words, the design backpres-
sure is determined assuming the condensers
are clean, with no air in-leakage, and are
operating under design conditions. The dif-
ference between the actual turbine backpres-
sure and the backpressure corrected to design
conditions is the BP penalty, or performance
lost due to heat transfer degradation. Figures
5 and 6 illustrate the BP penalty trends dur-
ing the trial. Note that these trends mirror the
TTD results, thus confirming the improved
performance can accurately be attributed to
the biocide trial.
Show Me the MoneyThe table illustrates the summary data col-
lected and processed during the test pe-
riod, as well as the calculation procedure
used to estimate cost savings. Based on
the plant’s data and calculations, during
the trial period of 45 days, the plant real-
ized savings of $215,000 in reduced fuel
consumption simply by improving cooling
water biocide control. During this same
45-day trial period, costs for the biocide
program were estimated to be approxi-
mately $12,000, producing a net savings
of $203,000 during that 45-day trial pe-
riod, or about $1,650,000 for a full year,
assuming constant plant operations.
The impressive trial results enabled plant
staff to obtain approval for installation of a
new biocide feed system. In addition, the
chemical feed configuration will be upgraded
so that there are separate, redundant bleach
and CB70 feed pumps for each cooling tow-
er. The installed cost of the new system is ap-
proximately $106,000, which is less than the
$203,000 cost savings enjoyed by only Unit
4 during the short 45-day trial period. ■
—Ryan Forbes ([email protected]) is environmental and chemistry supervisor
at AEP’s Conesville Station. Kevin Bou-
dreaux ([email protected]) is an industry technical consultant for Nalco’s
Power Business Unit. Aaron Haines
([email protected]) is a Nalco district representative.
1.4
1.2
1.0
0.8
0.6
0.4
0.2
0.0
–0.2
–0.4
Co
nd
en
ser
va
cu
um
(in
Hg
A)
6/10/12 6/20/12 6/30/12 7/10/12 7/20/12 7/30/12 8/9/12 8/19/12 8/29/12
Prior to trial Trial period
5. Low-pressure condenser BP penalty. Again, the trend to low backpressure (BP)
during the trial indicates reduced microbial growth. Source: Nalco Chemical Co.
1.6
1.4
1.2
1.0
0.8
0.6
0.4
0.2
0.0
–0.2
–0.4
Co
nd
en
ser
va
cu
um
(in
Hg
A)
6/10/12 6/20/12 6/30/12 7/10/12 7/20/12 7/30/12 8/9/12 8/19/12 8/29/12
Prior to trial Trial period
6. High-pressure condenser BP penalty. Source: Nalco Chemical Co.
LP turbine
(Btu/kWh)
HP turbine
(Btu/kWh)
Pretrial (July 1–11) 54.8 32.9
During trial
(July 13–14)
5.9 12.5
Improvement 48.9 20.4
Fuel savings calculation
Heat rate
improvement
69.3 Btu/kWh
Generation during
trial
855,192 MWh
Coal heat value 11,577 Btu/lb
Coal cost $84/ton
Savings during trial $215,006
Cost of chemicals $12,000
Net saving during
trial
$203,000
Net annual savings $1,650,000
Table 1. The economics of im-proved biocide use. The biocide tests
delivered improved condenser performance
and therefore improved plant heat rate, or
reduced fuel consumption for a specified out-
put. Source: Nalco Chemical Co.
••••
••
•
•
•
•
•
•

POWID is ISA’s unbiased power generation automation event that covers the latest technical innovations in power, nuclear power, and power instrumentation and controls, including but not limited to:
Cybersecurity
Human Factors Engineering
Renewable Energy
Fossil Plant Simulation Applications
Traditional Boiler Controls
Fossil Plant Advanced Control Strategies
Combustion Turbine Control Technology
Advanced Process Control/Systems/Instrumentation
POWIDSymposium2013
2–7 June 2013Rosen Shingle CreekOrlando, Florida, USA
Power Generation: Automation Regulation Challenges
Gold Champions
Silver Champions
••••
••
•
•
Announcing Our ProgramFeatured Keynote Speakers
Kenneth Medlock, James A. Baker Institute for Public Policy’s Center for Energy Studies
Cheri Collins, Southern Co., Nuclear Operations & Development
Jim Colgary, Nuclear Energy Institute
Scott Fowler, Production Supervisor, Lakeland Electric
•
•
•
•
See program updates at:www.isa.org/powersymp
RegisterToday!
Industry Roundtable/Panel Discussion— POWID’s ever-popular Keynote Panel Discussion provides solutions to issues and challenges facing today’s Power Generation
Roundtable on Nuclear Industry Issues and Solutions
Nuclear Plant Wireless Systems and EMI
Nuclear Plant Controls Modernization, Operations, and Training
Nuclear Regulatory Issues andPlant Experiences

www.powermag.com POWER | May 201388
INSTRUMENTATION & CONTROL
Mexico Uses Nuclear Plant Simulator for Safe Training Mexico’s Federal Electrical Commission needed a safe way to train new opera-
tors at its Laguna Verde Nuclear Power Plant in Veracruz, so it developed a stand-alone process simulator that allows trainees to practice a wide variety of plant operations and responses to incidents without putting the plant itself at risk.
By Jesús Vázquez Bustos and Octavio Gómez Camargo, Instituto de Investigaciones Eléctricas
Electric power plant owners have to face higher production and efficiency de-mands under tighter schedules these
days. Furthermore, the need to be competi-tive in a globalized world requires them to observe and comply with more international standards and regulations; therefore, op-eration and maintenance personnel must be trained to deal with higher production re-quirements and be certified to comply with new international standards and regulations.
Plant owners and operators have much to gain by implementing appropriate personnel training. Comprehensive training programs are critical not only for plant owners but also for everyone involved in plant operations, as such programs can significantly improve not only safety but also plant performance in both functional and financial terms. Because time is always scarce, automated software systems that are flexible, scalable, easy to use, and easy to learn are the best for facilitating and enhancing the training process.
Training Requirements at Laguna Verde Nuclear Power PlantMexico’s National Electric Power Co., Comisión Federal de Electricidad (Federal Electrical Commission, or CFE by its acro-nym in Spanish), is the second-largest state-owned company in Mexico in terms of budget and employees. Currently, CFE generates, distributes, and markets electric power for almost 33.8 million residential and industrial customers, which currently represents almost 100 million people, and more than a million new customers are incorporated every year.
CFE operates several thermoelectric, hy-droelectric, coal-fired, nuclear, geothermal, wind-powered, and combined cycle power generating facilities. It also has responsibil-ity for the management, control, and devel-opment of Mexico’s electric grid, which has more than 742,000 kilometers of transmis-sion and distribution power lines. The infra-structure to generate electric power consists
of 177 generating plants with an installed total capacity of 51,081 MW.
Laguna Verde Nuclear Power Plant (LVNPP) is the only nuclear power plant in operation in Mexico. It belongs to CFE’s power generation division and is located in the state of Veracruz on the coast of the Gulf of Mexico. The plant has two independent power generation units with BWR-5 type re-actors. The two 682.5-MW units provide a total plant capacity of 1,365 MW. The first unit started operation in August 1990; the second unit followed in April 1995.
LVNPP has developed several instruction and training programs to comply with recent international regulations. In order to further improve the quality of their training programs, the training department of LVNPP appointed the Enabling Technologies Division of the Instituto de Investigaciones Eléctricas (Elec-tric Research Institute or IIE) to design and build a plant process simulator (SIMPRO) to
facilitate and support the training and certifi-cation processes of the plant’s personnel. The plant process simulator consists of a physical reproduction (though a simplified version) of selected systems in the operating plant that are integrated with a digital control center.
Detailed Simulator 3-D Design The development and use of virtual 3-D models is a common practice in industries that frequent-ly design new products. Computer-aided model-ing has been demonstrated to be a cost-effective and useful technique to develop virtual models that represent in a very realistic and detailed way the characteristics, operation, and performance of the elements or systems to be manufactured. This practice allows pre-visualization of the re-sults and comparison against the expected func-tionality of the finished product, ahead of the manufacturing or construction stages.
These techniques have been adopted by designers in other fields, such as engineering,
1. Make the model. The simulated plant was first created as a 3-D model. Courtesy: IIE

CIRCLE 59 ON READER SERVICE CARD

www.powermag.com POWER | May 201390
INSTRUMENTATION & CONTROL
procurement, and construction. The use of
3-D modeling techniques has been accepted
in plant design and construction because of
the need to increase the reliability and secu-
rity of the designs that will evolve into new
industrial installations. Process, electrical
power, oil, and gas plants are some examples
of facilities that have applied 3-D modeling
with excellent results in Mexico. For that
reason, a plant design and 3-D modeling
software system was used to design the plant
simulator, which allowed the project engi-
neering team to facilitate information flow
among engineers of all disciplines involved
in the design and construction.
The design and modeling software was de-
ployed in a client-server configuration, where
several users were able to retrieve, create, or
update the plant design concurrently. Access
to each plant area was carefully controlled by
granting appropriate privileges to each engi-
neer and designer.
All systems and components in the simu-
lated plant were represented and their attributes
stored in an external database linked to the items
within the 3-D model; all the documentation
and derived information is generated, retrieved,
and graphically managed via the 3-D model of
the simulated plant (Figure 1).
The 3-D plant design software was cus-
tomized to organize the information and
highlight the plant’s key elements. The soft-
ware selected included the capability to au-
tomatically generate from the 3-D model the
detailed engineering drawings and diagrams
required to proceed to the construction stage,
thus minimizing drafting time.
The 3-D model itself was utilized as a cen-
tral source of engineering information across all
disciplines involved in the design phase of the
project, thus delivering a unified and integrated
engineering solution to support engineers and
constructors throughout the project. This ap-
proach delivered significant, compelling ben-
efits since it reduced time, costs, and personnel
effort by providing an easily accessible reposi-
tory of valuable plant design information and
up-to-date engineering documentation.
Additionally, the virtual model of the plant
currently provides support to training programs
and plant maintenance operations. The simulator
virtual model has been employed to identify and
evaluate problems that might have represented
risks to personnel or equipment in the real site,
such as plant layouts that would prevent fast re-
action/runaway in case of an emergency evacu-
ation. The model can be exploited, among other
uses, to simulate and visualize critical opera-
tions on a real-scale, virtual site.
Model Integration As mentioned above, 3-D modeling solutions,
such as that used to create the simulator, fa-
cilitate efficient engineering design, data stor-
age, and revision of information. This applies
whether the data are produced via handover
from engineering projects executed by third-
party contractors, during construction or plant
walkdown exercises, through concurrent engi-
neering of small on-plant projects, or by lega-
cy data integration from previous engineering
records. However, integration and model vali-
dation is a very important phase that cannot
be overlooked in a project of any magnitude,
as it leads to enhanced engineering data and
design integrity. In effect, model integration
allows better coordination and decision-taking
among all players and disciplines involved in
the design and construction of any industrial
plant, from engineering to commissioning,
and from design to test and operations.
Plant design information is dynamic, be-
cause it often changes, especially during the
detailed engineering revision stages when sev-
eral final design decisions are taken. Besides, it
is well known that plant design data is highly
interdependent—the actions or decisions made
in one plant discipline can affect many others,
and this can be a serious problem when it is not
properly managed. Therefore, adequate coordi-
nation and teamwork throughout the complex
maze of partners, suppliers, and internal de-
partments involved in the project is required.
Leading companies have recognized this and
have tried to manage it through the use of more-
inclusive practices like formal review/approval
workflows, but this practice has proven to have
limitations, as it only deals with clear, highly
visible interdependency problems.
Adequate management of the frequently
changing engineering design basis throughout
the different stages of a project is a key reason
why model integration and design validation is
an imperative step preceding construction; to fa-
cilitate this task, plant design management soft-
ware systems deliver advantages for designers,
plant owners, and operators.
Therefore, in order to act in accordance
with best practices, and to avoid design
change management problems, once all core
elements of the plant’s virtual model were set-
tled, the next step was to integrate all of them
in a version for reviewing and validation. This
integration and validation was carried out with
the same software application used to model
the elements for the plant simulator, but aux-
iliary third-party validation tools can also be
employed to assist the review, validation, and
construction of the facilities.
Construction The Plant Process Simulator includes a
physical reproduction of a section of the
real nuclear power plant, which includes a
pair of vessels, electric pumps, pipelines,
control loops including valves, and associ-
ated instrumentation such as manometers,
thermocouples, level gauges, flow indicators,
transmitters, and limit switches (Figure 2).
This section of the simulator includes
a motor control center with a cabinet de-
signed to store the AC and DC distribution
circuitry, the electric interrupters, breakers
and all the mechanical and electrical protec-
tions found in a real plant. Both an air dryer
and a compressor were included in order to
supply instrumentation air to all pneumatic
2. Reproduce reality. The simulator contains a reproduction of several elements of the
plant control components and associated instrumentation. Courtesy: IIE

May 2013 | POWER www.powermag.com 91
INSTRUMENTATION & CONTROL
tools and devices available in the simula-
tor; the compressor is capable of supplying
air to the process, for instance, to simulate
pressurized vessels.
The arrangement and layout of the me-
chanical and electrical equipment, pipelines,
instrumentation, and control elements match-
es that of the real power plant, so trainees have
the same “look and feel” as at the real site.
The “real plant section” of the simulator
reproduces the process operations that take
place in the plant and enables trainees to
learn in a controlled, risk-free environment
how to execute routine actions and corrective
maintenance operations such as dismounting,
disassembling, inspecting, and/or replacing a
control valve from a pipeline following es-
tablished procedures and utilizing the appro-
priate tools and protection equipment. This
area provides a place where trainees are able
to reinforce and put in practice concepts and
abilities learned in manuals and written pro-
cedures. For their part, instructors are able to
assess the performance of trainees in a secure
scenario that mimics the real plant. In this
manner, feedback is provided to trainees not
only from instructors but also from the simu-
lated process itself.
Human-Machine Interface A human-machine (HMI) interface for the
instructor was designed and supplied with
the plant simulator (Figure 3).
The main HMI display contains a left panel
that allows the user to remotely stop and start (as
long as all required “ready-to-start” conditions
are fulfilled) each of the pumps in the simulator.
This panel also has several controls that allow
the instructor to remotely cause disturbances
and trigger events to simulate failures and/or
abnormal conditions in the process. The right
panel of the HMI makes it possible to monitor
the process variables in real time and take re-
mote control of each of the valves displayed.
The interface also integrates an applica-
tion to remotely monitor in real time the mo-
tor control center’s electrical parameters such
as voltage, current, power, and power factors.
The simulator HMI logs all process variables
and records the events that take place in the
process as well as the sequence of actions
taken by the operator trainee, so it facilitates
the assessment of procedure compliance and
the time needed by the trainee to restore the
simulated scenario to normal operating con-
ditions. Because this valuable information is
recorded, statistics can be easily obtained to
determine the effectiveness of newer training
programs and teaching procedures. Control
algorithms running behind the HMI are re-
sponsible for some of the protection trips that
ensure safe operation of the real plant section
of the simulator.
The plant process simulator currently
provides several means to recreate abnormal
plant conditions such as failure of valves,
transmitters, and other equipment. However,
it is desirable to combine such features in or-
der to create a full set of programmable and
triggered events that mimic the complex dy-
namics of the real plant process. This is be-
ing carried out in joint collaboration between
CFE and IIE personnel.
Time restrictions always play an important
role during projects, so there are several op-
portunities for improvements. The expected
result is to have a comprehensive set of case
studies available to enhance the training ex-
perience of CFE’s plant operators and main-
tenance technicians.
Many Benefits GainedThe plant simulator is a useful way to prepare
and train crews to respond to various kinds
of situations within the real power plant, as
it can be used to provide failure-scenario
mock-up tests. It also improves safety by
eliminating the risks involved in assessing
such tests in the real plant. Furthermore, the
system automatically acquires and records all
measurements required in a test session, so
the accuracy of measuring the process vari-
ables is greatly improved.
The plant simulator can be set up to re-
produce a selection of typical situations
such as failure of equipment, instruments,
and valves; system trips; and more compli-
cated and critical scenarios an operator must
be able to deal with, including those abnor-
mal and emergency situations that are rare
and uncommon. ■
—Jesús Vázquez Bustos and Octavio Gómez Camargo are with the Control, Electronics and Communications De-
partment in the Enabling Technologies Division of the Instituto de Investigaciones
Eléctricas, Cuernavaca, México.
3. Visualize operations. The main dis-
play of the simulator HMI allows instructors
to monitor process variables in real time and
simulate plant disturbances and abnormal
conditions. Courtesy: IIE
arklineSmall Metal Buildings
1.800.786.4855
www.parkline.com
Call today to ind out how the industry leader in metal building manufacturing can provide the
perfect solution for you!
CIRCLE 60 ON READER SERVICE CARD

www.powermag.com POWER | May 201392
EMISSIONS
CFB Scrubbing: A Flexible Multipollutant Technology The number of regulated air emission constituents is increasing while the
acceptable amounts for release are decreasing. In the long run, pick-ing the most flexible multipollutant technology is surely the least cost option.
By Robert Giglio, Foster Wheeler Global Power Group
Emission limits for conventional pollutants
emitted from power plants—particularly
SO2, NOx, and particulate matter—contin-
ue to tighten around the globe. In the U.S., the
Cross-State Air Pollution Rule, although vacat-
ed in August 2012, will likely be reworked and
eventually promulgated, mandating additional
SO2 reductions. Consequently, plant owners
must continue to evaluate the costs and benefits
of adding a back-end air quality control system
(AQCS) against shutting down noncompliant
units. The timing of rule changes makes this a
very difficult evaluation.
The North American Electric Reliability
Corp., responsible for the bulk power system
reliability, has spoken often about the impact
of increasingly restrictive emissions regu-
lations on the reliability of the U.S. power
delivery infrastructure. In effect, the debate
centers on balancing lower emissions limits
with the effect on system reliability of exces-
sive coal plant retirements.
This discussion is not limited to the U.S.
Europe’s new Industrial Emission Directive
(IED) has tightened both SOx and NOx emis-
sion limits by 50 mg/Nm3 and particulate
limits by 10 mg/Nm3 compared to the prior
large combustion plant directive. And last
year, China lowered its SOx, NOx, and par-
ticulate limits for power plants to levels even
lower than those in Europe’s IED.
New constituents are also being added to the
U.S. regulatory milieu, such as metals, acid gas-
es, and organic compounds rolled under Mer-
cury and Air Toxics Standards rules. Europe is
not far behind, with the IED now also requiring
a best available technology standard for these
constituents. These constituents have always
been regulated for certain waste fuel applica-
tions, such as waste-to-energy plants and incin-
erators, but now regulators have set limits for all
boilers, including large utility coal boilers.
Plant owners are being asked to make bil-
lion-dollar AQCS purchase decisions when
the regulations are in flux and court oversight
is uncertain. In this era of regulatory ambigu-
ity, selecting the most flexible AQCS design
is surely the prudent decision.
A Better Way to Clean Flue GasesIn the past, due to its proven large scale and
high ability to capture SO2 over a wide range
of fuel sulfur levels, wet flue gas desulfur-
ization (WFGD) scrubbing technology was
the most popular choice for removing sulfur
from boiler flue gases in large power plants
and industrial facilities. WFGD technology
has a low operating cost because it utilizes
low-cost limestone as the reagent and can
produce gypsum for sale to wallboard manu-
facturers, if there is a local market. However,
on the downside, a WFGD system is expen-
sive to build, uses the most water, occupies
the largest amount of real estate, and can
keep a full crew busy maintaining its large
number of pumps, pipes, valves, and vessels.
But more importantly, due to its chemistry
and process, a WFGD system is only margin-
al for capturing metals, including mercury, or
acid gases such as SO3, HCl, or HF.
Now with U.S. regulations requiring cap-
ture of mercury, acid gases, dioxins, and
furans, in addition to SO2 and particulates,
other FGD technologies are becoming more
popular due to their ability to capture this ex-
panded set of pollutants. There are different
types of technologies, ranging from simple
injection of a sorbent into the boiler flue gas
(direct sorbent injection) to the more estab-
lished spray dryer absorber (SDA) technol-
ogy (which sprays a fine dry mist of lime into
the flue gas), to newer circulating fluidized
bed (CFB) technology, which circulates the
boiler ash and lime between an absorber re-
actor and fabric filter.
These different FGD technologies have
their pros and cons, but for many midsize
to large power and industrial facilities, CFB
scrubbers are growing in popularity. This is
most evident in the pipeline of U.S. retro-
fit scrubber projects, where more and more
projects are selecting CFB technology.
In the past, these alternative scrubbing
technologies were typically chosen over wet
FGD technology for their much lower capital
cost and water usage, provided that the boil-
er size was not too large and the fuel sulfur
level was not too high. Today, CFB scrubber
technology has broken through these limita-
tions with single-unit designs up to 700 MWe
backed by operating references on coal pow-
er plants of over 500 MWe and on fuels with
sulfur levels above 4%. CFB scrubber tech-
nology has now stepped out in front of other
technologies due to five key advantages:
■ High multipollutant capture capability
■ Low installed cost
■ Low water use
1. Many scrubbing options. Foster
Wheeler proposes that circulating fluidized
bed (CFB) scrubbing is superior to wet flue
gas desulfurization (FGD) and spray dryer ab-
sorber (SDA) FGD technologies. Source: Fos-
ter Wheeler Global Power Group
Advantage Neutral Disadvantage
Capability/requirementWet
FGD
SDA
FGD
CFB
FGD
SO2 capture capable
Low water consumption
Fuel flexibility, sulfur content
Fine particlate capture
High SO3 capture
Compact system footprint
Low maintenance requirements
Includes mercury capture
Reduces CO2 emissions
Includes wastewater treatment
Uses low-quality water
Uses limestone reagent
Large scale (>350 MW)
Necessary for retrofit: ESP improvements
Necessary for retrofit: Stack improvements
Necessary for retrofit: Flue gas reheater
➤
➤
MAYAD
➤
➤

JUNE 10-12, 2013
Crowne Plaza, Providence/Warwick, RI
21693
WIND | WAVE | TIDAL | CURRENT | HYBRID
10th
Annual
Conference
& Exhibition
www.energyocean.com
Building on 10 years of continued success, EnergyOcean International
is the industry’s most comprehensive conference and exhibition
covering the most important issues and opportunities facing each discipline
of the industry today: wind, wave, tidal, current, and hybrid.
UNITING ALL SEGMENTS OF THE OFFSHORE RENEWABLE ENERGY INDUSTRY
At EnergyOcean International, You’ll Have 3 Days of Exclusive Access to:
➤ 50+ Exhibitors
➤ Hundreds of Industry Professionals
Register today and save $150 on the All Access Pass! Use Priority Code: MAYAD
➤ Cutting-Edge Technical Content
➤ Multiple Networking Opportunities

www.powermag.com POWER | May 201394
EMISSIONS
■ Large scale
■ Wide fuel sulfur flexibility
As summarized in Figure 1, CFB scrub-
bers also offer other benefits, including
low maintenance cost, compact footprint,
and the flexibility to use low-quality lime
and water. One key process advantage of
a CFB scrubber, unlike SDA technology,
is that the flue gas temperature does not
limit the amount of lime injection. This
feature allows a significant increase in
acid gas scrubbing performance.
CFB scrubbing technology offered by
Foster Wheeler utilizes advanced CFB
scrubber technology, which efficiently
and economically captures a wide array
of pollutants—such as SO2, particulate
matter, acid gases, and organic com-
pounds—while utilizing the least amount
of water, a vital resource.
The multipollutant CFB scrubber is a
flexible and economical technology ca-
pable of removing a wide array of pol-
lutants from flue gases of nearly any
combustion or industrial process. As
shown in Figure 2, boiler flue gas enters
at the bottom of the CFB scrubber’s up-
flow absorber vessel. The gas mixes with
hydrated lime and water injected into the
absorber, as well as recirculated solids
from the downstream fabric filter. The
turbulator wall surface of the absorber
causes high turbulent mixing of the flue
gas, solids, and water to achieve high
capture efficiency of the vapor phase
acid gases and metals contained within
the flue gas.
High Reliability by DesignCFB scrubbing technology incorporates
a number of built-in features to maximize
reliability. The absorber vessel is a self-
cleaning upflow reactor. Water injection
nozzles, located on the perimeter of the
absorber above the introduction points
for the recirculated and sorbent solids,
provide an atomized spray cloud of water
droplets.
These nozzles must be removed peri-
odically for replacement of wear compo-
nents. However, the entire perimeter of
the CFB absorber vessel is used to locate
the water nozzles, thus additional nozzle
locations are typically available to al-
low installation of a spare nozzle prior
to removing an operating nozzle for in-
spection or maintenance. Operators can
switch to a spare nozzle without shutting
down the unit.
2. Follow the gas. This schematic depicts the CFB scrubber process. Courtesy: Foster
Wheeler Global Power Group
CIRCLE 61 ON READER SERVICE CARD
For more information, call Wright’s Media at 877.652.5295
or visit our website at www.wrightsmedia.com
Logo Licensing Reprints Eprints Plaques
•
•
•
•
•
•

For more information, call Wright’s Media at 877.652.5295
or visit our website at www.wrightsmedia.com
Logo Licensing | Reprints | Eprints | Plaques
Leverage branded content from POWER magazine to create a more powerful and sophisticated
statement about your product, service, or company in your next marketing campaign. Contact
Wright’s Media to find out more about how we can customize your acknowledgements and
recognitions to enhance your marketing strategies.
Content Licensing for Every Marketing Strategy
Marketing solutions fit for:
• Outdoor
• Direct Mail
• Print Advertising
• Tradeshow/POP Displays
• Social Media
• Radio & Television

www.powermag.com POWER | May 201396
EMISSIONS
The multicompartment baghouse lends itself to online replacement of filter bags with one compartment off-line. Multiple multicompartment fabric filter baghouses are located above the absorber vessel to allow recirculation of particulate solids. Separate compartments are each lock-able on the flue gas side for maintenance purposes; thus, it is possible to shut down
one compartment for maintenance while running the remaining compartments with 100% boiler flue gas flow. The baghouse hoppers serve as temporary storage bins for the large portion of material that is fed into the solids-recycling system.
The Largest CFB Scrubber in the WorldIn June 2011, a 520-MW coal power plant at Basin Electric’s Dry Fork station (Fig-ure 3) went online in Gillette, Wyoming. (Due to its 4,430-foot site elevation, the actual net output of the Dry Fork plant is rated at 420 MW.) Behind its pulverized coal boiler sits the largest CFB scrubber operating in the world today.
During the project planning phase, Ba-sin Electric hired Sargent and Lundy to evaluate and recommend a FGD technolo-gy based on the criteria of achieving strict emission limits while delivering the best economics and reliability. After months of study and evaluation, Sargent and Lundy recommended the CFB scrubber technol-ogy that was ultimately selected by Basin Electric.
Since it has gone online, the CFB scrub-ber has demonstrated a very high, 98%
availability while meeting all the strict emission requirements set by the U.S. En-vironmental Protection Agency and the state of Wyoming. The emission regula-tions are designed to directly or indirectly limit a broad array of compounds desig-nated as pollutants such as SO2, SO3, HCl, H2SO4, HF, PM10, PM2.5, mercury, and other heavy metals.
The CFB scrubber has exceeded its de-sign performance, reducing SOx by 95% to 98%, to levels below 0.06 lb/MMBtu (50 to 60 mg/Nm3). It also passed a 30-day mercury removal compliance test by meet-ing the permitted emission limit of 20 lb/TWh (2.35µg/m3) while demonstrating a mercury removal rate in excess of 95%.
In addition, the CFB scrubber provided other key benefits to the Basin Electric Dry Fork project such as reducing the scrubber’s water requirement by 30% and real estate by 80% compared to WFGD technology. In addition, the scrubber ash is being used to fill and stabilize a nearby open pit coal mine. ■
—Robert Giglio ([email protected]) is vice president of strategic planning and
market analysis for the Foster Wheeler Global Power Group.
3. Go big or go home. The world’s larg-
est CFB scrubber is found at Basin Electric
Dry Fork Unit 1. Courtesy: Basin Electric Co-
Op and Wyoming Municipal Power Agency
POWER magazine • POWER news • COAL POWER • GAS POWER
MANAGING POWER • POWER Handbook • powermag.com
POWER connect • Careers in POWER • ELECTRIC POWER
To subscribe, visit www.powermag.com/subscribe or call 847-763-9509.
If you need information on the global power
generation industry, look to first.
www.powermag.com
IN PRINT, IN PERSON, AND ONLINE

Europe 2013SPECIAL
ADVERTISING
SECTION
Pho
to: R
oll
s-Ro
yce/
RWe

www.powermag.com POWER | May 201398
Europe 2013SPECIAL
ADVERTISING
SECTION
Curved belt systems for energy-efficient transportBEUMER sustainable curved belt conveyors transport bulk materials economically, across difficult terrain if necessary, with maximum protection and minimum dust
The BEUMER Group, based in Germany with affiliates around the globe, has been
developing customized system solutions for conveying, loading, palletizing, packag-ing, sortation and distribution technology for more than 75 years. The intralogistics specialist supplies curved belt systems for
reliable, energy-efficient transport of bulk materials including coal, wood pellets and ash. The company is today one of the tech-nology leaders in this field.
BEUMER Group belt conveyors are used when companies need to transport large quantities of bulk materials as cost-effec-tively and quickly as possible. Trucks have considerable disadvantages in this regard, including considerable energy use and the high cost of building roads. Belt conveyors, on the other hand, can operate over long distances, steep gradients and tight curves. With their slender lines, they overcome broken terrain and obstacles such as rivers, roads, buildings and rail tracks. Horizontal and vertical curves can overlap.
BEUMER conveyors are individually designed for the task in hand, using durable high-tensile belt material. The firm uses spe-cial software to calculate belt tension and the forces resulting from acceleration and decel-eration, taking into account the weight of the belt plus the transported material. Allowable curve radii and belt position are also calcu-lated for the empty and loaded states.
BEUMER offers both open and enclosed conveyors. Open troughed belt conveyors suit higher material throughputs and gentler curves; if necessary, they can be covered to minimize dust. Enclosed pipe conveyors are preferred for products which need to be protected against the effects of the envi-ronment, and are also the best choice for demanding terrain involving tight curves and large gradients.
BEUMER belt conveyors are equipped with environmentally friendly electric drives and low-energy belts. Closed-loop control enables optimum distribution of the drive load under different operating conditions. At points where the conveyor runs downhill, the electric motors can be driven as generators to recover power that may be fed back to the grid, reducing emissions and operating costs.
Together with Crisplant a/s and Enexco Teknologies India Ltd., the BEUMER Group employs about 3,200 people and has an annual turnover of about €500 million. With its subsidiaries and sales agencies, the BEUMER Group is present in many industries the world over. www.beumergroup.com
Advantages of pipe conveyors include protection of the product from the weather, and protection of the environment thanks to dust-free operation
European vendors support global power plant needsFrom boilers and turbines to conveyors and instruments, European vendors add value to the power generation industry worldwide
These are interesting times for the power industry in Europe: rapid loss of old coal-
fired capacity and a slate of new coal plants planned; a continuing lack of nuclear consen-sus (with some serious delays in adding new nuclear capacity even where this has been agreed); a boom in solar, but offshore wind hampered by lack of capital; gas imports from the US and a limited prospect of domes-
tic shale gas – all against a backdrop of ambitious emissions reduction policies. With such dynamics it is no surprise that European manufacturers and engineering companies provide a huge and diverse range of products and services for power generators both at home and abroad.
This third annual Europe Special Advertising Section showcases a wide spread of products and services for the power indus- try. Elsewhere in this issue of POWER you will find these companies’ advertisements; in the next few pages, the same vendors tell their stories at greater length. Read on to find out more about what Europe has to offer. ■
InsideBEUMER 98
Hadek Protective Systems 99
KIMA 99
Rolls-Royce 100
Sulzer Turbo Services 100(Photo, right) Repairing a gas turbine
rotor at Sulzer Turbo Services Su
lzer
Tu
rb
o S
erv
iceS

May 2013 | POWER www.powermag.com 99
EUROPE SPECIAL ADVERTISING SECTION
Dedicated fill-level measurement for coal millsSmartFill is a fail-safe, high-precision, fill-level and temperature measurement system for coal mills that helps ensure optimum combustion properties
KIMA specializes in high-performance analog and digital closed-loop controls,
innovative sensor systems and databases for the coal, minerals, cement and chemi-cal industries. The company’s central aim is to optimize industrial processes towards greater efficiency, higher productivity and less environmental pollution.
To help achieve these targets in power plants KIMA has adapted its technologies for use in coal mills. In contrast to the traditional methods of measuring fill level in ball mills, KIMA’s SmartFill is the only system which takes all the necessary information directly from its source: on the mill shell.
Classical methods such as microphones and base- or bearing-mounted sensors strug-gle with problems such as interference from noise created by other mills and machinery, ambiguities in locating the sources of sound, and dust. None of these problems affect the SmartFill solution. By providing plants with previously unavailable information, SmartFill thus brings many advantages. These include:
interference-free measurement – no influ-• ence from other mills or machines nearby;
significantly enhanced precision of • measurement;reliable and precise measurement of the • fill level;independent measurements are pos-• sible on both sides of the mill, or in two chambers;better level measurement allows the mill • to operate with greater stability, with con-sequent higher throughput, less wear and more consistent particle size; and
self-powered system with integrated gen-• erator means that it is not necessary to stop the mill to change batteries.
SmartFill has been used successfully in many different types of ball mills in the cement and mining industries. Within the last seven years the system has been successfully sold and installed in more than 450 applications.
KIMA also provides the next logical step towards process optimization: the MillMaster predictive control system for grinding pro-cesses. Working unattended, MillMaster controls grinding circuits in fully automatic mode. A single MillMaster system keeps up to six mills operating with optimum performance. As well as improving grinding performance, the system also increases plant availability thanks to its ability to protect against overfilling and similar malfunctions.
Keeping the fill level at a constant opti-mum level makes for a more homogenous product, which improves the combustion properties of the coal. This, in turn, leads to a reduction in unburned carbon and conse-quently better energy efficiency.
www.kimaE.de
Fixed directly onto the coal mill, SmartFill avoids the acoustic interference which can cause problems for other level sensors
Borosilicate lining protects chimneys from corrosionCoal, oil and lignite firing gives chimneys a tough time, but Pennguard lining technology from Hadek offers reliable performance for 20 years or more
Hadek Protective Systems is a specialist in the internal protection of power station chimneys and flue gas ducts. Coal, oil and lignite
firing power stations need chimneys that will operate under low-temperature, corrosive and sometimes variable conditions. In spite of their severe operating environment, these chimneys are expected to perform reliably for many years, with minimum downtime. The Pennguard Block Lining System offered by Hadek can take it all.
The Pennguard Block Lining System forms an impermeable, acid-resistant barrier inside chimney flues. The lining is based on closed-cell borosilicate glass technology. Lightweight borosilicate glass blocks manufactured under highly controlled conditions are attached to the internal steel, concrete or brickwork surface of power plant chimneys using a durable, flexible adhesive. The Pennguard Block Lining System is used in new chimneys and is also frequently retrofit-ted to existing chimneys.
A properly installed Pennguard lining offers a service life of well over 20 years. Just as importantly, it requires virtually no mainte-nance. Any small repairs or alterations can be performed quickly, with minimum preparation and equipment. In addition to the Pennguard lining system itself, Hadek provides a range of services, including fea-sibility studies, engineering, on-site quality assurance and long-term guarantees and performance monitoring.
The Pennguard Block Lining System has been installed all over the world. Ongoing projects include:
3 x 626 MW lignite-fired Hongsa Power Station, Laos: one 250 m • concrete chimney with three steel flues will be Pennguard lined during 2013;1 x 1,300 MW coal-fired W.H. Zimmer Generating Station, Ohio, USA: • one 174 m concrete chimney with one free standing brick flue will be Pennguard lined during spring 2012;6 x 800 MW coal-fired Kusile Power Station, South Africa: two • 220 m concrete chimneys, each with three steel flues, will be Pennguard lined during 2012/2013. www.hadek.com
The acid-resistant Pennguard lining is applied to the inside surface of the existing brick liner

www.powermag.com POWER | May 2013100
EUROPE SPECIAL ADVERTISING SECTION
Global services with local presenceSulzer Turbo Services specializes in maintenance and upgrading of generators, gas turbines, steam turbines, generators and auxiliary equipment
Sulzer Turbo Services is the leading independent, technically advanced and
innovative service and maintenance provider for all types of rotating mechanical and electromechanical equipment worldwide. The company supports customers in sectors such as oil and gas, power generation (both renewable and conventional), transport, pet-rochemical and general industries. With more than 40 locations on five continents, Sulzer Turbo Services is close to its customers with high-quality local service.
Sulzer Turbo Services has many years of experience in maintaining turbines and gener-ators in conventional power plants. This expe-rience, combined with a flexible approach, allows the company to tailor solutions to specific needs. Core competence focuses on the power train: the generator, gas or steam turbine, auxiliaries and control systems.
Experts at all of Sulzer Turbo Services’ locations worldwide re-manufacture and repair generators. Rotor rewinds are done at the company’s own facilities. Condition moni-toring can support the life-cycle management of generators. Older units can be up-rated with the latest insulation systems to provide more flexible operation.
Sulzer Turbo Services is at the forefront of servicing advanced F-technology gas turbines. The company has invested continu-ously in innovative repair processes and in-house technologies to support customer needs and make power train operation more reliable and flexible.
On mature gas turbines, advanced tech-nology can be applied during upgrades to increase availability and reliability. Sulzer
Turbo Services manufactures replacement parts for combustion systems as well as tur-bine and compressor sections. The solutions focus on reducing maintenance costs and improving the life cycle of turbine equipment.
Sulzer Turbo Services manufactures steam turbine parts such as blades, seals, turbine disks and rotors in-house. Careful project management ensures that repair proj-ects are completed on time.
When changes in the process plant con-figuration require re-rates, the company provides services that can boost plant per-formance. Successful re-rates can allow for additional steam extraction or increased steam flow.
Sulzer Turbo Services provides a wide range of balance of plant (BOP) services for rotating equipment not directly involved with the power train. Motors, blowers and other kinds of rotating equipment are important in the operation of a power plant and need to be maintained efficiently and correctly. The balance of plant services can be provided on a planned or emergency basis to maximize operating reliability. www.sulzer.com
Sulzer Turbo Services supports owners and operators worldwide
Trent 60s boost output at RWE Lingen power stationReplacing ageing gas turbines with highly-efficient aero-derivative Rolls-Royce Trent 60 gas turbines has delivered more power for less at a German power station
Lingen power plant in Emsland, north-west Germany, is home to two early combined-
cycle blocks – units B and C – installed in 1974/75. These each have a gas-fired boiler and a steam turbine, and also include a top-ping gas turbine connected to each boiler. In 2009 the operator, RWE, decided to remove the two ageing low-efficiency gas turbines and replace them with modern, state-of-the-art Rolls-Royce Trent 60 WLE gas turbine generators. The replacement has proved to be the key to transforming the elderly natural gas fuelled B and C units of the Lingen power station into highly efficient and flexible gen-erating assets for Germany’s leading electric-ity producer.
As a result of the €200 million upgrade the power plant provides process heat to local industry as well as generating electricity.
As an aero-derivative gas turbine, the Trent 60 WLE is capable of very fast starts: some nine minutes to full power. At the same time it is also highly efficient, achieving 40 percent, compared with only 26 percent efficiency for the two older gas turbines
replaced at Lingen. Re-powering this existing station with the higher-efficiency Trent 60 gas turbine has achieved a number of envi-ronmental and production benefits for RWE including a saving of around 45,000 tonnes of CO2 annually.
As a result of the Trent 60 retrofit the efficiency of the plant as a whole, originally 41 percent, has increased by 5–8 percent-age points, while the total power has been increased by 130 MW, from 820 MW to 950 MW. This has led to less gas consump-tion and reduced emissions of carbon dioxide and NOx.
At Lingen, having four gas turbines instead of two, as well as boosting the power output, also further helps to increase flex-ibility, a very valuable characteristic for a power station, opening up a variety of dif-ferent operating modes, depending on grid requirements.
The Lingen B and C retrofit project was completed on time and on budget. The same approach should be applicable to extending the useful life of other ageing gas-fuelled power plants. www.rolls-royce.com
The new Rolls-Royce Trent 60s replaced older gas turbines operating in a topping cycle at RWE’s Lingen power plant

The Most Important Conference for Turbomachinery Professionals
N N
The Most Important Conference for Turbomachinery Professionals
Presented by ASME International Gas Turbine Institute
June 3 -7, 2013
ASME INTERNATIONAL GAS TURBINE INSTITUTE
phone +1-404-847-0072 | fax +1-404-847-0151 | [email protected]
www.turboexpo.org
TEXAS
NUSANs a n a n t o n i oN N

www.powermag.com POWER | May 2013102
NEW PRODUCTSTO POWER YOUR BUSINESS
Ergonomic Oxy-Fuel Torch
Victor, a Victor Technologies brand, has launched its new 400 Series of oxy-fuel torches. The 400 series is a two-piece torch that incorporates innovative handle and cutting attachment designs that offer better ergonomics, a clearer view of the cutting path, visual cues for easier use, and enhanced safety. The new torch is available in medium- and heavy-duty models and also is sold as part of the Medalist 250 and Medalist 350 outfits. Outfits include the torch handle, cutting attachment, welding tip, G Series regulators, and hoses.
The handle uses an engineered zinc-aluminum alloy called Zamak that has three times the tensile strength of brass, so it better resists deformation. The handle is lighter than brass, yet it balances naturally when hoses and attachments are connected. To simplify use, oxygen and fuel valves are labeled and color-coded for instant identification and easier operation by indicating directions for open and closed valve positions. These features can be especially valuable for inexperienced and multi-lingual workforces. (www.victortechnologies.com)
Want to See Your Company’s Product in This Space?
To submit your new product for consideration, follow these guidelines:
■ Be sure that the product is new
■ Write a clear subject line (“New Product: …” is ideal)
■ Put a concise but specific description of the product features and benefits in the
press release
■ Explain how your product is or could be used in the power generation sector
■ Include a high-resolution jpg of the product
■ Email the message and image to [email protected]
We regret that due to the large volume of messages we receive daily, we are unable to
notify you whether or not a product announcement will run. We also prefer not to receive
“follow-up” inquiries via phone. You will also find each month’s New Product announce-
ments on our website: www.powermag.com.
Inclusion in New Products does not imply endorsement by POWER magazine.
Wireless Condition Monitoring for Bearings
SKF has launched SKF Insight, intelligent wireless technologies that are integrated into SKF bearings, enabling them to communicate their operating conditions continuously, with internally powered sensors and data acquisition electronics.
The miniaturized packaging of sensor technologies enables measurement of parameters such as rpm, temperature, velocity, vibration, load, and other features so that damage can be monitored from the first microscopic effect as it is happening, allowing customers to take remedial action. The self-powered “smart” bearings can communicate through each other and via a wireless gateway to form a “mesh network” and can send information relevant to their condition for analysis, even in areas where traditional WiFi cannot operate. The technology could be especially useful in critical machinery and technically challenging applications, including wind turbines. (www.skf.com)

May 2013 | POWER www.powermag.com 103
Opportunities in Operations and Maintenance,
Project Engineering and Project Management,
Business and Project Development,
First-line Supervision to Executive Level Positions.
Employer pays fee. Send resumes to:
POWER PROFESSIONALS
P.O. Box 87875Vancouver, WA 98687-7875
email: [email protected]
(360) 260-0979 l (360) 253-5292www.powerindustrycareers.com
CAREERS IN POWERNAES Corporation is a leading provider of3rd party O&M services to the Independent
Power Industry. As we continue to grow, wehave constant needs for power professionalsacross the nation.
For more info, log onto: www.naes.com/careers
24 / 7 EMERGENCY SERVICE
BOILERS20,000 - 400,000 #/Hr.
DIESEL & TURBINE GENERATORS50 - 25,000 KW
GEARS & TURBINES25 - 4000 HP
WE STOCK LARGE INVENTORIES OF:Air Pre-Heaters • Economizers • DeaeratorsPumps • Motors • Fuel Oil Heating & Pump Sets
Valves • Tubes • Controls • CompressorsPulverizers • Rental Boilers & Generators
847-541-5600 FAX: 847-541-1279WEB SITE: www.wabashpower.com
FOR SALE/RENT
444 Carpenter Avenue, Wheeling, IL 60090
POWER
EQUIPMENT CO.wabash
READER SERVICE NUMBER 201
www.powermag.com POWER | May 2013103
READER SERVICE NUMBER 202
NEED CABLE? FROM STOCKCopper Power to 69KV; Bare ACSR & AAC Conductor
Underground UD-P & URD, Substation Control – Shielded and Non-shielded, Interlock Armor to 35KV, Thermocouple
BASIC WIRE & CABLEFax (773) 539-3500 Ph. (800) 227-4292
E-Mail: [email protected] SITE: www.basicwire.com
Turbine Controls
Woodward, GE, MHCParts and Service
TurboGen • (610) 631-3480 [email protected]
READER SERVICE NUMBER 203
Media Blasting Services
www.molemaster.com
Toll Free: 800.322.6653 • Fax: [email protected]
Regardless of the surface, Mole•Master has a media blasting solution for you.
From Dry Ice to Walnut Shells, Mole•Master does Abrasive
Blasting safely and eficiently.
READER SERVICE NUMBER 200
PNNL SEEKS VISIONARY LEADERSHIP
IN GRID AND ADVANCED CONTROLS
Pacifi c Northwest National Laboratory (PNNL) is currently seeking
nationally and internationally recognized academic and industrial leaders in
the fi elds of advanced control theory and power systems. Specifi c interests
include, but are not limited to, advanced control systems applications for
energy use in buildings, advanced control systems related to the electric
grid, and the development and application of highperformance computing
algorithms to the electric grid. Successful candidates will enjoy the
opportunity to shape and direct transformational research efforts with
signifi cant budgetary authority and resources. PNNL is a U.S. Department
of Energy national laboratory with
a $1.1 billion operating budget
focused on advancing scientifi c
frontiers to solve complex energy,
national security, and environmental
problems. Visionary leadership
is sought to further scientifi c and
technological advancements in the
effi ciency and optimization of large,
distributed systems.
For additional information contact:
Kristi Ross | [email protected] |
(509) 372-6317
http://jobs.pnnl.gov
New York City Transit’s Department of Capital Program Management is looking for all levelsof engineers and architects, from entry-level professionals to senior-level technical managers,and cost estimators and schedulers. Exciting opportunities exist in various disciplines tocontribute to design, construction, renovations, and innovations to meet the current andfuture needs of the greatest urban mass transit system in the country.
Entry-level positions require a related college degree. Some supervisory and senior-levelpositions may require a Professional Engineer (P.E.) or Registered Architect (R.A.) licenseor Certified Construction Manager (C.C.M.) certificate and over 10 years of experience.Senior-level positions generally require significant related experience in transportation.
New York City Transit offers competitive salaries, a comprehensive benefits package, andexcellent opportunities for professional development.
If you are unable to attend our career fair, please review New York City Transit job postingson the MTA website, http://mta.info/employment and submit a resume for the position(s)for which you qualify.*
Openings exist in these areas: Architecture • Civil/Structural Engineering • Electrical Engineering • Signals Engineering
Mechanical Engineering • Systems Engineering • Communications Engineering Environmental Engineering • Commissioning • Cost Estimating and Scheduling
Quality and Safety • Construction Management • Design Management
*Please note: For these positions New York City Transit will not sponsor H-1B applications for employment or applications for permanent citizenship.
Attention Engineers and Architects
Capital Program Management
Career FairMonday, April 29, 2013 • 9 a.m. - 4 p.m.
2 Broadway, 20th Floor, NY, NY 10004
New York City Transit
Directions to 2 BroadwayTake the 4 or the5 train to Bowling Green or the R train to Whitehall Street.
A valid government issued photo ID is required to enter the building. All bags will be searched.

POWER PLANT BUYERS’ MART
READER SERVICE NUMBER 204
GAS TURBINES FOR SALE
• LM6000 • FRAME 9E • FRAME 5
50/60Hz, nat gas or liq fuel,installation and service available
Available for Immediate Shipment
Tel: +1 281.227.5687
Fax: +1 281.227.5698
READER SERVICE NUMBER 210
May 2013 | POWER www.powermag.com 104
READER SERVICE NUMBER 208
NATIONAL ELECTRIC COIL
800 King AvenueColumbus, OH 43212 USA
Phone: 614-488-1151Fax: 614-488-8892
E-mail: [email protected]: http://www.national-electric-coil.com
READER SERVICE NUMBER 206
George H. BodmanPres. / Technical Advisor
Ofice 1-800-286-6069
Ofice (281) 359-4006
PO Box 5758 E-mail: [email protected]
Kingwood, TX 77325-5758 Fax (281) 359-4225
GEORGE H. BODMAN, INC. Chemical cleaning advisory services for
boilers and balance of plant systems
BoilerCleaningDoctor.com
Layup DesiccantDehumidification & Filtration Unitsfor long term layupof power generationequipment. Call us.
Tom Haarala [email protected] Bradley [email protected]
READER SERVICE NUMBER 207
To Advertise in POWER Classiieds
CONTACT: Diane Burleson
PHONE 512-250-9555 FAX 512-213-4855 [email protected]
READER SERVICE NUMBER 205
READER SERVICE NUMBER 209

READER SERVICE NUMBER 215
John R.Robinson Inc. Ph# 800-726-1026Condenser & Heat Exchanger Toolswww.johnrrobinsoninc.com
CLEAN CONDENSER TUBES IN SECONDSGC11 TUBE CLEANING GUN & CLEANERS
READER SERVICE NUMBER 214
CONDENSER OR GENERATOR AIR COOLER TUBE PLUGSTHE CONKLIN SHERMAN COMPANY, INC.
Easy to install, saves time and money.ADJUSTABLE PLUGS-all rubber with brass insert. Expand it,
install it, reverse action for tight fit. PUSH PULL PLUGS-are all rubber, simply push it in.
Sizes 0.530 O.D. to 2.035 O.D.Tel: (203) 881-0190 • Fax:(203)881-0178
E-mail: [email protected] • www.conklin-sherman.com
OVER ONE MILLION PLUGS SOLD
PRODUCT Showcase
MERCURY COMPLIANCEEnvironmental Supply Company’s Mercury
Sorbent Trap Monitor is the PS-12B solution for a cost effective and reliable primary
system for Mercury Compliance, or as a back-up to your existing analyzer-based CMM.
Contact Advanced CEMS today!www.advancedcems.com
[email protected](205) 532-1677
meltric.com800.433.7642
4 Simplifies NFPA 70E® compliance4 Protects from arc flash
Qualified technicians can quicklydeenergize and service equipment.
Rated up to 200A, 600V, NEMA 4XDead Front
Safety Shutter
OFFButton
LOTO
Model A100Plug Resistant Orifice for critical drain lines
CU Services LLC725 Parkview Cir,
Elk Grove Vlg, Il 60007Phone 847-439-2303
When a plugged drain line would mean disaster...
Untitled-5 1 12/7/11 12:36:17 PM
READER SERVICE NUMBER 216 READER SERVICE NUMBER 217
POwER PLANT BUYERs’ MART
www.powermag.com POWER | May 2013105
READER SERVICE NUMBER 211 READER SERVICE NUMBER 212 READER SERVICE NUMBER 213
READER SERVICE NUMBER 218
19_PWR_050113_Classified_p104-107.indd 105 4/12/13 2:59:56 PM

www.powermag.com POWER | May 2013106
Technolog ies for coa l - f i red power p lants are evo lv ing rap id ly , and COAL POWE R has evo lved too . In i t s la tes t on l ine format you ge t every th ing you va lued in pr in t and so much more :
• Access to COAL POWE R wherever you can use a browser.
• Techn ica l a r t i c les , coa l power news , b logs , op in ion , and in format ion .
• Easy re t r ieva l o f a rch ived COAL POWE R fea tures .
• Ins tant access to our adver t i sers for more in format ion about the i r products .
• The ab i l i t y to comment on s tor ies and share your knowledge wi th the coa l -burn ing power p lant communi t y.
• Job board .
Subscr ibe today for e -mai l a ler t s when each new i ssue i s pos ted . e -mai l : subscr [email protected]
Then v i s i t the on l ine home of COAL POWE R—www.coa lpowermag.com
From the editors of POWER: The online magazine devoted to the coal-fired power generation industry
POWER
Then v i s i t the on l ine home of
CP ad_7x4.875.indd 1 5/13/10 2:00:00 PM
This POWER magazine chart has now been blown up to display in your of� ce. Printed on glossy stock, size 26”x40”, the Factors for the Unit Conversion wallchart brings equivalent values conveniently to your of� ce wall.
Quantities included on this wallchart:
Factors For Unit Conversion Wallchart
for the Unit Conversion wallchart brings equivalent values for the Unit Conversion wallchart brings equivalent values
FACTORS FOR
UNIT CONVERSIONS
QUANTITY EQUIVALENT VALUES
MASS 1 kg =1,000 g = 35.27392 oz. = 2.20462 lbm
= 0.001 m.t.
1 lbm = 16 oz = 5×10⁻⁴ tons = 0.03108 slugs = 0.453593 kg = 453.593 g
LENGTH 1 m = 100 cm = 1,000 mm = 106 µm =1010 angstroms (A)
= 39.37 in. = 3.2808 ft = 1.0936 yd = 0.0006214 mi
1 ft = 12 in. = 1/3 yd = 0.012 mils = 0.3048 m = 30.48 cm
AREA1 m2 = 10.764 ft2 = 1,550.0 in.2
VOLUME 1 m3 =1,000 L =106 cm3 = 106 mL = 35.3145 ft3 = 220.83 Imp. gal. =
264.17 gal = 1,056.68 qt
1 ft3 = 1,728 in.3 = 7.4805 gal = 0.028317 m3 = 28.317 L = 28,317 cm3
FORCE 1 N = 1 kg•m/s2 = 105 dynes = 105 g•cm/s2 = 0.22481 lbf
1 lbf = 32.174 lbm
•ft/s2 = 4.4482 N = 4.4482×10⁵ dynes
ENERGY, WORK 1 J = 1 N•m = 107 ergs = 107 dyne•cm = 2.778×10 –7 kWh
= 0.23901 cal = 0.7376 ft•lbf = 9.486×10⁻⁴ Btu
POWER 1 W = 1 J/s = 0.23901 cal/s = 0.7376 ft•lbf /s
= 9.486×10⁻⁴ Btu/s = 1.341×10⁻³ hp
PRESSURE 1 atm = 101.3 kPa = 1.013 bars = 14.696 lbf/in.2 = 33.89 ft H2
O
= 29.92 in. Hg = 1.033 kgf/cm2 = 10.33 m H2
O = 760 mm Hg = 760 torr
1 Pa = 1 N/m2 = 1 kg/(m•s2) = 10–5 bars = 1.450×10⁻⁴ lbf/in.2
VISCOSITY 1 cP = 0.01 P = 0.01 g/(cm•s) = 0.001 kg/(m•s) = 0.001 Pa•s = 6.72×10⁻⁴
lbm/(ft•s) = 2.42 lbm
/(ft•h) = 2.09×10⁻⁵ lbf•s/ft2 = 0.01 dynes•s/cm2
DENSITY 1 kg/m3 = 0.06243 lbm/ft3
1 slug/ft3 = 515.38 kg/m3
HEAT TRANSFER
RATE
1 W = 3.412 Btu/h
HEAT FLUX 1 W/m2 = 0.3171 Btu/(h•ft2)
1 kcal/(h•m2) = 1.163 W/m2
HEAT TRANSFER
COEFFICIENT1 W/(m2•K) = 0.1761 Btu/(h•ft2•°F)
MASS FLOWRATE 1 kg/s = 7,936.6 lbm/h = 2.2046 lbm
/s
SPECIFIC HEAT 1 J/(kg•K) = 2.3886×10⁻⁴ Btu/(lbm•°F)
TEMPERATURE T(K) = T(°C) + 273.15 = T(°R)/1.8 = [T(°F) + 459.67]/1.8
T(°C) = [T(°F) – 32]/1.8
T(°R) = 1.8 T/(K) = T(°F) + 459.67
T(°F) = 1.8 T(°C) + 32 = 1.8[T(K) – 273.15] +32
THERMAL CONDUCTIVITY
1 W/(m•K) = 0.57782 Btu/(h•ft•°F) = 0.8599 kcal/(h•m•°C)
Order your copy online at www.powermag.com/powerpress or call 888-707-5808
• Mass
• Length
• Area
• Volume
• Force
• Energy, Work
• Power
• Pressure
• Viscosity
• Density
• Heat Transfer Rate
• Heat Flux
• Heat Transfer Coefficient
• Mass Flowrate
• Specific Heat
• Temperature
• Thermal Conductivity
Makes a unique gift!
21922 Horizontal Wall Chart Ad.indd 1 4/9/13 1:44 PM
19_PWR_050113_Classified_p104-107.indd 106 4/12/13 3:00:28 PM

May 2013 | POWER www.powermag.com 107
Abresist Kalenborn . . . . . . . . . . . . . . . . . . . . . . . . . . . . . . . . . . . . . . . 81 . . . . . . . 57www.abresist.com
Aggreko . . . . . . . . . . . . . . . . . . . . . . . . . . . . . . . . . . . . . . . . . . . . . . . . 52 . . . . . . . 35www.coolingtower.com
AMEC . . . . . . . . . . . . . . . . . . . . . . . . . . . . . . . . . . . . . . . . . . . . . . . . . . 69 . . . . . . . 47www.amec.com/power
Applied Bolting . . . . . . . . . . . . . . . . . . . . . . . . . . . . . . . . . . . . . . . . . . 64 . . . . . . . 45www.appliedbolting.com
AREVA . . . . . . . . . . . . . . . . . . . . . . . . . . . . . . . . . . . . . . . . . . . . . . . . . . 89 . . . . . . . 59www.areva.com
Atlas Copco . . . . . . . . . . . . . . . . . . . . . . . . . . . . . . . . . . . . . . . . . . . . . 57 . . . . . . . 39www.atlascopco.us
Baldor Electric . . . . . . . . . . . . . . . . . . . . . . . . . . . . . . . . . . . . . . . . . . 35 . . . . . . . 22www.baldor.com
Beumer . . . . . . . . . . . . . . . . . . . . . . . . . . . . . . . . . . . . . . . . . . . . . . . . . 11 . . . . . . . . 6www.beumer.com
Brand Energy . . . . . . . . . . . . . . . . . . . . . . . . . . . . . . . . . . . . . . . . . . . . 9 . . . . . . . . 5www.beis.com
BRUKS . . . . . . . . . . . . . . . . . . . . . . . . . . . . . . . . . . . . . . . . . . . . . . . . . . 48 . . . . . . . 31www.bruks.com
Burns & McDonnell . . . . . . . . . . . . . . . . . . . . . . . . . . . . . . . . . . . . . . 51 . . . . . . . 34www.burnsmcd.com
Carboline . . . . . . . . . . . . . . . . . . . . . . . . . . . . . . . . . . . . . . . . . . . . . . . 44 . . . . . . . 28www.carboline.com
Caterpillar . . . . . . . . . . . . . . . . . . . . . . . . . . . . . . . . . . . . . . . . . . . . . . 7 . . . . . . . . 4www.catelectricpowerinfo.com/pm
CleaverBrooks . . . . . . . . . . . . . . . . . . . . . . . . . . . . . . . . . . . . . . . . . . . 61 . . . . . . . 42www.cleaverbrooks.com/engineered
Corrpro . . . . . . . . . . . . . . . . . . . . . . . . . . . . . . . . . . . . . . . . . . . . . . . . . 94 . . . . . . . 61www.corrpro.com
Diamond Power . . . . . . . . . . . . . . . . . . . . . . . . . . . . . . . . . . . . . . . . . 67 . . . . . . . 46www.diamondpower.com
EDF Renewable Energy . . . . . . . . . . . . . . . . . . . . . . . . . . . . . . . . . . . 79 . . . . . . . 54www.edf-re.com
Enercon . . . . . . . . . . . . . . . . . . . . . . . . . . . . . . . . . . . . . . . . . . . . . . . . . 59 . . . . . . . 41www.enercon.com
Exxon/Mobil . . . . . . . . . . . . . . . . . . . . . . . . . . . . . . . . . . . . . . . . . . . . 17 . . . . . . . 12www.exxonmobil.com
Flexco . . . . . . . . . . . . . . . . . . . . . . . . . . . . . . . . . . . . . . . . . . . . . . . . . . 13 . . . . . . . . 8www.flexco.com
Fluor Corp . . . . . . . . . . . . . . . . . . . . . . . . . . . . . . . . . . . . . . . . . . . . . . . 55 . . . . . . . 37www.fluor.com
FP Solutions . . . . . . . . . . . . . . . . . . . . . . . . . . . . . . . . . . . . . . . . . . . . . 81 . . . . . . . 56www.fpsoluzs.com
Frontier Industrial . . . . . . . . . . . . . . . . . . . . . . . . . . . . . . . . . . . . . . . . 56 . . . . . . . 38www.fic-services.com
FSE Energy . . . . . . . . . . . . . . . . . . . . . . . . . . . . . . . . . . . . . . . . . . . . . . 22 . . . . . . . 15www.fseenergy.com
Hadek . . . . . . . . . . . . . . . . . . . . . . . . . . . . . . . . . . . . . . . . . . . . . . . . . . 39 . . . . . . . 24www.hadek.com
Harco . . . . . . . . . . . . . . . . . . . . . . . . . . . . . . . . . . . . . . . . . . . . . . . . . . . 58 . . . . . . . 40www.harcolabs.com
Hatch . . . . . . . . . . . . . . . . . . . . . . . . . . . . . . . . . . . . . . . . . . . . . . . . . . . 62 . . . . . . . 43www.hatch.ca
Hawk Measurements America . . . . . . . . . . . . . . . . . . . . . . . . . . . . 7 . . . . . . . 55www.hawkmeasure.com
Hitachi Power Systems . . . . . . . . . . . . . . . . . . . . . . . . . . . . . . . . .Cover 3 . . . . 62www.hitachipowersystems.us
Hytorc Inc . . . . . . . . . . . . . . . . . . . . . . . . . . . . . . . . . . . . . . . . . . . . . . . 21 . . . . . . . 14www.hytorc.com
Indeck Power Equipment . . . . . . . . . . . . . . . . . . . . . . . . . . . . . . . . . 73 . . . . . . . 50www.indeck.com
Kiewit . . . . . . . . . . . . . . . . . . . . . . . . . . . . . . . . . . . . . . . . . . . . . . . . . . 25 . . . . . . . 17www.kiewit.com
KIMA . . . . . . . . . . . . . . . . . . . . . . . . . . . . . . . . . . . . . . . . . . . . . . . . . . . 14 . . . . . . . . 9www.kimae.de
Magnetrol . . . . . . . . . . . . . . . . . . . . . . . . . . . . . . . . . . . . . . . . . . . . . . . 37 . . . . . . . 23www.magnetrol.com
Marrone Bio . . . . . . . . . . . . . . . . . . . . . . . . . . . . . . . . . . . . . . . . . . . . . 75 . . . . . . . 51www.gotmussels.com
Martin Engineering . . . . . . . . . . . . . . . . . . . . . . . . . . . . . . . . . . . . . . 16 . . . . . . . 11www.martin-eng.com
Matrix Service . . . . . . . . . . . . . . . . . . . . . . . . . . . . . . . . . . . . . . . . . . 77 . . . . . . . 52www.matrixservice.com
Mitsubishi Power Systems . . . . . . . . . . . . . . . . . . . . . . . . . . . . . . . . 27 . . . . . . . 18www.mpshq.com
NAES Corp . . . . . . . . . . . . . . . . . . . . . . . . . . . . . . . . . . . . . . . . . . . . . . 29 . . . . . . . 19www.naes.com
NatronX . . . . . . . . . . . . . . . . . . . . . . . . . . . . . . . . . . . . . . . . . . . . . . . . . 49 . . . . . . . 32www.natronx.com
Nol-Tec Systems . . . . . . . . . . . . . . . . . . . . . . . . . . . . . . . . . . . . . . . . . 32 . . . . . . . 21www.nol-tec.com
Orion Instruments . . . . . . . . . . . . . . . . . . . . . . . . . . . . . . . . . . . . . . . . 83 . . . . . . . 58www.orioninstruments.com
Paharpur . . . . . . . . . . . . . . . . . . . . . . . . . . . . . . . . . . . . . . . . . . . . . . . . 47 . . . . . . . 30www.paharpur.com
Parkline . . . . . . . . . . . . . . . . . . . . . . . . . . . . . . . . . . . . . . . . . . . . . . . . 91 . . . . . . . 60www.parkline.com
Phillips 66 . . . . . . . . . . . . . . . . . . . . . . . . . . . . . . . . . . . . . . . . . . . . . . . 5 . . . . . . . . 3www.phillips66lubricants.com
PIC Group . . . . . . . . . . . . . . . . . . . . . . . . . . . . . . . . . . . . . . . . . . . . . . . 23 . . . . . . . 16www.picworld.com
Power & Industrial . . . . . . . . . . . . . . . . . . . . . . . . . . . . . . . . . . . . . . . 45 . . . . . . . 29www.piburners.com
Rentech . . . . . . . . . . . . . . . . . . . . . . . . . . . . . . . . . . . . . . . . . . . . . . .Cover 2 . . . . . 1www.rentechboilers.com
Rolls-Royce . . . . . . . . . . . . . . . . . . . . . . . . . . . . . . . . . . . . . . . . . . . . . 3 . . . . . . . . 2 www.rolls-royce.com
Sealeze . . . . . . . . . . . . . . . . . . . . . . . . . . . . . . . . . . . . . . . . . . . . . . . . . 19 . . . . . . . 13www.sealeze.com
STF S .p .A . . . . . . . . . . . . . . . . . . . . . . . . . . . . . . . . . . . . . . . . . . . . . . . 40 . . . . . . . 25www.stf.it
Sturtevant . . . . . . . . . . . . . . . . . . . . . . . . . . . . . . . . . . . . . . . . . . . . . . . 43 . . . . . . . 27www.sturtevantinc.com
Sulzer Turbo Services . . . . . . . . . . . . . . . . . . . . . . . . . . . . . . . . . . . . 31 . . . . . . . 20www.sulzerts.com
Superbolt . . . . . . . . . . . . . . . . . . . . . . . . . . . . . . . . . . . . . . . . . . . . . . . 78 . . . . . . . 53www.superbolt.com
TEAM Industrial Service . . . . . . . . . . . . . . . . . . . . . . . . . . . . . . . . . . 15 . . . . . . . 10www.teaminc.com
TerraSource Global . . . . . . . . . . . . . . . . . . . . . . . . . . . . . . . . . . . .Cover 4 . . . . 63www.terrasource.com
TIC . . . . . . . . . . . . . . . . . . . . . . . . . . . . . . . . . . . . . . . . . . . . . . . . . . . . . 71 . . . . . . . 48www.tic-inc.com
TurboCare . . . . . . . . . . . . . . . . . . . . . . . . . . . . . . . . . . . . . . . . . . . . . . . 50 . . . . . . . 33www.turbocare.com
URS . . . . . . . . . . . . . . . . . . . . . . . . . . . . . . . . . . . . . . . . . . . . . . . . . . . . 41 . . . . . . . 26www.urs.com
Victory Energy . . . . . . . . . . . . . . . . . . . . . . . . . . . . . . . . . . . . . . . . . . . 12 . . . . . . . . 7www.victoryenergy.com
Zachry . . . . . . . . . . . . . . . . . . . . . . . . . . . . . . . . . . . . . . . . . . . . . . . . . . 72 . . . . . . . 49www.zhi.com
Page
Reader Service Number
ClASSIFIED ADVERTISING Pages 103-106 . To place a classified ad, contact Diane Burleson,
512-250-9555, dianeb@powermag .com
Page
Reader Service Number
ADVERTISERS’ INDEXEnter reader service numbers on the FREE Product Information Source card in this issue.
19_PWR_050113_Classified_p104-107.indd 107 4/12/13 3:01:07 PM

www.powermag.com POWER | May 2013108
COMMENTARY
A Safety Milestone at NV EnergyBy Dariusz Rekowski
“Safety is as Safety Does” and “Ignoring a Warning Can Cause Much Mourning” are two of the more cre-ative safety slogans I’ve heard. Such inventive catch
phrases and workplace safety posters are just part of what helps us achieve our ultimate goal, which is to ensure our employees return to their homes and loved ones in the same condition they left.
Only a collaborative and concerted effort, coupled with in-dividual responsibility, can help us safely manage our power industry environment, which is full of extremely high tem-peratures, high pressures, and, of course, electricity.
We are always learning and improving at NV Energy, and I felt it was important to share some of the values and methods we use to help keep each other safe.
Culture of SafetyOne place within our fleet that stands out is at our natural gas–fueled Fort Churchill Generating Station, just north of Ye-rington, Nevada. Remarkably, this plant’s team of more than 30 employees crossed a silver-anniversary safety threshold last year. The vigilant personal responsibility and “watch-out-for-each-other” safety culture at Fort Churchill has resulted in more than 25 years of operation without experiencing a single lost-time accident. We’ve been told that is the best in the nation for a fossil-fueled plant, and we are very proud of our team and what they’ve accomplished. It’s even more amazing when you think about it this way: The last lost-time accident happened when Ronald Reagan was president and a gallon of gasoline sold for under $1.
No one effort or policy or program can take full credit for such an accomplishment, but we’ve discovered that one of the most important and successful approaches we use is unfiltered com-munications between our maintenance and operations crews and the executive level of our company.
Specifically, our executive team and safety leaders regu-larly visit power plants to directly talk to our employees about safety. To reduce normal employee inhibitions about communicating information and making suggestions, we ex-cuse our power plant directors, leaders, and supervisors from these meetings. This enables the discussion to focus on safe-ty solutions, without worry of unintended innuendo. Our role as executives is to understand the issues and work to remove any actual or perceived barriers to achieving a best-in-class safety experience.
Another best practice at NV Energy is freeing up time and resources to routinely allow small teams of power plant em-ployees to audit other power plants or work environments. Too often safety-minded workers in a longstanding or com-fortable environment are blind to some of the everyday little
things that could turn into safety problems or injuries. At the Fort Churchill Generating Station, we responded to
more than 1,500 safety suggestions over the years, which com-bined to make the plant the safest in the nation. Those safety recommendations came from safety meetings, safety audits, individual suggestions, and the plant’s safety committee. Ad-ditionally, the safety culture of our Fort Churchill team benefits from the fact that our employees are part of a larger commu-nity, where children play sports together, spouses see each oth-er at the local market, and employees socialize offsite. These interactions tend to strengthen our watch-out-for-each-other safety culture.
Timely, widespread employee communications about safety successes and failures are also part of our safety culture. Any time we have an injury, we require our safety teams to do a root-cause safety analysis. We want the lessons learned to be available to all team members as soon as possible. This helps to prevent similar situations and serves as a reminder of the impor-tance of safety in our workplaces.
Everyone Goes Home, Every DayAll of this brings me back to this thought: I believe that the most important key to our success has been our dedication to value “safety over production—always.” Leaders have the opportunity to demonstrate this at all times, and employees know that they are expected to stop all work, including plant production, when safety could be compromised.
Our teams have established intentional slowdowns at the beginning and end of planned outages to purposely dem-onstrate this value. We have specific work tasks that are not permitted to be performed when an employee is solo, or when the site is in production mode with only two em-ployees. We insist that deliveries be turned away when we do not have the proper after-hours staffing to accommodate unloading.
Everyone must own safety. We cannot be hampered by the potential of hurt feelings or myriad other factors that inad-vertently creep into a safety culture that could compromise safety. Words cannot describe the hurt and loss to family members when loved ones are injured or killed. Similarly, I know how difficult it is for “company family members” when a fellow employee is hurt. No motto can fix those situations—only an ongoing collaborative effort that helps us keep up with an ever-changing safety environment.
We cannot compromise on our environmental integrity, and we cannot compromise our commitment to return our dedicat-ed employees back to their loved ones each and every day. ■
—Dariusz Rekowski is NV Energy’s executive over power generation.

HITACHI POWER SYSTEMS AMERICA, LTD.645 Martinsville Road, Basking Ridge, NJ 07920
[email protected] Tel: 908-605-2800
www.hitachipowersystems.us
HITACHI INTRODUCES
NEW COMBUSTION TURBINE TECHNOLOGY
HITACHI HAS DEVELOPED SEVERAL NEW MODELS including a 100 MW
combustion turbine (Hitachi H-80), and several upgrades of the mature H-25 combustion
turbine technology, ranging from 32–42 MW. Hitachi’s combustion turbine lineup is ideal for
upgrading/replacing existing simple cycle and combined cycle combustion turbines. Nominal
combined cycle outputs of 140 MW or 285 MW are achievable with the H-80 combustion
turbine in 1x1 or 2x1 plant arrangements. Learn more from Hitachi Power Systems America.
HITACH GAS TURBINE PRODUCT LINE – 60 HZ
ITEM UNIT H-15 H-25 H-80
Output MW 16.9 32 99.3
Efficiency %(LHV) 34.4 34.8 37.5
Heat Rate Btu/kWh 9,950 9,806 9,100
Exhaust Flow lb/h 420,000 767,000 2,262,000
Exhaust Temp ˚F 1,047 1,042 986
ISO Conditions (Sea Level, 59˚F, 60% RH), Natural Gas Firing
CIRCLE 62 ON READER SERVICE CARD

www.TerraSource.com
The brands of TerraSource™ Global are wholly-owned subsidiaries of Hillenbrand, Inc. (NYSE: HI),
which is based in Indiana. © 2013, TerraSource™ Global. All rights reserved.
Connect with us:
Gundlach Crushers, Jeffrey Rader and Pennsylvania Crusher are three distinguished brands with one common
mission: to provide size reduction and material handling equipment of the highest quality in the market to serve
the power, mining, forest products, cement, steel, aluminum and industrial waste industries, to name a few.
TerraSource™ Global has sales, engineering and service offices strategically located throughout the world to offer
customers around the globe a complete range of processing solutions.
Contact us today to learn what we can do for you.
Please email us for more information at: [email protected]
TerraSource™ Global is the ultimate resource for material processing and handling equipment,
uniting three market leaders whose brands are recognized and trusted around the globe.
Power. Progress. Partnership.
CIRCLE 63 ON READER SERVICE CARD


