Contract No. DE-AC36-08GO28308 Technical Report NREL/TP-6A20-62611 February 2015 Power Systems of the Future A 21 st Century Power Partnership Thought Leadership Report Owen Zinaman, Mackay Miller, Ali Adil, Douglas Arent, Jaquelin Cochran, and Ravi Vora National Renewable Energy Laboratory Sonia Aggarwal Energy Innovation: Policy and Technology LLC Minnesh Bipath South Africa National Energy Development Institute Carl Linvill Regulatory Assistance Project Ari David Columbia University Business School Richard Kauffman Office of the Governor, New York Matt Futch National Grid Efraín Villanueva Arcos and José María Valenzuela Secretaría de Energía (SENER), Mexico Eric Martinot Institute for Sustainable Energy Policies Morgan Bazilian Columbia University, Sustainable Engineering Lab Reji Kumar Pillai India Smart Grid Forum
Transcript
Contract No. DE-AC36-08GO28308
Technical Report NREL/TP-6A20-62611 February 2015
Power Systems of the Future A 21st Century Power Partnership Thought Leadership Report Owen Zinaman, Mackay Miller, Ali Adil, Douglas Arent, Jaquelin Cochran, and Ravi Vora National Renewable Energy Laboratory
Sonia Aggarwal Energy Innovation: Policy and Technology LLC
Minnesh Bipath South Africa National Energy Development Institute
Carl Linvill Regulatory Assistance Project
Ari David Columbia University Business School
Richard Kauffman Office of the Governor, New York
Matt Futch National Grid
Efraín Villanueva Arcos and José María Valenzuela Secretaría de Energía (SENER), Mexico
Eric Martinot Institute for Sustainable Energy Policies
Morgan Bazilian Columbia University, Sustainable Engineering Lab
Reji Kumar Pillai India Smart Grid Forum
NREL is a national laboratory of the U.S. Department of Energy, Office of Energy Efficiency & Renewable Energy, operated by the Alliance for Sustainable Energy, LLC.
Contract No. DE-AC36-08GO28308
National Renewable Energy Laboratory 15013 Denver West Parkway Golden, CO 80401 303-275-3000 • www.nrel.gov
Power Systems of the Future A 21st Century Power Partnership Thought Leadership Report Owen Zinaman, Mackay Miller, Ali Adil, Douglas Arent, Jaquelin Cochran, and Ravi Vora NREL
Sonia Aggarwal Energy Innovation: Policy, and Technology, LLC
Minnesh Bipath South Africa National Energy Development Institute
Carl Linvill Regulatory Assistance Project
Ari David Columbia University Business School
Matt Futch National Grid
Richard Kauffman Office of the Governor, New York
Efraín Villanueva Arcos and José María Valenzuela Secretaría de Energía (SENER), Mexico
Eric Martinot Institute for Sustainable Energy Policies
Morgan Bazilian Columbia University, Sustainable Engineering Lab
Reji Kumar Pillai India Smart Grid Forum Prepared under Task No WFW8.1050
Technical Report NREL/TP-6A20-62611 February 2015
NOTICE This report was prepared as an account of work sponsored by an agency of the United States government. Neither the United States government nor any agency thereof, nor any of their employees, makes any warranty, express or implied, or assumes any legal liability or responsibility for the accuracy, completeness, or usefulness of any information, apparatus, product, or process disclosed, or represents that its use would not infringe privately owned rights. Reference herein to any specific commercial product, process, or service by trade name, trademark, manufacturer, or otherwise does not necessarily constitute or imply its endorsement, recommendation, or favoring by the United States government or any agency thereof. The views and opinions of authors expressed herein do not necessarily state or reflect those of the United States government or any agency thereof.
NREL prints on paper that contains recycled content.
iii
This report is available at no cost from the National Renewable Energy Laboratory (NREL) at www.nrel.gov/publications.
Acknowledgments The authors would like to thank the Advisory Group for this report, who provided invaluable guidance and comments:
Susanne Ackeby, Swedish Transmission Research Institute
Bo Normark, PowerCircle
Ron Binz, Public Policy Consulting
Susan Tierney, Analysis Group
Lawrence Jones, Alstom Grid
Bosco Astarloa and Katherine Avgerinos, World Economic Forum
Kaare Sandholt, China National Renewable Energy Center
Ken Locklin, Impax Asset Management
The authors would also like to thank Karin Haas, Lauren Zwicker, and Scott Gossett for their invaluable support throughout the writing, design and publication process.
iv
This report is available at no cost from the National Renewable Energy Laboratory (NREL) at www.nrel.gov/publications.
Abstract This report summarizes key forces driving transformation in the power sector around the world, presents a framework for evaluating decisions regarding extent and pace of change, and defines pathways for transformation. Powerful trends in technology, policy environments, financing, and business models are driving change in power sectors globally. In light of these trends, the question is no longer whether power systems will be transformed, but rather how these transformations will occur. Three approaches to policy and technology decision-making can guide these transformations: adaptive, reconstructive, and evolutionary. Within these approaches, we explore the pathways that have emerged as viable models for power system transformation, listed below.
• Next-generation Performance-based Regulation Pathway: In this adaptive pathway, vertically-integrated utilities remain in a recognizable form, but evolve to prioritize delivery of value instead of minimizing costs.
• Clean Restructuring Pathway: In this reconstructive pathway, new power market restructuring efforts are initiated, incorporating lessons learned from the past 20 years, including design features to facilitate clean energy integration and system optimization. Hindsight is 20/20—this reconstructive pathway brings hindsight to bear on restructuring and reform.
• Unleashing the DSO Pathway: Distribution system operators (DSOs) are poised to innovate in order to drive clean generation deployment and power system flexibility. In this evolutionary pathway, regulatory and policy frameworks give clear signals to these DSOs, empowering them as the centerpiece for orchestrating distributed energy resources and low-voltage market functioning.
• Bottom-of-the-Pyramid (BOP) Coordination Pathways: Accelerating energy access has been a chronic challenge for decades. New technology configurations and business models are opening up opportunities for innovative approaches to energy access, especially when linked to broader social development goals. In this context, two pathways emerge:
o Adaptive Bottom-up Coordinated Grid Expansion
o Evolutionary Bundled Community Energy Planning strategies, leading to integrated, socially-customized energy access solutions.
These pathways are illustrated in Figure X - 1, linked to illustrative power system ‘starting points’ commonly found around the world today.
v
This report is available at no cost from the National Renewable Energy Laboratory (NREL) at www.nrel.gov/publications.
Figure X - 1. Power System Pathway Origins
Charting the course for power system change involves complex decision-making across policy goals, technological systems, social contexts, and financial networks. Rather than centering the discussion on potential utility business models or regulatory frameworks—as has been ably captured in other reports—we instead consider the transformation of the broader power system ecosystem. The five pathways explored in the report, each grounded in current experience around the world, provide a useful framework from which policymakers can consider, deliberate, and guide transformation.
vi
This report is available at no cost from the National Renewable Energy Laboratory (NREL) at www.nrel.gov/publications.
Table of Contents 1 Introduction ........................................................................................................................................... 1 2 Ten Trends Driving Power System Evolution .................................................................................... 3
Renewable Energy Cost Reductions ............................................................................................. 3 2.1 Innovations in Data, Intelligence, and System Optimization ........................................................ 4 2.2 Energy Security, Reliability, and Resilience Goals ....................................................................... 4 2.3 Evolving Customer Engagement ................................................................................................... 5 2.4 A Tale of Two Electricity Demand Forecasts ............................................................................... 5 2.5 Increased Interactions with Other Sectors ..................................................................................... 5 2.6 Local and Global Environmental Concerns over Air Emissions ................................................... 6 2.7 Energy Access Imperatives ........................................................................................................... 7 2.8 Increasingly Diverse Participation in Power Markets ................................................................... 7 2.9
Revenue and Investment Challenges ............................................................................................. 8 2.10 Summary: Understanding the Costs and Risks of Inaction ........................................................... 9 2.11
3 A Framework for Decision Making .................................................................................................... 10 Adaptation ................................................................................................................................... 11 3.1
“Fight” or “Flight” ...................................................................................................................... 11 Top-Down Grid Expansion ......................................................................................................... 11
Reconstruction ............................................................................................................................. 11 3.2Mexico Energy Reform ............................................................................................................... 11
Evolution ..................................................................................................................................... 12 3.3RIIO ........................................................................................................................................ 12 “EPRI: The Integrated Grid” ....................................................................................................... 12 “Reforming the Energy Vision” .................................................................................................. 13 “CSIRO: Rise of the Prosumer” .................................................................................................. 13 IFC: Fragmented Services ........................................................................................................... 13
4 In Focus: Power Sector Finance ....................................................................................................... 15 5 Pathways to Power Systems of the Future ...................................................................................... 19
This report is available at no cost from the National Renewable Energy Laboratory (NREL) at www.nrel.gov/publications.
1 Introduction New Delhi. Mexico City. Copenhagen. Beijing. San Francisco. Johannesburg. Helsinki. Berlin. In these cities and elsewhere, forces are combining to reshape power systems at a rate faster than would have been expected 20 years ago. In an investor note in August 2014, UBS bank wrote (UBS 2014):
“The value chain in developed electricity markets will be turned upside down within the next 10-20 years...power is no longer something that is exclusively produced by huge, centralised units. By 2025, everybody will be able to produce and store power.”
Similarly, in May 2014, Barclays bank wrote (Barclays 2014):
"In the 100+ year history of the electric utility industry, there has never before been a truly cost-competitive substitute available for grid power…we believe solar + storage could reconfigure the organisation and regulation of the electric power business over the coming decade.”
Power systems would appear poised for a revolution. Yet the pathway to transformation is highly sensitive to each local situation and its technical, economic, and political factors. While rapid cost reductions have changed the economic landscape for what is feasible, established asset bases—and their supporting business models and regulatory frameworks—generate significant inertia in most power systems. These long-standing financial and institutional arrangements promote incremental change and help explain why the International Energy Agency’s World Energy Outlook 2013 estimates the continuation of fossil fuel dominance globally in the power sector through 2035 (IEA 2013). The BP Statistical Outlook sounds a similarly business-as-usual note, predicting that 63% of the total energy consumed in the power sector will be from fossil fuels in 2035, a small shift from 68% in 2012 (BP 2014).
Where on the spectrum of possibility will power systems of the future land? Will they transform incrementally, or will evolutionary leaps be unleashed? Are there leapfrog opportunities that employ new technologies, policies, and business models? A common theme of desired attributes includes lower carbon intensity, cost-effectiveness, accessibility, reliability, resilience, and increasingly embedding smart, real time (or close to) control and services. However, it is unlikely that the same transformation will occur everywhere, because in each context the power system of the future emerges from the interacting forces of policy, regulation, global
Figure 1. Evolutionary Landscape of Power System Transformation
2
This report is available at no cost from the National Renewable Energy Laboratory (NREL) at www.nrel.gov/publications.
market forces, business model innovation, technological innovation, and consumer behavior1. In the language of ecology, power systems are complex dynamical systems, and scientific research across multiple domains reinforces that such systems have ‘critical points’ marking a shift to a new regime (May, Levin, and Sugihara 2008; Scheffer et al. 2009).
Are power systems reaching such a threshold? With trillions of dollars invested in physical infrastructure and institutional arrangements, and trillions more needed to achieve energy access and sustainability in the next 50 years (IEA 2013), the answer is worth exploring.
Many voices have emerged on this issue. This report aims to build upon recent developments and thought leadership on this issue, synthesizing the critical frameworks for decision making on transformation pathways. The report also aims to distill fundamental aspects of power system transformation as it pertains both to developed countries as well as the major “emerging renewable energy powers” (EREP), such as Mexico, India, South Africa, and China.
In this context, the report originates with the goal of providing a grounded view that can enable sound and proactive choices by decision makers. The focus extends from technology to business models to the institutional arrangements that enable orderly investment and reliable system operation, in order to drive transformation that aligns with policy goals.
The report is organized as follows. Section 2 briefly describes ten trends driving power system evolution. Section 3 briefly summarizes frameworks for transformation. Section 4 discusses implications for power sector finance. Section 5 defines five principal transformative pathways and explores policy and regulatory priorities for encouraging new power systems to emerge. Section 6 concludes summarizing policy and regulatory priorities for transformation.
1 The National Renewable Energy Laboratory (NREL) is currently creating a framework to holistically examine how these interacting forces will transform the electricity sector, and what analysis needs are required to enable future changes (Cory and Aznar 2014).
3
This report is available at no cost from the National Renewable Energy Laboratory (NREL) at www.nrel.gov/publications.
2 Ten Trends Driving Power System Evolution While the “utility of the future” can be largely captured by the dynamic between regulation, technology innovation, and business model evolution, the “power system of the future” is driven by a more complex set of features. The regulatory-utility dynamic is still a dominant component, but the full complex and dynamic system responds to a broader set of cross-cutting trends. This section explores 10 such trends as a background to the subsequent discussion of potential futures.
2.1 Renewable Energy Cost Reductions 2.2 Innovations in Data, Intelligence, and System Optimization 2.3 Energy Security, Reliability, and Resilience Goals 2.4 Evolving Customer Engagement 2.5 A Tale of Two Electricity Demand Forecasts 2.6 Increased Interactions with Other Sectors 2.7 Local and Global Environmental Concerns over Air Emissions 2.8 Energy Access Imperatives 2.9 Increasingly Diverse Participation in Power Markets 2.10 Revenue and Investment Challenges 2.11 Summary: Understanding the Costs and Risks of Inaction
Renewable Energy Cost Reductions 2.1Cost reductions in renewable energy (RE) are driving rapid deployment and are encouraging both power system interdependence and independence. Bulk power system interdependence (e.g., coordination across larger balancing areas to drive down RE integration costs) is growing in many jurisdictions. At the same time, the cost of RE is falling for small customers, and customer-sited systems increasingly offer greater choice and resiliency. Figure 2 illustrates the recent dramatic reductions in photovoltaic module costs.
The result is two countervailing trends: one toward greater cohesion and one toward greater decentralization. Some (Barclays 2014; RMI 2014; UBS 2014) have postulated an increasing shift toward “defection” from the traditional utility/customer relationship. Others (EPRI 2014; Kind 2013) articulate the critical role of the centralized generation, transmission and distribution system. Still others (Ruth and Kroposki 2014) articulate an increasing intelligent, heterogonous
Figure 2. U.S. Residential System Photovoltaic Costs ($/WDC)
Source: Barclays 2014
4
This report is available at no cost from the National Renewable Energy Laboratory (NREL) at www.nrel.gov/publications.
“system of systems.” Is there a way to reconcile these trends? Will the power system evolve to a coordinated ensemble of assets through which many business/customer relationships exist? The sections below investigate some emerging technology and market options that could support both trends, including aggregation and coordination of many semi-independent customer systems to support the cohesive operation of the bulk power system.
Innovations in Data, Intelligence, and System Optimization 2.2The power grid does not just transmit electricity. Now that sensors and information technology are increasingly permeating power systems, resulting in the ubiquity of market and operational data, there is an enormous opportunity to realize further optimizations of power systems. Large quantities of distributed energy resources could dramatically increase the complexity of network operation, but, appropriately managed, could help to meet reliability needs and relieve congestion in real-time.
There is an increasing interdependence of information technology and energy technology, with smarter grids opening pathways to greater functionality (e.g., situational awareness) and active management of more diverse sets of resources providing a range of services that can be monetized in energy markets. Granular data on power system performance and big data analytics can reveal investment needs for grid enhancement and inform the locational value of distributed energy resources such as distributed generation and storage (Denholm et al. 2014). The forces of data and intelligence are also sharpening the focus on cyber security, open access to data, and consumer privacy protections. These trends infuse much of the current thinking about power systems of the future (ISGAN 2013; IBM 2012; Sungard 2013; Oracle 2013).
Energy Security, Reliability, and Resilience Goals 2.3In many settings, imports of coal, oil, and natural gas are raising energy security concerns, exacerbating current account balances, and driving increased interest in efficiency and locally developed RE. In other cases, abundant supply and use, particularly of natural gas, offer increased opportunity for low-cost utilization, addressing some environmental policy goals including local air quality, but have also raised questions regarding longer term pathways toward lower carbon intensity, price volatility, and geopolitical considerations. The economic potential of RE—and the ability of RE to mitigate energy security concerns—varies widely by country, determined primarily by abundance of resource and distance from load. Some countries have abundant solar and wind resources located close to load (e.g., India and Mexico), others have abundant wind and solar far from load (e.g., the U.S. and China).
Grid resilience has increased in importance as extreme weather events occur more frequently. Instead of reinforcing existing systems, which are dominated by a hub-and-spoke structure and use of redundancies to maintain reliability, resilience planning considers mechanisms to increase how flexible the system is, so that critical portions of the system can come back online both quickly and independently, in the event of an outage. Resilience to disasters is increasingly among the top priorities for power system decision makers. Natural disaster induced outages and increased data and intelligence raise issues and opportunities related to the security, reliability, and resilience of the power system. Solutions that are more resilient and support critical infrastructure, safety, and public health in case of emergencies are increasingly sought.
5
This report is available at no cost from the National Renewable Energy Laboratory (NREL) at www.nrel.gov/publications.
These differences, layered atop the existing energy mix and increasingly interdependent energy infrastructures, are redefining the 21st century conception of reliability.
Evolving Customer Engagement 2.4Customer engagement is changing power system dynamics in two ways. First, customer preferences are more directly driving investment trends, for example through energy efficient appliances, distributed generation, electric vehicles, and smarter homes. Customers are increasingly valuing services that use energy (e.g., heating, cooling, lighting, refrigeration, electronics, communications, entertainment) over energy itself. Secondly, technology innovations are enabling a step change in how customers participate in energy supply and demand. Historically, largely inelastic demand led to sharp system peaks, so power system planning, regulation, and market design treated demand as a fixed target, with utilities and grid operators building a dispatchable supply stack to meet it. Direct consumer participation holds the potential to alter these planning practices and surrounding market designs. At a time when renewable electricity is increasing variability on the supply-side, intelligent demand will be an increasingly important dispatchable resource (IEA-RETD 2014).
Customer engagement in power markets has already been shown to be technically feasible across residential, commercial, and industrial sectors (PJM 2013). As this engagement also becomes more economically feasible and socially routine, the rest of the power sector faces the challenge of keeping up and embracing the need to co-optimize electricity supply and demand dynamically.
A Tale of Two Electricity Demand Forecasts 2.5With some exceptions, the global energy landscape has bifurcated into areas of rapid growth and areas of flat or decreasing demand. Many emerging economies are exhibiting strong growth, industrialization, and rapid urbanization (World Bank 2014). With relatively smaller asset bases, these settings provide interesting opportunities for innovation and technology leap-frogging.
Meanwhile, the U.S., EU, and Japan, among others, are marked by slow demand growth (EIA 2013; Eurostat 2014; Statistics Japan 2014). Compounding slow economic growth, these power systems are increasingly marked by growing energy efficiency programs, and could also see decreases in peak demand due to the rise in distributed generation and demand response. This could impact use patterns for existing infrastructure, raising regulatory questions about cost recovery of current investments.
In a sense, these two bifurcated states represent the dominant contours that may prevail over power system evolution in the next generation. These unique trajectories will strongly shape planning strategies and opportunities for power system transformation.
Increased Interactions with Other Sectors 2.6Globally, power systems increasingly compete for scarce water and land resources, sharpening debates about the sector’s evolution but also encouraging improved accounting approaches. Parallel evolutionary processes taking place in the built environment (from super-efficient appliances to home-based thermal storage to campus microgrid projects) also need to be accounted for in power system planning. Electrification of transport, while still at relatively low
6
This report is available at no cost from the National Renewable Energy Laboratory (NREL) at www.nrel.gov/publications.
levels, has the potential to significantly impact power system needs and opportunities (Green et al. 2011; Mwasilu et al. 2014). As production of shale gas increases globally, gas generators may compete with other critical sectors (e.g., home heating, chemical) for these domestic resources, leaving policymakers to contemplate interventions to distribute resources in alignment with national objectives. And finally, industrial consumers—already facing competitive pressure in the global economy to cut costs—are increasingly turning to RE to reduce net energy costs. Each of these touch-points with other sectors is shifting the landscape of power system evolution.
Local and Global Environmental Concerns over Air Emissions 2.7Poor air quality stemming from fossil fuel emissions contributes to acute public health problems at the local level (Chen et al. 2013; EPA 2011). At a global level, fossil fuel use contributes significantly to climate change (IPCC 2014). The local and global costs of fossil fuel pollution occur largely outside the power sector, are more difficult to account for, and thus historically have not been explicitly included in planning processes. But in the 21st century both concerns are contributing to changes in power system policy and planning.
In many countries, this emerges in the form of policy mandates to grow clean energy sources. China, for example, created an explicit ‘carbon intensity’ target to reduce carbon emissions per unit of GDP, and a portfolio of technology-specific capacity targets (NPC 2011). In Europe, environmental energy policy takes the form of a continental emissions trading scheme layered on top of a patchwork of national policy targets. In Mexico, a series of RE targets are coupled with a comprehensive energy reform that aims to restructure the power sector.
Beyond emissions reduction measures, planning practices in settings with established grids are increasingly focused on mitigating the impact of more frequent extreme weather events (see Section 2.3), both by physically hardening existing infrastructure and upgrades to more intelligent systems which utilize distributed resources and islandable microgrids (Abbey et al. 2014).
7
This report is available at no cost from the National Renewable Energy Laboratory (NREL) at www.nrel.gov/publications.
Energy Access Imperatives 2.8As part of global agreements to speed economic development and opportunity, there is growing momentum to accelerate energy access to all people. Expanding finance and technology options are providing tailwinds for these energy access goals, but significant investment challenges remain the norm. This report will summarize current approaches to accelerate energy access, ranging from expansion of centralized systems, to more bottom-up electrification approaches. Thereafter, it will explore the emerging opportunities, especially those centering on identifying sustainable models for accelerating energy access, and ensuring a level of ‘backwards-compatibility’ so that choices made today can be integrated across a wide range of potential futures.
Increasingly Diverse Participation in Power Markets 2.9Around the world, participation in power market ecosystems is diversifying. In emerging economies, where many power sectors have been state-owned, there is a push to boost investment by opening the sector to more independent power producers (e.g. Mexico, South Africa). In more mature power sectors, this trend is taking the shape of greater direct consumer power market participation, from generation to demand response. These diversification trends,
TEXT BOX 1: HYBRID POWER MARKETS After nearly two decades of momentum, the global spread of wholesale power market restructuring stalled in the early 2000s, in part due to the Enron scandals in the United States and also in part due to mixed results of restructuring, especially in developing economies. Gratwick and Eberhard (2008) discuss the ‘demise’ of the standard model and suggest that many developing countries are now in a ‘hybrid’ power market condition, with elements from both the old and new industries co-existing. In these settings, power market regulation is still a highly contested, political process, and as a consequence, the sector is plagued by low investment leading to chronically insufficient generation capacity, costs out of balance with revenues, and unreliable (or absent) power. Since the writing of that report in 2008, a new landscape of technological and business model innovation has emerged. In “Seeing the Forest for the Trees,” Sen and Jamasb (2013) suggest that this is an opening for clean energy. Similarly, IFC (2012) sees various emerging models such as ‘mini-utilities’ in dense, underserved urban areas. Despite this optimism, the caution of Gratwick and Eberhard still seems relevant, namely that “private producers perceive that they are competing in an unfair game where the incumbent state-owned utility always has the upper hand.” Various EREP countries continue to face investor wariness with regard to how system flexibility will impact wind and solar project revenue (for example, with regard to China, see Ma 2011 and Kahrl and Williams 2013). Uniquely, the Mexican Energy Reform of 2014 appears to be significantly altering investor attitudes toward clean energy. For many fast-growing settings with abundant RE resources, Mexico may provide a model, in effect updating the ‘standard model’ of power market reform with a renewed focus on incentivizing private clean energy development. Additionally, the creation of an independent system operator in Mexico serves both its historical purpose (i.e., allowing open access to the transmission network to encourage generation competition) as well as a newer purpose that has only become evident in the past 10 years: enabling an entity to put in place best-practice scheduling and operation practices to integrate RE at least-cost. These new trends are further discussed in the “Restructuring 2.0” pathway.
8
This report is available at no cost from the National Renewable Energy Laboratory (NREL) at www.nrel.gov/publications.
driven by a need to respond to legacy challenges, will add a layer of complexity to power systems of the future.
Revenue and Investment Challenges 2.10Finally, the evolution toward power systems of the future is being shaped by finance and investment. Typically, this pressure is felt by existing power sector stakeholders across the value chain: supply, transmission, delivery, and demand. Specifically, at high RE penetration, supply-related revenue challenges can emerge—at the bulk-power/wholesale level—as abundant wind and solar energy enters the market at essentially zero marginal cost, and reduces utilization of existing conventional thermal (coal, gas, and nuclear) generators.2 This scenario is now occurring in various countries in Western Europe (Citi 2013), as well as in the MISO system in the U.S (MISO 2014) and the southern states of India (e.g., Tamil Nadu and Karnataka) (CEA-GOI 2013). For example, in December of 2014 the German utility E.On—one of the largest utilities in the world—announced it would spin off its thermal coal and nuclear units into a separate company in light of declining thermal revenues. In parts of China, similar dynamics would be observed, but the firm commitments to a minimum annual allotment of run-time for coal plants instead causes wind curtailment instead of coal capacity factor reductions. Overall, socializing the cost of existing infrastructure is an increasing challenge as disruptive technologies permeate markets.
At the level of customer retail, both distributed photovoltaic (PV) and energy efficiency (either static or dynamic) reduce retail electricity consumption, raising revenue concerns for some electric utilities and impacting perceptions of investment risk and creditworthiness. This scenario is occurring in Germany, Spain, Italy, and various U.S. states, such as California, Arizona, and Colorado.
2 For an overview of measures available to address such shifts in market dynamics, see e.g., Hogan (2013).
9
This report is available at no cost from the National Renewable Energy Laboratory (NREL) at www.nrel.gov/publications.
Delivery of energy—network expansion typically financed by utility revenues—is also facing similar pressure. As falling revenues squeeze typical investors, the need for additional network investment at both the distribution and transmission levels is rising (Hogan 2013).
Summary: Understanding the Costs and Risks of Inaction 2.11Many trends are anticipated to persist. For instance, the cost of distributed energy resources (DERs) will likely continue to decline, and greater use of data will lower customer acquisition costs for DER solutions. The question for this trend, therefore, is not if DER will deploy at a greater scale, but rather how much will deploy, how soon, and at what cost (including the cost of stranded assets).
Whether the 10 trends outlined above are ‘headwinds’ or ‘tailwinds’ will depend on the orientation set by decision makers for their power systems. Inaction may result in power system drift and missed opportunities. If stakeholders attempt with limited success to keep current business models viable, various undesirable outcomes could result. Utilities could face disincentives to procure smart grid or energy efficient products. The power sector could become marked by insufficient investment, stranded capital assets, fuel vulnerability, and infrastructure lock-in. And the distribution of the customer base could also become more distorted, with high credit customers increasingly defecting and low-credit customers facing increasingly high rates.
All of these potential costs and risks reinforce the need for deliberate and proactive collaboration to encourage desired futures. The next section reviews emerging models to position power sectors for success and to harness the momentum of the trends outlined above.
TEXT BOX 2: “The Revenue Challenge of Dispatch Reform” “Getting the prices right” is a critical component of efficient power system operation. Dispatching power plants based on their marginal cost to generate allows for greater flexibility and lower net costs to the consumer. Yet regulators do not have perfect information about what it costs generators to produce electricity. This asymmetry results in a situation in which getting the prices right for dispatch is not straightforward. In fact various systems of regulatory economics formalize the opacity of utility pricing as one of the central challenges of regulators (see e.g., Estache and Wren-Lewis 2009). Despite the difficulties in increasing price discovery, improving economically (and environmentally) efficient dispatch represents low-hanging fruit to allow for future power systems to emerge. Nonetheless, the institutional challenges remain significant in many settings. For example in China, energy efficient dispatch has been piloted in several provinces (Gao and Li 2010; RAP 2013), although it has been slow to expand. In part this is due to the vested interests of conventional plants in China, but the question of dispatch reform is commonly contested around the world. In most power systems, running centralized power plants provides the main mechanism for utility revenue. In all contexts with declining capacity utilization of conventional thermal units due to low or zero marginal cost wind and solar energy, there is pressure to ‘decouple’ dispatch from fixed cost recovery in order to ensure adequate cost recovery for necessary generation capacity(Kahrl & Williams 2013). At the same time, price signals will ideally also incentivize the most efficient and flexible capacity, requiring innovative mechanisms to promote flexibility while allowing generators to recover their fixed costs. RAP (2013) suggests a two-part (energy + capacity) pricing structure.
10
This report is available at no cost from the National Renewable Energy Laboratory (NREL) at www.nrel.gov/publications.
3 A Framework for Decision Making This section summarizes a decision making framework and explores emerging examples of 21st century power system designs. Utilizing a framework for strategic change (Figure 3)3, proposed and emerging changes in power sectors can be aligned in regard to the extent and speed of desired change. Further, because changes to the power system are path-dependent, a full understanding of likely pathways requires an examination of how power system legacies—technological, financial, and institutional—shape the landscape of options. Broadly speaking, heavier legacies will promote cautious gradualism, while lighter legacies can enable more rapid change.
Figure 3. Types of Strategic Change
Typically, power systems are in the “Adaptation” mode, accommodating incremental changes in demand growth, technology change, and consumer preference. The forces outlined in Section 2 have the potential to increase the extent and the speed of change, moving power systems into new territory. “Evolution” implies fundamental changes to power system technologies and actors, albeit over a relatively long period of time and through sustained incremental change. “Reconstruction” implies rapid change, but without fundamental changes in power system actors or technologies. For example, introductions of new institutional structures, such as competitive wholesale power markets, with limited change in the generation fleet, tariff structure, or customer interactions. “Revolution” implies rapid fundamental changes across power systems and might incorporate full competitive markets, services, and real-time rates.
3 Adapted from Hope Hailey and Balogun 2002.
11
This report is available at no cost from the National Renewable Energy Laboratory (NREL) at www.nrel.gov/publications.
How, and at what speed, will power system transformation unfold? The options can be conceived of as a range of pathways in the landscape of Figure 3, from adaptation (slow but not fundamental), reconstruction (fast but not fundamental), evolution (fundamental and slow), to revolution (fundamental and fast).
Adaptation 3.1In light of the trends outlined in Section 2 and the financial considerations outlined in Section 4, the ‘Adaptation’ quadrant of power system evolution represents a continuation of slight, incremental change. Examples in this mode are described in the “Fight” and “Flight” models described by Bloomberg New Energy Finance (BNEF 2014) and in the top-down grid expansion pathway enumerated by various observers (e.g., IFC 2012).
“Fight” or “Flight” Especially with regard to distributed PV, some utilities choose to adapt either through ‘fight’ or ‘flight.’ Fight—in this sense—indicates a use of utility resources to pursue legislation or regulation that makes distributed PV less attractive (BNEF 2014). The ‘flight’ approach is more passive and signals that distributed PV is lower on the utility agenda. Utilities in this mode can opt to spend little or no resources on the issue (BNEF 2014). Both fight and flight are common strategies when the forces encouraging distributed energy resources are relatively weak.
Top-Down Grid Expansion In areas with limited energy access, top-down grid expansion is an example of the Adaptation mode, representing a business-as-usual path of power system change. Extending existing grid infrastructure to new customers requires additional capital investments in generation and distribution networks. The trends outlined in Section 2 impacting the top-down grid expansion pathway offer new opportunities for procuring generation (e.g., renewable energy) and for metering customers in a way that help to reduce both technical and non-technical losses. Together these trends can improve the financial state of the utility, but do not represent a fundamental transformation of the power system. For further discussion of this model, see IFC 2012.
Reconstruction 3.2The Reconstruction quadrant represents a relatively short period of change (3-5 years) that reorganizes the major functions and roles of power system players. Reconstructive change is not fundamental in the sense that, while roles change significantly, the conventional categories of generation, transmission, and distribution still apply. In other words, the fundamental structure of the power sector does not change deeply. Reconstruction in the 21st century tends to include a greater emphasis on clean energy, smarter grids, and energy efficiency, as provided through a mix of administrative and competitive processes.
Mexico Energy Reform The key international example of reconstruction is the current Mexico Energy Reform. The Mexico Energy Reform aims to significantly change the investment profile of the Mexican energy sector, opening up generation to greater competition, enhancing the authority of the independent regulatory authority (CRE), and establishing an independent system operator (CENACE). Bearing much in common with ‘conventional’ power sector restructuring of the past
12
This report is available at no cost from the National Renewable Energy Laboratory (NREL) at www.nrel.gov/publications.
three decades, the Energy Reform also includes novel design and policy features to spur investment in wind, geothermal, biomass, and solar energy sources, and to enable the cost-effective integration of wind and solar power into the grid. Further details of this transformation are discussed in Section 5.2 below and in SENER (2014).
Evolution 3.3The Evolutionary quadrant represents a more dramatic power system change, carried out over a relatively longer period of time (10-20 years). Compared to the Reconstruction quadrant, the literature and examples emerging in this quadrant imply more fundamental changes to supply, delivery, and demand. Demand-side participation from all consumer classes is anticipated to grow dramatically, implying crucial roles for coordination of distributed generation, various types of energy storage, electric vehicle charging, and demand response. With regard to energy delivery, the Evolutionary pathway implies a greater degree of coordination at the distribution network level, as well as new types of interaction between distribution and transmission networks. With regard to energy supply, the flow of investment is likely to change significantly from centralized generation sources to a more balanced mix of centralized and distributed generation. There will remain some important roles for monopoly utilities, to the extent these incumbents can bring to market enough innovation to satisfy demand, or present the lowest risk pathway forward. In many cases, the “evolution” pathway is a move toward more comprehensive power system optimization, leveraging the suite of new technologies that have become available in the 21st century. Key literature and real-world examples of this evolutionary path are discussed below.
RIIO The UK’s RIIO model is an example of broad-scale performance-based incentive regulation with revenue cap regulation. RIIO is an acronym for “Revenue set to deliver strong Incentives, Innovation and Outputs.” In keeping with the name, RIIO focuses on how to pay for what society wants over a sufficiently long time horizon, rather than focusing on whether society paid the correct amount for what it got in the past, as is customary with current regulatory frameworks (Lehr 2013). The other key feature of RIIO is an extended term for rate-making (8 years). This term is partially designed to support revenue certainty while also driving the system toward a significant transformation of services, roles, and responsibilities (Aggarwal and Burgess 2014).
“EPRI: The Integrated Grid” The Integrated Grid concept, articulated by EPRI (2014), describes a significant power system evolution, driven by technological and economic changes, and resulting in the need for new regulatory models. Among the various technical and economic challenges outlined in the report, one of the key challenges is the question of tariff change as DERs are deployed. Noting that the costs for capacity, reliability, and ability to transact energy are not accurately accounted for in current systems, the possibility arises that non-DER participants would disproportionately bear those costs. The report thus envisions changes to the role of the grid itself, requiring fundamental changes in operating approaches, financial accounting of operating expenditures and investment flows to both transmission and distribution networks. These changes are detailed in EPRI 2014.
13
This report is available at no cost from the National Renewable Energy Laboratory (NREL) at www.nrel.gov/publications.
“Reforming the Energy Vision” Laying out a cohesive, high-level vision for the transformation of the New York electric sector, the state Department of Public Service describes an incremental pathway toward power sector modernization in its “Reforming the Energy Vision” (REV) staff proposal (NY-DPS 2014). This vision seeks to establish retail power markets and seamless technical and financial integration of distributed energy resources through more intelligent grid systems and evolutionary shifts in regulation. Roles and responsibilities of various stakeholders are specified, including the proposal of the utility as a “distributed system platform provider,” responsible for creating the markets and operational systems necessary to facilitate envisioned consumer participation. The staff propose a series of regulatory reforms, and raise key questions for further exploration spanning technical (e.g., planning, codes and standards), regulatory (e.g., cost allocation, vertical market power restrictions, data privacy concerns), and market design (e.g., resource valuation methodologies, distributed and wholesale market interactions) topics.
“CSIRO: Rise of the Prosumer” In sketching out what the Australian power system might look like in 2050, the Commonwealth Scientific and Industrial Research Organization (CSIRO) worked with more than 200 stakeholders to define plausible scenarios for power system evolution. The resulting scenarios included the “Rise of the Prosumer,” in which a dramatic change occurs in the way households and business interacts with the grid. Adoption of on-site generation and electric vehicles reaches high levels, and by 2050 distributed generation supplies almost half of national consumption. In this scenario the fundamental drivers of power system investment shift to distributed resources and the coordination schemes that support their reliable implementation (CSIRO 2013).
IFC: Fragmented Services Especially in areas with limited energy access, accelerating energy access through a fundamental evolution of service provision is the subject of increasing attention. In very low income contexts, energy market ecosystems are typically fragmented, and the challenges of scale-up are acute. Energy service providers, such as for cooking fuels, device charging, and stand-alone integrated systems, are small and relatively dispersed (IFC 2012). Access to capital is limited, and supply chains are delicate. The historical pattern of ‘adaptation’ has led to slow growth in energy access. Alternatively, the ‘fragmented services’ model of evolution aims to accelerate and scale-up energy access provision through increased reliance on small-scale energy service providers. IFC (2012) suggests that this may be accomplished in part by putting those providers on more stable financial footing and empowering them with more robust business models and newer, more cost-effective technology.
Revolution 3.4The Revolutionary quadrant represents power system transformation that is both fundamental and sudden. Drivers of such a change could be, for example, the sudden onset of large-scale grid-defection—with dramatic cost improvements in distributed generation and storage rapidly eroding the cost advantage of centralized grids. Some reports attempt to evaluate the economics of this possibility, for example in mature markets, “The Economics of Grid Defection” (RMI
14
This report is available at no cost from the National Renewable Energy Laboratory (NREL) at www.nrel.gov/publications.
2014)4, and in markets with limited energy access, “Community Energy” as articulated in “From Gap to Opportunity” (IFC 2012). Further details of these revolutionary scenarios are contained in those reports, but as the likely onset of such rapid transformations occurs past the 2030 timeframe, they will not be the focus of this report.
Summary 3.5
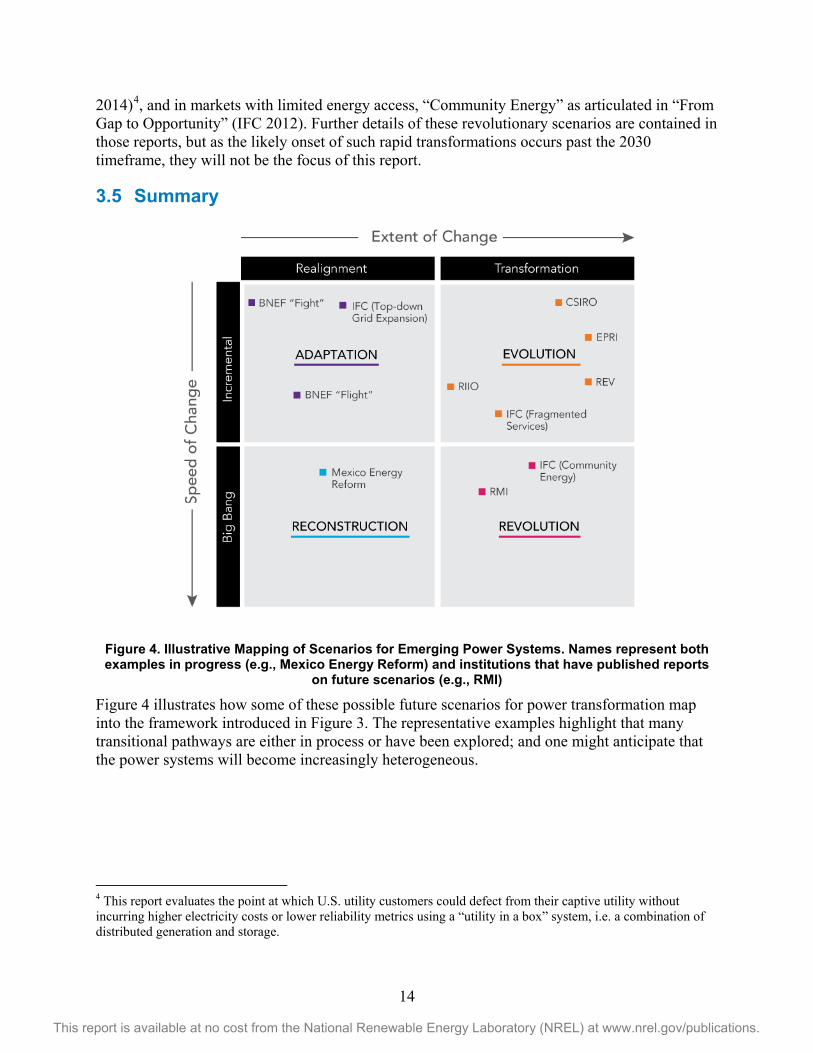
Figure 4. Illustrative Mapping of Scenarios for Emerging Power Systems. Names represent both examples in progress (e.g., Mexico Energy Reform) and institutions that have published reports
on future scenarios (e.g., RMI)
Figure 4 illustrates how some of these possible future scenarios for power transformation map into the framework introduced in Figure 3. The representative examples highlight that many transitional pathways are either in process or have been explored; and one might anticipate that the power systems will become increasingly heterogeneous.
4 This report evaluates the point at which U.S. utility customers could defect from their captive utility without incurring higher electricity costs or lower reliability metrics using a “utility in a box” system, i.e. a combination of distributed generation and storage.
15
This report is available at no cost from the National Renewable Energy Laboratory (NREL) at www.nrel.gov/publications.
4 In Focus: Power Sector Finance The trends discussed in Section 2 are helping to push power systems out of the status quo, but these trends alone do not give a coherent picture of power systems of the future. Power sector finance will influence real options and shape trajectories. An estimated $19.3 trillion of investments in electricity supply infrastructure are needed over the next 20 years in order to meet projected demand and stated environmental objectives (IEA 2014). Investment trends will evolve differently across local and regional contexts but there are common factors that underpin the power sector value proposition. This section discusses nine key variables that will influence investment trends in the power sector.
• Regulations on Commercial Banking Risk • Risk Premium Environments for Investments • Interest Rates on Government Bonds • Tax Structures • Credit Ratings of Electric Utilities • Capital Availability from Development Authorities • Price and Availability of Inputs • Market Structure and Valuation Constructs • Policy and Regulatory Environment
Regulations on Commercial Banking Risk: Commercial and wholesale banks, through syndicated loans, have contributed 71-77% of infrastructure project finance globally over the past five years (Ehlers et al. 2014). If increasingly stringent capital requirements come into effect (e.g., Basel III5), banks’ appetite for providing capital for long-term illiquid infrastructure projects may continue to decline. This might result in a gap in power sector financing. This gap could be met by investors such as international banks, or insurance companies and pension funds, who may pursue yield or seek to optimize returns on asset investments by matching asset duration with their liabilities. Additionally, new capital requirements may result in banks looking to off-load legacy infrastructure debt, similarly increasing competition for capital to fund new infrastructure. Concerns around balance sheet exposure will enable the investors that remain to negotiate higher financing terms. Risk Premium Environment for Investments: Investors provide capital at a cost that reflects the perceived risk and expected return relative to available ‘risk-free’ investments. Expected rates of return and perceived risks are sensitive both to specific factors (e.g., technology maturity) as well as to local and global economic conditions (e.g., interest rate environment, economic cycle, equity market pricing). As the financial and investment community’s perception of risk fluctuates, investors demand different return profiles to compensate them for these risks. This behavior alters the demand for different investment vehicles and leads to changes in the mix of investors for new infrastructure. As an example, if utility credit ratings were to fall, large institutional investors such as insurance companies, who must adhere to regulations regarding concentration in lower-rated securities, may be limited in their ability to purchase utility bonds. 5 Basel III is a set of voluntary regulatory standards on bank capital adequacy, stress testing and market liquidity risk. For a brief overview of Basel III and its potential implications, see KPMG (2011).
16
This report is available at no cost from the National Renewable Energy Laboratory (NREL) at www.nrel.gov/publications.
Conversely, in this same scenario, higher yields on utility bonds may attract capital from risk-seeking vehicles with higher risk and return thresholds, such as high-yield mutual funds or hedge funds.
While there has been much recent dialogue around uncertainty in utility credit worthiness (see e.g., Kind et al. 2013, Barclays 2014), some project types, such as renewable energy generation facilities, may begin to experience declines in risk premiums. As investors become more comfortable with the asset class and the investible market deepens, renewable energy investments may have less perceived risk and become more open to investment.
Interest Rates on Government Bonds: Interest rates on many government bonds, such as U.S. Treasuries, are often considered the “risk-free” rate. Many fixed income assets, including infrastructure debt and project financing, are priced at a spread over these rates. Hence, if spreads remain unchanged, nominal interest rates will change in concert with fluctuations in rates on government bonds. Certain investor types are heavily weighted in fixed income assets, often because the ability to meet fixed payments is a large component of their investment objective (e.g., insurance companies, pension funds). For these investors, when rates are high, maintaining large holdings in safe government or similarly highly-rated securities may prove sufficient. However, as in today’s historically low yield environment, investors may look toward spread assets, such as infrastructure debt and project finance, and to new structures to maximize the income potential of their portfolios. Structures dedicated to providing investors with long steady streams of income, such as yield companies (YieldCos), have thus become attractive in the United States market. Similar to master limited partnerships (MLPs) and real estate investment trusts (REITs), YieldCos provide predictable cash flows while hypothetically reducing cost of capital.6
Conversely, if interest rates were to increase, there may be less incentive for investors to hold riskier spread-assets, as government bonds might offer a more attractive balance of risk and return. Higher interest rates also make current fixed payment structures less attractive relative to new ones that can be issued at the higher interest rates. Importantly, because investors are forward-looking and understand the impact of interest rates on their current investment holdings, interest rate expectations are a key variable influencing investment trends as well.
Capital Availability from Development Authorities: The availability of government supported-financing may be a key variable in many regions, particularly those without established capital markets. This might occur via direct low-interest financing or loan guarantees from domestic or regional development banks. Alternatively, international development agencies may also provide financing. The availability and terms of such funds will drive how quickly these markets are able to develop infrastructure. Similarly, natural resource-rich countries may be able to leverage these assets to secure financing and/or development guarantees from resource-importing countries. Local political environments and associated perceptions of risk will ultimately influence the ability to secure financing.
66 For more information on YieldCos, see: https://financere.nrel.gov/finance/content/deeper-look-yieldco-structuring
This report is available at no cost from the National Renewable Energy Laboratory (NREL) at www.nrel.gov/publications.
Tax Structures: The evolving types of tax structures available in various jurisdictions for power sector infrastructure investments could be a key variable influencing investment trends. As globalization of financial systems and operations increases, countries may compete for capital using tax regimes. Using the United States as an illustrative example, MLPs and REITs currently enjoy tax benefits not afforded to RE generation and other power sector assets. If the tax code were to be modified to allow RE generation assets to qualify for the same treatment as oil and natural gas production within the MLP structure, this may result in attracting more retail and institutional investors to the power sector. YieldCos, essentially MLPs without the tax benefit, would likely become extinct as an investment vehicle. Similarly, if the tax code for REITs is clarified regarding the eligibility of transmission and distribution systems, there would likely be an emergence of delivery-infrastructure-focused REITs.
Credit Rating of Electric Utilities: Utilities have historically enjoyed relatively high credit ratings and thus access to inexpensive capital, because revenues were seen as stable. Future revenue streams are contingent on regulatory structures and other variables and will determine whether this access to inexpensive capital will persist. The cost of capital for utilities seems set to face consistent upward pressure, as new entrants will likely target high-income customers. If creditworthiness deteriorates, investors will demand higher risk premiums, leading to changes in investor types and the potential for different investment vehicles to feature more prominently. Additionally, increasing cost of capital (as induced by decreased creditworthiness or higher interest rates) might have a negative effect on renewable energy deployment. These factors could potentially lead to calls for regulatory responses to compensate utilities for their obligation to serve, and the need to meet local renewable energy targets. See the example in ‘Risk Premium Environment for Investments’ above for an example of how investment profiles could evolve. In order to limit the ultimate burden on ratepayers, regulators might employ novel ratemaking mechanisms (e.g., revenue decoupling) to shift costs and reallocate risk, or seek to encourage alternative and less expensive sources of capital if utility ratings are downgraded. Depending on the context, more emphasis may be placed on alternative financing mechanisms, such as project finance securities or public-private partnerships.
Price and Availability of Inputs: The evolution of both price and availability of fossil fuels will continue to impact investment in the generation sector. The global dissemination of shale gas recovery equipment and associated technology innovation, in combination with jurisdiction-specific environmental regulations, will be key variables influencing the extent of investments in natural gas generation.7 The price and availability of various renewable technologies depend on local and global supply chains, and will also be a key variable affecting investment trends in the power sector.
Market Structure and Valuation Constructs: Revenue sufficiency in the power sector is a function of how the market values various products, such as energy, capacity, and ancillary services. Investment trends are thus impacted by how the electric sector is organized (i.e. vertically integrated versus restructured settings), which has implications for cost recovery, investment risk susceptibility, and available investment opportunities. They are also impacted by
7 Local regulations are not by themselves the driving variable on natural gas utilization in the power sector. The market for liquefied natural gas will also be shaped by the global demand, and the profile of shale gas development.
18
This report is available at no cost from the National Renewable Energy Laboratory (NREL) at www.nrel.gov/publications.
what product attributes the market values. Such attributes might include flexibility, availability during contingency events, environmental externalities (or lack thereof), fuel price hedging, or portfolio risk impacts. As power sectors re-organize or make shifts in their valuation constructs, investment trends will likely shift as well.
Policy and Regulatory Environment: Policy and regulation serve as key levers toward influencing the previously mentioned variables, and therefore the power sector investment climate generally. Local content requirements, for instance, may impact generation and supply chain investments. Regulatory approaches to DERs will impact utility creditworthiness and the health of installer and/or 3rd party leasing markets. Tax structures will influence the structure of appropriate investment vehicles. While there are many tactics for influencing investment climates and achieving a range of desired outcomes, transparency, stability, and accountability of decision-making are critical in the realm of regulation and policy.
19
This report is available at no cost from the National Renewable Energy Laboratory (NREL) at www.nrel.gov/publications.
5 Pathways to Power Systems of the Future This section suggests five illustrative pathways for power systems of the future. There is significant room for natural diversity across jurisdictions, not only in terms of current status but the transformations that might take place. These models are not designed to be prescriptive or comprehensive. Rather, these pathways have already begun to emerge, and each illustrates how proactive steps can be taken to productively harness the “winds of change” to generate positive transformation.
Rather than centering discussion on potential utility business models and associated regulatory frameworks, as has been captured in much of the literature, we discuss proposals for power system ecosystems as a whole, which are complex and dynamic systems comprised of multiple layers, including regulatory and business models. For simplicity, three key characteristics of each pathway are described: design, policy and regulation, and finance.
Design: The underlying technologies and designs of power systems are central to power system transformation. At the same time, these characteristics are also path-dependent on legacy institutions and policy goals, for example the extent of existing power market liberalization is a key variable. Institutional fluency with managing distributed energy resources is another. Future pathways are guided by a desire to reap the potential benefits of technological advancements, and the extent of a particular jurisdiction’s ability to do so. The resulting mix and distribution of benefits realized will be highly context-specific. Spanning most pathways is the potential for a sizable influx of market and consumer data. The extent to which that data is available to and utilized by various market players will heavily influence outcomes, particularly with respect to expanding consumer participation, sector investability, and efficient system operation.
Policy and Regulation: Policy provides guidance—and where necessary, authorization—for the regulatory frameworks which governs these pathways. Technological innovation is for the first time in history making it possible to realize cost-effective, reliable, and clean power systems. Seeking to realize this future, regulation can seek to incorporate technological innovation, as well as competition to promote such innovation. The extent to which regulation is structured to decrease barriers to market entry, or avoids the selection of “winning” technologies and products, is a key variable influencing outcomes. Policies will likely also provide guidance on what levels of vertical market power are acceptable throughout various stages of transformation, and inform the regulator on the balancing act of privacy concerns versus open-access to data. Policies can also provide support for public-private partnership research, development, demonstration, and deployment activities, in order to encourage financing for high-risk, high-reward technology research.
Finance: The investability of the power sector, as well as the health and composition of participating investor classes, will influence the rate and extent of power system transformation. Investability hinges on policy, regulatory, and political stability, the financial health of natural monopolies in the sector, and robust capital markets. The profile of participating investor classes is influenced by many variables, including the yield environment, permissible investment vehicles (often based on local tax structures), and available government and development agency support schema.
20
This report is available at no cost from the National Renewable Energy Laboratory (NREL) at www.nrel.gov/publications.
In the subsequent sections, pathways toward power systems of the future are discussed. Figure 5 places these five pathways in the framework of extent and speed of change, as introduced in Section 3.
Figure 5. Illustrative Pathways of Power Systems of the Future, Organized by Extent and Speed of Change
The five illustrative pathways reviewed in this section are:
• Next-generation Performance-based Regulation Pathway: In this adaptive pathway, vertically-integrated utilities remain in a recognizable form, but evolve to prioritize delivery of value instead of minimizing costs.
• Clean Restructuring Pathway: In this reconstructive pathway, new power market restructuring efforts are initiated, incorporating lessons learned from the past 20 years, including design features to facilitate clean energy integration and system optimization. Hindsight is 20/20—this reconstructive pathway brings hindsight to bear on restructuring and reform.
• Unleashing the DSO Pathway: Distribution system operators (DSOs) are poised to innovate in order to drive clean generation deployment and power system flexibility. In this evolutionary pathway, regulatory and policy frameworks give clear signals to these DSOs, empowering them as the centerpiece for orchestrating distributed energy resources and low-voltage market functioning.
21
This report is available at no cost from the National Renewable Energy Laboratory (NREL) at www.nrel.gov/publications.
• Bottom-of-the-Pyramid (BOP) Coordination Pathways: Accelerating energy access has been a chronic challenge for decades. New technology configurations and business models are opening up opportunities for innovative approaches to energy access, especially when linked to broader social development goals. In this context, two pathways emerge:
o Adaptive Bottom-up Coordinated Grid Expansion
o Evolutionary Bundled Community Energy Planning strategies, leading to integrated, socially-customized energy access solutions.
Figure 6 organizes each pathway by its starting point, each of which represents typical types of existing power sector environments: vertical integration, restructured markets, and low energy access environments.
Figure 6. Applicability of Pathways based on Present Status of Power Sector Organization
These illustrative starting points are depicted next to 'adjacent pathways' that represent potential trajectories for power system transformation. For example, vertically integrated power systems can be guided toward Next Generation Performance-based Regulation, or toward Clean Restructuring. Similarly, in markets where restructuring has already taken place, the "Unleashing the DSO" pathway may be of interest. This is not to suggest however that the adjacent pathways are the only options, or that they are mutually exclusive. Combinations of different pathways will likely arise. For example, decision makers could conceivably pursue power system change of a more transformative nature, for example
22
This report is available at no cost from the National Renewable Energy Laboratory (NREL) at www.nrel.gov/publications.
combining "Clean Restructuring" elements with a strong focus on smarter distribution grids, as described in the "Unleashing the DSO" pathway. While power system evolution is 'path dependent,' often limiting the scope of feasible change, the pace of technological change is opening up new opportunities for such innovative policy design.
Next-generation Performance-based Regulation Pathway 5.1In this pathway, vertically-integrated utilities retain their principal role in the power system, but the regulatory framework that governs them shifts towards rewarding revenue based on performance, rather than compensating utilities for incurred costs. In doing so, the monopoly of the electric utility and its associated structures are not only preserved, but expanded.8 The postulated utility death spiral9 is mitigated by incremental regulatory adaptions toward output-based incentives and ratemaking practices; as a result, the vertically-integrated utility is increasingly motivated to incorporate the very technologies that once threatened its existence. However, the utility is more actively competing with customer grid defection—a future that is increasingly feasible as technology continues to evolve. In response to this threat, the utility strives to offer a suite of transactive energy management services10, as well as cost-competitive tariffs and high levels of customer service.
Despite the preservation of system’s institutional structure, technology companies, particularly those in active grid management or data analytics, must inevitably be cleared by the utility; this may serve as a barrier to market entry. As a result, the utility in this pathway may slow the pace of innovations, or may be more likely to expose ratepayers to its missteps as it attempts to keep up with innovation. However, for many jurisdictions, this incremental transformation may appear to be the lowest risk opportunity for harnessing the potential of power sector technology innovations.
This pathway represents an adaptive shift, rooted in cautious incrementalism: a controlled progression towards power sector modernization, in this case in a vertically-integrated utility paradigm.
5.1.1 Design While the utility still has an incentive to build its rate base through new capital projects, the nature of investments has shifted significantly from bulk power production and delivery to investments that promote smart and resilient grids, centralized management of distributed energy resources (DERs),11 and price-responsive consumers. The utility can offer home energy management services, technical management and coordination of customer DERs, and a suite of engineering design services, including the procurement of islandable microgrid systems for neighborhoods, buildings, and campuses to increase grid resiliency. The market for independent
8 Investor-owned, local municipal, parastatal, and state-owned power utilities experiencing low to intermediate levels of wholesale market liberalization are potential candidates for this pathway. 9 See e.g., Kind 2013. 10 Services provided by the utility which, based on information from 2-way communication, manage consumer energy production and consumption (e.g., home energy management for demand response participation). 11 Here, we define DERs as energy efficiency, distributed generation, demand response, storage, and microgrids.
23
This report is available at no cost from the National Renewable Energy Laboratory (NREL) at www.nrel.gov/publications.
power producer (IPP) projects may transition into the medium- and low-voltage space, as third-party owned generators navigate the transactive, distribution-level utility-run market.
In combination with enabling policies and regulations (see 5.1.2), a key driver of this transformation is competition from the off-grid markets and resulting utility efforts to retain customers. These efforts manifest in the form of cost-competitive tariffs, reliable grid services, a financially attractive framework for energy-producing and demand-responsive consumers, and excellent customer service. The utility may also have partnerships with energy service companies, solar installers and leasers, original equipment manufacturers, and energy technology and data management companies to offer a suite of services. These partnerships might take the form of competitively bid multi-year agreements, where the utility offers access to its captive consumer base (including a range of consumer data) to those companies it assesses are most able to help the utility accomplish its performance goals.
5.1.2 Policy and Regulation Policies designed to realize the Next-generation Performance-based Regulation Pathway focus on the facilitation of incremental changes to operations and commercial organization. Through piecemeal changes in regulation, legacy structures can be modernized to strengthen (and in some cases, restore) the market power of the legacy utility. Such piecemeal changes may include revenue decoupling in response to energy efficiency and distributed generation programs, time-of-use rates, shareholder incentives based on customer service assessments, demand response programs for various customer classes, or creation of fixed network and backup charges for customers who own DERs. A key regulatory objective is to ensure affordability of utility service for ratepayers despite ongoing investments towards a variety of structural and organizational changes; those utilities that are state-owned may be able to receive equity injections from central governments to minimize rate impacts.
As transitions progress, regulation and supporting policy increasingly decouple the utility’s profits from costs, instead linking profit to a series of well-defined, quantifiable performance metrics, including: customer satisfaction, reliability and availability, compliance with environmental objectives, realization of energy savings targets, ease of interconnection and incorporation of DERs, and incorporation of innovative informatics and data analytics techniques. Longer performance periods with intermediate assessments will provide impetus for the utility to engage in longer term planning. While historic regulation assesses if prices are just and reasonable for the services received, this new paradigm of regulation ties utility profits to the outcomes desired by society as expressed through policy priorities.
Regulation also aims to mitigate market power for the utility as it enters strategic partnerships with private companies. This may become an increasingly important duty as regulators and policymakers wish to limit anti-competitive behavior that could impede innovation and power sector modernization. They may also be required to periodically issue data privacy standards that balance consumer privacy concerns, the need for innovative data analytics from private companies, and concerns about utility vertical market power (likely the sole possessor of detailed market data).
24
This report is available at no cost from the National Renewable Energy Laboratory (NREL) at www.nrel.gov/publications.
5.1.3 Finance As piecemeal regulatory decisions drive the transition of the power sector, utility debt and equity investors will keenly observe the revenue impacts of new regulatory frameworks. If regulatory actions are viewed as mitigating forgone revenue, lack of fixed cost recovery, or other “death spiral” related outcomes, new regulation may be viewed positively by debt investors, thus helping to stabilize or reduce utilities’ borrowing costs. If regulatory actions are perceived to call into question the repeatability and confidence of utilities’ cash flow, borrowing costs may rise; in this case, central governments may intervene to back bonds or directly fill financing gaps.
Equity investors, traditionally more concerned with earnings potential and growth, will closely follow how regulation impacts factors such as financial opportunities in the power sector, competitive dynamics, utilities’ ability to preserve margins, and future growth. The nature of relationships between utilities and regulators will influence equity investors’ perceptions of risk and return heavily. Some public market investors, focused on receiving stable income, may seek opportunities to invest in utilities in regulatory regimes with predictable and transparent revenue streams and longer performance periods. Other equity investors, more interested in growth potential, particularly those in the private markets, may seek more opportunities to invest in innovation and growth through project- and infrastructure-related joint ventures with utility, energy technology, or services companies.
Clean Restructuring Pathway 5.2Twenty years of global experience with wholesale power market restructuring has generated a wealth of lessons learned. Namely, regulators have adapted approaches and market designs to better incentivize and integrate clean energy investments. The ‘Clean Restructuring’ pathway represents an update to previous power system restructuring, improving long-standing objectives like reduced electric rates and a diverse generation portfolio, but also including novel elements designed to incorporate clean energy technologies and reduce environmental impact. Clean Restructuring also presents an opportunity to create forward-looking wholesale market frameworks that might eventually incorporate dynamic and participatory distribution systems (see Section 5.3).
This pathway is ‘big bang’ in that it relatively quickly reshuffles roles, responsibilities, and investment flows, but is also more of a realignment than a transformation in that it leaves in place the well-known actors such as independent system operators, independent power producers, and distribution utilities. Thus this pathway represents a reconstructive shift from the regulated vertically-integrated utility paradigm. The Mexico Energy Reform is one incarnation of the Clean Restructuring pathway. Recent energy market reforms proposed in South Africa and pilot projects in China (Gao and Li 2010) are also variations on this pathway, as are nascent moves toward an ‘energy imbalance market’ in the western United States (WIEB 2013).
5.2.1 Design Key elements of Clean Restructuring include many familiar elements of traditional restructuring, such as:
• Open access to transmission and efficient interconnection processes • Appropriate screening criteria for prospective independent power producers
25
This report is available at no cost from the National Renewable Energy Laboratory (NREL) at www.nrel.gov/publications.
• Independent planning and dispatch • A competitive wholesale market
In addition, some new complementary elements include:
• Clean energy incentives and trading schemes • Forecasting and dispatch optimized for clean energy integration • Platforms for demand-side participation
Together these design elements can help to attract new investment to modernize the generation fleet and support achievement of renewable energy policy targets. Investment risk declines as the level of transparency grows in planning, markets, and system operation. For example, transmission planning managed by an independent system operator can include transparent stakeholder processes for evaluation of new projects. Additionally, open access to transmission networks, integrated forecasting, and clear rules for wholesale market operation will reduce the risk of renewable energy curtailment. Finally, development of, and demand-side participation in energy, capacity, and ancillary service markets can induce investment in more reliable and flexible demand, lowering overall investments in inflexible generation sources.12 Some of these design elements are illustrated in Figure 7, which illustrates market restructuring in Mexico.
Figure 7. "Before" and "After" Authorities for Five Key Power Sector Actors in Mexico
Source: CRE 2014
12 For more information on wholesale market evolution, see Cochran et al. (2013).
26
This report is available at no cost from the National Renewable Energy Laboratory (NREL) at www.nrel.gov/publications.
5.2.2 Policy and Regulation Similar to design elements above, policy and regulation for Clean Restructuring are largely familiar, with some new elements to enable greater power system transformation. Familiar elements include:
• Policy establishing an independent regulatory authority and independent system operator, and granting authority to those entities sufficient to execute their duties.
• Regulations to clarify the rules for competitive wholesale market, system operation, tariffs, and for auctions and contracts for, inter alia, power purchases and transmission and distribution operation.
• Regulatory frameworks to incentivize line-loss reduction and efficient interconnection.
Additional complementary elements include:
• Policies establishing the scope of, and mechanisms for achieving, targets in energy efficiency, renewable energy, and smart grid investment.
• Regulatory frameworks to incentivize flexible dispatch, adequate capacity margins under high penetrations of renewable energy (or minimum flexibility requirements imposed on all capacity qualifying for market participation), and demand-side participation in energy, capacity, and ancillary services provision (see for example Cochran et al. 2013).
As with earlier incarnations of power system restructuring, the combination of independent authority, transparent rules, and clear incentives for investment form the foundational elements of this pathway. The additional elements for reducing environmental impact (e.g., policies to encourage investment in RE and energy efficiency; incentives to increase operational flexibility) represent the novel policy and regulatory features and mark a shift toward 21st century power systems. 13
5.2.3 Finance The investment environment can be improved under Clean Restructuring, insofar as explicit efforts are made to reduce risk in power system investment. These can be primarily through the three foundational elements mentioned above (independent regulatory and system operation authorities; transparent market rules and planning processes; and clear incentives for investment).Technology risk will be tied to different, independent factors not covered here.
Broadly speaking, Clean Restructuring aims to leverage these elements to achieve an acceleration of investment beyond just generation assets to include a more diverse mix of supply, demand, and delivery assets. For example, simplifying interconnection rules and clarifying forecasting and system operation protocols reduces investor risk across a broad range of variable renewable energy sources. Similarly, explicit policy targets for demand-side efficiency—coupled with market designs that invite demand-side participation in energy and capacity markets—reduce overall risk to investors in those asset types. Finally, transparent planning processes for network expansion—especially those coordinated with RE targets through the creation of “RE
13 For an overview of key regulatory considerations surrounding the deployment of variable renewable energy, see Miller and Cox (2014).
27
This report is available at no cost from the National Renewable Energy Laboratory (NREL) at www.nrel.gov/publications.
zones”—simplify the investment proposition for firms interested in entering transmission and distribution market segments.
Unleashing the DSO Pathway 5.3There is significant latent potential for distribution system operators (DSOs) to contribute to the safe and efficient management of the power grid via increased coordination with transmission market operators (TMOs). With clear regulation and policies that establish roles, responsibilities, technical standards and market frameworks, the DSO and its growing portfolio of distributed energy and flexibility resources might be unleashed for the benefit of all.
In this pathway, DSOs are transformed into distribution-level retail market operators who use dynamic price signals to invite consumers, marketers, and other service providers to participate. These low-voltage markets coordinate with bulk power markets on both a technical and financial basis, with coordination hinging on clearly delineated roles and responsibilities, information and communication technologies (ICTs) that utilize open-access data architecture, as well as a regulatory framework that encourages the incorporation of technological innovations. Consumer data, and access to it, will likely play a significant role in the success of the model. Regulators and policymakers must balance consumer privacy concerns with the need to allow commercial entities to make effective use of energy data. Low-voltage markets, fundamentally oriented toward encouraging innovation, encourage private investment across various investor classes. Consumers can invest private capital in distributed energy resources and energy management hardware. Also, with appropriate regulatory support, investments in bulk power generation, transmission, and distribution infrastructure can remain relatively low-risk, despite the large-scale shift in the underlying regulatory framework.
This pathway represents an evolutionary shift—a gradual yet fundamental change—from a narrow set of utilities, system operators, and IPPs to a thriving ecosystem of diverse market actors. Such changes could be triggered by policy directive or decreasing electric utility credit ratings. A jurisdiction’s transition might begin with piecemeal regulatory actions (e.g., revenue decoupling; performance-based rate incentives; time-of-use rates; distributed generation standby rate formulation; low voltage demand response programs), similar to those adopted in the Next-generation Performance-based Regulation pathway, progressing to a more unified, deliberate vision of power sector transformation with a larger emphasis on facilitation of liberalized retail power markets. While this pathway is, from a technical and regulatory standpoint, significantly more complex than historic transitions, there can be many tangible, broad-based benefits to consumers and society as a whole, namely vis-à-vis systems costs, resiliency, and reliability. Consumer participation is critical for a successful ecosystem, and that participation hinges on demonstrating the value of participation to the customer, as well as on opening up access to data.
5.3.1 Design Institutionally speaking, the key design innovation of this ecosystem is the distribution-level market operator (DMO), a regulated DSO-like entity holding a variety of novel responsibilities. Depending on the context, a DMO could be an independent non-profit entity acting as a market operator and grid manager (analogous to a transmission system operator); a legacy utility acting as a proxy market operator, grid manager, and retail power marketer with vertical market power
28
This report is available at no cost from the National Renewable Energy Laboratory (NREL) at www.nrel.gov/publications.
protections in place; and/or an electric utility providing default service to retail customers who do not wish or are not obligated to participate.14
Figure 8. Core Market Actors and Interactions in Unleashing the DSO Pathway.
Note: figure not intended to be comprehensive. Original equipment manufacturers, investors, technology companies, and others are not depicted.
Serving as a widespread integrator of distributed energy resources (DERs) ranging from storage to distributed generation to electric vehicles, the DMO is tasked with the development, implementation, maintenance, and periodic modernization of an advanced distribution management system (ADMS). The ADMS enables distribution grid operators to mirror actions at the high-voltage level, namely via schedule and dispatch of distributed resources in a manner that maintains reliability at least cost, along with managing the related financial transactions. It also coordinates and manages transactions with the bulk power market.
The DMO maintains an open-access ICT architecture designed to maximize opportunities for coordination and allow all market players—small, large, legacy, startup—to easily access the wealth of data the market will yield to encourage innovation and maximize participation. The
14 Ownership structures (i.e., investor-owned, state-owned, cooperative) of legacy distribution utilities may influence the exact form the DMO takes as this pathway unfolds. For example, non-profit entities may be more willing to unbundle or relinquish control of assets.
29
This report is available at no cost from the National Renewable Energy Laboratory (NREL) at www.nrel.gov/publications.
DMO will also use this architecture to provide measurement and verification that market transactions correspond with actual services delivered, and will utilize market data to inform and promote high-value grid investments, e.g., in congested sites where DER investments may enjoy higher energy prices.
The DMO makes regulator-approved infrastructure upgrades, performs distribution grid maintenance activities, and administrates energy efficiency programs, adhering to a performance-based compensation framework imposed by the regulator. To the extent that the DMO is responsible for default service provision for non-participatory customers, it may be required to procure power from the bulk power market or sign long-term contracts for power. The DMO may also be the utility-proxy for certain electric sector public policies, such as energy efficiency portfolio standards; consequently, it will be empowered to create market signals and investment incentives to achieve compliance.
A key market player in this ecosystem is the distribution-level energy service company (DESCO): a for-profit, customer-based entity that can offer a range of energy services through the competitive distribution market. The services can be retail-oriented (e.g., electricity services provision; selling or leasing photovoltaic systems; providing home energy management services), and wholesale-market-oriented (e.g., using customer-based distributed resources to provide grid services). To the extent that DESCOs are providing energy and ancillary services to DMOs or the transmission market operator (TMO)—the TSO-like entity that coordinates functions with the distribution level—they may require some level of certification to ensure they are technically capable of delivering energy and ancillary services when called upon, similar to legacy centralized energy resources (CERs).
The Unleashing the DSO pathway requires significant institutional coordination spanning various power sector layers and technical standards, including ICT architectures and rules and procedures for a breadth of issues (e.g., payment protocols, digital billing infrastructure, and cyber security standards).
With increased technical and market-based coordination needed between DMOs and TMOs, there can be a range of institutional relationships, market interactions, and business and regulatory models that emerge at their interface. On one extreme, the TMO may control every aspect of the power grid, down to the smart inverter of the individual residential PV system, optimizing for hundreds of thousands of sources of supply and demand. On the other extreme, the DMO may be considered a “black box” to the TMO, functioning as a highly dynamic load that is internally managed at the community, feeder, or substation level. In between is a spectrum of variants, where a set of concrete roles, responsibilities, and regulatory and business models must be defined. Solutions are undoubtedly path-dependent, particularly with respect to legacy institutional responsibilities for items such as congestion management, voltage support, balancing, and outage management.15
15 IEA Implementing Agreement for a Co-operative Programme on Smart Grids (ISGAN), Annex 6 (Power Transmission and Distribution Systems), Task 5 is actively considering forthcoming interoperability issues and opportunities at the DSO-TSO interface.
30
This report is available at no cost from the National Renewable Energy Laboratory (NREL) at www.nrel.gov/publications.
5.3.2 Policy and Regulation The regulator will serve a central role in overseeing an orderly transition toward a competitive and open retail power market. Generally, the natural monopoly of transmission- and distribution-line infrastructure is preserved. A holistic, performance-based regulatory model is enacted, rewarding the DMO based on operational merit in key areas, e.g., integration of distributed resources, achievement of energy efficiency savings or low-carbon generation targets, successful implementation and maintenance of smart grid or ICT architectures, and reliability.
The regulator designs a range of wholesale and retail market rules and transaction protocols that promote the large-scale technical and economic coordination required for synchronized market operation. A signature duty of the regulator is to create a financial framework within these rules such that payments for DER services reflect the value of the resource based on its location, time of utilization, ability to provide grid support, and reliability16. The regulator also utilizes broad stakeholder input to specify a range of standards, including for ICT protocols, cyber security, DMO system reliability, and monitoring and verification methodologies. It also specifies data privacy requirements that balance the need for open market access and innovative data analytics with consumer privacy concerns. Other duties include: ensuring that reasonably priced default service is available to non-participatory consumers; placing appropriate vertical market power restrictions on legacy utilities; and specifying rules on a range of microgrid-related issues.
Policy and regulatory strategies that incorporate innovation and encourage competition are carefully crafted, and in many ways represent a shift from legacy approaches. With regard to the ADMS, SCADA systems and other ecosystem components, the regulator specifies core functionalities and minimum requirements, as opposed to specific technologies or platforms. Specifying a technology will inherently reduce competition and introduce risk that assets may be stranded as technology quickly evolves.
The regulator will be faced with many novel questions during the transition. With respect to legacy utilities, to what extent should they be prohibited from providing electricity service to consumers? What might a transition from utility to DMO look like? What types of vertical market power protections should be in place for consumers and DESCOs? Questions around payments will be of particular interest, e.g., how should a DER be compensated if it is called upon by the DMO and TMO simultaneously? How frequently should tariffs and DER compensation rates be changed? How will system planning processes shift as highly dynamic, market-based approaches begin to dominant operational decisions?
16 Defined in this context as the consistency of responsiveness of the resource when called upon by the grid operator.
“We note that the temptation to specify technologies will remain powerful. It is easier to grasp onto the concrete and understood functions of say, a specific smart metering or communications technology, rather than list minimum functions and trust the markets to meet those requirements.” -Matt Futch, Global Policy Director IBM Corporation Submitted in public comments to New York Public Service Commission in response to New York State’s Reforming the Energy Vision proposal
31
This report is available at no cost from the National Renewable Energy Laboratory (NREL) at www.nrel.gov/publications.
With the line between DMO and TMO increasingly blurred, a clear definition of institutional responsibilities and operational frameworks will be required of regulators and policymakers, particularly with respect to the roles of and required coordination between DMOs and TMOs for, inter alia, load balancing, congestion management, mitigation of transformer overloading, and outage management. Regulators must provide assistance in “filling the gaps” when new operational processes and ICT systems are required to support increased technical and market-based interactions. Transparency and accountability of decision-making is critical. When payments are being made for flexibility services, choosing the least-cost option may be preferable. However, this may be more feasible with advanced notice markets (e.g. day-ahead, hour-ahead) than for instantaneous operational decisions.
5.3.3 Finance If regulatory reforms are able to assure revenue for DMOs throughout the transition, investment in distribution networks may experience growth. Low voltage network projects can be financed via debt issuance or, for more capital-intensive projects (e.g., smart grid upgrades), competitively auctioned contracts. Some municipalities, either because of legacy stakes in municipal distribution systems or social backing for a local DMO, may choose to provide general obligation debt issuance or private activity bonds to finance infrastructure upgrades. Consumers will likely continue to invest private capital in DERs and energy management hardware. Partnerships may emerge between DESCOs, installers, original equipment manufacturers, and institutional investors providing the capital. Private equity, working with established leasers, may be highly active in the leasing space as the transition begins, but as the market becomes more competitive, institutional investors with longer-term liabilities may replace them.
The Bottom-of-the-Pyramid Coordination Pathways 5.4Accelerating energy access has been a chronic challenge for decades. With technology costs declining, novel approaches to energy access are emerging, ranging from super-efficient solar home systems to community microgrids (Bloomberg 2014). Citizens with low energy access represent a heterogeneous yet growing market segment in many developing countries. Energy poor communities have unique starting points with respect to market sophistication and development. As a result, effective energy access solutions require significant customization, making it difficult to scale-up solutions on a global basis.
Nonetheless, a coherent solution-set can be envisioned through the lens of recent technical and business model innovations. We identify two related but distinct pathways emerging for expanding energy access: bottom-up coordinated grid expansion and bundled community energy planning, both of which take advantage of synergies arising in existing solutions. The trends outlined in this section aim to help entrepreneurs and policymakers identify strategic commonalities to leverage faster scale-up.
5.4.1 Existing Solutions for Energy Access Customers in the expansive Bottom-of-the-Pyramid (BOP) market face energy shortages due to unreliability of supply or lack of grid connectivity. Energy poverty is often tackled through three approaches (adapted from IFC 2012): fragmented energy services, community-scale energy services, and expansion of traditional grids. Each approach entails differences in terms of sophistication, cultural attributes of target customer groups, and the scale of required
32
This report is available at no cost from the National Renewable Energy Laboratory (NREL) at www.nrel.gov/publications.
investments. The following table provides an overview of these energy access solutions, the specific end uses they serve and corresponding illustrative technologies:
Table 1. Existing Solutions for Electricity Access17
Solutions Technology End Uses
Fragmented Energy Services
Solar home systems Lighting, Heating, Communications, Refrigeration
Solar lanterns Lighting
Community-scale Energy Services
Community-scale cooking and heating technologies
Cooking, Heating, Other commercial and industrial uses
Mini-grid based systems
Lighting, Communications, Refrigeration, Other commercial and industrial uses
Top-down Grid Expansion
Transmission and distribution infrastructure
Lighting, Communications, Refrigeration, Other commercial and industrial uses
Fragmented Energy Services Fragmented energy services offer substantial user autonomy and are marketed to households through products such as improved cooking technologies and device-based electrification systems. Clean cooking technologies have received significant international focus as well as national support in several developing countries through programs that facilitate access to finance and provide institutional support (GVEP International 2009). Device-based electrification systems, on the other hand, are more diverse in design depending upon location. In order to deliver long-term value, both these solutions require some level of context-specific customization to end user needs and preferences as well as to their social and economic conditions. Relying on incremental changes in technology designs and transformative innovations in energy delivery approaches (Navigant 2006), fragmented energy services are fundamentally evolutionary in nature. Community-scale Energy Services Community-scale solutions are slightly more centralized than fragmented energy services,18 being designed to community-level requirements of size, technical capability, reliability, and affordability. Given the sometimes slow pace of top-down grid expansion (see next section), as well as plummeting costs of renewable energy technologies, mini-grid-based solutions for community-wide electrification have begun to achieve traction in several developing countries, particularly in remote communities (UNF 2014)19. Furthermore, at the community-scale of
17 Adapted from the IFC (2012). 18 Energy access solutions based on biomass and concentrated solar technologies serving cooking and heating needs at the community-scale are beyond the purview of electric power sector dynamics and are hence excluded from the discussion. 19 See e.g., World Bank (n.d.) REToolKit Case Study: Soluz Inc.
33
This report is available at no cost from the National Renewable Energy Laboratory (NREL) at www.nrel.gov/publications.
operations, mini-grids, in combination with fragmented energy services20, can achieve some level of economy of scale that further justifies investment. Ideally these systems can be designed not just to match the anticipated future demand growth in their limited service area, but also to render compatibility of operation with the expanding central grid systems. Four commercial models are evident in practice, each facing different challenges and opportunities in reference to their implementation and operation.21 Relying on appropriate financial and regulatory support, community-scale energy solutions are evolutionary in nature.
Top-down Grid Expansion Top-down grid expansion is an integral component of social and economic development in emerging economies. As the historically dominant model for enhancing electricity access to remote locations, it is a centralized approach that at times has been slow in achieving broad coverage (GVEP International 2011). The large scale of investments for grid expansion and poor rate of return from low-income customers often diminishes the commercial viability, thus requiring some level of state support. Even where grid connections have been established, reliability of service is often low, resulting in demand for back-up energy services. Effective top-down grid expansion, despite being incremental in pace, requires realignment of incumbent regulatory structures and transactional relationships among stakeholders to encourage private participation and affordability. As such, top-down grid expansion is reconstructive in nature.
20 Mainly device-based electrification systems like battery charged solar PV packs etc. 21 These four models are: Community, Utility, Private and Hybrid business models. For discussion on business models, as well as challenges and opportunities for implementation, see: USAID/ARE (2011).
34
This report is available at no cost from the National Renewable Energy Laboratory (NREL) at www.nrel.gov/publications.
5.4.2 The Bottom-of-the-Pyramid Continuum The unifying themes of effective solutions for energy-poor markets are that they are affordable, appropriate, and sufficiently simple (Figure 9). We frame these solutions on a continuum of decentralization and customization of each solution (Figure 10). The remainder of this section focuses on the intersection of existing solutions, where novel coordinated strategies are emerging that can potentially accelerate Bottom-of-the-Pyramid solutions.
Figure 9. Determinants of Success in Energy-Poor Markets To this end, we focus on two unique pathways emerging in the continuum depicted in Figure 10. Bottom-up coordinated grid expansion aims to encourage positive interplay between mini-grids and the central grid, overcoming occasional tensions between the two pathways. Bundled community energy planning aims to knit together fragmented energy services into integrated community-scale systems, achieving more favorable economies of scale.
In describing these emerging pathways, we focus on illustrating how facilitation of favorable regulatory and financial environment by policymakers may lead to accelerated entrepreneurship and more coherent BOP solutions.
35
This report is available at no cost from the National Renewable Energy Laboratory (NREL) at www.nrel.gov/publications.
Figure 10. The Continuum of Pathways to Support BOP Energy Access
5.4.3 Bottom-up Coordinated Grid Expansion The Bottom-up Coordinated Grid Expansion pathway bridges two existing energy service paradigms: community-scale energy services and top-down grid expansion. Currently these paradigms can occasionally be in competition (Bloomberg 2014). The new pathway identifies steps that enable coordinated planning and operation across these paradigms to accelerate energy access.
5.4.3.1 Design In most countries, comprehensive grid coverage is ultimately desired, and linked to national social and economic development. The design of this pathway couples the incremental pace of central grid expansion with comparatively fast, affordable, and innovative expansion of community-scale mini-grid systems.
The key design innovation in this pathway is technical and regulatory backwards compatibility of mini-grids to the central grid. Ideally, mini-grid systems are planned, regulated and financed in a coordinated manner with central grid systems. For example, gradually phased extension of electrification as conceptualized by Munich-based KAITO Energie AG demonstrates this concept (Gaudchau et al. 2013). This entails encouraging compatibility of institutional and regulatory structures and technical design standards. The design principles for mini-grid systems versus centralized grid expansion strategies are quite different, but viewing them as two parts of a comprehensive energy access strategy allows integrated solutions to occur. For example, in anticipating interconnection with the central grid systems, the technical designs of mini-grid systems aim to ensure operational compatibility and to allow for two-way flow of electricity,
36
This report is available at no cost from the National Renewable Energy Laboratory (NREL) at www.nrel.gov/publications.
through standardized low-voltage interconnection procedures and equipment. Standardization of technical design guidelines for mini-grid systems ensures that designs address not only local demand growth and resource availability concerns, but also longer-term operational sustainability when the central grid arrives.
Finally, design features that have traditionally been central for mini-grids may also be beneficial for central grid expansion. For example, mini-grid deployments typically involve substantial social engagement and capacity building, to provide social and economic benefits for stakeholders, reduce transaction costs, and enhance local commitment and responsibility (Gaudchau et al. 2013).
5.4.3.2 Policy and Regulation Top-down grid expansion and community-scale energy services enjoy significantly different levels of policy and regulatory support. While the former co-evolved with existing regulatory frameworks, mini-grids arrived much later and lack equivalent policy and regulatory history. Disparate regulatory treatment impedes parallel development of both paths, but integrated policy and regulatory frameworks can help capitalize on their synergies. Policy and regulation can also be directed at supporting uniform technical standards22 to support system interoperability. Regulators in particular play an important role in encouraging standardization processes that can support accelerated scale-up. Removing bureaucratic and political hurdles allows parallel pursuit of grid expansion and community-scale energy services, raising energy access and economic growth rates.
5.4.3.3 Finance Identifying and securing anchor customers, like local businesses and industries, can help support the financial health of mini-grid commercial models. Technical standardization and clear policy and regulatory frameworks can dramatically simplify the process of attracting capital financing and providing clearer signals to mini-grid investors that the arrival of the central grid will not result in a financial loss or stranding of assets. Finally, novel revenue collection methods for mini-grids—for example flexible service payment methods designed to avoid payment defaults—can be applied to mini-grids and central grid operations alike, increasing the overall fiscal profile of the power sector (UNF 2014). Similarly, investments in training and local capacity building can mitigate long-term operation, maintenance, and repair costs.
5.4.4 Bundled Community Energy Planning The Bundled Community Energy Planning pathway also entails a convergence of two existing paradigms: community-scale energy services and fragmented energy services. A market-oriented integration of these independent business models exposes latent complementarities. Due to strong context-specific underpinnings in both these solutions, this pathway focuses on the realization of beneficial commercial models which integrate both approaches.
22 For an overview of technical standards for mini-grid power systems, see Greacen et al. (2013).
37
This report is available at no cost from the National Renewable Energy Laboratory (NREL) at www.nrel.gov/publications.
5.4.4.1 Design Community-scale and fragmented energy services vary in terms of commercial approaches in the market. While community-scale energy services are typically organized in one of four commercial models (community, utility, private, and hybrid), fragmented energy services operate in product-based markets. Both approaches serve the same off-grid or low energy access customer base; thus, inducing compatibility between these disparate solutions could lead to synergies, a higher value proposition to business and consumers alike, and the potential for further cost reductions and innovation.
The key design feature of this path is an integrated business plan that achieves cost savings from bundling energy products with community-scale energy production. The EGG-energy23 business model offers such an example, where local mini-grid charging stations offer affordable charged battery subscriptions to rural customers utilizing community charging stations (Artha 2008).
5.4.4.2 Policy and Regulation Realizing integrated business models across the two solutions necessitates a greater focus on restructuring existing market conditions. Policy and regulation must encourage: technical standardization and product quality control; ratepayer support for community-based energy access expansion; local training and shared system ownership; transparent selection processes for energy access solutions; and effective ex-post project evaluation.
5.4.4.3 Finance There is a need for regulation and policy to help define the market and its needs; clear signals on this front can help to unlock gaps in financing and clarify value propositions. Where energy product markets already exist, regulation can encourage appropriate cost sharing and risk allocation for more capital-intensive mini-grid projects, and place technical requirements for standardization on generation equipment and appliances that might contribute to (or draw from) the community mini-grid.
This report is available at no cost from the National Renewable Energy Laboratory (NREL) at www.nrel.gov/publications.
6 Conclusion: Policy and Regulatory Priorities Cost reductions, innovations in data, evolving energy goals and customer engagementthese are just a few of the trends that are rapidly shaping power systems. Policymakers and regulators can choose to let these external forces determine how power systems unfold, or they can promote policies and build regulatory and finance frameworks that drive the transformation toward a desired vision.
This report articulates competing visions of the power system, and suggests five pathways of policy and other actions that can help realize these visions. To modernize the power sector most effectively, it is essential for policymakers to engage stakeholders early and often, so that the power system accommodates a broad set of interests to best energy customers and society.
To summarize, the five pathways toward a modern power system described in this report are:
Next-generation Performance-based Regulation This pathway aims to gradually reorient the vertically-integrated utility model toward the achievement of a broader set of public policy outcomes. Key principles of this adaptive pathway include:
• Regulations that tie utility profits to desired performance outcomes, rather than sales or investments
• Ratemaking that centers on outcome-based incentives, which will reveal new earnings opportunities for utilities at a time when old revenue streams are under threat
• Long-duration performance evaluation periods to provide certainty sufficient to allow higher utility capital efficiency and improved planning practices
• Appropriate market power mitigation measures to encourage competition and innovation.
Clean Restructuring Pathway This pathway aims to take conventional power market restructuring model and enhance it with the lessons learned of the past 20 years. Key principles from this reconstructive pathway include:
• Bulk power market design characteristics that encourage clean energy and energy efficiency investment, reduce investment risk, and promote efficient competition in wholesale market
• Transparent planning processes for network expansion, particularly those attempting to incorporate remote renewable energy sources or those that take into account the value of distributed energy resources. Planning and dispatch practices can be optimized to facilitate integration of clean energy, including use effective forecasting methodologies, creation of platforms for demand-side participation, and coordination with other balancing areas
• Simplified interconnection rules and clear forecasting and system operation protocols to reduce investor risk
39
This report is available at no cost from the National Renewable Energy Laboratory (NREL) at www.nrel.gov/publications.
• Regulatory frameworks to incentivize efficient interconnection and line-loss reductions for transmission owners and operators.
Unleashing the DSO Pathway This pathway aims to empower the distribution system operator to coordinate a cohesive ecosystem of retail and wholesale markets. Key principles of this evolutionary pathway include:
• Clear definitions of institutional responsibilities and operational frameworks, particularly with respect to the roles of and required coordination between the distribution market operator and the transmission market operator for load balancing, congestion, and outage management
• Secure, open access to system and consumer data, with protections for cyber security and privacy, to increase levels of consumer awareness and encourage third-party participation
• Technology neutrality in policies and standards, with a focus on required functionalities and technical interoperability instead of selection of specific technologies
• Streamlined processes for interconnection, consumer data acquisition, and market participation to reduce barriers to participation and encourage transformation.
Bottom-of-the-Pyramid Pathways These pathways require enhanced planning in order to integrate existing energy access solutions. Two possible pathways emerge: adaptive Bottom-up Coordinated Grid Expansion and evolutionary Bundled Community Energy Planning. Each pathway creates customized, context-specific, energy solutions. Key principles include:
• Standardization of technical specifications for energy services across multiple scales (e.g., end-use products, community mini-grids, centralized grids) to encourage competition, common platforms, and coordination and interconnection opportunities between top-down and bottom-up grid expansion efforts. Regulation and policy should provide transparency to mini-grid investors on the financial implications of the central grid subsuming their network
• Clear regulatory and policy signals to help define market needs, unlock gaps in financing, and clarify value propositions.
***
With these organizing principles in mind, power sector decision makers will be better positioned to proactively guide a transition to 21st century power systems. The forces acting on today’s systems need not be perceived as headwinds. Organizing the policy and regulatory landscape to harness these trends to achieve accessible, reliable, and low-carbon energy futures can transform these forces into tailwinds. As the old saying goes, “When you can’t change the direction of the wind—adjust your sails.”
40
This report is available at no cost from the National Renewable Energy Laboratory (NREL) at www.nrel.gov/publications.
References Abbey, C.; Cornforth, D.; Hatziargyriou, N.; Hirose, K.; Kwasinski, A.; Kyriakides, E.; Platt, G.; Reyes, L.; Suryanarayanan, S. (2014). “Powering Through the Storm: Microgrids Operation for More Efficient Disaster Recovery.” IEEE Power and Energy Magazine (12:3); pp. 67-76, May-June 2014.
Aggarwal, S.; Burgess, E. (2014), “Performance-Based Models to Address Utility Challenges,” The Electricity Journal (27:6); pp. 48-60.
Artha. (2008). EGG-Energy – Artha Case Study. Zurich, Switzerland: Artha. Accessed December 2014: http://www.arthaplatform.com/casestudies/46/egg-energy-engineering/
Barclays. (2014). The Solar Vortex: Credit Implications of Electric Grid Defection. London, UK: Barclays Credit Research.
Bazilian, M.; Miller, M.; Detchon, R.; Liebreich, M.; Blyth, W.; Futch, M.; Modi, V.; Jones, L.; Barkett, B.; Howells, M.; MacGill, I.; Kammen, D.M.; Mai, T.; Wittenstein, M.; Aggarwal, S.; O’Malley, M.; Carvallo, J.P.; Welsch, M.; Pugh, G.; Weston, R.; Arent, D.J. (2013). “Accelerating the Global Transformation to 21st Century Power Systems.” The Electricity Journal (26); pp. 39 – 51.
Bloomberg New Energy Finance (BNEF). (2014). Fight, flight or adapt: How are US utilities coping with distributed PV? New York, New York: BNEF US Solar Research Note.
BP. (2014). BP Energy Outlook 2035. London, UK: BP. Accessed October 2014: http://www.bp.com/content/dam/bp/pdf/Energy-economics/Energy-Outlook/Energy_Outlook_2035_booklet.pdf
Central Electricity Authority, Government of India (CEO-GOI). (2013). Large Scale Grid Integration of Renewable Energy Sources-Way Forward. Accessed April 29, 2014: www.cea.nic.in/reports/powersystems/large_scale_grid_integ.pdf.
Chen, Y.; Ebenstein, A.; Greenstone, M.; Li, H. (2013). “Evidence on the impact of sustained exposure to air pollution on life expectancy from China’s Huai River policy.” Proceedings of the National Academy of Sciences (110); pp. 12936-12941.
Citi. (2013). Energy Darwinism: The Evolution of the Energy Industry. Citi GPS: Global Perspectives & Solutions Series. New York, NY: Citi. Accessed November 2014: https://ir.citi.com/Jb89SJMmf%2BsAVK2AKa3QE5EJwb4fvI5UUplD0ICiGOOk0NV2CqNI%2FPDLJqxidz2VAXXAXFB6fOY%3D
Cochran, J.; Miller, M.; Milligan, M.; Ela, E.; Arent, D.; Bloom, A.; Futch, M.; Kiviluoma, J.; Holtinnen, H.; Orths, A.; Gomez-Lazaro, E.; Martin-Martinez, S.; Kukoda, S.; Garcia, G.; Mikkelsen, K. M.; Yongqiang, Z.; Sandholt, K. (2013). Market Evolution: Wholesale Electricity Market Design for 21st Century Power Systems. NREL/TP-6A20-57477. Golden, CO: National Renewable Energy Laboratory. http://www.nrel.gov/docs/fy14osti/57477.pdf
This report is available at no cost from the National Renewable Energy Laboratory (NREL) at www.nrel.gov/publications.
Comisión Reguladora de Energía (CRE). (2014). Presentation delivered at 21CPP Round Table Event. Yorktown Heights, New York: September 25, 2014 (unpublished).
Commonwealth Scientific and Industrial Research Organisation (CSIRO). (2013). Change and Choice: The Future Grid Forum’s analysis of Australia’s Potential Electricity Pathways to 2050. Clayton South Victoria, Australia: CSIRO.
Cory, K.; Aznar, A. (2015). “Informing Electricity Systems of the Future: Key Analysis Needs.” The Electricity Journal (forthcoming).
Denholm, P.; Margolis, R.; Palmintier, B.; Barrows, C.; Ibanez, E.; Bird, L.; Zuboy, J. (2014). Methods for Analyzing the Benefits and Costs of Distributed Photovoltaic Generation to the U.S. Electric Utility System. TP-6A20-62447. Golden, CO: National Renewable Energy Laboratory.
Ehlers, T.; Packer, F; Ramona, E. (2014). “Infrastructure and Corporate Bond Markets in Asia.” Conference volume of the 2014 RBA Annual Conference on “Financial Flows and Infrastructure Financing.
EIA (U.S. Energy Information Administration). (2013). “U.S. Electricity Sales Have Decreased in Four of the Past Five Years.” Today in Energy. http://www.eia.gov/todayinenergy/detail.cfm?id=14291.
Electric Power Research Institute (EPRI). (2014). The Integrated Grid: Realizing the Full Value of Central and Distributed Energy Resources. Palo Alto, CA: EPRI.
Environmental Protection Agency (EPA). (2011). The Benefits and Costs of the Clean Air Act from 1990 to 2020. Washington, D.C.: Environmental Protection Agency, Office of Air and Radiation.
Estache, A.; Wren-Lewis, L. (2009). “Toward a theory of regulation for developing countries: following Jean-Jacques Laffont's lead.” Journal of Economic Literature (47:3); pp. 729-770.
Eurostat. (2014). “Consumption of energy.” European Commission. Brussels, Belgium: Eurostat. Accessed December 2014: http://epp.eurostat.ec.europa.eu/statistics_explained/index.php/Consumption_of_energy
Gao, C.; Li, Y. (2010). “Evolution of China’s power dispatch principle and the new energy saving power dispatch policy.” Energy Policy (38:11); pp. 7346–7357. doi:10.1016/j.enpol.2010.08.011
Gaudchau, E.; Gerlach, A-K.; Wasgindt, V;. Reyer, C. (2013), Business Models for Renewable Energy Based Mini-Grids in Non-Electrified Regions. Proceedings of the 28th European PV Solar Energy Conference.
Global Village Energy Partnership International (GVEP). (2011). Policy briefing: The history of mini-grid development in developing countries. London, UK: GVEP. Accessed December 2014: http://www.gvepinternational.org/sites/default/files/policy_briefing_-_mini-grid_final.pdf
This report is available at no cost from the National Renewable Energy Laboratory (NREL) at www.nrel.gov/publications.
Gratwick, K. N.; Eberhard, A. (2008). “Demise of the standard model for power sector reform and the emergence of hybrid power markets.” Energy Policy (36:10); pp. 3948–3960. doi:10.1016/j.enpol.2008.07.021
Greacen, C.; Engel, R.; Quetchenbach, T. (2013). “A Guidebook on Grid Interconnection and Islanded Operation of Mini-grid Power Systems up to 200 kW.” LBNL Report 6224E. http://www.cleanenergyministerial.org/portals/2/pdfs/a_guidebook_for_minigrids-serc_lbnl_march_2013.pdf
Green II, R.; Wang, L.; Alam, M. (2011). “The impact of plug-in hybrid electric vehicles on distribution networks: A review and outlook.” Renewable and Sustainable Energy Reviews (15:1); pp. 544-553.
GVEP International. (2009). Cookstoves and Markets: Experiences, Successes and Opportunities. London, UK: GVEP International. Accessed December 2014: http://www.hedon.info/docs/GVEP_Markets_and_Cookstoves__.pdf
GVEP International. (2011). The History of Mini-grid Development in Developing Countries. Policy Briefing. London, UK: GVEP International. Accessed December 2014: http://www.gvepinternational.org/sites/default/files/policy_briefing_-_mini-grid_final.pdf
Hogan, M. (2013). “Power Markets: Aligning Power Markets to Deliver Value.” America’s Power Plan.
Hope Hailey, V.; Balogun, J. (2002). “Devising Context Sensitive Approaches To Change: The Example of Glaxo Wellcome.” Long Range Planning (35:2); pp. 153-178.
IBM. (2012). Managing Big Data for Smart Grids and Smart Meters. Armonk, NY: IBM. Accessed December 2014: http://www-935.ibm.com/services/multimedia/Managing_big_data_for_smart_grids_and_smart_meters.pdf
IEA Renewable Energy Technology Deployment (IEA-RETD). (2014). Residential Prosumers – Drivers and Policy Options (RE-Prosumers). September 2014 (Revised version of June 2014). Paris, France; IEA. Accessed December 2014: http://iea-retd.org/wp-content/uploads/2014/09/RE-PROSUMERS_IEA-RETD_2014.pdf
IEA. (2013). World Energy Outlook. Paris, France: IEA. http://www.worldenergyoutlook.org/publications/weo-2013/
International Energy Agency (IEA). (2014). World Energy Investment Outlook. Paris, France: IEA. http://www.iea.org/publications/freepublications/publication/weio2014.pdf
International Finance Corporation (IFC). (2012). From Gap to Opportunities: Business Models for Scaling Up Energy Access. Washington, DC: International Finance Corporation.
This report is available at no cost from the National Renewable Energy Laboratory (NREL) at www.nrel.gov/publications.
ISGAN (2013). Flexible Power Delivery Systems: An Overview of Policies and Regulations and Expansion Planning and Market Analysis for the United States and Europe. ISGAN Discussion Paper. Annex 6: Power T&D Systems.
Kahrl, F.; Williams, J. H.; Hu, J. (2013). “The political economy of electricity dispatch reform in China.” Energy Policy (53); pp. 361–369. doi:10.1016/j.enpol.2012.10.062
Kind, P. (2013). Disruptive Challenges: Financial Implications and Strategic Responses to a Changing Retail Electric Business. Prepared for Edison Electric Institute. Washingtonm, D.C.: Edison Electric Institute. Accessed September 2014: http://www.eei.org/ourissues/finance/documents/disruptivechallenges.pdf.
KPMG. (2011). Basel III: Issues and Implications. Amsterdam, the Netherlands: KPMG. Accessed December 2014: http://www.kpmg.com/global/en/issuesandinsights/articlespublications/documents/basell-iii-issues-implications.pdf
Lehr, R. (2013). “New Utility Business Models: Utility and Regulatory Models for the Modern Era.” America’s Power Plan.
Ma, J. (2011). “On-grid electricity tariffs in China: Development, reform and prospects.” Energy Policy (39:5); pp. 2633–2645. doi:10.1016/j.enpol.2011.02.032
May, R. M.; Levin, S.A.; Sugihara, G. (2008). “Complex systems: Ecology for bankers.” Nature, (451:7181); pp. 893-895.
Miller, M.; Cox, S. (2014). Overview of Variable Renewable Energy Regulatory Issues. NREL/TP-6A20-61350. Golden, CO: National Renewable Energy Laboratory. Accessed October 2014: http://www.nrel.gov/docs/fy14osti/61350.pdf
MISO (Midwest System Operator). (2014). 2013 State of the Market Report for the MISO Electricity Markets. Prepared by Potomac Economics. Washington, D.C.: MISO. Accessed October 2014: https://www.misoenergy.org/Library/Repository/Report/IMM/2013%20State%20of%20the%20Market%20Report.pdf
Mwasilu, F.; Justo, J.; Kim, E.; Do, T.; Jung, J. (2014). Electric vehicles and smart grid interaction: A review on vehicle to grid and renewable energy sources integration, Renewable and Sustainable Energy Reviews, Volume 34, June 2014, Pages 501-516, ISSN 1364-0321, http://dx.doi.org/10.1016/j.rser.2014.03.031.
Navigant Consulting, Inc. and Soluz, Inc. study (2006), Innovation in Rural Energy Delivery. http://www.soluzusa.com/documents/NCI-Soluz_Innovation_in_Rural_Energy_Delivery.pdf
New York Department of Public Service (NY-DPS). (2014). Reforming the Energy Vision: NYS Department of Public Service Staff Report and Proposal. Case 14-M-0101. Albany, NY: NY-DPS.
This report is available at no cost from the National Renewable Energy Laboratory (NREL) at www.nrel.gov/publications.
NPC (National People’s Congress). (2011). The 12th Five-Year-Plan of the People’s Republic of China. 14 March 2011. People’s Republic of China.
Oracle. (2013) Utilities and Big Data: Using Analytics for Increased Customer Satisfaction. Redwood Shores, CA: Oracle. Accessed December 2014: http://www.oracle.com/us/industries/utilities/big-data-analytics-customer-wp-2075868.pdf
PJM (PJM Interconnection). (2013). 2012 Economic Demand Response Performance Report: Analysis of Economic DR participation in the PJM wholesale energy market after the implementation of Order 745. Norristown, PA.
Regulatory Assistance Project (RAP). (2013). Recommendations for Power Sector Policy in China: Practical Solutions for Energy, Climate, and Air Quality. Beijing, China: RAP. http://www.raponline.org/document/download/id/6869
Rocky Mountain Institute (RMI). (2014). The Economics of Grid Defection. Boulder, Colorado: RMI. Accessed October 2014: http://www.rmi.org/electricity_grid_defection
Ruth, M. F.; Kroposki, B. (2014). “Energy Systems Integration: An Evolving Energy Paradigm.” The Electricity Journal (27:6); pp. 36-47. http://dx.doi.org/10.1016/j.tej.2014.06.001
Scheffer, M.; Bascompte, J.; Brock, W.A.; Brovkin, V.; Carpenter, S.R.; Dakos, V.; Sugihara, G. (2009). “Early-warning signals for critical transitions.” Nature (461:7260); pp. 53-59.
Secretaría de Energía (SENER). (2014). “Energy Reform Key Elements.” Accessed October 2014: http://sener.gob.mx/res/prensa/KEY%20ELEMENTS%20OF%20THE%20ENERGY%20REFORM.pdf
Sen, A.; Jamasb, T. (2013). “Not Seeing the Wood for the Trees? Electricity Market Reform in India,” Chapter 17. Sioshansi, F., ed. In Evolution of Global Electricity Markets Waltham, MA: Academic Press, pp. 497–530.
Statistics Japan. (2014). Chapter 10 Energy and Water: Electricity. Tokyo, Japan: Statistics Japan. Accessed December 2014: http://www.stat.go.jp/english/data/nenkan/1431-10e.htm
Sungard. (2013) Big Data Challenges and Opportunities for the Energy Industry. New York, NY: Sungard Financial Systems. Accessed December 2014: http://financialsystems.sungard.com/~/media/fs/energy/resources/white-papers/Big-Data-Challenges-Opportunities-Energy-Industry.ashx
UBS. (2014). Q-Series® on Global Utilities, Autos & Chemicals: Will solar, batteries and electric cars re-shape the electricity system? Zurich, Switzerland: UBS. Accessed October 2014: http://knowledge.neri.org.nz/assets/uploads/files/270ac-d1V0tO4LmKMZuB3.pdf
UNF (United Nations Foundation). (2014), Microgrids for Rural Electrification: A critical review of best practices based on seven case studies. http://energyaccess.org/images/content/files/MicrogridsReportFINAL_low.pdf
This report is available at no cost from the National Renewable Energy Laboratory (NREL) at www.nrel.gov/publications.
United States Agency for International Development/Alliance for Rural Electrification (USAID/ARE). (2011). Hybrid Mini-grids for Rural Electrification: Lessons Learned. Brussels, Belgium: ARE. Accessed October 2014: http://www.ruralelec.org/fileadmin/DATA/Documents/06_Publications/Position_papers/ARE_Mini-grids_-_Full_version.pdf
Western Interstate Energy Board (WIEB). (2013). Energy Imbalance Market Overview. Denver, CO: Western Interstate Energy Board.
World Bank. (2014). Global Economic Prospects: Shifting priorities, building for the future. World Bank Group Flagship Report. Washington, D.C.: World Bank. doi: 10.1596/978-1-4648-0387-1
World Bank. (undated). REToolKit Case Study: Soluz Inc. Washington, D.C.: World Bank. Accessed October 2014: http://siteresources.worldbank.org/INTRENENERGYTK/Resources/Soluz0Fee1for1service0model0.pdf