27
Powering through the storm Danie Mouton Carbon Manager, Growth Exxaro Resources Ltd South African Coal Exports Conference 2009 Cape Town 5 February 2009
| Date post: | 19-Dec-2015 |
| Category: |
Documents |
| View: | 219 times |
| Download: | 2 times |

Powering through the storm
Danie Mouton
Carbon Manager, Growth
Exxaro Resources Ltd
South African Coal Exports Conference 2009
Cape Town
5 February 2009

2
Sunday Times, 25 January 2009

3
• Introduction to Exxaro
• World economic crisis – Severity and impact
• World economic crisis – All doom and gloom?
• Coal – Blown away or riding the storm?
• Conclusion
Agenda

4Introduction to Exxaro
COALthe fourth largest coal producer in South Africa MINERAL SANDSone of the world's top three producers of zircon and chlorinatable TiO2 slag
BASE METALS AND INDUSTRIAL MINERALSthe only zinc producer in South Africa
IRON ORE20% holding in Sishen Iron Ore Company
Our commodities At a glance…
One of the largest South African based diversified resources company
An ALSI Top 40 company, listed on the JSE
Over 9 000 employees
Revenue: R5.8bn* (±US$ 0.8bn)
Net operating profit: R806m* (±US$107m)
Operations in South Africa, Australia, Namibia and China
53% BEE ownership
* H1 2008 (6 months) results

5
The world economic crisis – severity and impact

6
Source: Global Insight
World crisis – GDP growth
-4
-2
0
2
4
6
8
10
Ja
n-7
1
Ja
n-7
3
Ja
n-7
5
Ja
n-7
7
Ja
n-7
9
Ja
n-8
1
Ja
n-8
3
Ja
n-8
5
Ja
n-8
7
Ja
n-8
9
Ja
n-9
1
Ja
n-9
3
Ja
n-9
5
Ja
n-9
7
Ja
n-9
9
Ja
n-0
1
Ja
n-0
3
Ja
n-0
5
Ja
n-0
7
Ja
n-0
9
Ja
n-1
1
Gro
wth
Ra
te (
% C
ha
ng
e)
World USA Western Europe Japan
Oil crisis Oil crisisStock market
crashAsian crisis
Dotcom bubbleburst
September 11
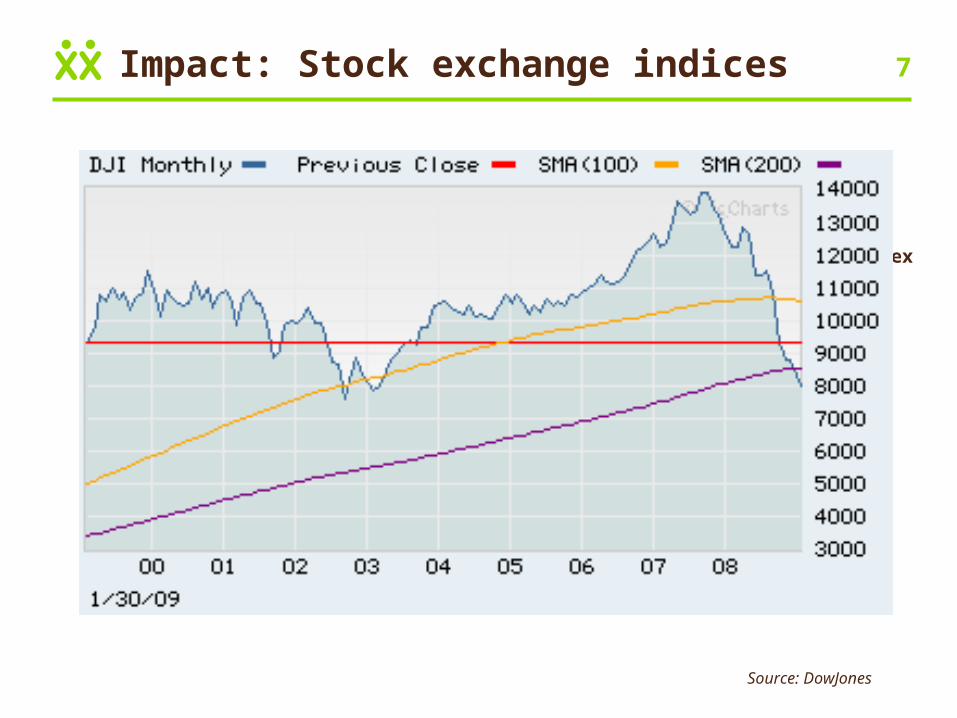
7Impact: Stock exchange indices
Source: DowJones
JSE Industrial Index Dow Jones Industrial Index
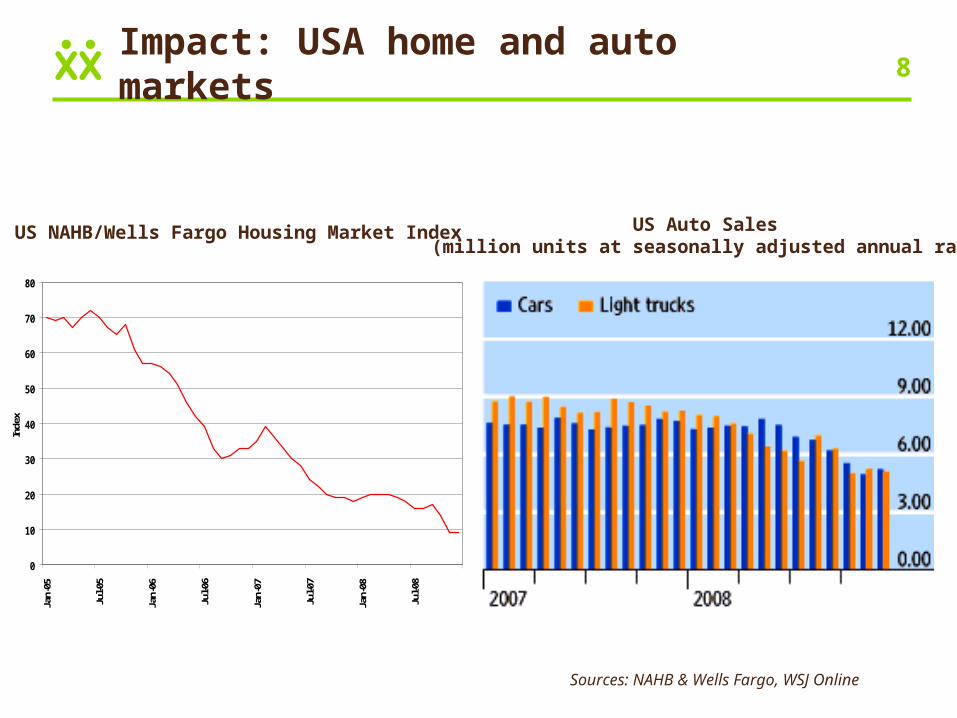
8Impact: USA home and auto markets
Sources: NAHB & Wells Fargo, WSJ Online
US NAHB/Wells Fargo Housing Market Index US Auto Sales (million units at seasonally adjusted annual rate)
0
10
20
30
40
50
60
70
80
Jan-
05
Jul-0
5
Jan-
06
Jul-0
6
Jan-
07
Jul-0
7
Jan-
08
Jul-0
8
Inde
x

9Impact: Commodity prices
0
1000
2000
3000
4000
5000
6000
7000
8000
9000
10000Ja
n-0
0A
pr-
00Ju
l-00
Oct
-00
Jan
-01
Ap
r-01
Jul-
01O
ct-0
1Ja
n-0
2A
pr-
02Ju
l-02
Oct
-02
Jan
-03
Ap
r-03
Jul-
03O
ct-0
3Ja
n-0
4A
pr-
04Ju
l-04
Oct
-04
Jan
-05
Ap
r-05
Jul-
05O
ct-0
5Ja
n-0
6A
pr-
06Ju
l-06
Oct
-06
Jan
-07
Ap
r-07
Jul-
07O
ct-0
7Ja
n-0
8A
pr-
08Ju
l-08
Oct
-08
Cu
& Z
n P
rice
s (U
S$/
t)
0
20
40
60
80
100
120
140
160
180
Co
al &
Oil
Pri
ces
((U
S$/
t &
US
$/b
bl)
Copper Zinc Brent Crude RBCT Steam CoalSource: I-Net
10
The world economic crisis – all doom and gloom?
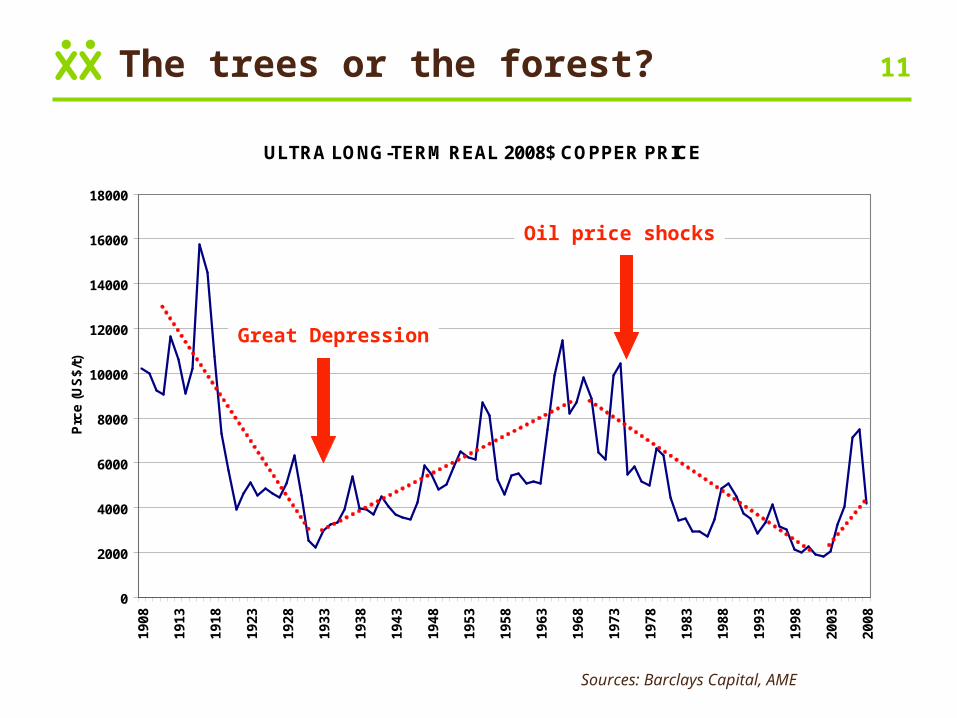
11The trees or the forest?
Sources: Barclays Capital, AME
ULTRA LONG-TERM REAL 2008$ COPPER PRICE
0
2000
4000
6000
8000
10000
12000
14000
16000
18000
19
08
19
13
19
18
19
23
19
28
19
33
19
38
19
43
19
48
19
53
19
58
19
63
19
68
19
73
19
78
19
83
19
88
19
93
19
98
20
03
20
08
Prc
e (
US
$/t
)
Great Depression
Oil price shocks
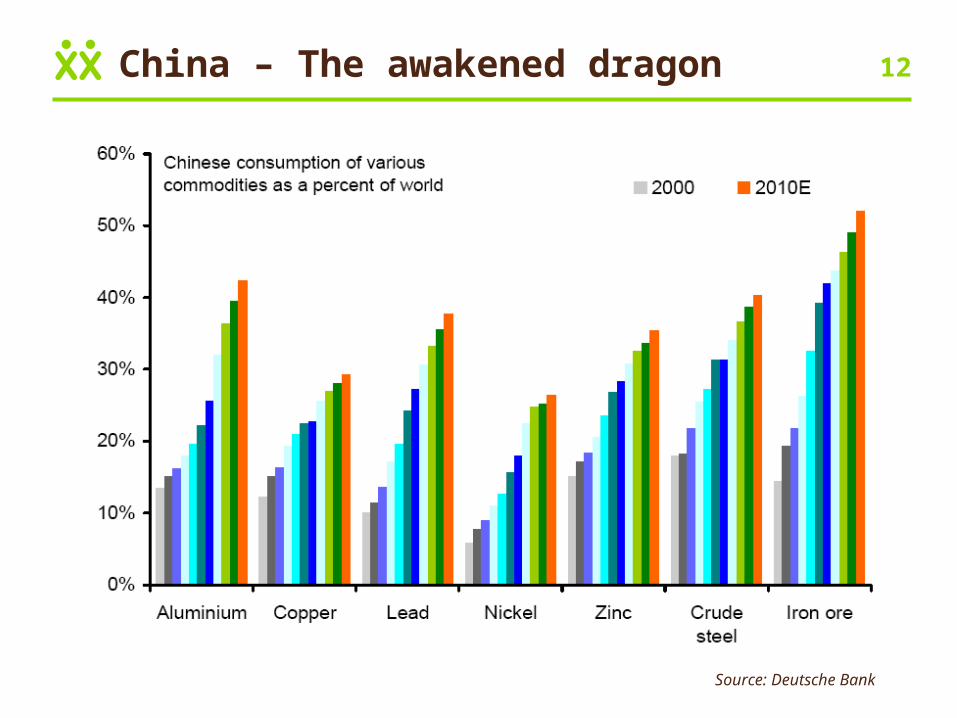
12China – The awakened dragon
Source: Deutsche Bank
13
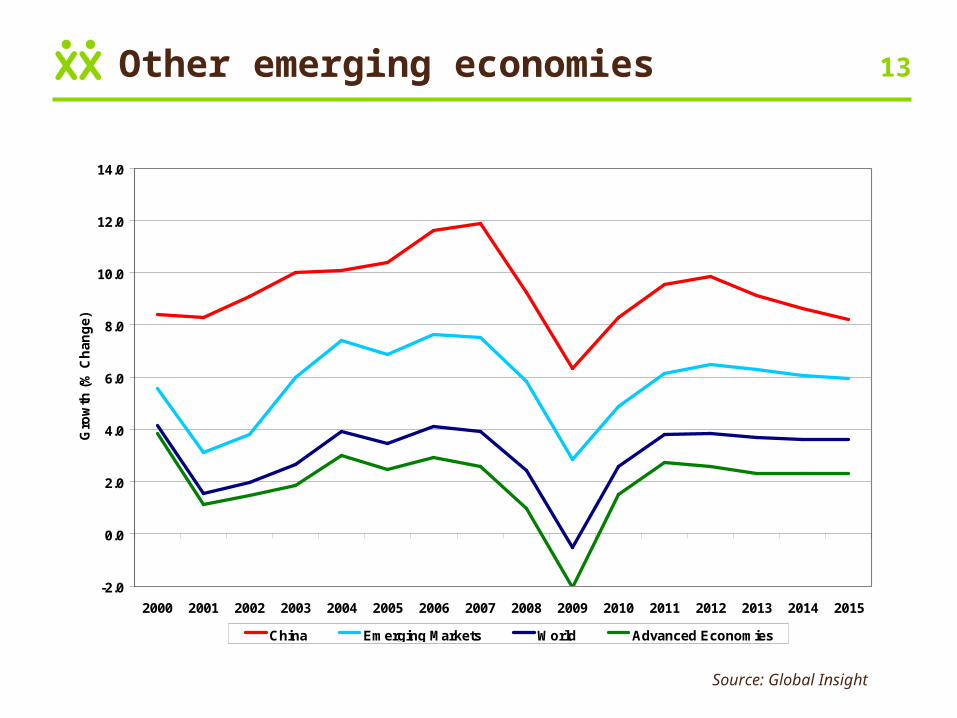
-2.0
0.0
2.0
4.0
6.0
8.0
10.0
12.0
14.0
2000 2001 2002 2003 2004 2005 2006 2007 2008 2009 2010 2011 2012 2013 2014 2015
Gro
wth
(%
Ch
an
ge
)
China Emerging Markets World Advanced Economies
Source: Global Insight
Other emerging economies
14
Sources: Citigroup, Barclays Capital, Brook Hunt, Deutsche Bank, JB Were, Macquarie, Standard Bank
0
20
40
60
80
100
120
140
160
2008 2009 2010 2011 2012
Ind
ex (
2008
= 1
00)
Zinc Rutile Zircon Steam Coal Iron Ore Fines Hard Coking Coal
Real LT Prices
$1680/t
$500/t
$712/t
$66/t
USc74/mtu
$115/t
Commodity prices – recovery?

15
Source: I-Net
4
5
6
7
8
9
10
11
12
13
Ja
n-0
0
Ma
y-0
0
Se
p-0
0
Ja
n-0
1
Ma
y-0
1
Se
p-0
1
Ja
n-0
2
Ma
y-0
2
Se
p-0
2
Ja
n-0
3
Ma
y-0
3
Se
p-0
3
Ja
n-0
4
Ma
y-0
4
Se
p-0
4
Ja
n-0
5
Ma
y-0
5
Se
p-0
5
Ja
n-0
6
Ma
y-0
6
Se
p-0
6
Ja
n-0
7
Ma
y-0
7
Se
p-0
7
Ja
n-0
8
Ma
y-0
8
Se
p-0
8
Ja
n-0
9
Ex
ch
an
ge
Ra
teExchange rate – protection?

16The glass is half full!
• Lower energy costs (oil price)
• Rational filtering of asset quality
• Slow-down of capex escalation
• Greater willingness and incentive to form synergistic alliances
• Diversification potential (some assets are cheap now…)
• Skills retention

17
Coal – Blown away or riding the storm?
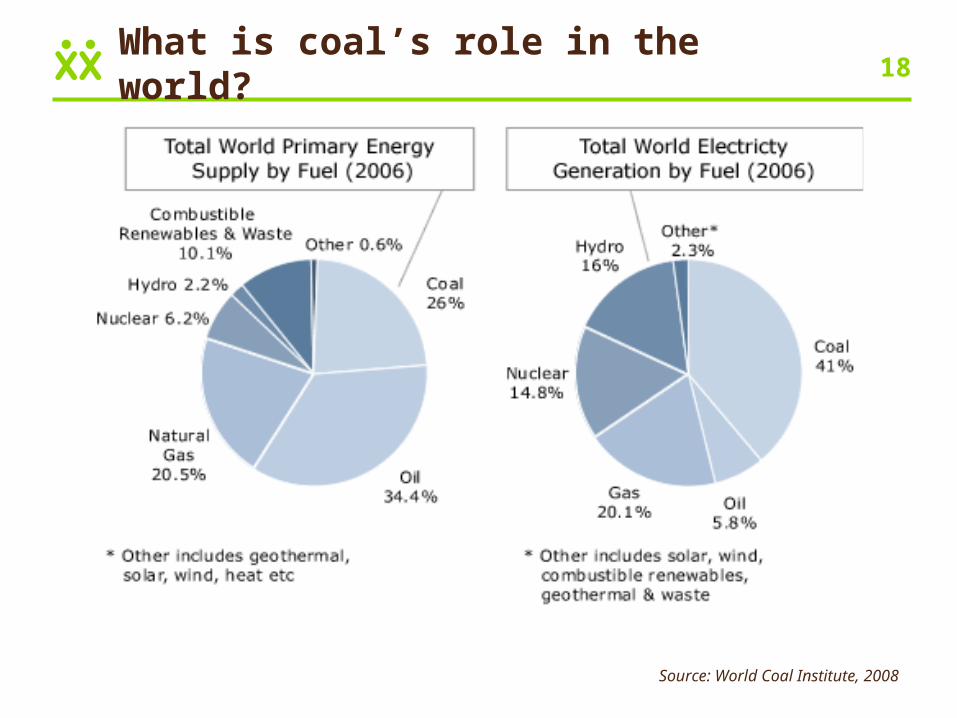
18What is coal’s role in the world?
Source: World Coal Institute, 2008

19Does coal have a future role to play?
Source: IEA, 2006
• Fossil fuels remain dominant source of energy – 83% of the overall increase in energy demand
• Coal sees the biggest increase in demand in absolute terms (59% by 2030), while non-hydro
renewables grow fastest, but from a small base

20Is there enough coal?
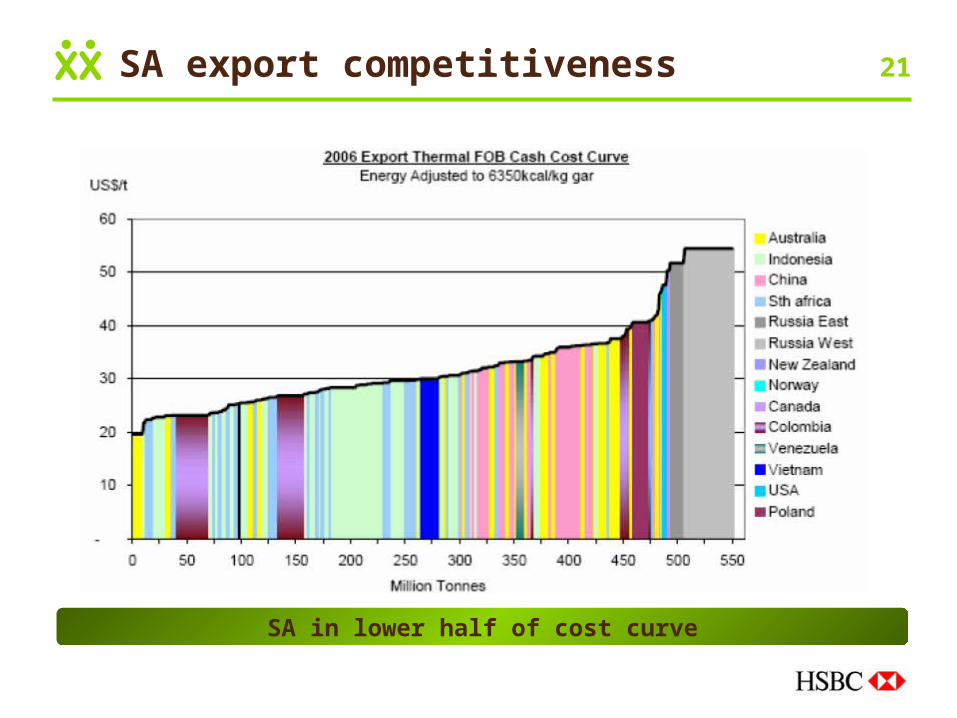
21
SA in lower half of cost curve
SA export competitiveness

22Logistics is the key
MineralResource
LogisticsMarket
Products
MineralReserve
MineralDeposit/Rights
Losses
Losses
Losses
Losses
Conversion through Technology
Mining Beneficiation
Losses
ROM
Losses
Losses
Losses
Typical
OC Mine10%
losses
3 to 5%
dilution
6% to slimes
85% organic eff
3%losses
Due to Quality
variation
60 to 120%
Of Costs
20%margin
Loss due
To over/under
spec
At least 45% of value destruction across value chain
Source: Exxaro company analysis

23It’s time to work together
In order to have reached its annual capacity target of 76Mtpa during 2008,
producers would have had to produce, TFR would have had to rail, and
RBCT would have had to ship an average of 6.3Mtpm during the year.
Source: Barlow Jonker, 2009

24
Conclusion

25Power through the storm – together
• Cost discipline
• Improve efficiencies
• Spend cash wisely
• Create alliances
• Minimise value losses across value chain – exploit synergies
• Collectively develop logistical solutions for the coal business
BUSINESS AS IT USUALLY SHOULD BE

26Final thought
“As the credit crunch threatens to become a global
downturn, corporate leaders have a choice: pull in
their horns and ride out the storm or look for
opportunities to pick up bargain-basement assets
that will help them grow and create future value for
shareholders. If past is prologue, more will follow
the first course – which is a mistake.”
M&A strategies in a down market
The McKinsey Quarterly, September 2008

27
THANK YOU


