38
1 CORPORATE PRESENTATION April 2018
| Date post: | 08-Jun-2018 |
| Category: |
Documents |
| Upload: | nguyenliem |
| View: | 213 times |
| Download: | 0 times |
1
CORPORATE PRESENTATION
April 2018
Cautionary statements
2
ALL AMOUNTS IN U.S. DOLLARS UNLESS OTHERWISE STATEDCAUTIONARY NOTE REGARDING FORWARD-LOOKING STATEMENTSCertain information contained in this presentation, including any information relating to New Gold’s future financial or operating performance are “forward looking”. All statements in this presentation, other thanstatements of historical fact, which address events, results, outcomes or developments that New Gold expects to occur are “forward-looking statements”. Forward-looking statements are statements that arenot historical facts and are generally, but not always, identified by the use of forward-looking terminology such as “plans”, “expects”, “is expected”, “budget”, “scheduled”, “targeted”, “estimates”, “forecasts”,“intends”, “anticipates”, “projects”, “potential”, “believes” or variations of such words and phrases or statements that certain actions, events or results “may”, “could”, “would”, “should”, “might” or “will be taken”,“occur” or “be achieved” or the negative connotation of such terms. Forward-looking statements in this presentation include the statements made under “2018 Guidance”, as well as other statements elsewherein this presentation, including, among others, statements with respect to: guidance for production, operating expense, all-in sustaining costs and total cash costs, and the factors contributing to those expectedresults, including mill throughput and metal recoveries, as well as expected capital and other expenditures; planned development activities and timing for 2018 and future years at the Rainy River Mine,including the completion of the full tailings damn footprint and the construction of the first tailings lift, the waste stripping program and underground development; the expected production and costs of the RainyRiver Mine over its first nine years of operation; targeted timing for permits, including the Blackwater EA; expected timing for Blackwater development activities, including the completion of internal trade-offstudies; and expecting timing for closing of the Peak Mines sale transaction.
All forward-looking statements in this presentation are based on the opinions and estimates of management as of the date such statements are made and are subject to important risk factors and uncertainties,many of which are beyond New Gold’s ability to control or predict. Certain material assumptions regarding such forward-looking statements are discussed in this presentation, New Gold’s annual and quarterlyManagement’s Discussion and Analysis (“MD&A”), its Annual Information Form and its Technical Reports filed at www.sedar.com. In addition to, and subject to, such assumptions discussed in more detailelsewhere, the forward-looking statements in this presentation are also subject to the following assumptions: (1) there being no significant disruptions affecting New Gold’s operations; (2) political and legaldevelopments in jurisdictions where New Gold operates, or may in the future operate, being consistent with New Gold’s current expectations; (3) the accuracy of New Gold’s current mineral reserve and mineralresource estimates; (4) the exchange rate between the Canadian dollar, Mexican peso and U.S. dollar being approximately consistent with current levels; (5) prices for diesel, natural gas, fuel oil, electricity andother key supplies being approximately consistent with current levels; (6) equipment, labour and materials costs increasing on a basis consistent with New Gold’s current expectations; (7) arrangements withFirst Nations and other Aboriginal groups being consistent with New Gold’s current expectations; (8) all required permits, licenses and authorizations being obtained from the relevant governments and otherrelevant stakeholders within the expected timelines; and (9) in the case of production, cost and expenditure outlooks at the operating mines for 2018 and future years, commodity prices and exchange ratesbeing consistent with those estimated for the purposes for 2018.
Forward-looking statements are necessarily based on estimates and assumptions that are inherently subject to known and unknown risks, uncertainties and other factors that may cause actual results, level ofactivity, performance or achievements to be materially different from those expressed or implied by such forward-looking statements. Such factors include, without limitation: significant capital requirements andthe availability and management of capital resources; additional funding requirements; price volatility in the spot and forward markets for metals and other commodities; fluctuations in the international currencymarkets and in the rates of exchange of the currencies of Canada, the United States and Mexico; discrepancies between actual and estimated production, between actual and estimated mineral reserves andmineral resources and between actual and estimated metallurgical recoveries; fluctuation in treatment and refining charges; changes in national and local government legislation in Canada, the United Statesand Mexico or any other country in which New Gold currently or may in the future carry on business; taxation; controls, regulations and political or economic developments in the countries in which New Golddoes or may carry on business; the speculative nature of mineral exploration and development, including the risks of obtaining and maintaining the validity and enforceability of the necessary licenses andpermits and complying with the permitting requirements of each jurisdiction in which New Gold operates; the lack of certainty with respect to foreign legal systems, which may not be immune from the influenceof political pressure, corruption or other factors that are inconsistent with the rule of law; the uncertainties inherent to current and future legal challenges New Gold is or may become a party to; diminishingquantities or grades of mineral reserves and mineral resources; competition; loss of key employees; rising costs of labour, supplies, fuel and equipment; actual results of current exploration or reclamationactivities; uncertainties inherent to mining economic studies; changes in project parameters as plans continue to be refined; accidents; labour disputes; defective title to mineral claims or property or contestsover claims to mineral properties; unexpected delays and costs inherent to consulting and accommodating rights of Indigenous groups; risks, uncertainties and unanticipated delays associated with obtainingand maintaining necessary licenses, permits and authorizations and complying with permitting requirements. In addition, there are risks and hazards associated with the business of mineral exploration,development and mining, including environmental events and hazards, industrial accidents, unusual or unexpected formations, pressures, cave-ins, flooding and gold bullion losses (and the risk of inadequateinsurance or inability to obtain insurance to cover these risks) as well as “Risk Factors” included in New Gold’s disclosure documents filed on and available at www.sedar.com. Forward-looking statements arenot guarantees of future performance, and actual results and future events could materially differ from those anticipated in such statements. All of the forward-looking statements contained in this presentationare qualified by these cautionary statements. New Gold expressly disclaims any intention or obligation to update or revise any forward-looking statements whether as a result of new information, events orotherwise, except in accordance with applicable securities laws.
The footnotes, endnotes and appendix to this presentation contain important information. The endnotes and appendix are found at the end of the presentation. All amounts in US dollars unless otherwiseindicated.

3
New Gold – Strategic pillarsFocus on long-term shareholder value creation
1. For a detailed breakdown of Mineral Resources and Reserves by category, refer to New Gold’s December 31, 2017 MD&A. Refer to Endnotes under the heading “Cautionary note to U.S. readers concerning estimates of Mineral Reserves and Mineral Resources” and “Technical Information”.
CANADIAN FOCUSED14.8 Moz
gold reserves(1), >90% located in Canada
Full-year 2017 gold production achieved guidance range
380-430 Koz
Delivered 11% increase in cash flow per share
Rainy River and Blackwater to provide further growth
OPERATIONAL TRACK RECORD
GROWTH OPPORTUNITIES
ENHANCING FINANCIAL
FLEXIBILITYNo debt due until 2022Extended debt maturity and
lowered interest rate
Strong North American presenceFootprint in Canada continues to grow
4
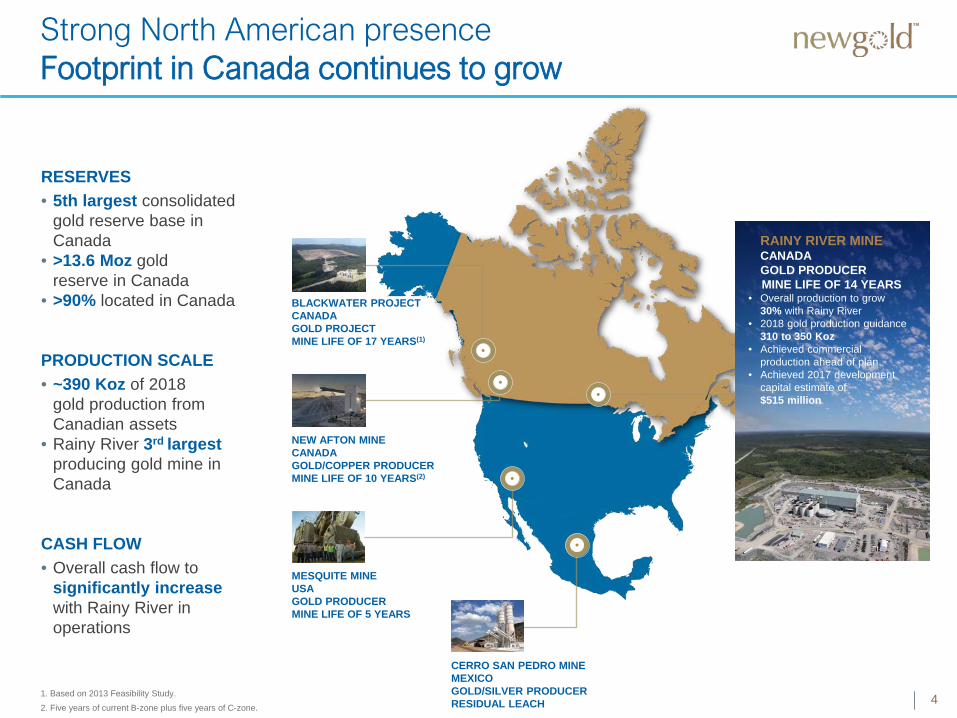
RESERVES• 5th largest consolidated
gold reserve base in Canada
• >13.6 Moz gold reserve in Canada
• >90% located in Canada
PRODUCTION SCALE• ~390 Koz of 2018
gold production from Canadian assets
• Rainy River 3rd largestproducing gold mine in Canada
CASH FLOW• Overall cash flow to
significantly increase with Rainy River in operations
RAINY RIVER MINECANADAGOLD PRODUCER MINE LIFE OF 14 YEARS
• Overall production to grow 30% with Rainy River
• 2018 gold production guidance 310 to 350 Koz
• Achieved commercial production ahead of plan
• Achieved 2017 development capital estimate of $515 million
NEW AFTON MINECANADAGOLD/COPPER PRODUCERMINE LIFE OF 10 YEARS(2)
MESQUITE MINEUSAGOLD PRODUCERMINE LIFE OF 5 YEARS
BLACKWATER PROJECTCANADAGOLD PROJECTMINE LIFE OF 17 YEARS(1)
CERRO SAN PEDRO MINEMEXICOGOLD/SILVER PRODUCERRESIDUAL LEACH
1. Based on 2013 Feasibility Study. 2. Five years of current B-zone plus five years of C-zone.
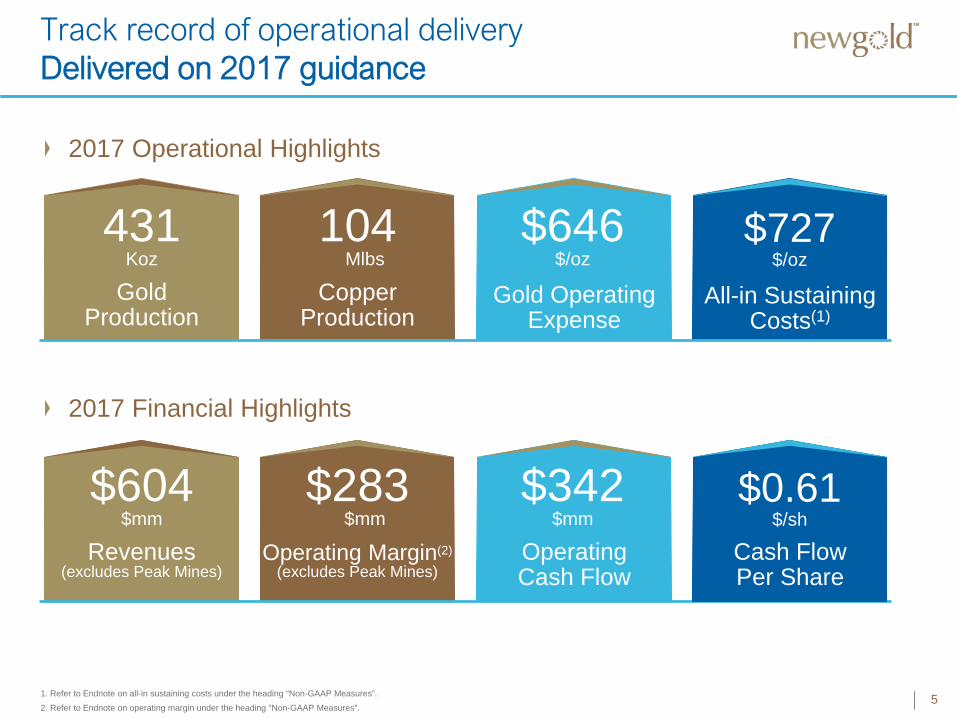
Track record of operational deliveryDelivered on 2017 guidance
2017 Operational Highlights
51. Refer to Endnote on all-in sustaining costs under the heading “Non-GAAP Measures”.2. Refer to Endnote on operating margin under the heading “Non-GAAP Measures”.
Gold Production
431Koz
Copper Production
104Mlbs
Gold Operating Expense
All-in Sustaining Costs(1)
$727$/oz
$646$/oz
2017 Financial Highlights
Revenues(excludes Peak Mines)
$604$mm
Operating Margin(2)
(excludes Peak Mines)
$283$mm
Operating Cash Flow
Cash FlowPer Share
$0.61$/sh
$342$mm

6
Rainy River Delivered on key 2017 milestones
Production start in mid-September COMPLETED
Schedule 2 amendment expected in the fourth quarter of 2017 COMPLETED
Commercial production targeted for November 2017 COMPLETED
2017 development capital through November commercial production of $515 million ACHIEVED
(achieved September 14th)
(received late third quarter)
(achieved two weeks ahead of schedule)

7
Disciplined management of Capital resources and liquidity position
1. Undrawn credit facility as at December 31, 2017. $139 million of $400 million facility used for Letters of Credit and $230 million drawn at December 31, 2017. 2. Cash and cash equivalents as at December 31, 2017.
Liquidity Position
$247million
Cash and cash equivalents(2)
$216 million
$31 million
Undrawn credit facility(1)
Long-Term Balance Sheet Flexibility –No Debt Due Until 2022
CREDIT FACILITY
NOVEMBER 2012 NOTES
MAY 2017 NOTES
Face Value $400 million(1) $500 million $300 million
Maturity Aug 14, 2020 Nov 15, 2022 May 15, 2025
Interest Rate 1.00%-3.25% 6.25% 6.375%
Callable at 103.1%
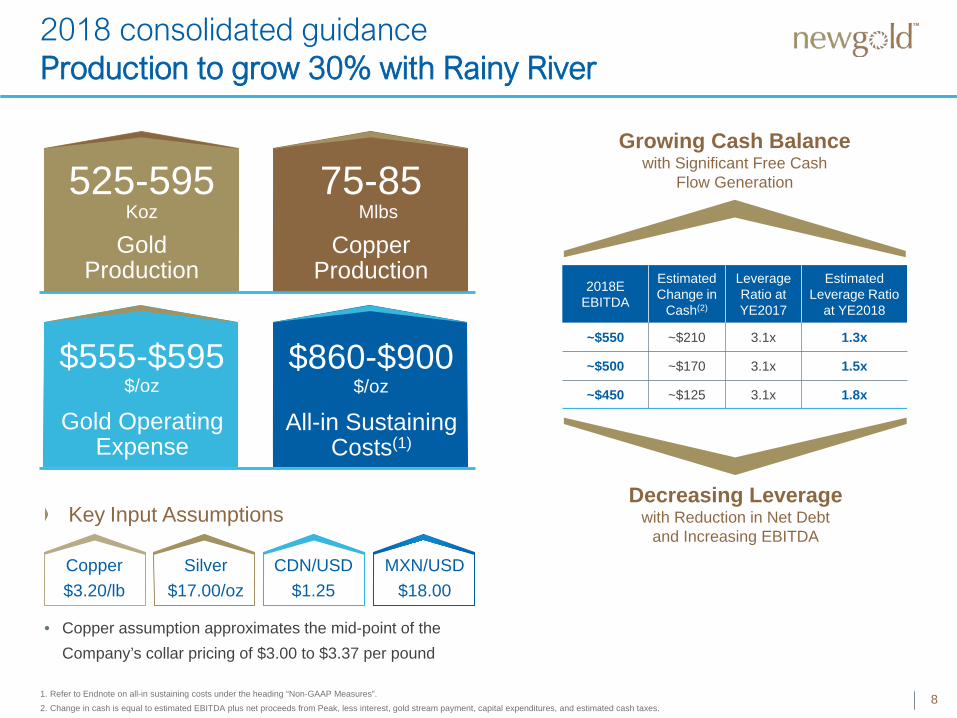
2018 consolidated guidanceProduction to grow 30% with Rainy River
81. Refer to Endnote on all-in sustaining costs under the heading “Non-GAAP Measures”.2. Change in cash is equal to estimated EBITDA plus net proceeds from Peak, less interest, gold stream payment, capital expenditures, and estimated cash taxes.
Key Input Assumptions
Gold Production
525-595Koz
Copper Production
75-85Mlbs
Copper$3.20/lb
Silver$17.00/oz
CDN/USD $1.25
MXN/USD $18.00
• Copper assumption approximates the mid-point of the Company’s collar pricing of $3.00 to $3.37 per pound
Gold Operating Expense
All-in Sustaining Costs(1)
$860-$900$/oz
$555-$595$/oz
2018E EBITDA
Estimated Change in
Cash(2)
Leverage Ratio at YE2017
Estimated Leverage Ratio
at YE2018
~$550 ~$210 3.1x 1.3x
~$500 ~$170 3.1x 1.5x
~$450 ~$125 3.1x 1.8x
Growing Cash Balancewith Significant Free Cash
Flow Generation
Decreasing Leverage with Reduction in Net Debt
and Increasing EBITDA
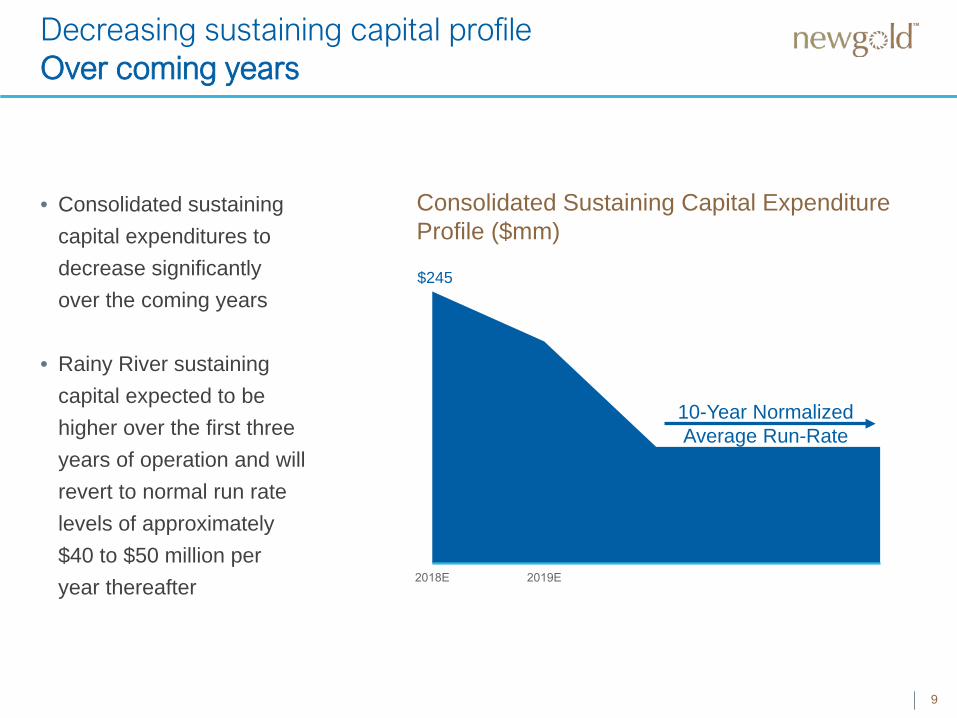
Decreasing sustaining capital profileOver coming years
9
$245
• Consolidated sustaining capital expenditures to decrease significantly over the coming years
• Rainy River sustaining capital expected to be higher over the first three years of operation and will revert to normal run rate levels of approximately $40 to $50 million per year thereafter
Consolidated Sustaining Capital Expenditure Profile ($mm)
10-Year Normalized Average Run-Rate

10
Rainy River driving growth
1. Refer to Endnote on all-in sustaining costs under the heading “Non-GAAP Measures”.
New Afton
2017 Actual
2017 2018E
Production 431 Koz ~560 Koz
Mesquite
Peak Mines
Cerro San Pedro
2018 Guidance
Rainy River
Cerro San PedroNew Afton
Mesquite
Rainy River
Cerro San Pedro+30%
• Over the first nine years (including 2018), Rainy River’s annual gold production should average between 275,000 to 375,000 ounces at all-in sustaining costs(1) of approximately $875 per ounce
11
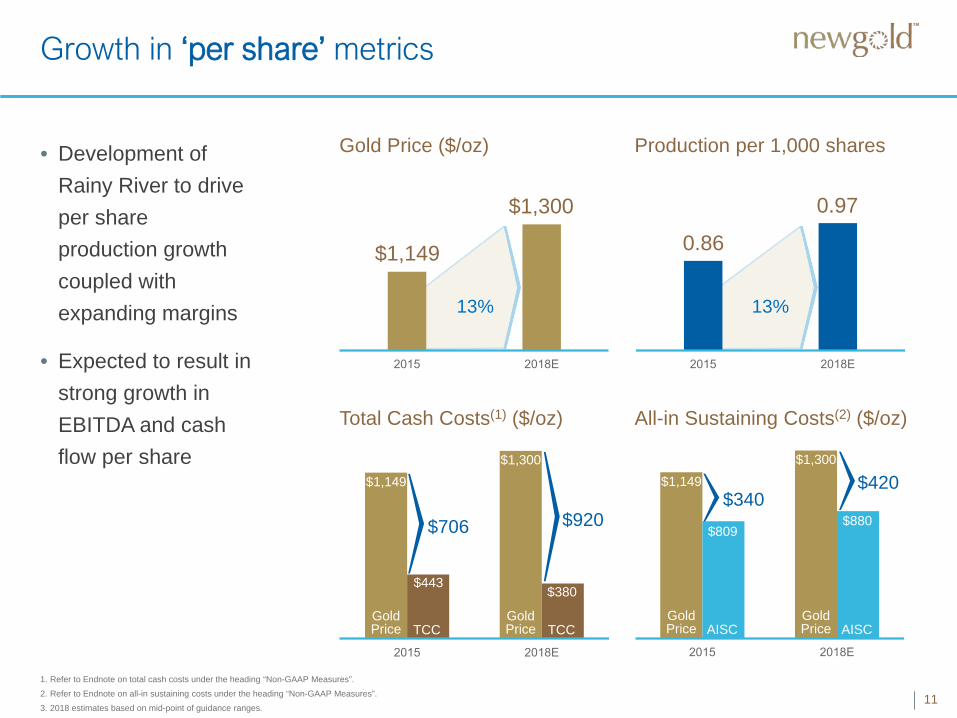
13%
$1,149
$1,300
Gold Price ($/oz)
13%
0.86
0.97
Production per 1,000 shares
$1,149$1,300
Total Cash Costs(1) ($/oz) All-in Sustaining Costs(2) ($/oz)
Growth in ‘per share’ metrics
• Development of Rainy River to drive per share production growth coupled with expanding margins
• Expected to result in strong growth in EBITDA and cash flow per share
1. Refer to Endnote on total cash costs under the heading “Non-GAAP Measures”.2. Refer to Endnote on all-in sustaining costs under the heading “Non-GAAP Measures”.3. 2018 estimates based on mid-point of guidance ranges.
$443$380
$706
Gold Price TCC
Gold Price TCC
$920
$1,149$1,300
$809$880
$340
Gold Price AISC
Gold Price AISC
$420
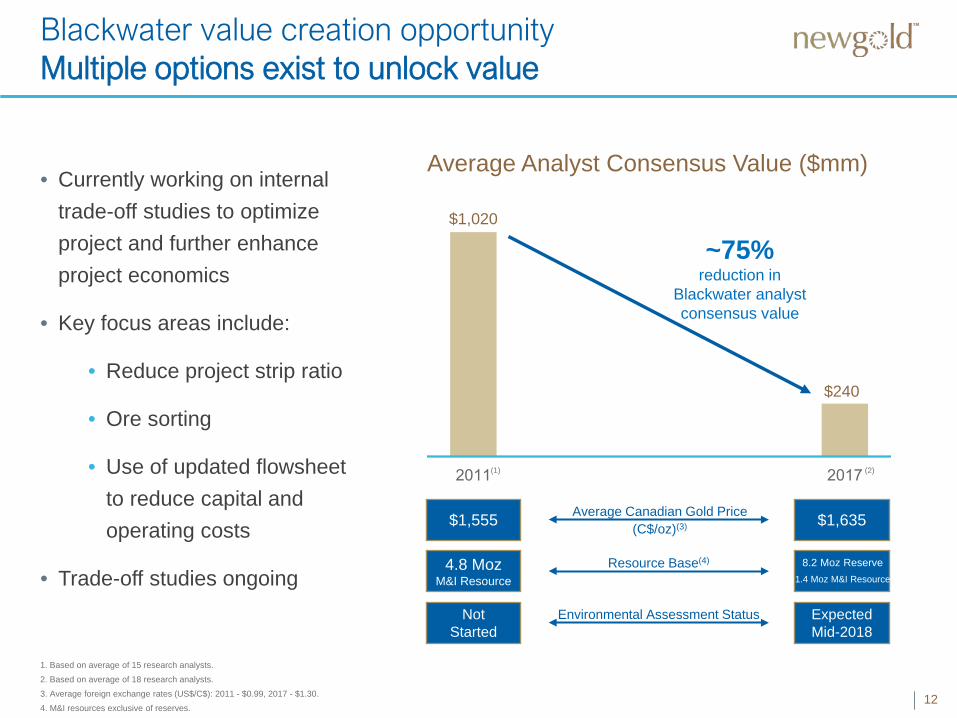
Blackwater value creation opportunityMultiple options exist to unlock value
12
• Currently working on internal trade-off studies to optimize project and further enhance project economics
• Key focus areas include:
• Reduce project strip ratio
• Ore sorting
• Use of updated flowsheet to reduce capital and operating costs
• Trade-off studies ongoing
$1,020
$240
~75%reduction in
Blackwater analyst consensus value
Average Canadian Gold Price (C$/oz)(3)
Average Analyst Consensus Value ($mm)
Resource Base(4)
Environmental Assessment Status
$1,555
4.8 Moz M&I Resource
Not Started
$1,635
Expected Mid-2018
1. Based on average of 15 research analysts. 2. Based on average of 18 research analysts.3. Average foreign exchange rates (US$/C$): 2011 - $0.99, 2017 - $1.30. 4. M&I resources exclusive of reserves.
(1) (2)
8.2 Moz Reserve1.4 Moz M&I Resource
13
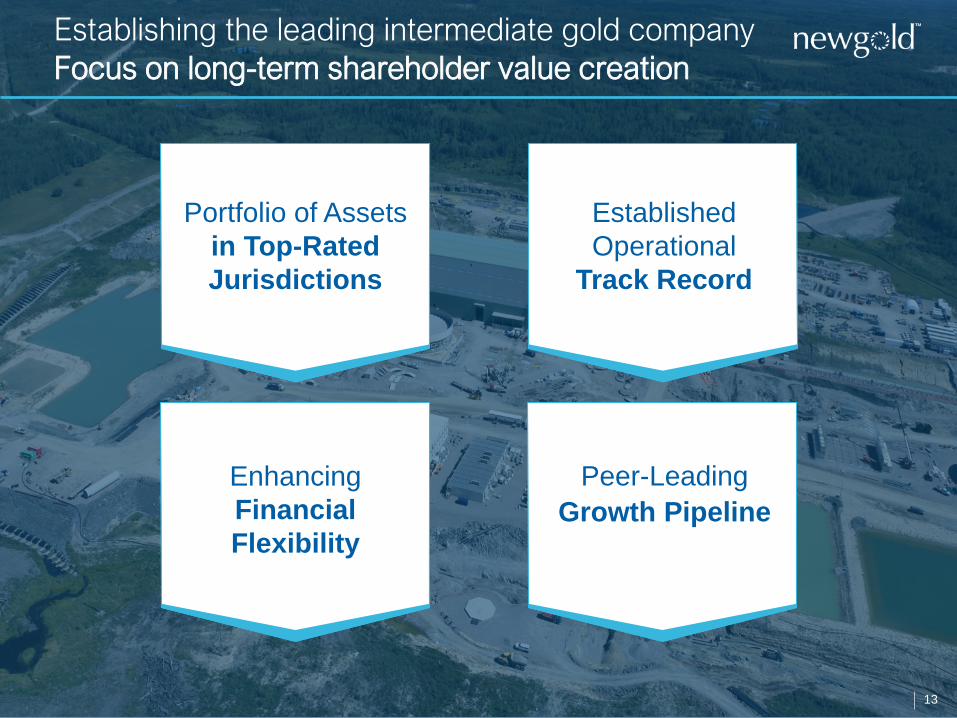
Establishing the leading intermediate gold companyFocus on long-term shareholder value creation
Portfolio of Assetsin Top-Rated Jurisdictions
Established Operational
Track Record
Peer-LeadingGrowth Pipeline
Enhancing Financial Flexibility
Appendices
Corporate 15
Rainy River 22
Blackwater, Reserves and Resources 25

Summary of debt
15
Appendix 1
1. $31 million undrawn credit facility as at December 31, 2017. $139 million of $400 million facility used for Letters of Credit and $230 million drawn at December 31, 2017.
CREDIT FACILITY SENIOR UNSECURED NOTES (November 2012)
SENIOR UNSECURED NOTES (May 2017)
Face Value $400 million(1) $500 million $300 million
Maturity August 14, 2020 November 15, 2022 May 15, 2025
Interest Rate See ‘Key features’ 6.25% 6.375%
Payable Revolving credit Semi-annually Semi-annually
Conversion price n/a n/a n/a
Current trading value n/a ~103 ~105
Key features • Interest rate spread varies between 1.00%-3.25% based on leverage ratio
• Current interest rate spread of 3.25%
• Senior unsecured• Currently redeemable at
par plus half coupon,declining ratably to par
• Senior unsecured• Redeemable after
May 15, 2020 at 104.8% down to 100% of face after 2023
Credit facility overview
16
Appendix 1
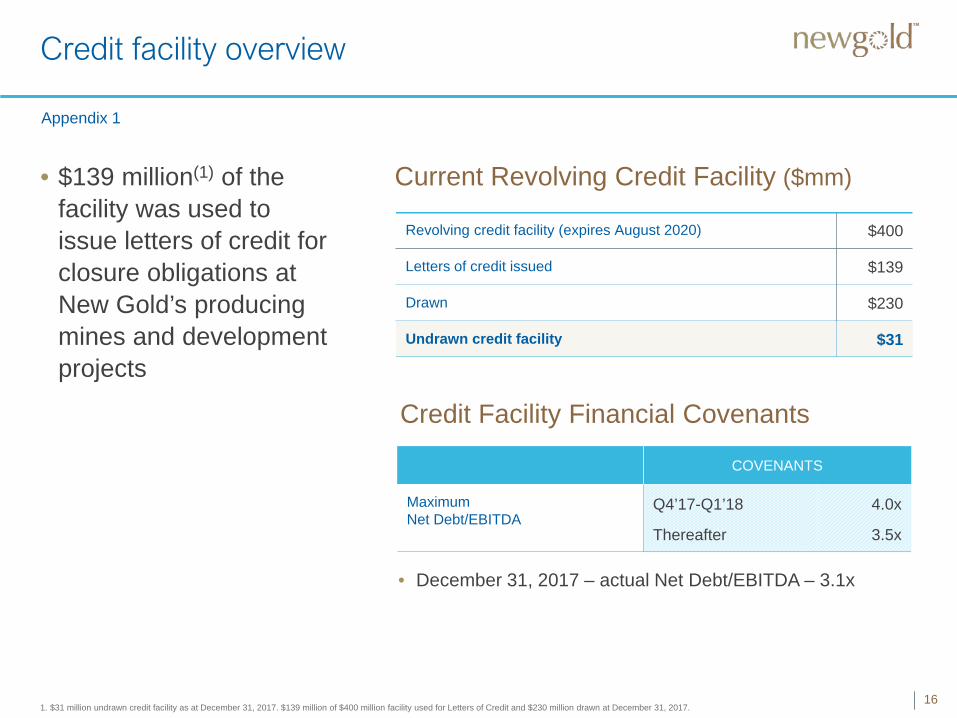
• $139 million(1) of the facility was used to issue letters of credit for closure obligations at New Gold’s producing mines and development projects
Current Revolving Credit Facility ($mm)
Credit Facility Financial Covenants
Revolving credit facility (expires August 2020) $400
Letters of credit issued $139
Drawn $230
Undrawn credit facility $31
COVENANTS
Maximum Net Debt/EBITDA
Q4’17-Q1’18
Thereafter
4.0x
3.5x
1. $31 million undrawn credit facility as at December 31, 2017. $139 million of $400 million facility used for Letters of Credit and $230 million drawn at December 31, 2017.
• December 31, 2017 – actual Net Debt/EBITDA – 3.1x
17
3786
169104
34
$1,432
$412
$727
$1,287 $1,549
($605)
$817 $909
$1,425
2017 mine-by-mine operating results
1. Operating expense excludes Peak Mines as the asset has been classified as a discontinuing operation. Consolidated operating expense: Silver - $8.54/oz, Copper - $1.34/lb. 2. Refer to Endnote on all-in sustaining costs under the heading “Non-GAAP Measures”.3. Refer to Endnote on all-in sustaining costs under the heading “Non-GAAP Measures”. New Afton co-product all-in sustaining costs: Gold - $692/oz, Copper - $1.44/lb. 4. Refer to Endnote on all-in sustaining costs under the heading “Non-GAAP Measures”. Peak Mines co-product all-in sustaining costs: Gold - $1,067/oz, Copper - $2.37/lb.
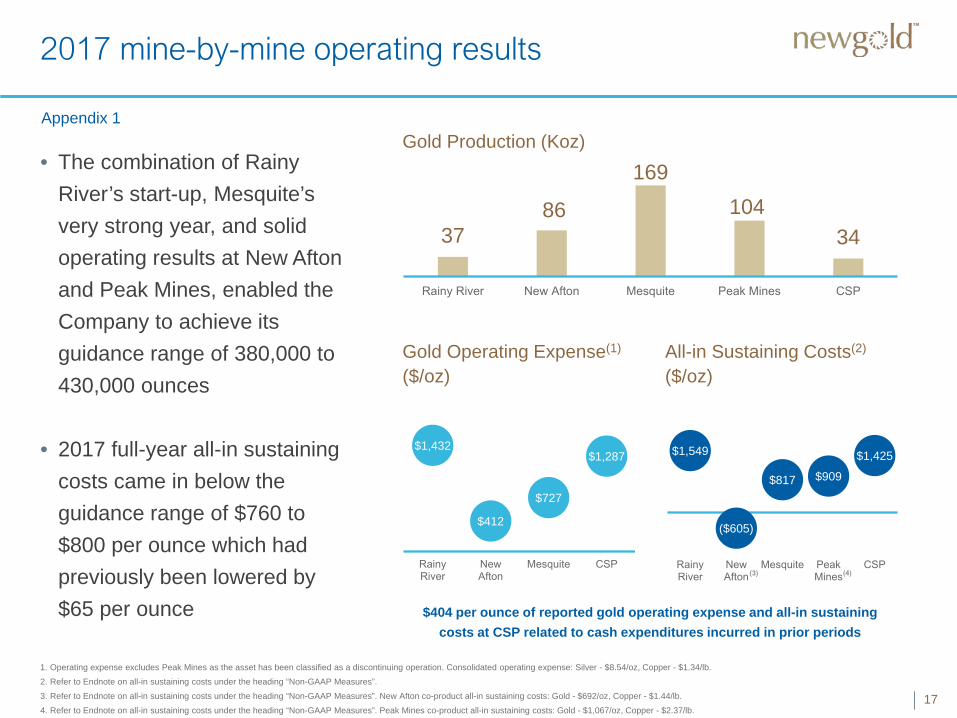
$404 per ounce of reported gold operating expense and all-in sustaining costs at CSP related to cash expenditures incurred in prior periods
Gold Production (Koz)
Gold Operating Expense(1)
($/oz)All-in Sustaining Costs(2)
($/oz)
• The combination of Rainy River’s start-up, Mesquite’s very strong year, and solid operating results at New Afton and Peak Mines, enabled the Company to achieve its guidance range of 380,000 to 430,000 ounces
• 2017 full-year all-in sustaining costs came in below the guidance range of $760 to $800 per ounce which had previously been lowered by $65 per ounce
Appendix 1
18
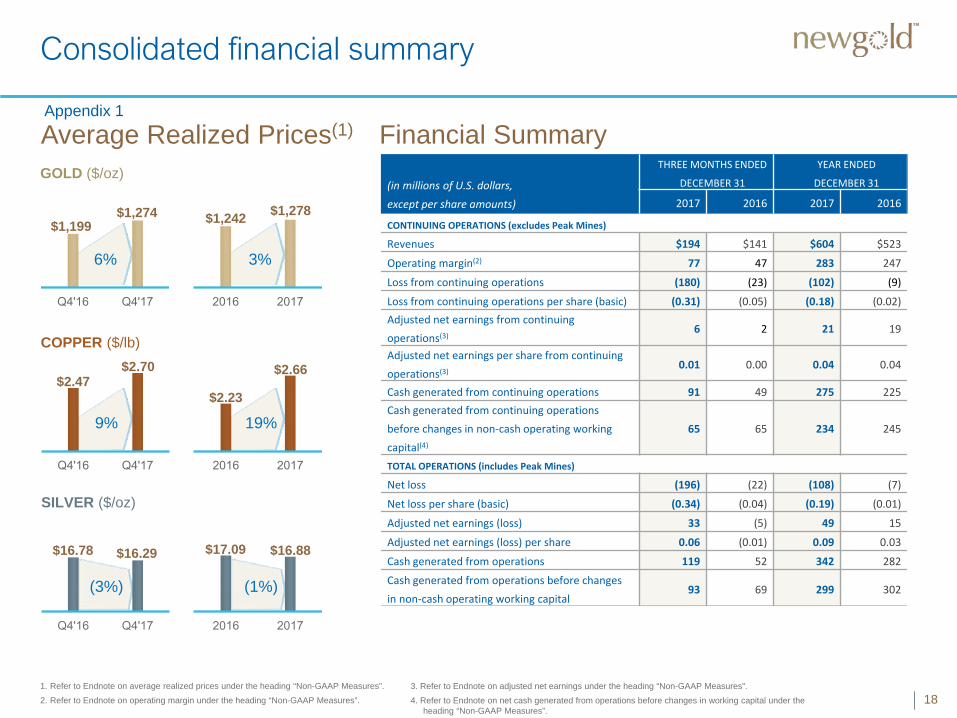
Consolidated financial summary
1. Refer to Endnote on average realized prices under the heading “Non-GAAP Measures”.2. Refer to Endnote on operating margin under the heading “Non-GAAP Measures”.
3. Refer to Endnote on adjusted net earnings under the heading “Non-GAAP Measures”.4. Refer to Endnote on net cash generated from operations before changes in working capital under the
heading “Non-GAAP Measures”.
Financial SummaryGOLD ($/oz)
6%
COPPER ($/lb)
SILVER ($/oz)
Average Realized Prices(1)
$1,274$1,199
$2.47
(in millions of U.S. dollars, except per share amounts)
THREE MONTHS ENDED
DECEMBER 31
YEAR ENDED
DECEMBER 31
2017 2016 2017 2016
CONTINUING OPERATIONS (excludes Peak Mines)
Revenues $194 $141 $604 $523
Operating margin(2) 77 47 283 247
Loss from continuing operations (180) (23) (102) (9)
Loss from continuing operations per share (basic) (0.31) (0.05) (0.18) (0.02)Adjusted net earnings from continuing operations(3)
6 2 21 19
Adjusted net earnings per share from continuing operations(3)
0.01 0.00 0.04 0.04
Cash generated from continuing operations 91 49 275 225Cash generated from continuing operations before changes in non-cash operating working capital(4)
65 65 234 245
TOTAL OPERATIONS (includes Peak Mines)
Net loss (196) (22) (108) (7)
Net loss per share (basic) (0.34) (0.04) (0.19) (0.01)
Adjusted net earnings (loss) 33 (5) 49 15
Adjusted net earnings (loss) per share 0.06 (0.01) 0.09 0.03
Cash generated from operations 119 52 342 282
Cash generated from operations before changes in non-cash operating working capital
93 69 299 302
$16.78
$1,278$1,242
$2.70
$2.23
$2.66
$16.29 $17.09 $16.88
3%
9% 19%
(3%) (1%)
Appendix 1

2018 guidance and all-in sustaining costs sensitivities
19
CATEGORY COPPER PRICE CDN/USD
Base Assumption $3.20 $1.25
Sensitivity +/-$0.10 +/-$0.05
COST PER OUNCE IMPACT
Rainy River – +/-$40
New Afton +/-$135 +/-$100
Mesquite – –
Cerro San Pedro – –
New Gold Total +/-$15 +/-$30
1. Refer to Endnote on all-in sustaining costs under the heading “Non-GAAP Measures”.
Appendix 1
A light of previously noted copper collars, at prices above $3.37 per pound, or below $3.00 per pound, only approximately 20 million pounds of the Company’s estimated copper production would be impacted by further copper price movements, thus significantly reducing the impact on New Afton and consolidated all-in sustaining costs
Gold Production Copper Production Operating Expense Operating Expense All-in Sustaining Costs
(thousand ounces) (million pounds) ($ per gold ounce) ($ per copper pound) ($ per gold ounce)
Rainy River 310 - 350 – $430 - $470 – $990 - $1,090
New Afton 55 - 65 75 - 85 $455 - $495 $1.10 - $1.30 ($1,020) - ($980)
Mesquite 140 -150 – $890 - $930 – $1,005 - $1,045
Cerro San Pedro 20 - 30 – $1,255 - $1,295 – $1,330 - $1,370
New Gold Total 525 - 595 75 - 85 $555 - $595 $1.35 - $1.55 $860 - $900
2018 Guidance
2018 All-in sustaining costs sensitivities

2018 capital expenditures by category
20
Rainy River
New Afton
Mesquite
Rainy River
Blackwater
New Afton
Total Capital Expenditures~$280 million
Growth Capital
~$35million
Sustaining Capital
~$245million
$10 million
$40 million
$195 million
$5 million
$10 million
$20 million
Appendix 1
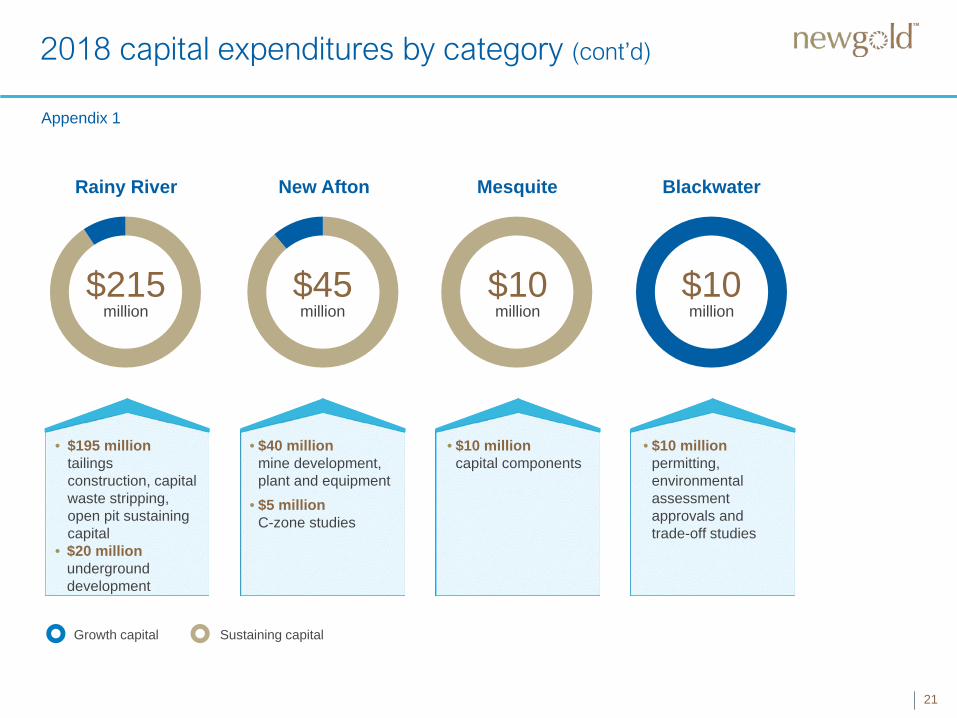
2018 capital expenditures by category (cont’d)
21
Rainy River New Afton
• $195 million tailings construction, capital waste stripping, open pit sustaining capital
• $20 millionunderground development
• $40 millionmine development, plant and equipment
• $5 millionC-zone studies
Growth capital Sustaining capital
Mesquite Blackwater
• $10 millioncapital components
• $10 million permitting, environmental assessment approvals and trade-off studies
$215 million
$45 million
$10 million
$10 million
Appendix 1

Rainy River site layout
Appendix 2
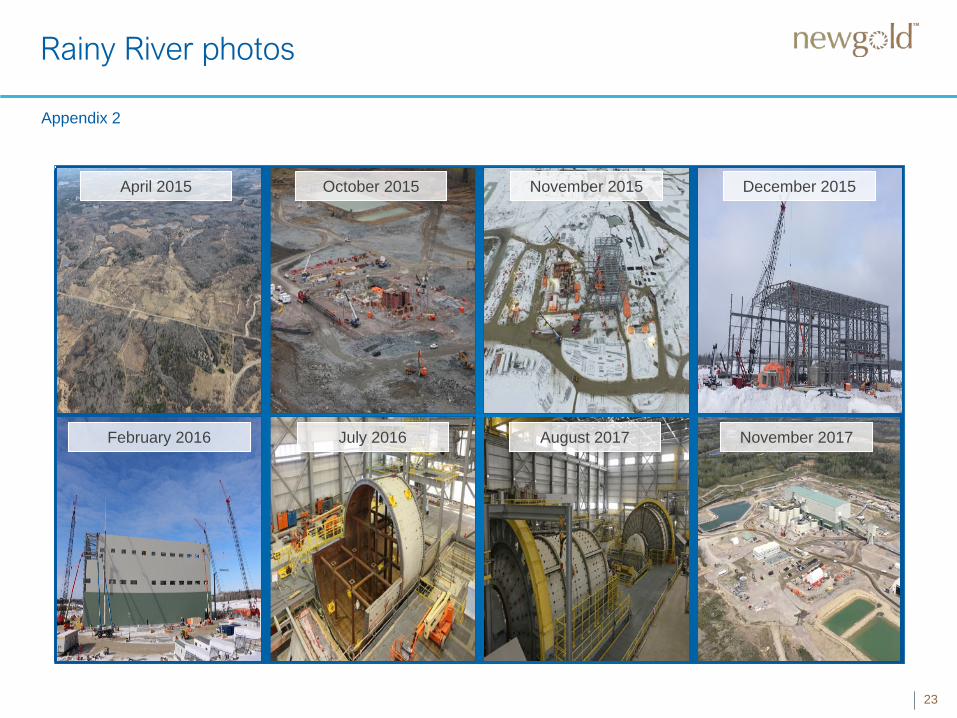
Rainy River photos
23
November 2015October 2015
Appendix 2
April 2015 December 2015
February 2016 July 2016 November 2017August 2017
24
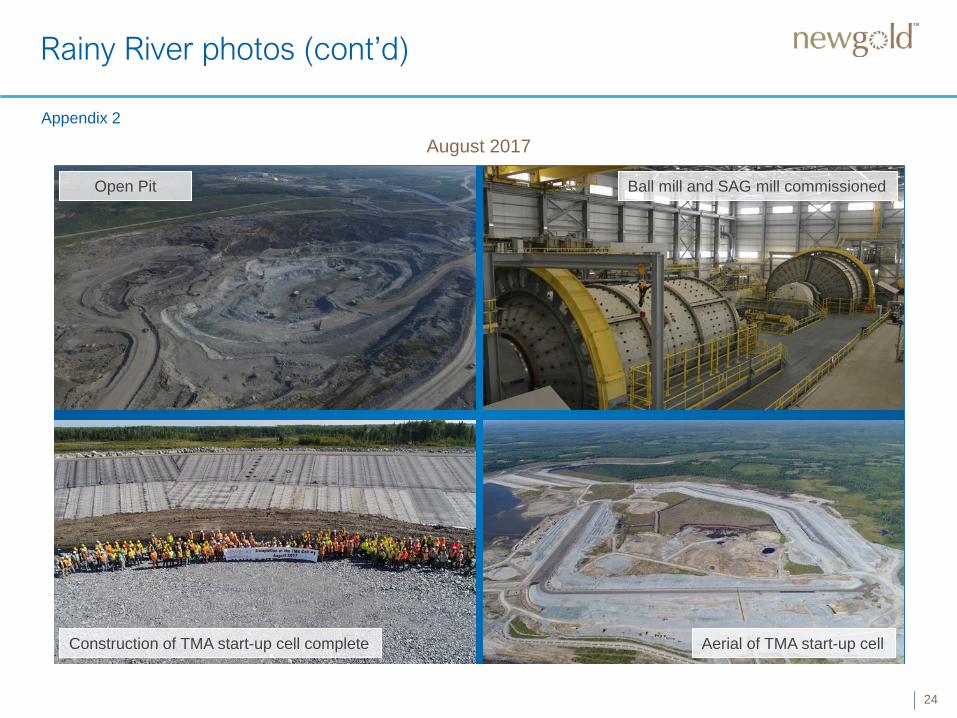
August 2017
Rainy River photos (cont’d)
Appendix 2
Open Pit Ball mill and SAG mill commissioned
Construction of TMA start-up cell complete Aerial of TMA start-up cell

Blackwater Next flagship project already in portfolio
25
Jurisdiction Significant Gold Reserve(1)
8.2 Moz
Silver Reserve(1)
60.8 Koz
Land Package
1,487 km2
Environmental Assessment permits expected in mid-2018
1. For a detailed breakdown of Mineral Resources and Reserves by category, refer to New Gold’s December 31, 2016 MD&A. Refer to Endnotes under the heading “Cautionary note to U.S. readers concerning estimates of Mineral Reserves and Mineral Resources” and “Technical Information”.
British Columbia, Canada
Internal trade-off studies underway to enhance project economics and
maximize free cash flow
2018 Plan
Appendix 3

Mineral reserves and resources summary
261. 2016 information per Annual Information Form dated March 30, 2017.
AS AT DECEMBER 31, 2017 AS AT DECEMBER 31, 2016
GOLD Koz
SILVER Moz
COPPER Mlbs
GOLD Koz
SILVER Moz
COPPER Mlbs
Proven and Probable reserves 14,795 77 941 14,453 75 1,033
Rainy River 4,418 13 – 3,943 10 –
New Afton 1,078 4 941 1,161 – –
Mesquite 1,129 – – 1,179 – –
Blackwater 8,170 61 – 8,170 61 –
Measured and Indicated resources (exclusive of reserves) 5,597 19 968 5,844 20 950
Inferred resources 1,140 4 131 1,466 4 137
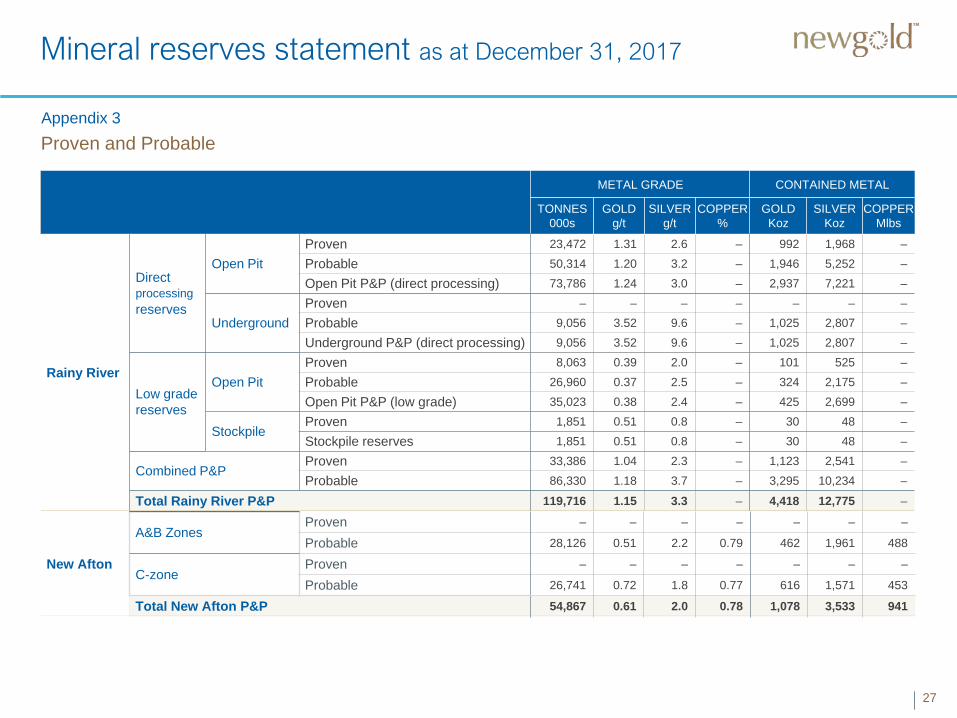
Mineral Reserves and Resources SummaryAppendix 3
27
New Afton
A&B ZonesProven – – – – – – –
Probable 28,126 0.51 2.2 0.79 462 1,961 488
C-zoneProven – – – – – – –
Probable 26,741 0.72 1.8 0.77 616 1,571 453
Total New Afton P&P 54,867 0.61 2.0 0.78 1,078 3,533 941
Mineral reserves statement as at December 31, 2017
Proven and Probable Appendix 3
METAL GRADE CONTAINED METAL
TONNES000s
GOLDg/t
SILVERg/t
COPPER%
GOLDKoz
SILVERKoz
COPPERMlbs
Rainy River
Direct processingreserves
Open PitProven 23,472 1.31 2.6 – 992 1,968 –Probable 50,314 1.20 3.2 – 1,946 5,252 –Open Pit P&P (direct processing) 73,786 1.24 3.0 – 2,937 7,221 –
UndergroundProven – – – – – – –Probable 9,056 3.52 9.6 – 1,025 2,807 –Underground P&P (direct processing) 9,056 3.52 9.6 – 1,025 2,807 –
Low grade reserves
Open PitProven 8,063 0.39 2.0 – 101 525 –Probable 26,960 0.37 2.5 – 324 2,175 –Open Pit P&P (low grade) 35,023 0.38 2.4 – 425 2,699 –
StockpileProven 1,851 0.51 0.8 – 30 48 –Stockpile reserves 1,851 0.51 0.8 – 30 48 –
Combined P&PProven 33,386 1.04 2.3 – 1,123 2,541 –Probable 86,330 1.18 3.7 – 3,295 10,234 –
Total Rainy River P&P 119,716 1.15 3.3 – 4,418 12,775 –

28
METAL GRADE CONTAINED METAL
TONNES000s
GOLDg/t
SILVERg/t
COPPER%
GOLDKoz
SILVERKoz
COPPERMlbs
Blackwater
Direct processingmaterial
Proven 124,500 0.95 5.5 – 3,790 22,100 –Probable 169,700 0.68 4.1 – 3,730 22,300 –P&P (direct processing) 294,200 0.79 4.7 – 7,520 44,400 –
Low grade reservesProven 20,100 0.50 3.6 – 325 2,300 –Probable 30,100 0.34 14.6 – 325 14,100 –P&P (stockpile) 50,200 0.40 10.2 – 650 16,400 –
Total Blackwater P&P 344,400 0.74 5.5 – 8,170 60,800 –
Total P&P 14,795 77,108 941
Mineral reserves statement as at December 31, 2017
Proven and Probable continuedAppendix 3
MesquiteProven 5,627 0.49 – – 89 – –
Probable 59,491 0.54 – – 1,040 – –
Total Mesquite P&P 65,119 0.54 – – 1,129 – –

29
Mineral reserves statement as at December 31, 2017
Appendix 3
METAL GRADE CONTAINED METAL
TONNES000s
GOLDg/t
SILVERg/t
COPPER%
GOLDKoz
SILVERKoz
COPPERMlbs
Rainy River
Direct processingresources
Open PitMeasured 2,556 1.11 3.2 – 91 266 –Indicated 24,995 1.10 3.4 – 884 2,711 –Open Pit M&I (direct processing) 27,551 1.10 3.4 – 975 2,977 –
UndergroundMeasured – – – – – – –Indicated 6,223 2.93 9.0 – 587 1,808 –Open Pit M&I (direct processing) 6,223 2.93 9.0 – 587 1,808 –
Low grade resources Open Pit
Measured 2,023 0.36 2.3 – 23 150 –Indicated 22,290 0.36 2.3 – 258 1,634 –Open Pit M&I (low grade) 24,313 0.36 2.3 – 282 1,784 –
Combined M&IMeasured 4,579 0.78 2.8 – 115 417 –Indicated 53,508 1.00 3.6 – 1,729 6,152 –
Total Rainy River M&I 58,087 0.99 3.5 – 1,844 6,569 –
Measured and Indicated (Exclusive of Reserves)
New Afton
A&B ZonesMeasured 17,155 0.63 2.0 0.83 348 1,090 313Indicated 10,689 0.46 2.4 0.68 159 824 159A&B Zone M&I 27,844 0.57 2.1 0.77 507 1,909 473
C-zoneMeasured 6,424 0.91 2.3 1.07 188 471 152Indicated 11,918 0.74 2.1 0.88 284 816 231C-zone M&I 18,342 0.80 2.2 0.95 472 1,284 383
HW LensMeasured – – – – – – –Indicated 11,841 0.50 2.0 0.43 191 750 111HW Lens M&I 11,841 0.50 2.0 0.43 191 750 111
Total New Afton M&I 58,038 0.63 2.1 0.76 1,170 3,970 968

Mineral resources statement as at December 31, 2017
30
METAL GRADE CONTAINED METAL
TONNES000s
GOLDg/t
SILVERg/t
COPPER%
GOLDKoz
SILVERKoz
COPPERMlbs
Blackwater
Direct processingresources
Measured 288 1.39 6.6 – 13 61 –
Indicated 45,440 0.84 4.7 – 1,227 6,866 –
M&I (direct processing) 45,728 0.84 4.7 – 1,240 6,927 –
Low grade resourcesMeasured 11 0.29 7.4 – – 3 –
Indicated 15,831 0.32 3.9 – 162 1,985 –
M&I (low grade) 15,842 0.32 3.9 – 162 1,988 –
Total Blackwater M&I 61,570 0.71 4.5 – 1,402 8,915 –
Total M&I Exclusive of Reserves 5,597 19,454 968
Measured and Indicated (Exclusive of Reserves) continuedAppendix 3
MesquiteMeasured 4,297 0.43 – – 59 – –
Indicated 75,859 0.46 – – 1,122 – –
Total Mesquite M&I 80,156 0.46 – – 1,181 – –

Mineral resources statement as at December 31, 2017
31
METAL GRADE CONTAINED METAL
TONNES000s
GOLDg/t
SILVERg/t
COPPER%
GOLDKoz
SILVERKoz
COPPERMlbs
Rainy River
Direct processing
Open Pit 6,016 1.20 3.4 – 232 650 –
Underground 1,271 3.68 3.8 – 150 156 –
Total Direct Processing 7,286 1.63 3.4 – 382 806 –
Low grade material Open Pit 6,219 0.37 1.6 – 74 318 –
Total Rainy River Inferred 13,505 1.05 2.6 – 456 1,124 –
BlackwaterDirect processing 13,933 0.76 4.0 – 341 1,792 –
Low grade resources 4,225 0.32 3.5 – 44 475 –
Total Blackwater Inferred 18,159 0.66 3.9 – 385 2,267 –
Inferred
Total Inferred 1,140 4,038 131
Appendix 3
New Afton
A&B Zones 7,564 0.35 1.3 0.35 85 322 58
C-zone 7,688 0.43 1.3 0.48 106 325 72
HW Lens – – – – – – –
Total New Afton Inferred 15,253 0.39 1.3 0.41 192 647 131
Mesquite 8,871 0.38 – – 107 – –

Mineral resources statement as at December 31, 2017
32
Inferred
METAL GRADE CONTAINED METAL
TONNES000s
GOLDg/t
SILVERg/t
COPPER%
LEAD%
ZINC%
GOLDKoz
SILVERKoz
COPPERMlbs
LEADMlbs
ZINCMlbs
Peak Mines
Gold-Copper resources 2,620 1.32 6.4 1.94 NA NA 113 553 115 NA NA
Silver-Lead-Zinc resources 2,300 1.95 29.4 0.29 4.73 5.76 140 2,200 15 240 290
Total Peak Inferred
Appendix 3
MINERAL RESERVES
METAL GRADE CONTAINED METAL
TONNES000s
GOLDg/t
SILVERg/t
COPPER%
GOLDKoz
SILVERKoz
COPPERMlbs
Proven 1,460 2.94 9.9 1.42 138 464 46Probable 1,400 2.41 8.6 1.24 107 381 38Total Peak Mines P&P 2,860 2.68 9.2 1.33 246 845 84
MEASURED AND INDICATED RESOURCES EXCLUSIVE OF RESERVESMeasured 1,500 3.11 7.8 1.01 150 370 33Indicated 4,100 1.74 6.4 1.70 230 850 150Total Peak Mines M&I 5,600 2.10 6.8 1.52 380 1,200 190
Proven and Probable / Measured & Indicated
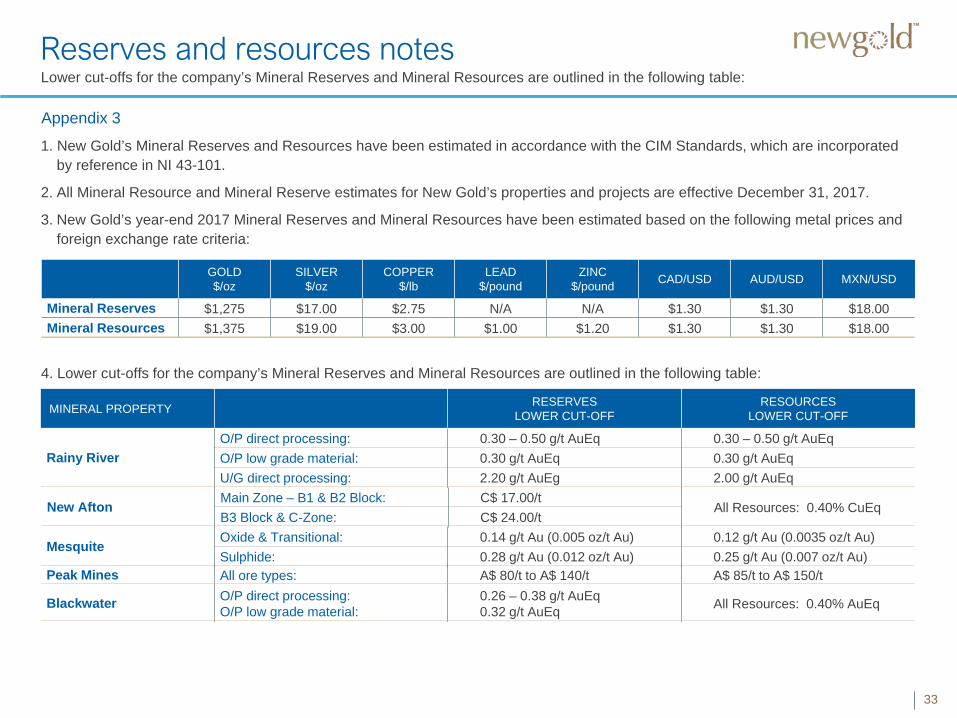
Reserves and resources notes
33
MINERAL PROPERTY RESERVESLOWER CUT-OFF
RESOURCESLOWER CUT-OFF
GOLD $/oz
SILVER $/oz
COPPER$/lb
LEAD$/pound
ZINC$/pound CAD/USD AUD/USD MXN/USD
Mineral Reserves $1,275 $17.00 $2.75 N/A N/A $1.30 $1.30 $18.00 Mineral Resources $1,375 $19.00 $3.00 $1.00 $1.20 $1.30 $1.30 $18.00
1. New Gold’s Mineral Reserves and Resources have been estimated in accordance with the CIM Standards, which are incorporatedby reference in NI 43-101.
2. All Mineral Resource and Mineral Reserve estimates for New Gold’s properties and projects are effective December 31, 2017.
3. New Gold’s year-end 2017 Mineral Reserves and Mineral Resources have been estimated based on the following metal prices and foreign exchange rate criteria:
Lower cut-offs for the company’s Mineral Reserves and Mineral Resources are outlined in the following table:
Blackwater O/P direct processing:O/P low grade material:
0.26 – 0.38 g/t AuEq0.32 g/t AuEq All Resources: 0.40% AuEq
Rainy RiverO/P direct processing: 0.30 – 0.50 g/t AuEq 0.30 – 0.50 g/t AuEqO/P low grade material: 0.30 g/t AuEq 0.30 g/t AuEqU/G direct processing: 2.20 g/t AuEg 2.00 g/t AuEq
4. Lower cut-offs for the company’s Mineral Reserves and Mineral Resources are outlined in the following table:
Appendix 3
New Afton Main Zone – B1 & B2 Block: C$ 17.00/tAll Resources: 0.40% CuEq
B3 Block & C-Zone: C$ 24.00/t
Mesquite Oxide & Transitional: 0.14 g/t Au (0.005 oz/t Au) 0.12 g/t Au (0.0035 oz/t Au)Sulphide: 0.28 g/t Au (0.012 oz/t Au) 0.25 g/t Au (0.007 oz/t Au)
Peak Mines All ore types: A$ 80/t to A$ 140/t A$ 85/t to A$ 150/t
Reserves and resources notes (cont’d)
34
5. New Gold reports its measured and indicated mineral resources exclusive of mineral reserves. Measured and indicated mineral resources that are not mineral reserves do not have demonstrated economic viability. Inferred Mineral Resources have a greater amount of uncertainty as to their existence, economic and legal feasibility, do not have demonstrated economic viability, and are likewise exclusive of mineral reserves. Numbers may not add due to rounding.
6. Mineral Resources are classified as Measured, Indicated and Inferred based on relative levels of confidence in their estimation and on technical and economic parameters consistent with the methods most suitable to their potential commercial exploitation. Wheredifferent mining and/or processing methods might be applied to different portions of a Mineral Resource, the designators ‘open pit’ and ‘underground’ are used to indicate the envisioned mining method. The designators ‘oxide’, ‘non-oxide’ and ‘sulphide’ have likewise been applied to indicate the type of mineralization as it relates to the appropriate mineral processing method and expected payable metal recoveries, and the designators ‘direct processing’ and ‘stockpile’ have been applied to differentiate materialenvisioned to be mined and processed directly from material to be mined and stored in a stockpile for future processing. MineralReserves and Mineral Resources may be materially affected by environmental, permitting, legal, title, taxation, sociopolitical, marketing and other risks and relevant issues. Additional details regarding Mineral Reserve and Mineral Resource estimation, classification, reporting parameters, key assumptions and associated risks for each of New Gold’s material properties are provided in the respective NI 43-101 Technical Reports, which are available at www.sedar.com.
7. Rainy River Project: In addition to the criteria described above, Mineral Reserves and Mineral Resources for the Rainy River project are reported according to the following additional criteria: Underground Mineral Reserves are reported peripheral to and/or below the open pit Mineral Reserve pit shell, which has been designed and optimized based on an $1,275/oz gold price. Underground Mineral Resources are reported below a larger Mineral Resource pit shell, which has been defined based on a $1,375/oz gold price. Approximately forty percent (40%) of the gold metal content defined as underground Mineral Reserves is derived from material located between the Mineral Reserve pit shell and the Mineral Resource pit shell; the remaining sixty percent (60%) of the metalcontent defined as underground Mineral Reserves is derived from material located below the Mineral Resource pit shell. Open pitMineral Resources exclude material reported as underground Mineral Reserves.
8. Qualified Person: The preparation of New Gold's Mineral Reserve and Mineral Resource estimates has been done by Qualified Persons as defined under NI 43-101, under the oversight and review of Mr. Mark A. Petersen, a Qualified Person under NI 43-101.
Appendix 3

2018 guidance assumptions
Commodity price/foreign exchange assumptions
35
Spot
SPOT
Gold price ($/oz) 1,345
Silver price ($/oz) 16.55
Copper price ($/lb) 3.00
CDN/USD 1.29
MXN/USD 18.55
2018
Silver price ($/oz) 17.00
Copper price ($/lb) 3.20
CDN/USD 1.25
MXN/USD 18.00
Appendix 3

Endnotes
36
CAUTIONARY NOTE TO U.S. READERS CONCERNING ESTIMATES OF MINERAL RESERVES AND MINERAL RESOURCESInformation concerning the properties and operations of New Gold has been prepared in accordance with Canadian standards under applicable Canadian securities laws, and may not be comparable to similar information for United States companies. The terms “Mineral Resource”, “Measured Mineral Resource”, “Indicated Mineral Resource” and “Inferred Mineral Resource” used in this news release are Canadian mining terms as defined in the Canadian Institute of Mining, Metallurgy and Petroleum (“CIM”) Definition Standards for Mineral Resources and Mineral Reserves adopted by CIM Council on May 10, 2014 and incorporated by reference in National Instrument 43-101. While the terms “Mineral Resource”, “Measured Mineral Resource”, “Indicated Mineral Resource” and “Inferred Mineral Resource” are recognized and required by Canadian securities regulations, they are not defined terms under standards of the United States Securities and Exchange Commission. As such, certain information contained in this news release concerning descriptions of mineralization and mineral resources under Canadian standards is not comparable to similar information made public by United States companies subject to the reporting and disclosure requirements of the United States Securities and Exchange Commission. An “Inferred Mineral Resource” has a great amount of uncertainty as to its existence and as to its economic and legal feasibility. Under Canadian rules, estimates of inferred mineral resources may not form the basis of feasibility or pre-feasibility studies. It cannot be assumed that all or any part of an “Inferred Mineral Resource” will ever be upgraded to a higher confidence category. Readers are cautioned not to assume that all or any part of an “Inferred Mineral Resource” exists or is economically or legally mineable.Under United States standards, mineralization may not be classified as a “Reserve” unless the determination has been made that the mineralization could be economically and legally produced or extracted at the time the reserve estimation is made. Readers are cautioned not to assume that all or any part of the measured or indicated mineral resources will ever be converted into mineral reserves. In addition, the definitions of “Proven Mineral Reserves” and “Probable Mineral Reserves” under CIM standards differ in certain respects from the standards of the United States Securities and Exchange Commission.
TECHNICAL INFORMATIONThe scientific and technical information relating to the operation of New Gold’s operating mines contained herein has been reviewed and approved by Mr. Nicholas Kwong, Director, Business Improvement of New Gold. All other scientific and technical information contained herein has been reviewed and approved by Mr. Mark A. Petersen, Vice President, Exploration of New Gold. Mr. Kwong is a Professional Engineer and a member of the Association of Professional Engineers and Geoscientists of British Columbia. Mr. Petersen is a SME Registered Member and AIPG Certified Professional Geologist. Mr. Kwong and Mr. Petersen are "Qualified Persons" for the purposes of Canadian NI 43-101.For additional technical information on New Gold’s material properties, including a detailed breakdown of Mineral Reserves and Mineral Resources by category, as well as key assumptions, parameters and risks, refer to New Gold’s Annual Information Form for the year ended December 31, 2016 filed on www.sedar.com.
NON-GAAP MEASURES
(1) ALL-IN SUSTAINING COSTS“All-in sustaining costs” per ounce is a non-GAAP financial measure. Consistent with guidance announced in 2013 by the World Gold Council, an association of various gold mining companies from around the world of which New Gold is a member, New Gold defines “all-in sustaining costs” per ounce as the sum of total cash costs, capital expenditures that are sustaining in nature (as presented in the cash flow statement), corporate general and administrative costs, capitalized and expensed exploration that is sustaining in nature and environmental reclamation costs, all divided by the ounces of gold sold to arrive at a per ounce figure. New Gold believes this non-GAAP financial measure provides further transparency into costs associated with producing gold and assists analysts, investors and other stakeholders of the Company in assessing the Company’s operating performance, its ability to generate free cash flow from current operations and its overall value. This data is furnished to provide additional information and is a non-GAAP financial measure. All-in sustaining costs presented do not have a standardized meaning under IFRS and may not be comparable to similar measures presented by other mining companies. It should not be considered in isolation or as a substitute for measures of performance prepared in accordance with IFRS and is not necessarily indicative of cash flow from operations under IFRS or operating costs presented under IFRS. Further details regarding historical all-in sustaining costs and a reconciliation to the nearest IFRS measures are provided in the MD&A accompanying New Gold’s financial statements filed from time to time on www.sedar.com. “Sustaining costs” is a non-GAAP financial measure. New Gold defines sustaining costs as the difference between all-in sustaining costs and total cash costs, being the sum of net capital expenditures that are sustaining in nature, corporate general and administrative costs, capitalized and expensed exploration that is sustaining in nature, and environmental reclamation costs. Management uses sustaining costs to understand the aggregate net result of the drivers of all-in sustaining costs other than total cash costs. The line items between cash costs and all in sustaining costs in the tables below break down the components of sustaining costs. Sustaining costs is intended to provide additional information only and does not have any standardized meaning under IFRS and may not be comparable to similar measures presented by other mining companies. It should not be considered in isolation or as a substitute for measures of performance prepared in accordance with IFRS.

Endnotes
37
(2) TOTAL CASH COSTS “Total cash costs” per ounce is a non-GAAP financial measure which is calculated in accordance with a standard developed by The Gold Institute, a worldwide association of suppliers of gold and gold products that ceased operations in 2002. Adoption of the standard is voluntary and the cost measures presented may not be comparable to other similarly titled measures of other companies. New Gold reports total cash costs on a sales basis. The Company believes that certain investors use this information to evaluate the Company’s performance and ability to generate liquidity through operating cash flow to fund future capital expenditures and working capital needs. This measure, along with sales, is considered to be a key indicator of the Company’s ability to generate operating earnings and cash flow from its mining operations. Total cash costs include mine site operating costs such as mining, processing and administration costs, royalties, production taxes, and realized gains and losses on fuel contracts, but are exclusive of amortization, reclamation, capital and exploration costs and net of by-product sales. Total cash costs are then divided by ounces of gold sold to arrive at a per ounce figure. Co-product cash costs remove the impact of other metal sales that are produced as a by-product of gold production and apportion the cash costs to each metal produced on a percentage of revenue basis, and subsequently divides the amount by the total ounces of gold or silver or pounds of copper sold, as the case may be, to arrive at per ounce or per pound figures. Unless otherwise indicated, all total cash cost information in this news release is net of by-product sales. This data is furnished to provide additional information and is a non-GAAP financial measure. Total cash costs and co-product cash costs presented do not have a standardized meaning under IFRS and may not be comparable to similar measures presented by other mining companies. It should not be considered in isolation or as a substitute for measures of performance prepared in accordance with IFRS and is not necessarily indicative of cash flow from operations under IFRS or operating costs presented under GAAP. Further details regarding historical total cash costs and a reconciliation to the nearest IFRS measures are provided in the MD&A accompanying New Gold’s financial statements filed from time to time on www.sedar.com.
(3) CASH GENERATED FROM OPERATIONS BEFORE CHANGES IN WORKING CAPITAL“Cash generated from operations before changes in working capital” is a non-GAAP financial measure with no standard meaning under IFRS, excludes changes in non-cash operating working capital. Management uses this measure to evaluate the Company’s ability to generate cash from its operations before working capital changes. Further details regarding cash generated from operations before changes in working capital and a reconciliation to the nearest IFRS measure is provided in the MD&A accompanying New Gold’s financial statements filed from time to time on www.sedar.com.
(4) ADJUSTED NET EARNINGS/(LOSS)“Adjusted net earnings/(loss)” and “adjusted net earnings/(loss) per share” are non-GAAP financial measures. Net earnings/(loss) have been adjusted and tax affected for the group of costs in “Other gains and losses” on the condensed consolidated income statement. The adjusted entries are also impacted for tax to the extent that the underlying entries are impacted for tax in the unadjusted net earnings/(loss) from continuing operations. The Company uses this measure for its own internal purposes. Management’s internal budgets and forecasts and public guidance do not reflect fair value changes on senior notes and non-hedged derivatives, foreign currency translation and fair value through profit or loss and financial asset gains/losses.
Consequently, the presentation of adjusted net earnings and adjusted net earnings per share enables investors and analysts to better understand the underlying operating performance of our core mining business through the eyes of management. Management periodically evaluates the components of adjusted net earnings and adjusted net earnings per share based on an internal assessment of performance measures that are useful for evaluating the operating performance of our business and a review of the non-GAAP measures used by mining industry analysts and other mining companies. Adjusted net (loss)/earnings and adjusted net (loss)/earnings per share are intended to provide additional information only and do not have any standardized meaning under IFRS and may not be comparable to similar measures presented by other companies. They should not be considered in isolation or as a substitute for measures of performance prepared in accordance with IFRS. The measures are not necessarily indicative of operating profit or cash flows from operations as determined under IFRS.
5) AVERAGE REALIZED PRICE“Average realized price per ounce or pound sold” is a non-GAAP financial measure with no standard meaning under IFRS. Management uses this measure to better understand the price realized in each reporting period for gold, silver, and copper sales. Average realized price is intended to provide additional information only and does not have any standardized definition under IFRS; it should not be considered in isolation or as a substitute for measures of performance prepared in accordance with IFRS. Other companies may calculate this measure differently and this measure is unlikely to be comparable to similar measures presented by other companies. Further details regarding average realized price and a reconciliation to the nearest IFRS measure is provided in the MD&A accompanying New Gold’s financial statements filed from time to time on www.sedar.com.
(6) OPERATING MARGIN“Operating margin” is a non-GAAP financial measure with no standard meaning under IFRS, which management uses to evaluate the Company’s aggregated and mine-by-mine contribution to net earnings before non-cash depreciation and depletion charges.

JULIE TAYLORDirector, Corporate Communications and
Investor Relations
Investor Relations


