Page 1
[email protected] ://www.powerworld.com
2001 South First StreetChampaign, Illinois 61820+1 (217) 384.6330
2001 South First StreetChampaign, Illinois 61820+1 (217) 384.6330
PowerWorld Simulator
Quick‐Start Guide
Page 2
2© 2013 PowerWorld CorporationSimulator Quick‐Start Guide
• This quick‐start guide is intended to provide a brief explanation of the essentials to analyzing power systems with PowerWorld Simulator
• It is not comprehensive• Greater detail is available in our full‐length training, on‐line or in‐person
• Other quick‐start guides discuss specific advanced features of Simulator
• For more details, visit http://www.powerworld.com/training/online‐training
Purpose
Page 3
3© 2013 PowerWorld CorporationSimulator Quick‐Start Guide
• Opening a power flow case (raw, epc, pwb)• Solving a case• Browsing power system elements with the Model Explorer
• One‐line diagrams• Limit Monitoring Settings
Outline
Page 4
4© 2013 PowerWorld CorporationSimulator Quick‐Start Guide
• PowerWorld Simulator can open files in the following text‐based formats:– Siemens PTI PSS/E
• *.raw file extension• Common with FERC 715 filings and ISO cases
– GE PSLF• *.epc file extension• Common in the North American WECC
– Other specific formats for real‐time EMS models• Simulator also has a proprietary binary format with *.pwb extension
Opening an Existing Power Flow Case
Page 5
5© 2013 PowerWorld CorporationSimulator Quick‐Start Guide
• Click the File Menu in the upper left• Choose Open Case…• From the drop‐down box in the lower right, choose PTI Raw Data (.raw)
• Open the sample case Midwest.raw (available from the PowerWorld training website), or open any case that you need to analyze
Example
Page 6
6© 2013 PowerWorld CorporationSimulator Quick‐Start Guide
• For the data in a power flow case to be considered valid, a set of non‐linear equations must be solved
• First, open the Message Log from the Toolsribbon tab (Tools Log)
Solving the Case
Page 7
7© 2013 PowerWorld CorporationSimulator Quick‐Start Guide
• Next, choose Single Solution – Full Newton, also on the Tools ribbon tab
• A series of nested loops should solve and a successful solution should be reported in the Message Log
• If the solution is successful, proceed to slide 15
Solving the Case
Page 8
8© 2013 PowerWorld CorporationSimulator Quick‐Start Guide
• The case may not solve if:– It was not solved by the
entity that created the file– It was solved, but with
different controller settings than the Simulator defaults
– There are certain kinds of data errors
• If the case fails to solve, you will see a message in the log and a pop‐up window
What if the Case Does not Solve?
Page 9
9© 2013 PowerWorld CorporationSimulator Quick‐Start Guide
• Unless the case was not solved by the entity that created the file, this will normally work
• Choose Tools Restore State before failed solution attempt
• Open Tools Simulator Options…
• Check boxes– Disable Automatic Generation
Control (AGC)– Disable Switched Shunt (SS)
Control– Disable LTC Transformer Control– Disable Phase Shifter Control
• Click OK, then solve the case (Single Solution – Full Newton)
Try to Solve with Controllers Disabled
Page 10
10© 2013 PowerWorld CorporationSimulator Quick‐Start Guide
• Turn on the Switched Shunt Controllers First (uncheck the box in Tools Simulator Options…)
• Solve Power Flow (Single Solution – Full Newton)• Then turn on the LTCs• Solve Power Flow• Then turn on the Phase Shifters• Solve Power Flow• If the power flow fails to solve at any of these stages, it is
likely that the controller option was not applied in the original solution– Restore the system state, uncheck the last option, and re‐solve– You may still try enabling the other controllers
Now Restore the Voltage Controllers
Page 11
11© 2013 PowerWorld CorporationSimulator Quick‐Start Guide
• Before you try to enable the AGC, ensure that the case was truly solved with AGC control
• The best way to check:– Open Model Explorer (Case Information Model Explorer…)
– Open the folder Aggregations, then choose Areas– Look at the “ACE MW” column– If values are very large, then the case was probably not solved with AGC
Automatic Generation Control (AGC)
Page 12
12© 2013 PowerWorld CorporationSimulator Quick‐Start Guide
• If the ACE values are small, you can probably enable the AGC and solve the case
• Otherwise, you can either leave the AGC disabled, or enable it and adjust the area interchange
Automatic Generation Control (AGC)
Page 13
13© 2013 PowerWorld CorporationSimulator Quick‐Start Guide
• Each Area can have an export specified which does not have a “receiving” end specified
• The Area display in the Model Explorer includes a column “Unspec. MW Inter.”, usually on the far right
• These unspecified values should sum to zero. – If they do not sum to zero, you have an “export to nowhere”
– When this occurs, the Area with the slack bus will be turned off AGC and all unspecified interchange will be sent to the island slack bus
Area Unspecified MW Interchange
Page 14
14© 2013 PowerWorld CorporationSimulator Quick‐Start Guide
• In the Model Explorer, Open the folder Aggregations, then choose MW Transactions
• On the Case Info Toolbar, choose Records, Clear Transactions and auto‐insert tie‐line transactions
• Now try to re‐enableAGC and re‐solve the case
What if Interchanges Don’t Look Right or ACE Values are Large?
Page 15
15© 2013 PowerWorld CorporationSimulator Quick‐Start Guide
• There are 3 primary ways to interact with the power flow case– Model Explorer: spreadsheet‐like tabular displays– Bus‐view one‐line diagrams (automatically generated)
– Other one‐line diagrams (user‐generated)
• We will next examine the use of the Model Explorer
Examining the Data in the Case
Page 16
16© 2013 PowerWorld CorporationSimulator Quick‐Start Guide
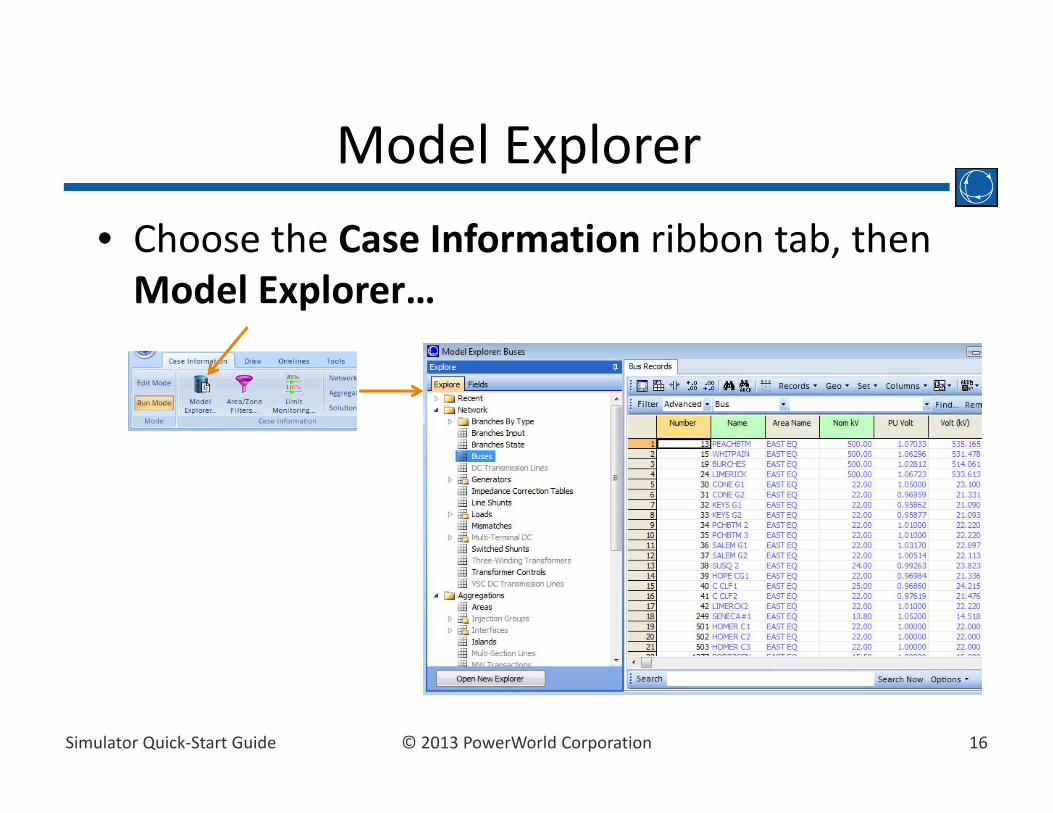
• Choose the Case Information ribbon tab, then Model Explorer…
Model Explorer
Page 17
17© 2013 PowerWorld CorporationSimulator Quick‐Start Guide
Model Explorer
Note: The options available on the Case Information right‐click local menu are also available on the Case Information Toolbar directly above the display
Recent TabsExplore Pane
Fields Pane
Toolbar
Object Types with no data
grayed‐out
Page 18
18© 2013 PowerWorld CorporationSimulator Quick‐Start Guide
• The left side initially contains the Explore pane
• Spreadsheet‐like case information displays are organized in folders that can be expanded or collapsed
• Click on an item with a grid symbol to open the corresponding case information display
Model Explorer
Page 19
19© 2013 PowerWorld CorporationSimulator Quick‐Start Guide
• Once opened, a case information display is contained within its own tab
• To close a case information display, click its “X”
Model Explorer
Page 20
20© 2013 PowerWorld CorporationSimulator Quick‐Start Guide
• Many functions in Case Information Displays can be accessed by:– Case Information Toolbar
– Local Menu (right‐click)
• Mouse over the buttons on the toolbar for a description of their function
Toolbar and Local Menu
Page 21
21© 2013 PowerWorld CorporationSimulator Quick‐Start Guide
• All displays have a set of default fields
• These can be modified– from the Fields pane, or
– with the Display/Column options on the toolbar or local (right click) menu
Columns and Appearance
Page 22
22© 2013 PowerWorld CorporationSimulator Quick‐Start Guide
Display/Column OptionsColumn Options
Fields organized by folder
Gray text means the field is already shown
Colored Dots represent the field type
Hints automatically appear giving a description of the field
Page 23
23© 2013 PowerWorld CorporationSimulator Quick‐Start Guide
Display/Column OptionsColumn Options
• Choose fields from the Available Fieldslist. Then left‐click and drag into the Show these fields in this order list
Use a wildcard find for a
particular field
Change attributes of the display columns.Also, use toolbar buttons
Also can click the Add or RemoveButtons to modify the fields shown
Click Move Up and Move Down to change the order of the columns
Fields grayed out if already
in display
Number of frozen columns
Page 24
24© 2013 PowerWorld CorporationSimulator Quick‐Start Guide
Display/Column OptionsDisplay Options
Define a custom filterAlso available via a toolbar button
Auto resize all column widths. Also available via a toolbar button
Change custom fonts and row heights
Reset all values to default
Will disable the area/zone filtering for a single case info display. Also available via a toolbar button
Page 25
25© 2013 PowerWorld CorporationSimulator Quick‐Start Guide
• To sort a column, left‐click on the column heading. Click again to sort in the opposite direction
• SHIFT + Left‐Click will sort by Absolute Value
Simple Sorting
Sorted Descending by Gen MW Note: Arrow showing sort direction
Absolute Value Sort
Click here to remove sorting
Page 26
26© 2013 PowerWorld CorporationSimulator Quick‐Start Guide
• Font color denotes type of cell– Black: read‐only– Green: toggle between a
set of allowable values (double‐click or click drop‐down to change)
– Blue: user‐enterable– Red: value at a limit– Gray: disabled (mouse over
for explanation)– Purple: special or calculated
Color Conventions
Page 27
27© 2013 PowerWorld CorporationSimulator Quick‐Start Guide
• Filtering can be applied to Areas, Zones, and Owners to simplify the Case Information Displays to show only parts of the system of interest
• Select Area/Zone Filters from the Case Information ribbon or the case information toolbar
• Example: set all areas to NO except a few of interest– Click Set all No on Areas tab– Toggle NO to YES in the “Shown”
column by double‐clicking the cell.• An element will appear in Case
Information Displays if its Area, Zone, and Owner “Shown” fields are all set to YES
Area/Zone/Owner Filters
Page 28
28© 2013 PowerWorld CorporationSimulator Quick‐Start Guide
• Another useful way to interface with a power system model
• Auto‐generates one‐line diagrams at each bus, one at a time, showing all devices connected to bus and all flows.
• Choose the Case Information ribbon tab, then Bus View…
Bus View One‐Line Diagrams
Page 29
29© 2013 PowerWorld CorporationSimulator Quick‐Start Guide
Bus View One‐LineBack and forward buttons
Bus and Flow information
Click links to jump to new bus
Enter a name or number to go to a bus Click to find a bus
Left‐click circuit breaker to open/close
Right‐click elements for information
Page 30
30© 2013 PowerWorld CorporationSimulator Quick‐Start Guide
• Number of Tiers – specify 1 or 2• Show Hints
– As you move your cursor over an objectit will show information
• Show Serial Buses– Buses that are in series will be cascaded
• Show Equivalent Lines– Change to hide/show equivalent lines
• Represent Multi Section Line Objects– Show endpoints of MS Lines without intermediate buses
• Open Multiple Bus views– Specify whether to create a new Bus View when a new one is requested.– Choosing Prompt means you will be prompted each time
• Include Field Labels– A description of what each field is will be shown.
• Change Bus Link Color– The fill color of the bus links can be changed
Bus View Oneline:Click Options > to reveal
Page 31
31© 2013 PowerWorld CorporationSimulator Quick‐Start Guide
• Custom one‐line diagrams may also be created and edited by the user
• One‐line diagrams are well‐suited for wide‐area, regional, or local power system visualization
• One‐lines need only be created for the portion of the system of interest, but Simulator always models the ENTIRE system in calculations
• Simulator automatically links diagrams to the opened power system model
One‐Line Diagrams
Page 32
32© 2013 PowerWorld CorporationSimulator Quick‐Start Guide
• One‐lines may be geographic or schematic in nature
• For geographic diagrams, Simulator has built‐in borders for US states and counties, Canadian Provinces, and entire countries for the rest of the world
• For schematic diagrams, simply omit the borders and arrange system elements as desired
One‐Line Diagrams
Page 33
33© 2013 PowerWorld CorporationSimulator Quick‐Start Guide
• Choose the File Menu, then New Oneline…• Simulator will automatically switch to Edit Mode if necessary and open a blank window to draw objects on the one‐line diagram
Creating a One‐Line Diagram
Page 34
34© 2013 PowerWorld CorporationSimulator Quick‐Start Guide
• From the Draw Ribbon, choose Auto Insert → Borders
• Select Region• State or County for US• Choose Map Projection (once set, do not change)
• Click OK to insert
Insert Borders
Page 35
35© 2013 PowerWorld CorporationSimulator Quick‐Start Guide
• Pan and Zoom to navigate around the one‐line diagram• Panning
– Click and drag the one‐line background (not on any particular object)
– Use Arrow Keys (up, down, left, right) or Home, End, Page Up, Page Down to move more quickly
• Zooming– Group of buttons on the Draw and Onelines Ribbons– “Zoom In” with Ctrl‐Up Arrow key (or Ctrl‐Page Up to zoom more quickly)
– “Zoom Out” with Ctrl‐Down Arrow key (or Ctrl‐Page Down to zoom more quickly)
Panning and Zooming
Page 36
36© 2013 PowerWorld CorporationSimulator Quick‐Start Guide
• Use the Draw ribbon to add objects to the one‐line
• Drag‐and‐drop pallets are available for several object types– Buses (common)– Substations– Areas– Zones
• Choose Pale e for → Buses• Drag‐and‐drop buses from
Palette onto the Diagram
Object Palettes
Page 37
37© 2013 PowerWorld CorporationSimulator Quick‐Start Guide
• Objects may also be added to the diagram individually
• Objects are grouped by type, as in the Model Explorer
• For example, choose Network → Bus, then click on the diagram where you would like to place the bus
• If necessary, change the bus number and other options, then click OK
Individual Insertion
Page 38
38© 2013 PowerWorld CorporationSimulator Quick‐Start Guide
• The layout of a one line diagram is generally determined by the location of buses, substations, areas, or zones
• Once these are in place, other objects that attached to them may be automatically placed
Auto‐Insertion
Page 39
39© 2013 PowerWorld CorporationSimulator Quick‐Start Guide
• You can generally relocate or reposition objects by clicking and dragging
• Certain “object handles” may be used for stretching, resizing, or rotating
• The Formatting group has options for changing the appearance of selected objects
• If you make a mistake, choose Undo Oneline…
Arranging Objects on a Diagram
Green Circle:Rotation Point
Black Square:Resize Handle
Gray Square:For looks only
Page 40
40© 2013 PowerWorld CorporationSimulator Quick‐Start Guide
• It is often desirable to change the power system load from initial levels in the power flow case
• It is usually a good idea to begin with a case with load as close to the desired level as possible– Small changes (about +/‐ 10% or less) can usually be performed without too much manipulation
– Larger changes often require adjustments, such as voltage controller settings, area transactions, generator unit commitment, and/or the use of the DC power flow. These topics are discussed in greater depth in our full training curricula.
Scaling Load
Page 41
41© 2013 PowerWorld CorporationSimulator Quick‐Start Guide
• Before scaling load, it may be desirable to change some default settings
• *.raw and *.epc files commonly use “Area Slack” control– “Area Slack” means changes in area load are absorbed by generators at a single bus, the area slack bus
– This may be useful for holding constant the output of all other generators, but may not be realistic when making large changes to load
• “Participation Factor” control may be used to distribute the “make‐up power” requirement across the system
Area AGC Settings
Page 42
42© 2013 PowerWorld CorporationSimulator Quick‐Start Guide
• In the Model Explorer, open Aggrega ons → Areas
• If desired, toggle the AGC Status field to “Part. AGC”– Hint: click and drag from
the lower left of a cell to fill other cells with the same value
• Areas that are initially “Off AGC” should normally remain “Off AGC”, as they often contain island slack buses or swing buses
Participation Factor Control
Page 43
43© 2013 PowerWorld CorporationSimulator Quick‐Start Guide
• To set generator participation factors, from the Tools Ribbon, choose Other → Set Generator Part. Factors…
• The default options are usually appropriate
Participation Factor Control
Page 44
44© 2013 PowerWorld CorporationSimulator Quick‐Start Guide
• Loads may be scaled individually– from Model Explorer → Network → Loads– usually edit the “S MW” and “S Mvar” columns
• Or in bulk from Scale Case… on the ToolsRibbon
Scaling Load
Page 45
45© 2013 PowerWorld CorporationSimulator Quick‐Start Guide
System Scaling DisplayChoose object toscale by
Enter eithera scalingfactor
Or directlyenter a new value
“Do Scaling” scales the values, but leaves dialog open
“OK” also scales the values, then closes the dialog
Select specific objects to scale
Page 46
46© 2013 PowerWorld CorporationSimulator Quick‐Start Guide
• Scale by Area• Choose one or more
areas by toggling “Scale?” field to “YES”
• Specify new load with either– Scaling multiplier, OR– New MW value
• Click OK• Re‐Solve the Power
Flow (Single Solution –Full Newton)
Scaling Example
NOTE: With Participation Factor AGC, it is usually not necessary to scale generation; this will occur on power flow solution. However, you may optionally scale generation on the System Scaling display
Page 47
47© 2013 PowerWorld CorporationSimulator Quick‐Start Guide
• With the AC power flow, several iterations of partial scaling followed by solving the power flow may be required to achieve a desired load
• With Participation Factor AGC, it is usually not necessary to scale generation; this will occur automatically with the power flow solution.
• You may optionally scale generation by– Entering a “Scale by” factor or “New Value” for Generation, OR
– Check the box “Scale Gen to Keep ACE Constant”
Scaling Notes
Page 48
48© 2013 PowerWorld CorporationSimulator Quick‐Start Guide
• Most power systems analysis tools make use of limits to define boundaries of safe, reliable operation
• Define settings for monitoring limitsby selecting the Tools ribbon tab, then Limit Monitoring Settings.
• By default, ALL elements in the power system are monitored
• Use Limit Monitoring Settings to exclude power system elements that are of no interest for a particular study
• Different Line, Interface and Voltage limits can be assigned to each Limit Group, and each device within a Limit Group will adhere to its own Limit Group Settings
Limit Monitoring
Page 49
49© 2013 PowerWorld CorporationSimulator Quick‐Start Guide
• Monitoring may be done on buses (voltage), lines (MVA or Amps), transformers (MVA), interfaces (MW)
• An element is monitored only if ALL of the following conditions are met:– Its “Monitor” field is set to YES– Its assigned “Limit Group” is Enabled– Its Area’s “Report Limits” field is set to YES and its nominal kV is between its Area’s “Report Min kV” and “Report Max kV”
– Its Zone’s “Report Limits” field is set to YES and its nominal kV is between its Zone’s “Report Min kV” and “Report Max kV”
Limit Monitoring
Page 50
50© 2013 PowerWorld CorporationSimulator Quick‐Start Guide
Limit Monitoring: Key Components
Monitored element
types
Element’s “Monitor” Field (YES/NO)
Element’s assigned Limit Group (all initially belong to “Default”)
Area and Zone settings
Limit Group settings
Page 51
51© 2013 PowerWorld CorporationSimulator Quick‐Start Guide
• Buses, Lines, Interfaces, and Nomograms– show the individual elements of the power system– important columns
• Monitor: specifies whether to monitor that specific element• Limit Group: specifies the Limit Group that the element belongs to
• Area Reporting and Zone Reporting– Specify which areas and zones to monitor– Specify nominal kV range to monitor in each
• Modify/Create Limit Groups– Specify limit levels and rating sets for lines, buses, and interfaces under normal and contingency conditions
– Most fields also present in the upper‐right corner of the dialog (Limit Group Values)
Limit Monitoring: Tabs
Page 52
52© 2013 PowerWorld CorporationSimulator Quick‐Start Guide
• Use the “B” rating set for Lines & Transformers during Contingencies
• Ignore all radial lines and buses
• Report Limits only in a few areas, at 100 kV and above
Limit Monitoring Example