Place your chosen image here. The four corners must just cover the arrow tips. For covers, the three pictures should be the same size and in a straight line. Quality of Wind BMU PNs pp11_47 by Erol Chartan
Transcript
Place your chosen image here. The four corners must just cover the arrow tips. For covers, the three pictures should be the same size and in a straight line.
Quality of Wind BMU PNspp11_47
by Erol Chartan
2
Introduction
This presentation will discuss the idea of good industry practice for PN submissions. It will look at definitive / comparative benchmarks and how to present the results. It will include;
Examples of Common PNs vs Metering
Comparing all Wind BMUs
Possible Industry Benchmarks
Wind BMU PNs Vs National Grid Forecasting
Proposed Industry Benchmark
Presenting PN Performance
Place your chosen image here. The four corners must just cover the arrow tips. For covers, the three pictures should be the same size and in a straight line.
Examples of Common PNs vs Metering
by Erol Chartan
4
Examples of Common PNs vs Metering
5
Examples of Common PNs vs Metering
6
Examples of Common PNs vs Metering
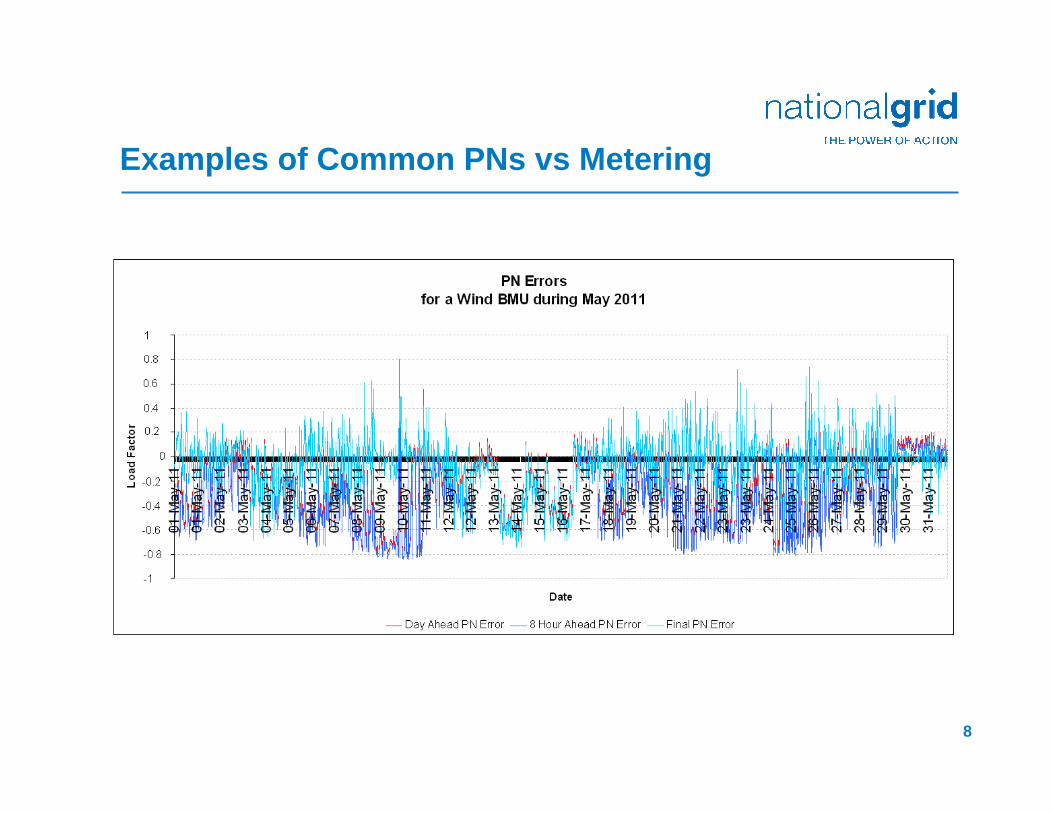
This is a common example of a wind BMU whose PN data increases in resolution and accuracy as the horizons decrease
This approach to PN submissions is ideal
There is little difference between the errors of each PN
This particular wind BMU ranked 19/30 for FPN accuracy using percentage error (shown later on)
Simpler approaches such as keeping day and 8 hour ahead PNs constant around a “best guess” for average load factor can potentially be quite accurate depending on how the errors are measured.
7
Examples of Common PNs vs Metering
8
Examples of Common PNs vs Metering
9
Examples of Common PNs vs Metering
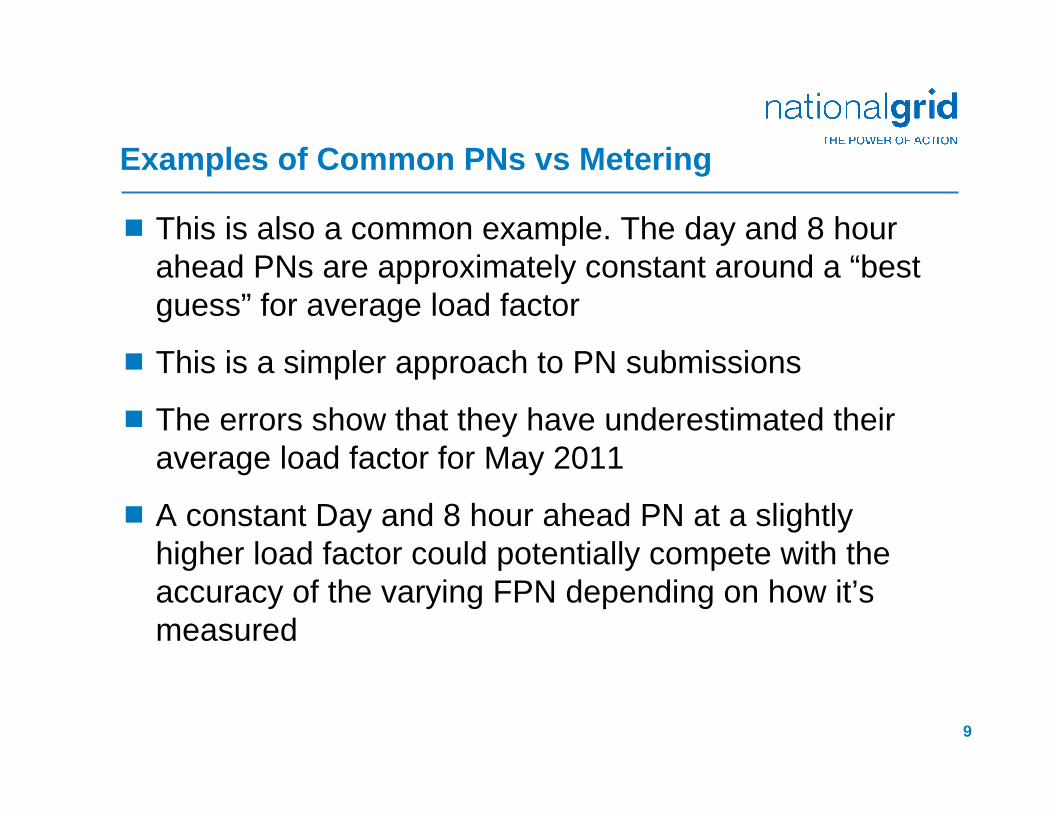
This is also a common example. The day and 8 hour ahead PNs are approximately constant around a “best guess” for average load factor
This is a simpler approach to PN submissions
The errors show that they have underestimated their average load factor for May 2011
A constant Day and 8 hour ahead PN at a slightly higher load factor could potentially compete with the accuracy of the varying FPN depending on how it’s measured
Place your chosen image here. The four corners must just cover the arrow tips. For covers, the three pictures should be the same size and in a straight line.
Comparing all Wind BMUs
by Erol Chartan
11
Comparing all Wind BMUs
It would be interesting to see how the accuracy of PN submissions from wind BMUs compare with each other
Some factors that can effect the accuracy of PN submissions need to be considered when deciding an industry benchmark using analysis over one month
Wind predictability in that area at that time
How big the company is – how much money and workforce can they afford to spend on forecasting?
How important is each horizon of PN is to us?
12
Comparing all Wind BMUs
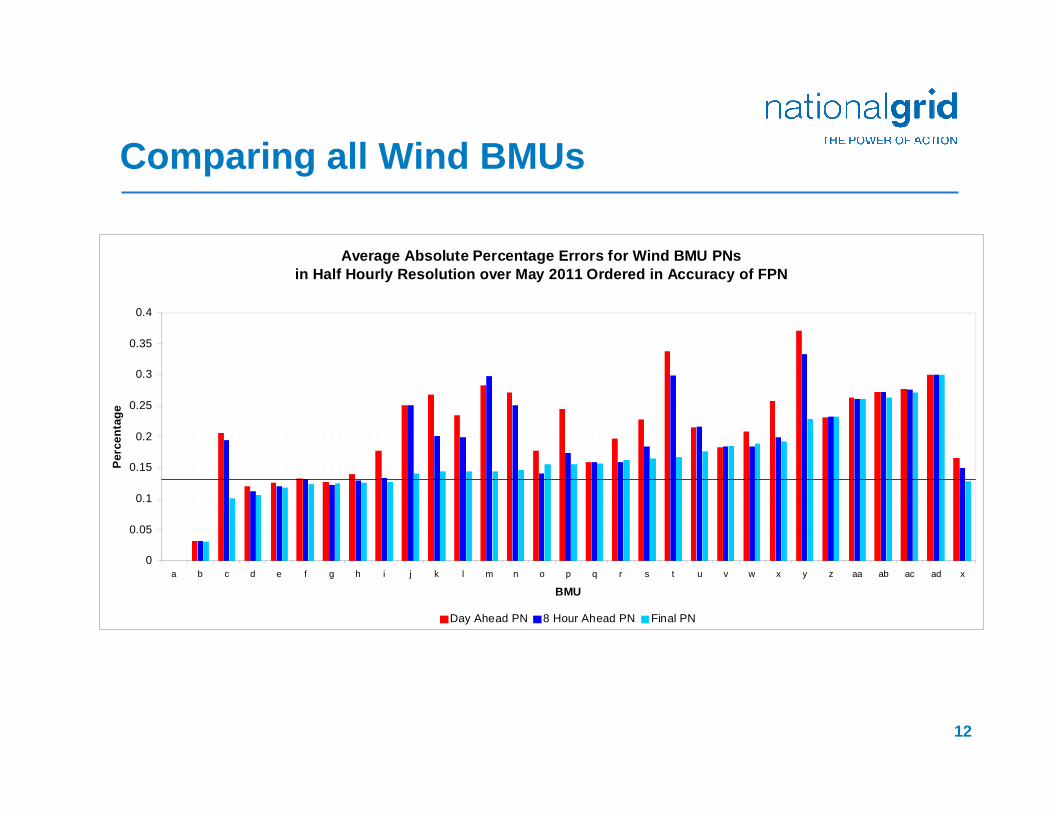
Average Absolute Percentage Errors for Wind BMU PNsin Half Hourly Resolution over May 2011 Ordered in Accuracy of FPN
0
0.05
0.1
0.15
0.2
0.25
0.3
0.35
0.4
a b c d e f g h i j k l m n o p q r s t u v w x y z aa ab ac ad x
BMU
Perc
enta
ge
Day Ahead PN 8 Hour Ahead PN Final PN
13
Comparing all Wind BMUsThe majority of the wind BMUs have a similar percentage error; around 15%. This is very close to Windy Millar’s performance which was our wind power forecasting tool in May 2011. Total MW error varies with capacity.
The “x” category at the end is the average error for each horizon weighted with capacity. The black line shows this average FPN error. The averages show:
That in general the accuracy increases as horizon decreases
The majority of wind BMUs’ FPNs are higher than average because in general it’s the large capacity wind farms that produce accurate FPNs
When all 3 bars for a BMU are the same height it is clear that they have not altered their day ahead PN as the horizon decreased.
Wind farms with a capacity larger than the number of working turbines gives them an unfairly lower percentage error
14
Comparing all Wind BMUs
Average Absolute Errors for Wind BMU PNsin Half Hourly Resolution over May 2011
0
10
20
30
40
50
60
70
80
90
100
a b c d e f g h i j k l m n o p q r s t u v w x y z aa ab acEDIN
W-1
BMU
MW
Day Ahead PN 8 Hour Ahead PN Final PN
15
Comparing all Wind BMUs
Still ordered in FPN percentage error accuracy
Percentage error was similar throughout and the larger wind farms are producing more error
Previously conventional plant that produced an absolute error in their FPN of more than 100 MW would justify a significant event report. With the number of smaller BMUs increasing mostly due to wind power, percentage error is likely to become a more suitable industry benchmark
16
Comparing all Wind BMUs
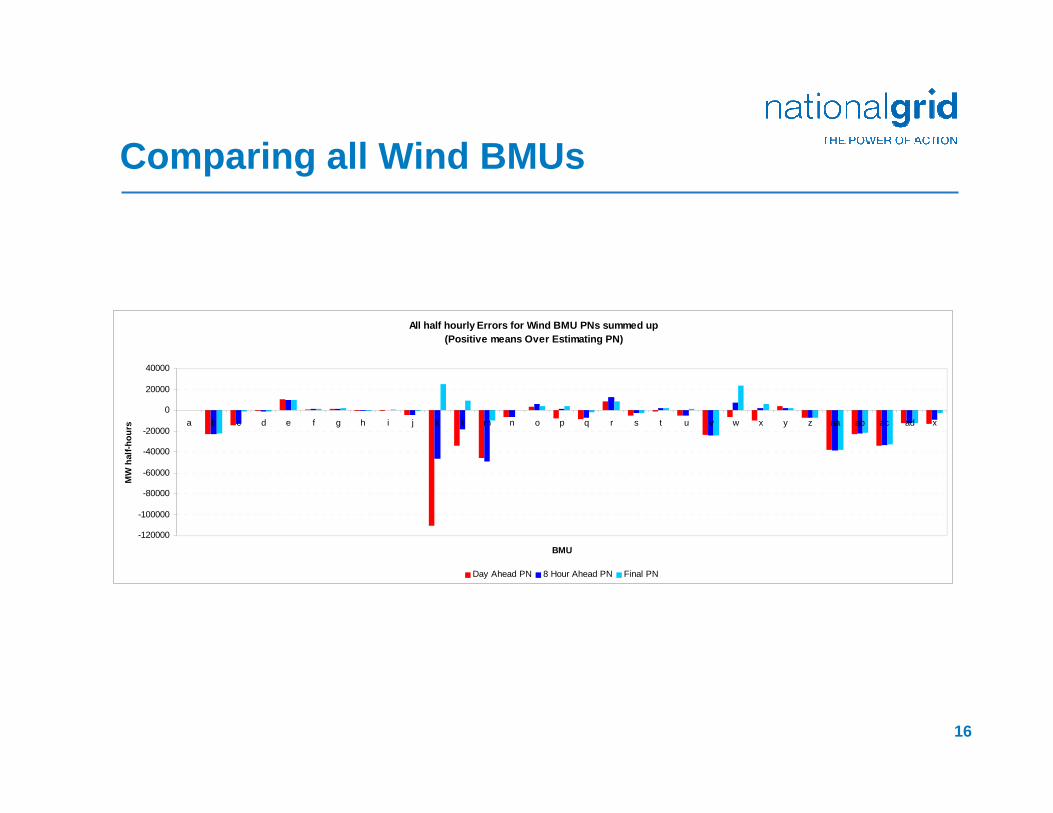
All half hourly Errors for Wind BMU PNs summed up(Positive means Over Estimating PN)
-120000
-100000
-80000
-60000
-40000
-20000
0
20000
40000
a b c d e f g h i j k l m n o p q r s t u v w x y z aa ab ac ad x
BMU
MW
hal
f-hou
rs
Day Ahead PN 8 Hour Ahead PN Final PN
17
Comparing all Wind BMUs
Standard Deviation of the Absolute Errors for Wind BMU PNsin Half Hourly Resolution over May 2011
0
0.1
0.2
0.3
0.4
0.5
0.6
a b c d e f g h i j k l m n o p q r s t u v w x y z aa ab ac ad x
BMU
Stan
dard
Dev
iatio
n
Day Ahead PN 8 Hour Ahead PN Final PN
18
Comparing all Wind BMUsGenerally the wind farms aren’t over or under forecasting
Small bars don’t necessarily mean more accurate as errors can cancel each other out, depends on the SD of error. E.g. a low SDof error with a largely positive / negative sum of error would show a constant over / under forecast respectively
Wind farms are motivated to over forecast their PNs
When a wind BMU over forecasts its PN, then they can decrease their MEL to match their generation but when a wind BMU under forecasts its PN, they cannot increase their SEL to match generation
Offers are not possible with wind power but bids are. The bids are determined from their PN value – higher the PN, more National Grid pays them for a bid.
Place your chosen image here. The four corners must just cover the arrow tips. For covers, the three pictures should be the same size and in a straight line.
Possible Industry Benchmarks
by Erol Chartan
20
Possible Industry Benchmarks
Throughout this chapter there are 4 possibilities for Industry Benchmarks that will be explained and discussed
Absolute – A specific percentage
Relative – A percentage relative to the best performing wind farm
Average Relative – A percentage relative to the average performance of the best few wind farms
21
Possible Industry Benchmarks
Noting the variability of wind speed predictability observe two example two-tier methods,
1) An absolute Industry Benchmark:Percentage Error > 15% Notified and warned
Percentage Error > 20% Further action taken
2) A relative Industry benchmark:Percentage Error > percentage error of the best performing wind BMU + 3% Notified and warned
Percentage Error > percentage error of the best performing wind BMU + 6% Further action taken
22
Possible Industry Benchmarks
The performance of wind BMU PNs for May 2011 for the 2 Industry Benchmarks proposed earlier is as below:
1) Absolute Industry Benchmark:14/30 had performed acceptably
10/30 would have been notified and warned
6/30 would have had further action taken
2) Relative benchmark:The best performing Wind BMU needed no notification. The second best would have been notified and warned and all the rest would have had further action taken.
23
Possible Industry Benchmarks
Relative Benchmark AdvantagesAdapts to different levels of predictability due to weather, forecast horizon etc
There is constant motivation for the Wind Farms to improve
Relative Benchmark DisadvantagesIf there was at least one wind farm with nearly no wind all month they are almost guaranteed to have great percentage error
The best performing wind farms have a high capacity of wind turbines out of service leaving them with an unjustifiably low percentage error.
24
Possible Industry Benchmarks
Average Relative Benchmark Possibility
A possibility is to have the Industry Benchmark as the average error of the 5 most accurate wind BMUs out of the 10 wind BMUs with highest load factor for each time period. This would:
Remove disadvantage of windy sites struggling to keep errors as low as calm sites.
Promote competition
But be time consuming
Place your chosen image here. The four corners must just cover the arrow tips. For covers, the three pictures should be the same size and in a straight line.
Wind BMU PNs Vs National Grid Forecasting
by Erol Chartan
26
Wind BMU PNs Vs National Grid Forecasting
Our own forecasting tool is essential as well as having PNs. Below is the comparison of day ahead percentage error from our wind power forecasts with similar wind BMU wind power forecasts.
WindyMillar’s average percentage error was 16.4 %
Windy Millar’s weighted average percentage error was 18%
WPFS’s average percentage error was 20.6.%
WPFS’s weighted average percentage error was 18.3%
Wind BMUs’ average percentage error was 21%
Wind BMUs’ weighted average percentage error was 16.6%
27
Wind BMU PNs Vs National Grid Forecasting
Overall, WPFS does forecast better than WM and this period was unusual.The difference in forecasting error month on month varies a lot. Basing an Industry Benchmark that is not variable on less than one year is perhaps unfair. It is worth noting that
The bad data has been removed so WPFS and WM here aren’t 100% comparable but close.The wind farms forecasted for are not just BMUs and that the data for May 2011 covers 1st - 23rd May
The weighted average percentage error being lower than the average percentage error shows that WPFS finds large wind farms easier to forecast. Money and workforce is also a factor as the difference for the BMU PNs from average to weighted average is even bigger.For an Industry Benchmark it is only worth looking at the non-weighted average error because the Industry Benchmark will be the same percentage for all capacities.
Place your chosen image here. The four corners must just cover the arrow tips. For covers, the three pictures should be the same size and in a straight line.
Proposed Industry Benchmark
by Erol Chartan
29
Proposed Industry Benchmark
Using the absolute method;Final PN
Percentage Error > 8% Notified and warned
Percentage Error > 12% Further action taken
8 hour ahead PNPercentage Error > 10% Notified and warned
Percentage Error > 14% Further action taken
Day ahead PNPercentage Error > 12% Notified and warned
Percentage Error > 16% Further action taken
Place your chosen image here. The four corners must just cover the arrow tips. For covers, the three pictures should be the same size and in a straight line.
Presenting PN Performance
by Erol Chartan
31
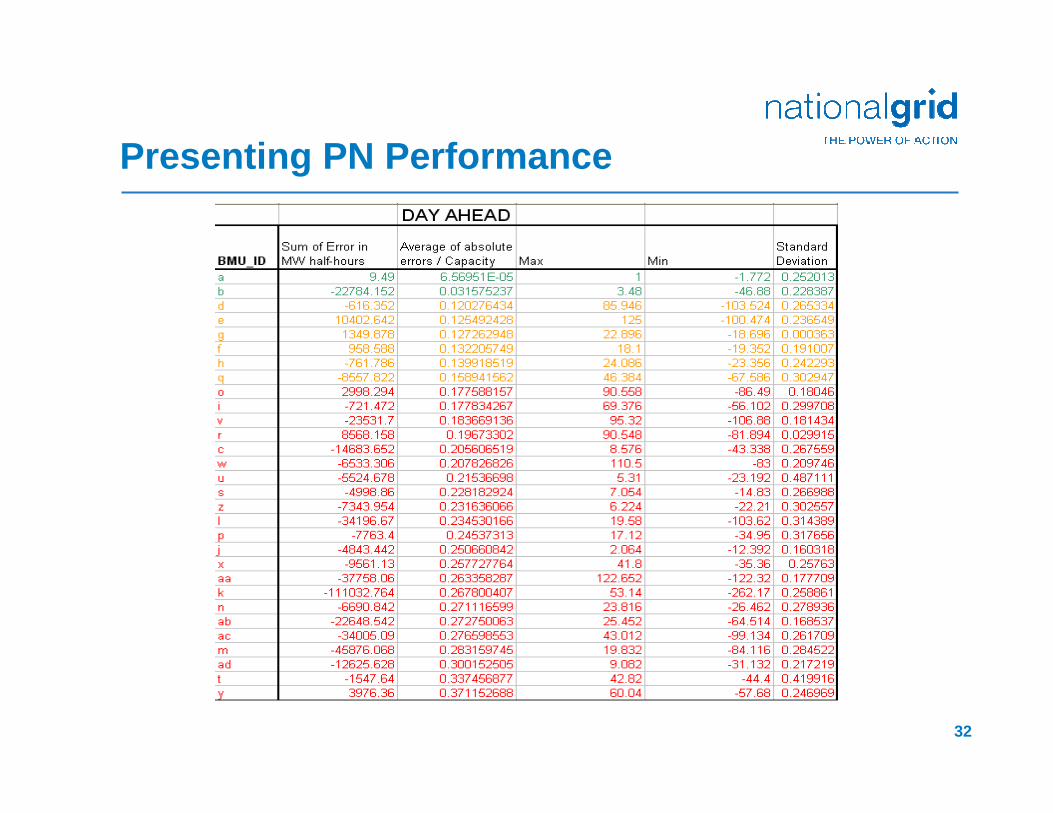
Presenting PN Performance
Present 3 tables, one for each PN horizon
Sort the Wind BMUs in order of percentage error
Highlight those who fall in different bands of percentage error based on what we set as an Industry Benchmark