PPFAS Long Term Value Fund (An Open Ended Equity Scheme) Factsheet A scheme designed for genuine Long Term Investors! MUTUAL FUND INVESTMENTS ARE SUBJECT TO MARKET RISKS, READ ALL SCHEME RELATED DOCUMENTS CAREFULLY. November 2014 November 2014 Blue colour refers that principal investment will be at low risk Yellow Colour refers that principal investment will be at medium risk Brown Colour refers that principal investment will be at high risk Investors should consult their financial advisers if in doubt about whether this scheme is suitable for them. Investment Objective of the Scheme The investment objective of the Scheme is to seek to generate long-term capital growth from an actively managed portfolio primarily of Equity and Equity Related Securities. Scheme shall invest in Indian equities, foreign equities and related instruments and debt securities. Scheme shall be investing in Indian equities, foreign equities and related instruments and debt securities. Risk Category of the scheme BROWN - HIGH RISK
Transcript
PPFAS Long Term Value Fund(An Open Ended Equity Scheme)
Factsheet
A scheme designed for genuine
Long Term Investors!
MUTUAL FUND INVESTMENTS ARE SUBJECT TO MARKET RISKS, READ ALL SCHEME RELATED DOCUMENTS CAREFULLY.
November
2014
November
2014
Blue colour refers that principal
investment will be at low risk
Yellow Colour refers that principal
investment will be at medium risk
Brown Colour refers that principal
investment will be at high risk
Investors should consult their financial advisers if in doubt about whether this scheme is suitable for them.
Investment
Objective of the
Scheme
The investment objective of the Scheme is to seek to generate long-term capital growth from an actively
managed portfolio primarily of Equity and Equity Related Securities. Scheme shall invest in Indian equities,
foreign equities and related instruments and debt securities.
Scheme shall be investing in Indian equities, foreign equities and related instruments and debt securities.
Risk Category of the scheme BROWN - HIGH RISK
PPFAS Long Term Value Fund Factsheet - November 2014
2
About the fund:
Foreign equity investments:
Outlook:
PPFAS Long Term Value Fund (PLTVF) is an open ended
equity oriented scheme with flexibility to invest a
minimum of 65% in Indian equities and up to 35% in
overseas equity securities and domestic debt / money
market securities.
The core portfolio of PLTVF consists of equity investments
made with a long term outlook and the factors considered
while investing are quality of management, quality of the
sector and the business (return on capital, entry barriers,
capital intensity, use of debt, growth prospects etc) and
the valuation of the companies. The endeavor of the fund
management team is to identify opportunities for long
term investments. However there are times when the
opportunities are not attractive enough. While waiting for
attractive opportunities, the fund invests in arbitrage
opportunities between the cash and futures equity
markets and special situations arbitrage where open
offers / delisting / merger events have been announced.
Investments are also made in money market / debt
securities while waiting for deployment in core equity
investments.
The fund invests in foreign equity securities. Since
investors in PLTVF look for capital investment and returns
in Rupee terms, PLTVF also looks at delivering in Rupee
terms. PLTVF hedges most of the currency exposure using
currency futures.
We do not have expertise in predicting short term market
movements. We aim to buy stakes in businesses which
are well run and wealth creating for shareholders and
which are quoting at a discount to intrinsic value. Hence
the emphasis on having a minimum of 5 year investment
outlook for investing in this scheme.
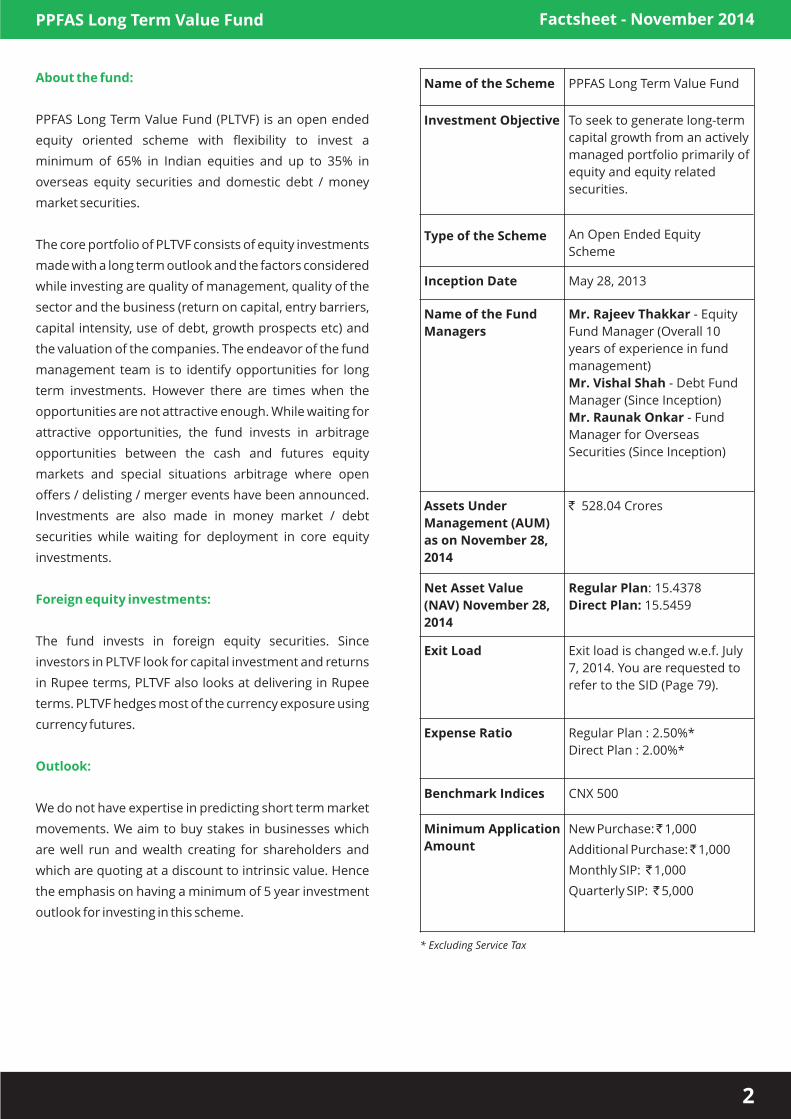
Name of the Scheme PPFAS Long Term Value Fund
Investment Objective To seek to generate long-term
capital growth from an actively
managed portfolio primarily of
equity and equity related
securities.
Type of the Scheme An Open Ended Equity
Scheme
Inception Date May 28, 2013
Name of the Fund
Managers
Mr. Rajeev Thakkar - Equity
Fund Manager (Overall 10
years of experience in fund
management)
Mr. Vishal Shah - Debt Fund
Manager (Since Inception)
Mr. Raunak Onkar - Fund
Manager for Overseas
Securities (Since Inception)
Assets Under
Management (AUM)
as on November 28,
2014
` 528.04 Crores
Net Asset Value
(NAV) November 28,
2014
Regular Plan: 15.4378
Direct Plan: 15.5459
Exit Load Exit load is changed w.e.f. July
7, 2014. You are requested to
refer to the SID (Page 79).
Expense Ratio Regular Plan : 2.50%*
Direct Plan : 2.00%*
Benchmark Indices CNX 500
Minimum Application
Amount
New Purchase: ̀ 1,000
Additional Purchase: ̀ 1,000
Monthly SIP: ̀ 1,000
Quarterly SIP: ̀ 5,000
* Excluding Service Tax
PPFAS Long Term Value Fund Factsheet - November 2014
3
Sector AllocationPortfolio Disclosure
Quantitative Indicators
Beta 0.63
Standard Deviation 11.45%
Sharpe Ratio 2.28
Portfolio Turnover 23.69%
Above figures are annualised.
Risk free rate assumed to be 8.1500% (91Day T-Bill rate as on
November 28, 2014).
# Currency hedge to the extent of approximately 90% of exposure.
* Not yet listed on the stock exchanges.
Core Equity
Name Sector
Maharashtra Scooters Ltd Auto Ancillaries 7.91%
Axis Bank Banks 7.02%
ICRA Ltd Finance 6.33%
ICICI Bank Ltd Banks 6.00%
Noida Toll Bridge Co Ltd Transportation 5.48%
Zydus Wellness Ltd 4.88%
Persistent Systems Ltd Software 4.30%
IL&FS Investment Managers Finance 4.22%
Gujarat Gas Co Ltd Gas 3.74%
Indraprastha Gas Ltd Gas 2.93%
Hotels 2.81%
Mphasis Ltd Software 2.78%
United Spirits Ltd 1.64%
Selan Exploration Technology Ltd Oil 1.23%
Wyeth Ltd Pharmaceuticals 1.11%
IPCA Laboratories Ltd Pharmaceuticals 1.10%
HDFC Bank Banks 1.00%
Novartis Ltd Pharmaceuticals 0.88%
Intellect Design Arena* Miscellaneous 0.69%
Polaris Consulting and Services Ltd Software 0.54%
MT Educare Ltd 0.42%
Total 67.01%
Overseas Securities, IDRS and ADRs
Google - C Class 8.88%
United Parcel Services INC Logistics 4.99%
3M Co 3.30%
Nestle SA ADR Packaged Foods 3.25%
International Business
Machines Corp2.74%
Anheuser Busch Inbev SA ADR Brewers 1.12%
Standard Chartered PLC IDR Banks 0.94%
Total 25.22%
Debt and Money Market Instruments
CBLO 5.02%
FDR 1.14%
Invested Total 98.39%
Cash and Cash Equivalent 1.61%
Net Assets 100.00%
% of Net Assets
Consumer Non Durables
Mahindra Holidays & Resorts India Ltd
Consumer Non Durables
Diversified Consumer Services
Internet & Technology
Industrial Conglomerates
IT Consulting & Other Services
#
#
#
#
#
# Diversified Consumer Services
Miscellaneous
Brewers
Oil
Cash & Cash Equivalent
IT Consulting & Other Services
Hotels
Pharmaceuticals
Packaged Foods
Industrial Conglomerates
Logistics
Transportation
Debt and Money Market Instruments
Consumer Non durables
Gas
Software
Auto Ancillaries
Internet & Technology
Finance
Banks
0.42%
0.69%
1.12%
1.23%
1.61%
2.74%
2.81%
3.09%
3.25%
3.30%
4.99%
5.48%
6.16%
6.52%
6.67%
7.62%
7.91%
8.88%
10.55%
14.96%
4
Lumpsum Investment Performance
Note: • Scheme returns are for Regular Plan • Past performance may or may not be sustained in future • Since inception returns are CAGR returns.
SIP Investment PerformanceWe have maintained that investing through is the best way to remove the effect of emotions from the investing process. This graph depicts that it can be an effective way to build your corpus too.
Assumption : ̀ 10,000/- is invested on the first of every month.
Systematic investment Plans (SIPs)
Since Inception from June 1, 2013 Sep 30, 2013 to Sep 30, 2014
Mutual Fund investments are subject to market risks, read all scheme related documents carefully.
Disclaimer: In the preparation of the material contained in this document, the Asset Management Company (AMC) has used information that is publicly available, including information developed in-house. Some of the material used in the document may have been obtained from members/persons other than the AMC and/or its affiliates and which may have been made available to the AMC and/or to its affiliates. Information gathered and material used in this document is believed to be from reliable sources. The AMC however does not warrant the accuracy, reasonableness and / or completeness of any information. We have included statements / opinions / recommendations in this document, which contain words, or phrases such as “will”, “expect”, “should”, “believe” and similar expressions or variations of such expressions that are “forward looking statements”. Actual results may differ materially from those suggested by the forward looking statements due to risk or uncertainties associated with our expectations with respect to, but not limited to, exposure to market risks, general economic and political conditions in India and other countries globally, which have an impact on our services and / or investments, the monetary and interest policies of India, inflation, deflation, unanticipated turbulence in interest rates, foreign exchange rates, equity prices or other rates or prices etc.
The AMC (including its affiliates), the Mutual Fund, the trust and any of its officers, directors, personnel and employees, shall not liable for any loss, damage of any nature, including but not limited to direct, indirect, punitive, special, exemplary, consequential, as also any loss of profit in any way arising from the use of this material in any manner. The recipient alone shall be fully responsible/are liable for any decision taken on this material.
Fund Manager An employee of the asset management company such as a mutual fund or life insurer, who manages investment of the scheme. He is usually part of a larger team of fund managers and research analysts.
Application amount for fresh subscription
This is the minimum investment amount for a new investor in a mutual fund scheme.
Minimum additional amount
This is the minimum investment amount for an existing investor in a mutual fund scheme.
SIP SIP or systematic investment plan work on the principle of making periodic investments of a fixed sum. It works similar to a recurring bank deposit. For instance, an investor may opt for an SIP that invests ` 500 every 15th of the month in an equity fund for a period of three years.
NAV The NAV or the net asset value is the total asset value per unit of the mutual fund after deducting all related and permissible expenses. The NAV is calculated at the end of every business day. It is the value at which the investor enters or exits the mutual fund.
Benchmark A group of securities, usually a market index whose performance is used as a standard or benchmark to measure investment performance of mutual funds, among other investments. Some typical benchmark include the Nifty, Sensex, BSE200, BSE500, 10-year Gsec.
Exit Load Exit load is charged at the time of redeeming (or transferring an investment between schemes). The exit load percentage is deducted from the NAV at the time of redemption (or transfer between schemes). This amount goes to the scheme.
Standard Deviation Standard deviation is a statistical measure of the range of an investment is performance. When a mutual fund has a high standard deviation, its range of performance is wide implying greater volatility.
Sharpe Ratio The Sharpe Ratio named after its founder, the Nobel Laureate William Sharpe is a measure of risk-adjusted returns. It is calculated using standard deviation and excess return to determine reward per unit of risk.
Beta Beta is a measure of an investment's volatility vis-a-vis the market. Beta of less than 1 means that the security will be less volatile than the market. A beta of greater than 1 implies that the security's price will be more volatile than the market.
AUM AUM or assets under management refers to the recent / updated cumulative market value of investments managed by a mutual fund or any investment firm.
HoldingsThe holding or the portfolio is a mutual fund's latest or updated reported statement of investments/securities. These are usually displayed in term of percentage to net assets or the rupee value or both. The objective is to give investors an idea of where their money is being invested by the fund manager.
Nature of Scheme The investment objective and underlying investments determine the nature of the mutual fund scheme. For instance a mutual fund that aims at generating capital appreciation by investing in stock markets is an equity fund or growth fund. Likewise a mutual fund that aims at capital preservation by investing in debt markets is a debt fund or income fund. Each of these categories may have sub-categories.
Portfolio Turnover Ratio A measure of how frequently assets within a fund are bought and sold by the managers. Portfolio turnover is calculated by taking either the total amount of new securities purchased or the amount of securities sold - whichever is less - over a particular period, divided by the total net asset value (NAV) of the fund. The measurement is usually reported for a 12-month time period.