55
Praise for Business Analytics with Management Science Models and Methods
“As Business Analytics has become a popular topic in recent years, a number of texts on the subject have appeared in the market. How-ever, most of these books simply present a collection of topics in data mining, statistics, and management science tools. Dr. Asllani’s book has a refreshing new approach to business analytics—a logical flow of design thinking for decision support with management science meth-ods. This book emphasizes the creative thinking approach to deci-sion making through practical, intuitive, and real success application examples. This is an excellent text for students and practitioners of business analytics.”
—Sang M. Lee, PhD, University Eminent Scholar Emeritus, University of Nebraska-Lincoln
“Dr. Asllani illustrates the relevance of management science in the era of Big Data and Business Analytics. He demonstrates how predictive analytics can inform and enhance prescriptive analysis, and how the rapid growth in computing power has impacted tackling larger optimizations. It is a great primer for someone new to the topic, and a great reference to anyone in the field.
After 10 years practicing management science and prior graduate level coursework, I have found that the content in Dr. Asllani’s book has affected my professional modeling with a rigor and understanding that I didn’t realize had been lacking.
The book is well-written and paced, and each chapter builds on concepts from the prior. End-of-chapter questions challenge the reader to recall information from the chapter and consider its practical applications.”
—Brett Senentz, Business Optimization and Analytics Project Manager, McKee Foods Corporation

“Dr. Asllani has delivered a practical guide for practitioners in the field and a priceless textbook for students with one brilliant stroke. This book is certain to serve as an invaluable reference in analytics and management science. The book covers a wide array of applications, from production, to logistics, to marketing.
Dr. Asllani explains the intuition behind the concepts, avoiding heavy formulas and definitions, thus allowing for a guaranteed, solid grasp of each concept. He provides spreadsheet templates, which allow for easy application and reuse for a variety of optimization models. His step-by-step methodologies are sure to make the LP formulation process easier to apply by practitioners.”
—Alireza Lari, PhD, Professor of Practice of Management, Wake Forest University School of Business

Business Analytics with Management Science Models and Methods
Arben Asllani Professor of Business Analytics,
University of Tennessee at Chattanooga

Associate Publisher: Amy Neidlinger Executive Editor Jeanne Glasser Levine Operations Specialist: Jodi Kemper Cover Designer: Alan Clements Managing Editor: Kristy Hart Senior Project Editor: Lori Lyons Copy Editor: Karen Annett Proofreader: Sarah Kearns Indexer: Ken Johnson Compositor: Nonie Ratcliff Manufacturing Buyer: Dan Uhrig
© 2015 by Arben Asllani Pearson Education, Inc. Upper Saddle River, New Jersey 07458
For information about buying this title in bulk quantities, or for special sales opportuni-ties (which may include electronic versions; custom cover designs; and content particular to your business, training goals, marketing focus, or branding interests), please contact our corporate sales department at [email protected] or (800) 382-3419.
For government sales inquiries, please contact [email protected] .
For questions about sales outside the U.S., please contact [email protected] .
Company and product names mentioned herein are the trademarks or registered trade-marks of their respective owners.
All rights reserved. No part of this book may be reproduced, in any form or by any means, without permission in writing from the publisher.
Printed in the United States of America
First Printing November 2014
ISBN-10: 0-13-376035-9 ISBN-13: 978-0-13-376035-4
Pearson Education LTD. Pearson Education Australia PTY, Limited. Pearson Education Singapore, Pte. Ltd. Pearson Education Asia, Ltd. Pearson Education Canada, Ltd. Pearson Educación de Mexico, S.A. de C.V. Pearson Education—Japan Pearson Education Malaysia, Pte. Ltd.
Library of Congress Control Number: 2014948668

To my family, for their support and patience while I was writing this book.

Contents
Preface . . . . . . . . . . . . . . . . . . . . . . . . . . . . . . . . . . . . . . . . xii
Chapter 1 Business Analytics with Management Science . . . . . . . . . . 1
Chapter Objectives . . . . . . . . . . . . . . . . . . . . . . . . . . . . . . . . . 1Prescriptive Analytics in Action: Success Stories. . . . . . . . . . 1Introduction . . . . . . . . . . . . . . . . . . . . . . . . . . . . . . . . . . . . . . 3Implementing Business Analytics . . . . . . . . . . . . . . . . . . . . . 4Business Analytics Domain. . . . . . . . . . . . . . . . . . . . . . . . . . . 5Challenges with Business Analytics . . . . . . . . . . . . . . . . . . . . 9Exploring Big Data with Prescriptive Analytics. . . . . . . . . . 14Wrap Up . . . . . . . . . . . . . . . . . . . . . . . . . . . . . . . . . . . . . . . . 16Review Questions . . . . . . . . . . . . . . . . . . . . . . . . . . . . . . . . . 17Practice Problems . . . . . . . . . . . . . . . . . . . . . . . . . . . . . . . . . 19
Chapter 2 Introduction to Linear Programming . . . . . . . . . . . . . . . . 23
Chapter Objectives . . . . . . . . . . . . . . . . . . . . . . . . . . . . . . . . 23Prescriptive Analytics in Action: Chevron
Optimizes Processing of Crude Oil. . . . . . . . . . . . . . . . . 23Introduction . . . . . . . . . . . . . . . . . . . . . . . . . . . . . . . . . . . . . 24LP Formulation. . . . . . . . . . . . . . . . . . . . . . . . . . . . . . . . . . . 26Solving LP Models: A Graphical Approach . . . . . . . . . . . . . 35Possible Outcome Solutions to LP Model . . . . . . . . . . . . . . 43Exploring Big Data with LP Models . . . . . . . . . . . . . . . . . . 53Wrap Up . . . . . . . . . . . . . . . . . . . . . . . . . . . . . . . . . . . . . . . . 55Review Questions . . . . . . . . . . . . . . . . . . . . . . . . . . . . . . . . . 56Practice Problems . . . . . . . . . . . . . . . . . . . . . . . . . . . . . . . . . 58
Chapter 3 Business Analytics with Linear Programming . . . . . . . . . 65
Chapter Objectives . . . . . . . . . . . . . . . . . . . . . . . . . . . . . . . . 65Prescriptive Analytics in Action: Nu-kote
Minimizes Shipment Cost . . . . . . . . . . . . . . . . . . . . . . . . 66Introduction . . . . . . . . . . . . . . . . . . . . . . . . . . . . . . . . . . . . . 66General Formulation of LP Models. . . . . . . . . . . . . . . . . . . 68Formulating a Large LP Model . . . . . . . . . . . . . . . . . . . . . . 68Solving Linear Programming Models with Excel . . . . . . . . 77Big Optimizations with Big Data . . . . . . . . . . . . . . . . . . . . . 86

CONTENTS vii
Wrap Up . . . . . . . . . . . . . . . . . . . . . . . . . . . . . . . . . . . . . . . . 87Review Questions . . . . . . . . . . . . . . . . . . . . . . . . . . . . . . . . . 88Practice Problems . . . . . . . . . . . . . . . . . . . . . . . . . . . . . . . . . 89
Chapter 4 Business Analytics with Nonlinear Programming . . . . . . 95
Chapter Objectives . . . . . . . . . . . . . . . . . . . . . . . . . . . . . . . . 95Prescriptive Analytics in Action: Netherlands
Increases Protection from Flooding . . . . . . . . . . . . . . . . 95Introduction . . . . . . . . . . . . . . . . . . . . . . . . . . . . . . . . . . . . . 96Challenges to NLP Models . . . . . . . . . . . . . . . . . . . . . . . . . 97Example 1: World Class Furniture . . . . . . . . . . . . . . . . . . 101Example 2: Optimizing an Investment Portfolio . . . . . . . . 110Exploring Big Data with Nonlinear Programming . . . . . . 117Wrap Up . . . . . . . . . . . . . . . . . . . . . . . . . . . . . . . . . . . . . . . 118Review Questions . . . . . . . . . . . . . . . . . . . . . . . . . . . . . . . . 120Practice Problems . . . . . . . . . . . . . . . . . . . . . . . . . . . . . . . . 121
Chapter 5 Business Analytics with Goal Programming . . . . . . . . . . 127
Chapter Objectives . . . . . . . . . . . . . . . . . . . . . . . . . . . . . . . 127Prescriptive Analytics in Action: Airbus Uses
Multi-Objective Optimization Models . . . . . . . . . . . . . 128Introduction . . . . . . . . . . . . . . . . . . . . . . . . . . . . . . . . . . . . 129GP Formulation . . . . . . . . . . . . . . . . . . . . . . . . . . . . . . . . . 130Example 1: Rolls Bakery Revisited . . . . . . . . . . . . . . . . . . 130Solving GP Models with Solver . . . . . . . . . . . . . . . . . . . . . 139Example 2: World Class Furniture . . . . . . . . . . . . . . . . . . 142Exploring Big Data with Goal Programming. . . . . . . . . . . 150Wrap Up . . . . . . . . . . . . . . . . . . . . . . . . . . . . . . . . . . . . . . . 150Review Questions . . . . . . . . . . . . . . . . . . . . . . . . . . . . . . . . 152Practice Problems . . . . . . . . . . . . . . . . . . . . . . . . . . . . . . . . 153
Chapter 6 Business Analytics with Integer Programming. . . . . . . . 159
Chapter Objectives . . . . . . . . . . . . . . . . . . . . . . . . . . . . . . . 159Prescriptive Analytics in Action: Zara Uses
Mixed IP Modeling . . . . . . . . . . . . . . . . . . . . . . . . . . . . 160Introduction . . . . . . . . . . . . . . . . . . . . . . . . . . . . . . . . . . . . 161Formulation and Graphical Solution of IP Models . . . . . . 161Types of Integer Programming Models . . . . . . . . . . . . . . . 164Solving Integer LP Models with Solver . . . . . . . . . . . . . . . 165Solving Nonlinear IP Models with Solver . . . . . . . . . . . . . 167

viii BUSINESS ANALYTICS WITH MANAGEMENT SCIENCE MODELS AND METHODS
Solving Integer GP Models with Solver. . . . . . . . . . . . . . . 169The Assignment Method . . . . . . . . . . . . . . . . . . . . . . . . . . 172The Knapsack Problem. . . . . . . . . . . . . . . . . . . . . . . . . . . . 179Exploring Big Data with Integer Programming . . . . . . . . 180Wrap Up . . . . . . . . . . . . . . . . . . . . . . . . . . . . . . . . . . . . . . . 181Review Questions . . . . . . . . . . . . . . . . . . . . . . . . . . . . . . . . 182Practice Problems . . . . . . . . . . . . . . . . . . . . . . . . . . . . . . . . 183
Chapter 7 Business Analytics with Shipment Models . . . . . . . . . . . 189
Chapter Objectives . . . . . . . . . . . . . . . . . . . . . . . . . . . . . . . 189Prescriptive Analytics in Action: Danaos Saves Time
and Money with Shipment Models . . . . . . . . . . . . . . . . 190Introduction . . . . . . . . . . . . . . . . . . . . . . . . . . . . . . . . . . . . 190The Transportation Model . . . . . . . . . . . . . . . . . . . . . . . . . 191The Transshipment Method. . . . . . . . . . . . . . . . . . . . . . . . 201Exploring Big Data with Shipment Models. . . . . . . . . . . . 208Wrap Up . . . . . . . . . . . . . . . . . . . . . . . . . . . . . . . . . . . . . . . 209Review Questions . . . . . . . . . . . . . . . . . . . . . . . . . . . . . . . . 211Practice Problems . . . . . . . . . . . . . . . . . . . . . . . . . . . . . . . . 212
Chapter 8 Marketing Analytics with Linear Programming . . . . . . . 223
Chapter Objectives . . . . . . . . . . . . . . . . . . . . . . . . . . . . . . . 223Prescriptive Analytics in Action: Hewlett Packard
Increases Profit with Marketing Optimization Models . . . . . . . . . . . . . . . . . . . . . . . . . . . . . . . . . . . . . . 223
Introduction . . . . . . . . . . . . . . . . . . . . . . . . . . . . . . . . . . . . 224RFM Overview . . . . . . . . . . . . . . . . . . . . . . . . . . . . . . . . . . 228RFM Analysis with Excel . . . . . . . . . . . . . . . . . . . . . . . . . . 231Optimizing RFM-Based Marketing Campaigns . . . . . . . . 237LP Models with Single RFM Dimension . . . . . . . . . . . . . 238Marketing Analytics and Big Data . . . . . . . . . . . . . . . . . . . 248Wrap Up . . . . . . . . . . . . . . . . . . . . . . . . . . . . . . . . . . . . . . . 249Review Questions . . . . . . . . . . . . . . . . . . . . . . . . . . . . . . . . 250Practice Problems . . . . . . . . . . . . . . . . . . . . . . . . . . . . . . . . 251
Chapter 9 Marketing Analytics with Multiple Goals . . . . . . . . . . . . 259
Chapter Objectives . . . . . . . . . . . . . . . . . . . . . . . . . . . . . . . 259Prescriptive Analytics in Action: First Tennessee Bank
Improves Marketing Campaigns . . . . . . . . . . . . . . . . . . 259Introduction . . . . . . . . . . . . . . . . . . . . . . . . . . . . . . . . . . . . 260

CONTENTS ix
LP Models with Two RFM Dimensions . . . . . . . . . . . . . . 261LP Model with Three Dimensions . . . . . . . . . . . . . . . . . . 279A Goal Programming Model for RFM. . . . . . . . . . . . . . . . 285Exploring Big Data with RFM Analytics . . . . . . . . . . . . . . 292Wrap Up . . . . . . . . . . . . . . . . . . . . . . . . . . . . . . . . . . . . . . . 293Review Questions . . . . . . . . . . . . . . . . . . . . . . . . . . . . . . . . 293Practice Problems . . . . . . . . . . . . . . . . . . . . . . . . . . . . . . . . 294
Chapter 10 Business Analytics with Simulation. . . . . . . . . . . . . . . . . 303
Chapter Objectives . . . . . . . . . . . . . . . . . . . . . . . . . . . . . . . 303Prescriptive Analytics in Action: Blood Assurance
Uses Simulation to Manage Platelet Inventory . . . . . . 304Introduction . . . . . . . . . . . . . . . . . . . . . . . . . . . . . . . . . . . . 305Basic Simulation Terminology . . . . . . . . . . . . . . . . . . . . . . 305Simulation Methodology . . . . . . . . . . . . . . . . . . . . . . . . . . 308Simulation Methodology in Action . . . . . . . . . . . . . . . . . . 314Exploring Big Data with Simulation . . . . . . . . . . . . . . . . . 319Wrap Up . . . . . . . . . . . . . . . . . . . . . . . . . . . . . . . . . . . . . . . 319Review Questions . . . . . . . . . . . . . . . . . . . . . . . . . . . . . . . . 320Practice Problems . . . . . . . . . . . . . . . . . . . . . . . . . . . . . . . . 322
Appendix A Excel Tools for the Management Scientist. . . . . . . . . . . 329
1: Shortcut Keys . . . . . . . . . . . . . . . . . . . . . . . . . . . . . . . . . 3292: SUMIF . . . . . . . . . . . . . . . . . . . . . . . . . . . . . . . . . . . . . . 3323: AVERAGEIF . . . . . . . . . . . . . . . . . . . . . . . . . . . . . . . . . 3324: COUNTIF. . . . . . . . . . . . . . . . . . . . . . . . . . . . . . . . . . . . 3335: IFERROR. . . . . . . . . . . . . . . . . . . . . . . . . . . . . . . . . . . . 3336: VLOOKUP or HLOOKUP . . . . . . . . . . . . . . . . . . . . . . 3367: TRANSPOSE . . . . . . . . . . . . . . . . . . . . . . . . . . . . . . . . . 3378: SUMPRODUCT. . . . . . . . . . . . . . . . . . . . . . . . . . . . . . . 3389: IF . . . . . . . . . . . . . . . . . . . . . . . . . . . . . . . . . . . . . . . . . . . 34010: Pivot Table . . . . . . . . . . . . . . . . . . . . . . . . . . . . . . . . . . 343
Appendix B A Brief Tour of Solver . . . . . . . . . . . . . . . . . . . . . . . . . . . 349
Setting Up Constraints and the Objective Function in Solver . . . . . . . . . . . . . . . . . . . . . . . . . . . . . . . . . . . . . 349
Selecting Solver Options. . . . . . . . . . . . . . . . . . . . . . . . . . . 352
References . . . . . . . . . . . . . . . . . . . . . . . . . . . . . . . . . . . . 361
Index . . . . . . . . . . . . . . . . . . . . . . . . . . . . . . . . . . . . . . 369

Acknowledgments
I want to thank my mentor, Professor Sang M. Lee, for introduc-ing me to the field of management science. His seminal work in goal programming inspired me to carry the torch of knowledge and love of learning. I also thank Professor Marc J. Schniederjans for teaching my first management science course and for guiding me throughout this book. His continued feedback and support is much appreciated. I also want to acknowledge my colleagues J. R. Clark, Lawrence Ettkin, Richard Becherer, and Michael Long for offering valuable and practi-cal advice on how to approach the book. Finally, I want to recognize Jeanne Glasser Levine and the Production team at Pearson for work-ing closely with me and providing continued support to make this book a reality.

About the Author
Arben Asllani is Marvin E. White Professor of Business Analyt-ics at the University of Tennessee at Chattanooga. He has an M.A. and Ph. D. from the University of Nebraska at Lincoln and a B.S. degree from the University of Tirana, Albania. Dr. Asllani has been a mem-ber of the Decision Sciences Institute since 1997 and has joined sev-eral other traditional and online academic and practitioner oriented conferences and organizations. He has won several faculty teaching and research awards and is a member of Alpha Honor Society at the University of Tennessee at Chattanooga. Dr. Asllani is Associate Edi-tor of the American Journal of Business Research and serves on the editorial board of Service Business . Dr. Asllani has published more than 36 articles in journals including Omega , Transfusion, European Journal of Operational Research , Knowledge Management , Comput-ers & Industrial Engineering, Total Quality Management and Busi-ness Excellence, and Service Business: An International Journal . He has also published and presented over 30 research papers at academic conferences.
Dr. Asllani has a broad expertise in business analytics, especially in optimization techniques and computer-based simulations. He has served as a consultant and trainer to a variety of business and govern-ment agencies. Dr. Asllani has also taught extensively in management science, business analytics, and information systems courses, and has played an important role in developing business analytics programs in the United States and abroad.

Preface
Business managers have always used data to make decisions and gain a better understanding of business operations, products, services, and their customers. Today, however, the business world has entered the era of Big Data and the nature of organizational data has changed significantly. Big Data is characterized by high volume, variety, and velocity [1] and presents unique opportunities and challenges for the practitioners of management science.
Ninety percent of all data in the world has been generated over the last two years.[2] Every hour, Walmart handles more than one mil-lion customer transactions and generates over 2.5 petabytes of data.[3] This amount of data and information is continuously saved in digi-tal storage, which has become increasingly less expensive as predicted by Moore’s law. This famous law, which has influenced many aspects of information technology and electronics for almost five decades, can also be used to govern the era of Big Data. The law indicates that the amount of data available almost doubles every two years.[4]
The change from traditional to Big Data has caused significant changes in the field of data analytics. Thomas Davenport [5] describes three types of analytics: Analytics 1.0, Analytics 2.0, and Analytics 3.0. According to Davenport, the business intelligence, also known as Analytics 1.0, was replaced in the mid-2000s with Analytics 2.0. Today, business organizations have entered the era of Analytics 3.0, which “powers consumer products and services” with data and infor-mation [5, p. 65]. One of the requirements for capitalizing on Analyt-ics 3.0 is prescriptive analytics. Davenport writes:
There have always been three types of analytics: descriptive, which reports on the past; predictive, which uses models based on the past data to predict the future; and prescriptive, which uses models to specify optimal behaviors and actions. Although Analytics 3.0 includes all three types, it emphasizes the last. Prescriptive models involve large-scale testing and optimization and are a means of embedding analytics into key processes and employee behaviors [5, p. 70].

PREFACE xiii
About the Book This book is about prescriptive analytics. It provides business
practitioners and students with a selected set of management science and optimization techniques and discusses the fundamental con-cepts, methods, and models needed to understand and implement these techniques in the era of Big Data. A large number of manage-ment science models exist in the body of literature today. These mod-els include optimization techniques or heuristics, static or dynamic programming, and deterministic or stochastic modeling. The topics selected in this book, mathematical programming and simulation modeling, are believed to be among the most popular management science tools, as they can be used to solve a majority of business opti-mization problems. Over the years, these techniques have become the weapon of choice for decision makers and practitioners when dealing with complex business systems.
Business systems are typically complex, and as a result, decision makers must incorporate many variables when utilizing optimiza-tion or simulation models. The process of creating and solving such models is further complicated when large amounts of data must be incorporated, as in the case of Analytics 3.0. The book offers several models and methods that emphasize the practical aspects of manage-ment science in the era of Big Data. Templates, algorithms, and user-friendly interfaces are included to make Big Data decision models more practical and easier to implement.
The book is organized in ten chapters. Chapter 1 , “Business Ana-lytics with Management Science,” discusses the role of management science in the era of Big Data. The importance and scope of business analytics in today’s organizations are described briefly. The chapter concludes with a discussion of several challenges faced by today’s organizations when implementing business analytics and manage-ment science models.
Chapter 2 , “Introduction to Linear Programming,” demonstrates the importance of linear programming (LP) as a business analytics tool and discusses the potential use of LP to improve organizational performance. The models are explained graphically, and their solu-tions are demonstrated graphically and via the Microsoft Excel Solver

xiv BUSINESS ANALYTICS WITH MANAGEMENT SCIENCE MODELS AND METHODS
add-in. The focus is on the understanding of fundamentals of math-ematical programming in general and linear programming in particu-lar. The graphical approach used in this chapter serves as the basis for intuitive explanations of more complex models covered in the remain-ing chapters.
Chapter 3 , “Business Analytics with Linear Programming,” explores more advanced models of LP, models that include many decision variables and constraints. Special focus is placed on the data-input requirements and input variables of linear programming mod-els. Practical recommendations related to linear programming models and its use for data analytics are discussed in this chapter. The chapter also provides a detailed discussion of Answer Reports and sensitivity analysis. The concept of reduced costs, shadow prices, and upper and lower limits are discussed in detail and their role in decision insights is highlighted.
Chapter 4 , “Business Analytics with Nonlinear Programming,” discusses the use of nonlinear programming (NLP) models for busi-ness analytics. The difference between LP and NLP models is high-lighted, and several areas of application of the NLP models in real business settings are recommended. The chapter also discusses chal-lenges of using NLP models and offers practical recommendations for the management scientists. Formulation methodology and solu-tion steps are demonstrated via examples and their respective Excel templates.
Chapter 5 , “Business Analytics with Goal Programming,” involves goal programming (GP), a powerful programming tool with multi-ple objectives. Utilizing the knowledge from LP models, the chapter offers an intuitive explanation of GP modeling and discusses different approaches to solve GP. Simple multigoal decision-making examples are used to demonstrate the essence of goal programming and Solver is used to demonstrate their solutions.
Chapter 6 , “Business Analytics with Integer Programming,” briefly covers another type of mathematical programming, integer program-ming. Integer LP models are similar to LP models with the additional constraints of having the integer values for decision variables. Integer GP models are similar to GP models with the additional constraints of having the integer values for decision variables. The use of Solver

PREFACE xv
makes the solution methodology of integer programming very similar to the ones explored in the previous chapters (LP and GP). In addi-tion, Chapter 6 discusses two special types of integer programming models: the Assignment Method and the Knapsack Problem.
Chapter 7 , “Business Analytics with Shipment Models,” discusses the use of mathematical programming models in shipment and logis-tics. Decision makers today seek to optimize not only production or service operations, but also those operations that transport goods from plants, to warehouses, to distribution centers, or to other des-tinations. The transporting of such goods includes organizational, intraorganizational, and interorganizational shipments and accounts for a significant part of the costs of products and services. Chapter 7 discusses two types of shipment problems: transportation and trans-shipment models.
There are complex LP models with many constraints and decision variables that use relatively small amounts of data. But there are also simple LP models with only a few constraints and decision variables that use large input (Big Data) sets. Chapter 8 , “Marketing Analytics with Linear Programming,” demonstrates the application of simple LP models using information generated from customer relationship management systems (CRMs). CRMs are organizationwide systems that, among other things, can be used to store sales information, such as customers, transaction dates, and amount of sales in each transac-tion. Using a case-based approach, this chapter utilizes the recency-frequency-monetary value (RFM) analysis and combines it with an LP model. This combination of Big Data with an appropriate LP model can be used to generate recommendations for effective mar-keting campaigns.
Chapter 9 , “Marketing Analytics with Multiple Goals,” also uses a case-based approach to apply more advanced programming models in the RFM analysis. These models combine several dimensions of the RFM analysis and model marketing campaigns with multiple objec-tives via linear and goal programming.
Chapter 10 , “Business Analytics with Simulation,” demonstrates the use of simulation for data analysis. This section provides an intui-tive explanation of computer simulation. Examples are provided and model assumptions are discussed. Several areas of application of the

xvi BUSINESS ANALYTICS WITH MANAGEMENT SCIENCE MODELS AND METHODS
model in real business settings are also recommended. The chapter offers a step-by-step approach that practitioners can use to design and build simulation models in business settings. The methodology is illustrated with an example and Excel as an analysis tool.
The book concludes with two appendixes. Excel spreadsheet tem-plates are used to support modeling approaches offered in the book. As such, a variety of Excel tools, which are used throughout the book and must be included in every data scientist’s toolbox, are offered in Appendix A , “Excel Tools for the Management Scientist.” It is advised that the reader consult the material in Appendix A before or during the exploration of models presented throughout the chapters. Finally, Appendix B , “A Brief Tour of Solver,” is a tutorial on Solver, the Excel add-in used in this book. Although Solver is sufficiently explained in each chapter, the reader can use Appendix B for further explorations of the features of this add-in.
Features of the Book This book provides a unique approach to management science.
The following features facilitate a better understanding of the dis-cussed models and allow for a practical implementation of these mod-els in real-world business situations.
• Prescriptive Analytics in action —Each chapter starts with a description of an application of a management science topic in a real business environment.
• Management Science and Big Data —The book describes management science models in the context of business analyt-ics. Special focus is placed on data processing and other chal-lenges presented by the high volume, velocity, and variety of model inputs. Each chapter ends with a discussion of chal-lenges posed by Big Data in the management science topic and its practical implications.
• “Black box” approach —The topics discussed in this book focus more upon the input-output aspects of decision making

PREFACE xvii
and less upon the dynamics and complexities of the model itself, which is handled by Solver.
• Explaining by example and intuition —Complex concepts are often understood via examples and intuitive explanations, not by formulas and theoretical definitions. Several examples are used throughout the book. The graphical approach dis-cussed in Chapter 2 builds the foundation of explaining dif-ficult concepts of management science with intuition and by example.
• Practice problems —Each chapter concludes with a series of conceptual questions that further add to the understanding of the topics. In addition, several “end of chapter” problems pro-vide a thorough training opportunity to the reader. Problems require not only problem formulations and solutions, but also necessitate that the reader deal with Big Data sets and real-life challenges. Additional problems are provided on the book’s companion website.
• Excel templates and data sets —A series of templates used in the book and several data sets for additional problems are avail-able to students, practitioners, and instructors on the book’s companion website at www.informit.com/title/9780133760354 .
• Instructor’s resources —The book’s companion website also contains all necessary resources for the instructors, such as the complete instructor’s solution manual, PowerPoint lecture pre-sentations, and the test item file.

This page intentionally left blank
1
1 Business Analytics with
Management Science
Chapter Objectives
• Emphasize the importance of business analytics in today’s organizations
• Discuss the scope of business analytics and the set of skills required for business analyst practitioners
• Discuss the role of management science models in the Big Data era
• Explain challenges faced by organizations when implementing business analytics
• Examine the new role of management science in the era of Big Data
Prescriptive Analytics in Action: Success Stories
There is no doubt that organizations have become more competi-tive through the use of business analytics. A 2013 study by the MIT Sloan Management Review indicates that 67% of companies use data analytics to gain a competitive advantage compared with only 37% in 2010.[6] Almost any business—be it focused on consumer prod-ucts, the entertainment industry, healthcare, or fast food—is using

2 BUSINESS ANALYTICS WITH MANAGEMENT SCIENCE MODELS AND METHODS
mountains of data to improve customer service, operations, supply chains, or product designs.[7] Business analytics is no longer a buzz-word. A recent survey of Gartner Inc. conducted in June 2013 indi-cates that over 30% of companies in each sector, such as media and communications, banking, and services, have already invested in data analytics.[8] The same survey stated that over 50% of companies in transportation plan to invest in the next two years in data analytics. The number of investors in data analytics is currently 41% in health care, 40% in insurance, 39% in retail, and 38% in government.[8]
The analytics can be implemented in almost all business func-tions. Currently, according to the survey, almost 55% of respondents indicated that business analytics is used to improve customer experi-ence, 49% use business analytics to increase efficiency, 42% use it for marketing purposes, and 37% use it for cost reduction.[8] In the same survey, 70% of respondents indicated the use of business transactions as the source of data; 55% use log data, 42% use machine sensors, 36% use source e-mails and documents, and 32% utilize social media.
The use of business analytics for productivity improvement has expanded not only to large corporations but also to smaller compa-nies. First Tennessee Bank, for example, lowered its marketing cost by 20% and increased its return on investment by more than 600% by using data analytics for better customer marketing.[9] The following bulleted items briefly discuss how Target and LinkedIn use business analytics to reach more customers:
• Target —Retailers have collected customer information for decades. This information has helped retailers to increase their sales and create targeted promotions based on specific customer segmentation. However, Target has moved data analytics into a new stage. Instead of advertising to customer segments, Target now is able to “laser target” each customer with his or her spe-cific needs for specific products. In early 2012, the New York Times reported the story of a Target analyst who was able to determine if a customer was pregnant based on the pattern of previous purchases. That information was then used to adver-tise targeted products.[10] Target’s sales skyrocketed, and the company’s revenues have grown by $23 billion since the new data-informed strategy was implemented.[11]

CHAPTER 1 • BUSINESS ANALYTICS WITH MANAGEMENT SCIENCE 3
• LinkedIn —LinkedIn, the social networking website, was founded in December 2002 and was first launched in May 2003. In 2006, the data scientists at LinkedIn started to investi-gate connection patterns and profile richness of their 8 million users. They tested what would happen if a user was presented with names of people with whom they had not yet connected but seemed likely to know. And, it worked. “People you may know” ads achieved a 30% higher click-through rate than the rate obtained by other prompts [12] and the campaign gener-ated millions of new page views and the LinkedIn membership network grew significantly. In May 2014, LinkedIn had 300 million registered users worldwide.[13]
Introduction
The automation of business processes with information tech-nology has led to the automatic capture of massive data. Successful managers must be able to work with this data and make sense of all this information. They must understand not only the math and algo-rithms, but also the “big picture approach to using Big Data to gain insights.”[7] Business analytics has become their weapon of choice.
What is business analytics? There are many definitions of busi-ness analytics as a field of study. From a practitioner’s perspective, business analytics can be defined as set of tools and techniques that are used to retrieve, process, transform, and analyze data in order to generate insights for better decisions in the business world. Wayne Winston, a prominent scholar and consultant in management science and prescriptive analytics, defines analytics as simply “using data for better decision making.”[14]
Business analytics integrates tools and techniques from four major fields: information management, descriptive analytics, predictive ana-lytics, and prescriptive analytics. Information management deals with storing, extracting, transforming, and loading data and information from operational databases into data warehouses. Once the informa-tion is made available in data warehouses and data marts, business analysts can use a series of descriptive analytics tools to understand

4 BUSINESS ANALYTICS WITH MANAGEMENT SCIENCE MODELS AND METHODS
what has happened in the organization regarding its key performance indicators.
Further, predictive analytics tools can be used to forecast and estimate future behavior based on past performance. Finally, optimi-zation and other management science models are used as prescriptive analytics to identify the best courses of actions and optimal decisions. The nature of management science has changed to accommodate the need to process large amounts of data sets. An obvious feature of today’s management science is its heavy reliance on spreadsheet modeling and other data analysis software programs.
Implementing Business Analytics
As organizations are becoming more competitive by using busi-ness analytics, there is no doubt that practitioners, from both large and small companies, are eager to learn more about data analytics and how to implement it in their everyday decision making. But how do managers implement business analytics in the workplace? Is there a methodology or a recommended set of steps that can be followed by practitioners? The examples of Target, LinkedIn, First Tennessee, and many other companies that have implemented data analytics can be used to derive practical steps for implementing analytics in orga-nizational settings. Business analytics initiatives in the era of Big Data usually follow an eight-step cycle:
1. Understand the company’s products in depth.
2. Establish tracking mechanisms to retrieve the data about the products.
3. Deploy good-quality data throughout the enterprise.
4. Apply real-time analysis to the data.
5. Use business intelligence to standardize reporting.
6. Use more advanced analytics functions to discover important patterns.
7. Obtain insights to extract relevant knowledge from the patterns.
8. Make decisions to derive value using the knowledge discovered.

CHAPTER 1 • BUSINESS ANALYTICS WITH MANAGEMENT SCIENCE 5
These eight steps illustrate how organizations utilize all aspects of data analytics. LinkedIn, for example, uses information about its members, which is housed in operational databases. This information is then organized into a data warehouse and the analysts can use this information to explore the browsing history of LinkedIn members. Furthermore, LinkedIn uses descriptive statistics to generate reports and discover patterns. These patterns let the data analytical team at LinkedIn use predictive analytics to discover that speed is very impor-tant in receiving positive responses. Specifically, LinkedIn analysts were able to determine that “adaptation exponentially increases as the response time goes towards sub-seconds.” Finally, prescriptive ana-lytics is used to generate appropriate actions. For example, LinkedIn could use optimization techniques to identify the best mix of com-panies or individuals, which maximizes the number of prospects or product sales.
Business Analytics Domain
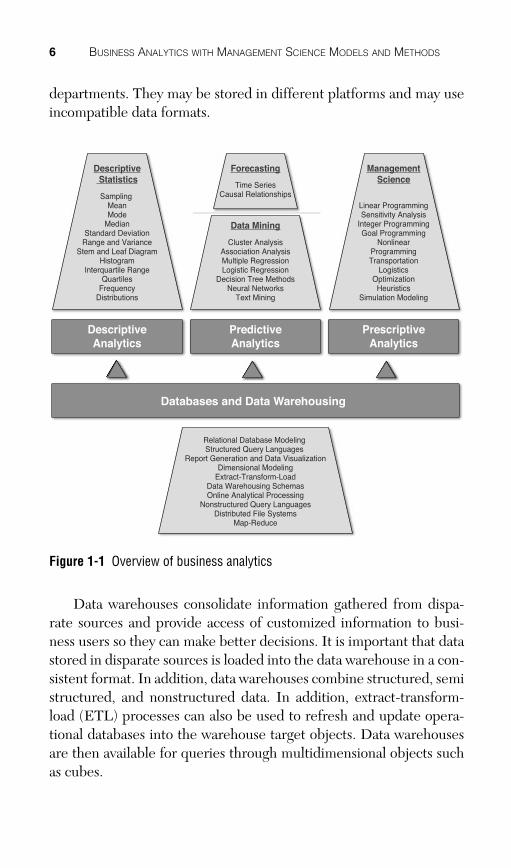
As shown in Figure 1-1 , the domain of business analytics covers four major areas of study: databases and data warehouses, descrip-tive analytics, predictive analytics, and prescriptive analytics. Whereas data structures are used to effectively store and efficiently retrieve information, descriptive analytics can be used to report the past. Whereas predictive analytics uses past data to create models that pre-dict the future, prescriptive analytics utilizes optimization, heuristics, or simulation models that can specify optimal solutions and prescribe the best courses of action.
Databases and Data Warehouses
Databases and data warehouses serve as the foundation of busi-ness analytics. Every business analytics process starts by storing the data appropriately in operational databases and ensuring data integ-rity. The data analyst must understand the principles of database design and implementation throughout all its steps: conceptual, logi-cal, and physical modeling. The most common design of databases is known as relational database modeling. Relational databases are distributed throughout organizations and may belong to different
6 BUSINESS ANALYTICS WITH MANAGEMENT SCIENCE MODELS AND METHODS
departments. They may be stored in different platforms and may use incompatible data formats.
DescriptiveAnalytics
Databases and Data Warehousing
Sampling MeanMode
MedianStandard Deviation
Range and VarianceStem and Leaf Diagram
HistogramInterquartile Range
QuartilesFrequency
Distributions
Descriptive Statistics
Cluster AnalysisAssociation AnalysisMultiple RegressionLogistic Regression
Decision Tree MethodsNeural Networks
Text Mining
Time SeriesCausal Relationships
Forecasting
Data Mining
Linear ProgrammingSensitivity Analysis
Integer ProgrammingGoal Programming
NonlinearProgrammingTransportation
LogisticsOptimization
HeuristicsSimulation Modeling
ManagementScience
PredictiveAnalytics
PrescriptiveAnalytics
Relational Database Modeling Structured Query Languages
Report Generation and Data VisualizationDimensional Modeling
Extract-Transform-LoadData Warehousing SchemasOnline Analytical Processing
Nonstructured Query LanguagesDistributed File Systems
Map-Reduce
Figure 1-1 Overview of business analytics
Data warehouses consolidate information gathered from dispa-rate sources and provide access of customized information to busi-ness users so they can make better decisions. It is important that data stored in disparate sources is loaded into the data warehouse in a con-sistent format. In addition, data warehouses combine structured, semi structured, and nonstructured data. In addition, extract-transform-load (ETL) processes can also be used to refresh and update opera-tional databases into the warehouse target objects. Data warehouses are then available for queries through multidimensional objects such as cubes.

CHAPTER 1 • BUSINESS ANALYTICS WITH MANAGEMENT SCIENCE 7
After the information is captured and stored in operational data-bases or data warehouses, the data analyst may perform online ana-lytical processing, create business reports, visualize data, and produce operational business intelligence. Structured Query Language (SQL) is a programming language that can be used to create databases, store and update data in these databases, and retrieve information from them.
The nature of data capturing and processing has changed dramat-ically in the era of Big Data. Nonrelational, distributed, open-source, and horizontally scalable (abbreviated as NoSQL) databases have emerged and are used in real-time web applications.[15] Whereas relational databases consist of related tables, records, and fields, NoSQL databases contain nonstructured data in the form of key-val-ues, graphs, or documents.
Descriptive Analytics
Descriptive analytics is used to quantitatively describe the main features of organizational data. Descriptive analytics aims to summa-rize a sample, rather than use the data to learn about the population that the sample of data is thought to represent. Some of the common tools used in descriptive statistics include sampling, mean, mode, median, standard deviation, range, variance, stem and leaf diagram, histogram, interquartile range, quartiles, and frequency distributions. The results of descriptive statistics are often displayed via graphics/charts, tables, and summary statistics such as single numbers.
Suppose that Fandango, the leading online ticket seller for movie theaters, wants to investigate the movie preferences of its customers during the past year. Fandango sells millions of tickets to approxi-mately 20,000 movie theaters across the United States.[16] Informa-tion about customers, movie theaters, ticket sales, and show times are automatically captured and stored in structured databases. Then, periodically, this information is extracted, transformed, and loaded into data warehouses or data marts, which mostly reside in distributed servers. Fandango data scientists will then use descriptive analytics. For example, using a sample of movie titles, the analysts can inves-tigate the correlations among total sales for different movies. Using a sample of moviegoers, they can calculate the average ticket sales

8 BUSINESS ANALYTICS WITH MANAGEMENT SCIENCE MODELS AND METHODS
for a week, the most popular movie, distribution of customers among movie genres, the busiest hours of the day in the movie theater, age distribution of moviegoers, gender distribution, and so on. This type of data analysis helps Fandango set ticket prices, offer discounts for certain movies or show times, and assign show times of the same movie in different theaters.
Predictive Analytics
Whereas descriptive statistics are considered a straightforward presentation of facts, predictive analytics uses statistical modeling to draw conclusions and predict future behavior based on the assump-tion that what has happened in the past will continue to happen in the future. Some of the common tools used in descriptive statistics include cluster analysis, association analysis, multiple regression, logistic regression, decision tree methods, neural networks, and text mining. Forecasting tools, such as time series and causal relation-ships, are also classified as predictive analytics.
How does Fandango know to send e-mails to its members with discount offers for a specific movie on a specific day? Predictive ana-lytics tools can crunch terabytes and terabytes of data to determine that while John likes science fiction movies, he has not seen the latest sci-fi movie, which has been in the theaters since last Friday. How does a grocery store checkout system generate valuable coupons just in time and on the back of the printed receipt? Julie’s favorite whole-grain cereal was missing from the shopping basket that day. The com-puter matches Julie’s past cereal history to ongoing promotions in the store, and right there, on the spot, Julie receives a coupon for the whole-grain cereal that she will most likely buy.
Prescriptive Analytics
Some of the most common models used in prescriptive statistics include linear programming, sensitivity analysis, integer program-ming, goal programming, nonlinear programming, and simulation modeling. Practitioners use prescriptive analytics to make decisions based on data. For example, continuing with the Fandango example, the prescriptive tools allow for ticket price offerings to change every hour. Fandango has learned when the most desirable movie times

CHAPTER 1 • BUSINESS ANALYTICS WITH MANAGEMENT SCIENCE 9
are by sifting through millions and millions of show times instanta-neously. This information is then used to set an optimal price at any given time, based on the supply of show times and the demand for movie tickets, thus maximizing profits.
Prescriptive analytics can help the movie industry to ensure that their pricing structures are optimally set to contribute to bottom-line results. Similarly, prescriptive analytics can help airline industries maximize their revenues by making sure that the highest prices are charged during the highest times of demand as well as by lowering the prices when the demand is low. The combination of Big Data with prescriptive tools allows the airlines to adopt pricing policies that go beyond traditional peak, off-peak, or shoulder seasons. Changes are dynamic and in real time; they can be implemented within the days of the week or even the hours of the day. Prescriptive analytics are the engine of today’s real-time business intelligence.
Challenges with Business Analytics
Optimization modeling and heuristic tools have yet to make the transition into the Big Data era. In an October 2013 issue of the Wall Street Journal , John Jordan of Penn State University describes several challenges involved when implementing business analytics.[17] He notes that there is “a greater potential for privacy invasion, greater financial exposure in fast-moving markets, greater potential for mistaking noise for true insight, and a greater risk of spending lots of money and time chasing poorly defined problems or opportuni-ties.” This section discusses some of the challenges associated with prescriptive analytics and offers some practical recommendations on how to avoid them.
Lack of Management Science Experts
The everyday use of mathematical modeling and other techniques requires that business managers or other practitioners have a good understanding of numeracy and mathematical skills. However, there is a lack of such skills, especially for medium-sized or small organiza-tions. It is estimated that by 2018, U.S. universities and other educa-tional institutions will need to produce between 140,000 and 190,000

10 BUSINESS ANALYTICS WITH MANAGEMENT SCIENCE MODELS AND METHODS
more graduates for deep analytical talent positions and 1.5 million more data-savvy managers.[18]
Business analytics, in general, and prescriptive analytics, in partic-ular, can become more “popular” with the use of spreadsheet model-ing. Spreadsheet modeling is widely used in colleges and universities for teaching mathematical programming. Instead of heavy model-ing, which seeks optimal solutions, spreadsheet modeling techniques include simpler formulations, which seek practical solutions. How-ever, the spreadsheets have limitations in the amount of data they can store. They cannot store data about millions of transactions in a bank or the details of federal spending on transportation projects, even for a week. There is a time for organizations to introduce more advanced tools.
Analytics Brings Change in the Decision-Making Process
The goal of prescriptive analytics is to bring business value through better strategic and operational decisions. At the strategic level, those who make decisions about what models to implement and what needs to be measured will accrue more power. At the operational level, the implementation of such models brings a power shift in the decision-making process. Information-based decisions across organizational boundaries can upset traditional power relationships.
The story of the Oberweis Dairy [19] is an excellent example of how data analytics can transform organizations. The company started as an Illinois farmer selling his surplus milk to neighbors in 1915. Today, the company has “three distribution channels: home delivery, with thousands of customers; retail, with 47 corporate and franchise stores; and wholesale, to regional and national grocery chains like Tar-get.” The usual approach to decision making at the company is by ask-ing executives to figure out the best configuration for future changes.
In 2012, the company was trying to expand its operations geo-graphically, and the chief executive officer (CEO) asked a data analyt-ics executive with only three years of experience to join the strategy table. Bringing analytics to the table changed the preconceived notion about the customers. Although there were current customers who

CHAPTER 1 • BUSINESS ANALYTICS WITH MANAGEMENT SCIENCE 11
benefited from the offerings of the company, data analysis indicated that the company had spent a lot of money to acquire customers who should not have been approached in the first place. Contrary to the company’s conventional wisdom, data from the customer sales indi-cated that “the so-called Beamer and Birkenstock group—liberal, high-income, BMW-driving, established couples living leisurely life-styles” was not a good fit for the dairy farm. So, the meeting changed from a tactical meeting with a focus on “how many trucks and transfer centers would be required” into a strategic “define the target mar-ket” meeting. The change is cultural, and it has grown to a point now where people want to acquire a better understanding of analytics tools because they can see that there is real benefit.
Big Data Leads to Incorrect Information
Modeling with business analytics is more an art than a science. One fundamental step when building mathematical models is the process of abstraction. Through this process, the modeler eliminates or suppresses any unnecessary details and allows only the relevant information to enter the model. When good information goes in the model, a good model produces good results. The opposite is known as GIGO (garbage in, garbage out). In the era of Big Data, it is signifi-cantly more difficult for the data analyst to mine in the mountains of information and find the relevant pieces.
Very often, valid models produce poor results, which lead to the wrong decisions. In the era of Big Data, this happens very often. A recent story [20] reports how ten volunteers checked the accuracy of their information on AboutTheData.com and they each found inaccu-racies. In one specific case, a volunteer found that “she had two teens, at 26.” Interestingly, a CNN team found that Acxiom, the company that runs the database, was more accurate specifying the interests and less accurate in demographic data (marriage status, number of chil-dren). Wrong assumptions can lead to wrong decisions. If you are a company purchasing this database, you know the interests of your future customers, but very likely you may be sending out 2 million direct mails pieces on baby products to people who may not even have children.

12 BUSINESS ANALYTICS WITH MANAGEMENT SCIENCE MODELS AND METHODS
Big Data Demands Big Thinking
Business organizations are just entering the new paradigm of Big Data. They have been using standard databases for more than three decades and have accumulated experience and knowledge. However, Big Data demands new techniques and many of them are still in the developmental stages. Acquiring the new tools requires a radical change in underlying beliefs or theory—they require a new way of thinking. It requires, for example, that more people think probabi-listically rather than anecdotally. It also requires that managers learn to focus on the signals and do not get lost in the noise.[21] This way, organizations will be able to better understand the factors behind cus-tomers, products, services, and how to make analytical decisions.
What is Big Data? Big Data is a combination of structured, in-house operational databases with external databases, with automati-cally captured and often nonstructured data from social networks, web server logs, banking transactions, content of web pages, financial market data, and so on. All this data, coming from a wide variety of sources is combined into non-normalized data warehouse schema. Big Data is usually characterized by three Vs: volume, velocity, and variety:[1] [22]
• Volume —Today, the high volume of business transactions is automatically captured by advanced enterprise information sys-tems. Nonstructured and external databases also produce large amounts of data. These sources are then combined into denor-malized data warehouses. Unnormalized (or denormalized) data means high-volume data with intentional redundancy. The volume of Big Data is larger than the volume processed by con-ventional relational databases.
Descriptive and predictive analytics benefit from the high volume of data. After all, statistical analysis and reliability of predictions is better when the population size increases. A fore-casting method with hundreds of factors can predict better than the one with only a few input factors. Prescriptive models also benefit from Big Data. They are based on aggregated inputs,

CHAPTER 1 • BUSINESS ANALYTICS WITH MANAGEMENT SCIENCE 13
which are the result of descriptive analytics: contribution coef-ficients, average processing times, mean of distributions, and so on. The validity of these aggregate values improves with high-volume data.
Stochastic models can benefit from high-volume data, as well. Statistical distributions are more reliable when fitted with a large number of data points. A prescriptive model, which assumes a normal distribution for processing times, is more reliable when the mean and standard deviation of the normal distribution is based on thousands or millions of data points as compared with only hundreds of data points.
• Velocity —Velocity refers to the rate at which data flows into an organization. Online sales, mobile computing, smartphones, and social networks have significantly increased the information flow for the organization. Organizations can analyze customer behavior, sales history, and buying patterns. They are able to quickly produce operational business intelligence and recom-mend additional purchases or customized marketing strategies. The velocity of system output is also important. The recom-mendations must be delivered in a timely manner and must be included as part of business operations. A loan officer, for example, could compare the information in a loan application against business rules and mining models, and make a recom-mendation to the applicant or make a decision about the loan.
Prescriptive modeling techniques can take advantage of veloc-ity. They can be modeled to run in the background and take data from input to make optimal or near-optimal decisions.
• Variety —Variety of data refers to the mix of different data sources in different formats. As mentioned earlier, Big Data input may arrive in the form of a text from social networks or an image from a camera sensor. Even when the data source is structured, the format can be different. Different browsers generate different data. Different users may withhold informa-tion, or different vendors may send different information based on the type of software they use. Of course, every time humans

14 BUSINESS ANALYTICS WITH MANAGEMENT SCIENCE MODELS AND METHODS
are involved, there may be errors, redundancy, and inconsis-tency. Management science models require the input data to be uniform. As such, the implementation of these models in the era of Big Data normally requires an additional layer between the source data and the prescriptive model.
Exploring Big Data with Prescriptive Analytics
Big Data brings both opportunities and challenges for prescriptive analytics. The volume generally improves the quality and accuracy of management science models. Good management science models can speed up the flow of information by offering quicker decisions and improving operational business intelligence. Variety, though, is seen as a hindrance to the implementation of management science tech-niques. However, with the right technological framework, the nega-tive impact of variety can be mitigated.
Information technology (IT) is probably the most important ingredient in the Big Data recipe. Over the last decade, changes in IT have brought significant changes in the nature of Big Data. In the past, companies would build database applications and plan server capacity just enough to store a few years’ worth of data. Beyond that, companies would simply delete the transaction data that was older than three to five years. Today, data storage costs are relatively inex-pensive, so companies can afford to store data and information gener-ated by these transactions.
Automatic identification and data capture technologies are rap-idly developing, and they allow for faster identification of objects, better collection of data about them, and automatic entering of that data directly into computer systems without human involvement. Such technologies include bar codes, radio frequency identification, magnetic stripes, biometrics, optical character recognition, smart cards, cameras, and voice recognition. Finally, laws and regulations are approved for data storage, processing, security, transparency, and auditing (for example, the Sarbanes–Oxley Act of 2002 [23]), which make it mandatory for organizations to store the information. All these factors have contributed to the rise of the era of Big Data.

CHAPTER 1 • BUSINESS ANALYTICS WITH MANAGEMENT SCIENCE 15
Table 1-1 Challenges of Big Data to Optimization Models
Big Data Dimension Challenges
Technology-Based Solutions
Methodology-Based Solutions
Volume Managing large and rapidly increasing data sources
Advanced software programs able to process large number of constraints and decision variables
Standardize the ETL processes to auto-matically capture and process input parameters
Encourage system-driven versus user-driven optimization programs
Variety Dealing with het-erogeneity of data sources
Dealing with in-complete data sets
Relational database systems and declara-tive query language to retrieve data input for optimization models
ETL toward special-ized optimization-driven data marts
Add data structuring prior to analysis
Implement data cleaning and imputa-tion techniques
Velocity Managing large and rapidly chang-ing data sets
Reaching on-time optimal solutions for operational business intel-ligence
Advanced optimiza-tion software with the capability to reach optimal solutions within a feasible amount of time
Optimization pack-ages that directly con-nect to operational databases
Consider a trade-off between less-than-optimal but time feasible and practical solution and optimal but complex and often delayed solu-tions
Table 1-1 summarizes challenges of implementing optimization models in the era of Big Data and suggests conceptual approaches for management scientists to deal with them. High volume of Big Data requires that decision scientists have the capability to store and pro-cess a large amount of data. Cloud computing technology, which has risen over the past few years, has dramatically increased the ability for the businesses to store and process information. This technology offers dynamic and large distributed platforms for organizations to process input parameters and solve models at a large scale. These platforms can be used to run advanced optimization models, which

16 BUSINESS ANALYTICS WITH MANAGEMENT SCIENCE MODELS AND METHODS
engage multiple clusters. For example, advanced linear program-ming (LP) models have recently entered the paradigm of declarative programming. The goal of declarative programming is to ease the programmer’s task by separating the control from the logic of a com-putation.[24] According to this paradigm, the set of LP constraints, for example, is solved by giving a value to each variable so that the solution is consistent with the maximum number of constraints. This allows for engaging multiple clusters when solving large optimiza-tion models and as such makes the implementation of large-scale and heavy computational models practically feasible to solve. The use of a declarative programming approach to model and solve mathematical programming models is still at an early stage.
Apache Hadoop is another good example of using advanced tech-nology to handle high variety of data in optimization models. Hadoop, an open source platform, offers distributed computing, which places no condition on the structure of the data it can process. As such, Hadoop can be used as a great platform to mitigate the variety of components of Big Data. Google has introduced MapReduce,[25] a programming model approach that can process and filter (map), as well as merge and organize (reduce) large data sets according to spec-ified criteria. MapReduce programs can be automatically and simul-taneously executed across several computers, thus saving processing time while handling large amounts of input data.
Wrap Up
Management science techniques discussed in this book have been around for decades. However, in the era of Big Data, management scientists have “rediscovered their roots” [26] and are modifying tra-ditional techniques to better process large volumes of data, offer sim-pler and practical models, utilize spreadsheet modeling techniques, and offer practical solutions, which can be implemented in real time. With the availability of large amounts of data, Big Data is the major factor that boosted management science into today’s stage of pre-scriptive analytics.
Presently, several optimization software programs exist, which are able to model and to solve a large number of constraints and decision
CHAPTER 1 • BUSINESS ANALYTICS WITH MANAGEMENT SCIENCE 17
variables. Solver is an excellent program, licensed to Excel as an add-in from Frontline Systems. Solver can be used by practitioners to solve mathematical programming models and perform what-if analysis and optimizations to determine the best product mix, determine opti-mal shipping routes, maximize profit, or minimize costs. This book advocates a two-step approach when using Excel’s Solver: (a) setting up a template and (b) running Solver and analyzing the results. This approach allows the modeler to design templates that handle large amounts of input data and then reuse these templates with new data sets as these sets are continuously updated from transaction database sources.
In the era of high-volume data, ETL processes can be used to automatically capture and process input parameters. These processes query transactional records and calculate averages for technological coefficients, contribution coefficients, and right-hand side values for up-to-date available resources. Automatic capturing and processing of data allows organizations to design optimization models that are process driven. Such an approach requires analytics to be embedded within business processes [27] and continuously adjust input param-eters and periodically produce optimal solutions.
Considering these challenges, the content of the book is offered with two universal principles in mind: teaching by example and explain-ing by intuition. Practitioners understand complex concepts by refer-ring to examples and understand the reasoning behind these concepts by consulting intuitive explanations, not by referring to formulas and theoretical definitions. The book uses a black-box approach, which allows the practitioner to focus more upon the input-output aspects of decision making and less upon the dynamics and complexities of the model itself, which in most cases are handled by software programs.
Review Questions
1. What is Big Data? Discuss the factors that led to the era of Big Data. Compare and contrast the paradigm shift from tra-ditional operational databases to the Big Data analytical data warehousing.
18 BUSINESS ANALYTICS WITH MANAGEMENT SCIENCE MODELS AND METHODS
2. What is business analytics? What is the difference between ana-lytics and statistics? Briefly describe the domain of the four ma-jor fields of business analytics: databases and data warehousing, descriptive, predictive, and prescriptive analytics.
3. Compare and contrast descriptive, predictive, and prescriptive analytics in terms of tools and techniques used, data input and output, and their use in the decision-making process. Which type of analytics is more important for an organization?
4. The traditional management science techniques have been re-vitalized in the era of Big Data and have become the basis for many prescriptive analytics models. Explain the change in the nature of management science to accommodate the need to process large amounts of data.
5. The majority of companies today are using data analytics to gain a competitive advantage. Describe various ways in which busi-ness analytics can be used to lower costs, improve customer ex-perience, and increase productivity. Make sure to support your argument with examples reported in newspapers, magazines, and online sources.
6. Select a company where you are a regular customer. Think of the potential data this company stores about you. Also, consider other data sources your company might use (for example, de-mographics, market information, consumer information such as credit score). How do you think the business uses this infor-mation to make you a more valuable customer? For example, how does your bank know to send e-mails to you with discount offers for a loan product? How does your favorite restaurant generate a free appetizer coupon to be used during your next visit?
7. Using the same company from the previous question, brain-storm ideas about how the company can improve its operations by lowering costs or improving productivity. For example, how does the bank identify the optimal interest rates for their new loan offerings? How does the restaurant decide the menu pric-es and happy hour discounts?

CHAPTER 1 • BUSINESS ANALYTICS WITH MANAGEMENT SCIENCE 19
8. What is volume in the Big Data definition? How does the high volume of Big Data impact descriptive, predictive, and pre-scriptive analytics? Provide examples to illustrate your ideas.
9. What is velocity in the Big Data definition? How does high ve-locity of Big Data impact descriptive, predictive, and prescrip-tive analytics? Provide examples to illustrate your ideas.
10. What is variety in the Big Data definition? How does a high variety of Big Data impact descriptive, predictive, and prescrip-tive analytics? Provide examples to illustrate your ideas.
11. Discuss challenges that organizations face when trying to ana-lyze Big Data. Make sure to include in your discussion one or more challenges such as privacy invasion, financial exposure, mistaking noise for the signal, and poorly defining business problems.
12. How important is it to have optimal versus good but practical solutions? Discuss the importance of spreadsheet modeling in this comparison. List other modeling software and compare it with spreadsheets.
13. Explore advantages and disadvantages of Excel modeling for prescriptive analytics. Consider in your discussion the ability of spreadsheets to process large amounts of data as well as the potential use of add-ins.
14. Good analytics models can sometimes lead to bad business results, conclusions, and recommendations. List at least three reasons why this might happen. For each reason, offer practi-cal recommendations to avoid erroneous conclusions. Provide examples to illustrate your ideas.
15. Discuss challenges faced by practitioners when exploring Big Data with management science models. Suggest practical solu-tions to these challenges.
Practice Problems
1. A good analytics project starts with asking the right business questions. Consider a business organization, probably the one for which you are working, and state business questions whose

20 BUSINESS ANALYTICS WITH MANAGEMENT SCIENCE MODELS AND METHODS
answers can help improve organizational performance. Then, focusing on a specific business function (such as marketing, op-erations, finance, accounting, human resources, etc.), explore the sources of data that can be used to answer these questions and discuss the potential use of such data for decision making.
2. Select an organization (such as Walmart, Amazon, your favorite restaurant, or even the one you work for) and discuss what type of information this organization might store and how data sci-entists can use that information for descriptive, predictive, and prescriptive purposes.
3. Create a table with three columns respectively named Descrip-tive , Predictive , and Prescriptive, and place each skill from the following list in the correct column:
Association analysis Multiple regressions
Causal relationships Neural networks
Cluster analysis Nonlinear programming
Decision tree methods Optimization heuristics
Frequency distributions Quartiles
Goal programming Range
Histogram Sampling
Integer programming Sensitivity analysis
Interquartile range Simulation modeling
Linear programming Standard deviation
Logistic regression Stem and leaf diagram
Mean Text mining
Median Time series
Mode Variance
4. The eight-step cycle to implement a business analytics program discussed in this chapter can serve as a template for any organi-zation that is considering implementing a data analytics project. Using a specific organization (for example, from your own com-pany), map a business analytics initiative into these eight steps.

CHAPTER 1 • BUSINESS ANALYTICS WITH MANAGEMENT SCIENCE 21
Supposing you are a business analyst, offer potential specifics and details of each step, making reasonable assumptions.
5. Business analytics is being implemented by organizations in one or more business functions. Conduct an Internet search to find examples of data analytics projects implemented in specific functions. Place your findings in the respective cells of the fol-lowing table.
Business Function
Examples of Descriptive Analytics
Examples of Predictive Analytics
Examples of Prescriptive Analytics
Operations
Purchasing
Marketing
Finance
Administration
Human Resources
Public Relations
Add more functions here based on your findings...

This page intentionally left blank

Index
A AboutTheData.com, 11 accessing Excel Solver, 349 - 350 adding Solver to Tools menu, 349 Add-ins dialog box, 349 Airbus and multi-objective
optimization models, 128 All Methods options (Solver), 353 - 355
Constraint Precision, 354 Ignore Integer Constraints, 354 Show Iteration Results, 354 solving limits, 354 - 355 Use Automatic Scaling, 354
all-integer programming model, 164 Amazon, 86 Answer Report, 79 - 80
Rolls Bakery Integer GP model, 170 - 172
Rolls Bakery LP model, 51 WCF (World Class Furniture)
NLP model, 107 - 108 Apache Hadoop, 16 area of feasible solutions, graphing,
35 - 37 , 40 - 41 aspiration level, Rolls Bakery GP
model, 132 assignment method (IP models),
172 - 173 formulating, 173 solving with Solver, 173 - 178
AVERAGEIF function, 331 , 332- 333 LP (linear programming) models in
a RFM value framework LP models with three RFM
dimensions, 281 LP models with two RFM
dimensions, 263
B BBA (Blood Bank Agency) simulation
model computer simulation models,
315 - 316 conceptual models, 314 - 315
369
data collection, 315 design experiments, 316 - 318 output analysis, 318 problem description, 314 recommendations, 318 results, 318 simulation runs, 316 - 318
Big Data big optimization, 86 - 87 challenges to optimization models,
14 - 16 GP (goal programming)
model, 150 incorrect information, 11 IP (integer programming) model,
180 - 181 LP (linear programming) models,
53 - 54 marketing analytics, 248 - 249
NLP (nonlinear programming), 117 - 118
overview, 12 - 14 review questions, 17 - 19 RFM (recency-frequency-monetary)
value framework, 292 - 293 shipment models, 209 simulation models, 319 variety, 13 - 14 velocity, 13 volume, 12 - 13
big optimization, 86 - 87 binary IP (integer programming)
model, 164 - 165 Blood Assurance and simulation
models, 304 business analytics
challenges, 9 Big Data, 12 - 14 change in decision-making
process, 10 - 11 incorrect information, 11 lack of management science
experts, 9 - 10 domain, 5 - 6
data warehouses, 6 - 7 databases, 6 - 7
370 INDEX
descriptive analytics, 7 - 8 predictive analytics, 8 prescriptive analytics, 8 - 9
implementing, 4 - 5
C cells
objective cells, Solver and NLP models, 107 , 116
variable cells, 108 , 117 challenges of business analytics, 9
Big Data, 12 - 14 change in decision-making
process, 10 - 11 incorrect information, 11 lack of management science
experts, 9 - 10 Chevron case study, 23 - 24 Cloud, 15 CLV (customer lifetime values), 227 collecting data in simulation models,
311 - 312 , 315 computer simulation models, 312 ,
315 - 316 conceptual models, simulation model
methodology, 310 - 311 , 314 - 315 Constraint Precision field
(Solver), 354 constraints
demand constraints in transportation models, 198 - 199
GP (goal programming) model, 133 - 134
non-negativity constraints, 137 system constraints, 137
investment portfolio NLP model identifying constraints, 113 - 114 non-negativity constraints,
114 - 115 non-negativity constraints
GP (goal programming) model, 137
WCF (World Class Furniture) NLP model, 104
set of constraints, identifying, 76 - 77 Rolls Bakery LP model, 31
set of non-negativity constraints, identifying, 77
Rolls Bakery LP model, 31 sets of constraints, identifying,
PoliCom LP model, 33 - 34
sets of non-negativity constraints, PoliCom LP model, 34
setting up in Solver, 349 - 352 SIS (Small Investment Services)
NLP model identifying constraints, 113 - 114 non-negativity constraints,
114 - 115 Solver
NLP models, 108 setting constraints up in, 78
supply constraints in transportation models, 198 - 199
WCF (World Class Furniture) NLP model
identifying constraints, 103 solving with Solver, 108
continuous simulation models, 307 contribution coefficients
changes in, 84 transportation models, 200
Convergence option (Solver), 355 , 357 coordinates for point of optimal
solution, finding in PoliCom LP model, 39 - 40 , 42 - 43
COUNTIF function, 333 LP (linear programming) models in
a RFM value framework LP models with three RFM
dimensions, 281 LP models with two RFM
dimensions, 263 Culler, Dr. Elizabeth, 304
D Danaos Corporation and shipment
models, 190 data collection in simulation models,
311 - 312 , 315 data warehouses, 6 - 7 databases, 6 - 7 decision variables
defining, 74 - 75 investment portfolio NLP
model, 112 PoliCom LP model, 33 Rolls Bakery LP model, 29 - 30 SIS (Small Investment Services)
NLP model, 112 WCF (World Class Furniture)
NLP model, 102

INDEX 371
Rolls Bakery GP (goal programming)
model, 133 LP (linear programming)
models, 29 - 30 decision-making process, changes
in, 10 - 11 defining
business analytics, 3 - 4 decision variables, 74 - 75
PoliCom LP model, 33 Rolls Bakery LP model, 29 - 30
demand constraints in transportation models, 198 - 199
Derivatives option (Solver), 355 - 356 descriptive analytics, 7 - 8 descriptive marketing analytics,
225 - 226 design experiments in simulation
models, 312 - 313 , 316 - 318 deterministic simulation models,
307 - 308 deviational variables
Rolls Bakery GP model, 134 , 135 - 136
WCF (World Class Furniture) GP model, 144
diagrams (network) in transportation models, 193 - 195
dialog boxes Add-ins, 349 Solver Parameters, 78 , 349 - 351 Solver Results, 358
discrete simulation models, 307 divisibility, 161 domain of business analytics, 5 - 6
data warehouses, 6 - 7 databases, 6 - 7 descriptive analytics, 7 - 8 predictive analytics, 8 prescriptive analytics, 8 - 9
dynamic simulation models, 307
E ETL (extract-transform-load)
processes, 6 Evolutionary options (Solver),
356 - 358 Convergence, 357 Maximum Time Without
Improvement, 358 Mutation Rate, 357
Population Size, 357 Random Seed, 358 Require Bounds on Variables, 358
Excel management science tools, 329 RFM (recency-frequency-monetary)
value framework analysis, 231 - 232 record summary in pivot tables,
232 - 233 score assignments via
VLOOKUP function, 234 - 237 templates in NLP models, 104 - 106
Excel Solver, 16 - 17 , 77 - 78 accessing, 349 - 350 adding to Tools menu, 349 advantages of, 47 - 48 Answer Report, 79 - 80 constraints
NLP models, 108 setting up, 78 , 349 - 352
generating solutions, 358 GP (goal programming) model
Integer GP models, 169 - 172 RFM
(recency-frequency-monetary) value framework, 288 - 292
solving, 146 - 148 investment portfolio NLP model,
115 - 117 IP (integer programming) model
assignment method, 173 - 178 Integer GP models, 169 - 172 nonlinear IP (integer
programming) model, 167 - 168
Rolls Bakery IP model, 165 - 166 solving Integer LP models,
165 - 166 LP (linear programming) models
frequency and monetary values, 276 - 278
Rolls Bakery LP model, 165 - 166
solving Integer LP models, 165 - 166
LP (linear programming) models in a RFM value framework
frequency values, 244 monetary values, 247 recency and frequency values,
263 - 270 recency and monetary values,
272 - 274

372 INDEX
recency values, 240 - 241 three dimensional RFM models,
281 - 284 NLGP (nonlinear goal
programming) model, 145 - 148 NLP models, solving, 104
applying Solver, 106 constraints, 108 creating Excel templates,
104 - 106 interpreting solution results,
107 - 108 objective cells, 107 SIS (Small Investment Services)
model, 115 - 117 variable cells, 108
objective function, setting up, 78 , 349 - 352
options, 352 - 353 All Methods options, 353 - 355 Evolutionary options, 356 - 358 GRG Nonlinear options,
355 - 356 overview, 349 PoliCom LP model, 52 results, generating, 79 - 81 RFM (recency-frequency-monetary)
value framework GP (goal programming) model,
288 - 292 LP (linear programming)
models in a RFM value framework, 240 - 241 , 244 , 247 , 263 - 270 , 272 - 274 , 281 - 284
Rolls Bakery GP model, 139 - 142 Rolls Bakery LP model, 48 - 51
Answer Report, 51 entering LP formulation, 49 - 51 Excel template creation, 48 - 49
Sensitivity Report, 81 - 84 changes in contribution
coefficients, 84 changes in right-hand side
values, 81 - 83 SIS (Small Investment Services)
NLP model, 115 - 117 solutions, generating, 79 - 81 Solver Parameters dialog box, 78 Solver Results dialog box, 358 solving limits, 354 - 355 transportation models, solving,
195 - 198
transshipment models, solving, 205 - 209
extract-transform-load (ETL) processes, 6
F Fandango, 1 - 8 feasible solutions
graphing area of PoliCom LP model, 40 - 41 Rolls Bakery LP model, 35 - 37
NLP (nonlinear programming), multiple feasible areas, 100
finding coordinates for point of optimal
solution, 39 - 40 , 42 - 43 value of objective function at point
of optimal solution, 40 , 43 First Tennessee Bank, 2 , 259 - 260 flood risks and Netherlands, 95 - 96 formulas, LP model formulation, 68 frequency values in LP (linear
programming) models in a RFM value framework
single dimension RFM frameworks, 229 - 230 , 242 - 244
two dimension RFM frameworks frequency and monetary values,
275 - 278 recency and frequency values,
261 - 270
G generating solutions with Solver,
79 - 81 , 358 GIGO (garbage in, garbage out), 11 global optimum versus local optimum
(NLP model), 98 - 99 goals
deviating from, 132 prioritizing in Rolls Bakery GP
model, 132 - 133 Google
MapReduce, 16 use of Big Data, 86
GP (goal programming) model, 129 , 150 - 151
Airbus and multi-objective optimization models, 128
Big Data, 150

INDEX 373
constraints, 133 - 134 non-negativity constraints, 137 system constraints, 137
decision variables, 133 deviational variables, 135 - 136 formulating, steps of, 130 , 133 - 134 Integer GP models, solving with
Solver, 169 - 172 NLGP (nonlinear goal
programming) model, 145 - 148 objective function, 137 - 138 , 145 review questions, 152 RFM (recency-frequency-monetary)
value framework, 285 - 286 formulating, 287 - 288 GP model notations, 286 - 287 solving with Solver, 288 - 292
Rolls Bakery GP model, 130 , 131 aspiration level, 132 deviational variables, 135 - 136 formulating, 138 - 139 formulating as an LP model,
134 - 135 goal deviation, 132 non-negativity constraints, 137 objective function, 137 - 138 prioritizing goals, 132 - 133 production requirements,
130 - 131 solving with Solver, 139 - 142 system constraints, 137
Rolls Bakery Integer GP model, 169 - 172
solving with Solver, 139 - 142 , 146 - 148
WCF (World Class Furniture) GP model, 142
deviational variables, 144 NLGP (nonlinear goal
programming) model, 145 - 148
NLP (nonlinear programming) model, 143
operational data, 142 prioritizing goals, 143 - 145 solving with Solver, 146 - 148
GRG algorithm, NLP (nonlinear programming), 106 , 116
GRG Nonlinear options (Solver), 355 - 356
Convergence, 355 Derivatives, 355 - 356 Use Multistart, 356
H-I Hadoop (Apache), 16 Hewlett-Packard, marketing
optimization, 223 HLOOKUP function, 336 identifying
sets of constraints, 76 - 77 PoliCom LP model, 33 - 34 Rolls Bakery LP model, 31
sets of non-negativity constraints PoliCom LP model, 34 Rolls Bakery LP model, 31
IF function, 340 - 343 IFERROR function
LP (linear programming) models in a RFM value framework
three dimensional RFM models, 281
two dimensional RFM models, 263
overview of, 333 - 335 Ignore Integer Constraints option
(Solver), 354 implementing business analytics, 4 - 5 incorrect information, 11 infeasible solutions, 44 - 46 investment portfolio NLP model, 110
constraints identifying, 113 - 114 non-negativity constraints,
114 - 115 defining decision variables, 110 - 111 formulating objective function,
112 - 113 operational data, 110 - 111 solving with Solver, 115 - 117
IP (integer programming) model, 161 , 181 - 182
all-integer programming model, 164 assignment method, 172 - 173
formulating, 173 solving with Solver, 173 - 178
Big Data, 180 - 181 binary IP (integer programming)
model, 164 - 165 formulating, 161 - 163 graphical solutions, 161 - 163 knapsack problem, 179 - 180 mixed-IP modeling, 160 nonlinear IP (integer programming)
model, 164 Rolls Bakery Integer GP model,
169 - 172

374 INDEX
Rolls Bakery IP model, 161 - 163 , 165 - 166
solving with Solver assignment method, 173 - 178 Integer GP models, 169 - 172 Integer LP models, 165 - 166 nonlinear IP (integer
programming) model, 167 - 168
WCF (World Class Furniture) NLP model, 167 - 168
Zara and mixed-IP modeling, 160
J-K-L Jordan, John, 9 keyboard shortcuts, 329 - 330 knapsack problem (IP models),
179 - 180 large LP models
constraints identifying, 76 - 77 non-negativity constraints, 77
decision variables, defining, 74 - 75 model parameters, calculating,
70 - 73 objective function, formulating, 76 overview, 68 - 69 PMI (Primer Manufacturer Inc.)
operational data, 69 linear programming. See LP (linear
programming) models LinkedIn, 2 , 4 - 5 local optimum versus global optimum
(NLP model), 98 - 99 LP (linear programming) models
Big Data, 53 - 54 big optimization, 86 - 87 challenges of, 67 Chevron case study, 23 - 24 explained, 24 - 26 formulating, 26, 68 graphical approach, 35
area of feasible solutions, graphing, 35 - 37 , 40 - 41
coordinates for point of optimal solution, 39 - 40 , 42 - 43
objective function, graphing, 38 - 39 , 42
value of objective function at point of optimal solution, 40 , 43
Integer LP models, solving with Solver, 165 - 166
large LP models decision variables, defining,
74 - 75 model parameters, calculating,
70 - 73 objective function, formulating,
76 overview, 68 - 69 PMI (Primer Manufacturer
Inc.) operational data, 69 set of constraints, identifying,
76 - 77 set of non-negativity
constraints, identifying, 77 Nu-kote case study, 66 overview, 66 - 67 PoliCom example, 32 - 33
decision variables, defining, 32 - 33
identifying constraints, 33 - 34 non-negativity constraints, 34 objective function,
formulating, 33 overall formulation, 34
popularity of, 66 - 67 possible outcome solutions, 43 - 44 review questions, 88 - 89 RFM (recency-frequency-monetary)
value framework, 238 , 261 frequency and monetary values,
275 - 278 frequency values, 242 - 244 goal programming, 285 monetary values, 245 - 247 one dimensional RFM models,
238 - 247 recency and frequency values,
261 - 270 recency and monetary values,
271 - 274 recency values, 238 - 241 review questions, 250 - 251 three dimensional RFM models,
279 - 284 two dimensional RFM models,
261 - 278 Rolls Bakery GP model, 134 - 135 Rolls Bakery LP model, 165 - 166
decision variables, defining, 29 - 30

INDEX 375
objective function, formulating, 30 - 31
overall formulation, 32 overview, 26 - 27 set of constraints,
identifying, 31 set of non-negativity
constraints, identifying, 31 solving with Solver, 77 - 78
advantages of, 47 - 48 Answer Report, 51 constraints, 78 entering LP formulation, 49 - 51 Excel template creation, 48 - 49 objective function, 78 PoliCom LP model, 52 results, generating, 79 - 81 Roll Bakery LP model, 48 - 51 sensitivity analysis, 81 - 84 solutions, generating, 79 - 81
summary, 55 , 87
M magnetism, agility, and depth (MAD)
approach, 86 - 87 management science techniques
business analytics challenges, 9 Big Data, 12 - 14 change in decision-making
process, 10 - 11 incorrect information, 11 lack of management science
experts, 9 - 10 business analytics domain, 5 - 6
data warehouses, 6 - 7 databases, 6 - 7 descriptive analytics, 7 - 8 predictive analytics, 8 prescriptive analytics, 8 - 9
business analytics implementation, 4 - 5
Excel tools, 329 prescriptive analytics and Big
Data, 14 - 16 review questions, 17 - 19 summary, 16 - 17
MapReduce (Google), 16 marketing analytics, 224 - 225
Big Data, 248 - 249 , 292 - 293 CLV (customer lifetime values), 227 descriptive marketing analytics,
225 - 226
LP (linear programming) models in a RFM value framework, 224 - 247
predictive marketing analytics, 226 prescriptive marketing analytics, 226 review questions, 250 - 251 RFM (recency-frequency-monetary)
value framework, 226 - 228 , 231 , 249 , 260 , 293
Big Data, 292 - 293 Excel analysis of, 231 - 237 frequency values, 229 - 230 GP (goal programming) models,
285 - 292 LP (linear programming)
models, 224 - 247 LP models with a single RFM
dimension, 238 - 247 LP models with three RFM
dimensions, 279 - 284 LP models with two RFM
dimensions, 261 - 278 marketing campaign
optimization, 237 monetary values, 230 OCR model, 232 - 237 , 285 - 292 recency values, 228 - 229
Maximum Time Without Improvement option (Solver), 358
model parameters, calculating, 70 - 73 monetary values, LP (linear
programming) models in a RFM value framework, 230 , 245 - 247
frequency and monetary values, 275 - 278
recency and monetary values, 271 - 274
three dimensional RFM models, 281 - 284
two dimensional RFM models, 271 - 278
multi-objective optimization models and Airbus, 128
multiple solutions in LP (linear programming) models, 43 - 44
Mutation Rate option (Solver), 357
N Netherlands flooding risk, 95 - 96 network diagrams
transportation models, 193 - 195 , 198 transshipment models, 201 , 208 - 209
NLGP (nonlinear goal programming) model, 145 - 148

376 INDEX
NLP (nonlinear programming), 96 - 97 , 118 - 119
Big Data, 117 - 118 challenges, 98 , 100
global optimum versus local optimum, 98 - 99
local optimum versus global optimum, 98 - 99
multiple feasible areas, 100 solutions not found at extreme
points, 99 formulating
defining decision variables, 102 , 112
formulating objective function, 102 - 103 , 112 - 113
identifying constraints, 103 , 113 - 114
non-negativity constraints, 104 , 114 - 115
solving with Solver, 115 - 117 steps of, 101 - 102
implementation methodology summary, 119
investment portfolio NLP model, 110
defining decision variables, 112 formulating objective function,
112 - 113 identifying constraints, 113 - 114 non-negativity constraints,
114 - 115 operational data, 110 - 111 solving with Solver, 115 - 117
Netherlands flooding risk, 95 - 96 NLGP (nonlinear goal
programming) model, 145 - 148 review questions, 120 - 121 sensitivity analysis, 109 - 110 SIS (Small Investment Services)
NLP model, 110 , 115 - 117 defining decision variables, 112 formulating objective function,
112 - 113 identifying constraints, 113 - 114 non-negativity constraints,
114 - 115 operational data, 110 - 111
solving with Solver, 104 applying Solver, 106 constraints, 108 creating Excel templates,
104 - 106
interpreting solution results, 107 - 108
objective cells, 107 SIS (Small Investment Services)
NLP model, 115 - 117 variable cells, 108
WCF (World Class Furniture) NLP model, 101 , 143
defining decision variables, 102 formulating objective function,
102 - 103 identifying constraints, 103 non-negativity constraints, 104 operational data, 101 sensitivity analysis, 109 - 110 solving with Solver, 104 - 108 steps of formulating the NLP
model, 101 - 102 no solutions, LP (linear programming)
models, 44 - 46 nonlinear IP (integer programming)
model, 164 , 167 - 168 non-negativity constraints
GP (goal programming) model, 137 identifying, 77 investment portfolio NLP model,
114 - 115 SIS (Small Investment Services)
NLP model, 114 - 115 WCF (World Class Furniture) NLP
model, 104 NoSQL databases, 7 Nu-kote case study, 66
O Oberweis Dairy, 10 - 11 objective cells, Solver and NLP
models, 107 , 116 objective function
formulating, 76 investment portfolio NLP
model, 112 - 113 PoliCom LP model, 33 Rolls Bakery LP model, 30 - 31 SIS (Small Investment Services)
NLP model, 112 - 113 WCF (World Class Furniture)
NLP model, 102 - 103 GP (goal programming) model,
137 - 138 , 145 graphing, 38 - 39 , 42 NLP (nonlinear programming), 99

INDEX 377
setting up in Solver, 78 , 349 - 352 transportation models, 196 transshipment models, 207
OCR (online coffee retailer) RFM value framework example
GP models, 285 - 292 record summary, 232 - 233 score assignments, 234 - 237
optimal solutions finding value of objection function
at point of optimal solution, 40 , 43 graphing point of, 39 - 40 , 42 - 43
optimization models big optimization, 86 - 87 challenges of Big Data, 14 - 16 multi-objective optimization models
and Airbus, 128 ORISMA (Operations Management in
Ship Research), 190
P Patel, Neil, 226 Petro, 24 pivot tables
overview of, 343 - 346 record summary in a RFM
(recency-frequency-monetary) value framework, 232 - 233
PMI (Primer Manufacturer Inc.) constraints
identifying, 76 - 77 non-negativity constraints, 77
decision variables, defining, 74 - 75 model parameters, calculating,
70 - 73 objective function, formulating, 76 operational data, 69
point of optimal solution finding coordinates for, 39 - 40 value of objective function at point
of optimal solution, 40 PoliCom LP model
constraints identifying, 33 - 34 non-negativity constraints, 34
decision variables, defining, 32 - 33 graphical approach, 40 , 42
area of feasible solutions, graphing, 40 - 41
coordinates for point of optimal solution, 42 - 43
value of objective function at point of optimal solution, 43
objective function formulating, 33 graphing, 42
overall formulation, 34 solving with Solver, 52
popularity of business analytics, 1 - 3 LP (linear programming), 66 - 67
Population Size option (Solver), 357 possible outcome solutions
feasible solutions, graphing area of, 35 - 37 , 40 - 41
LP (linear programming) models, 43 . See also Solver
multiple solutions, 43 - 44 no solutions, 44 - 46 unbounded solutions, 46 - 47
optimal solutions finding value of objection
function at point of optimal solution, 40 , 43
graphing area of, 39 - 40 graphing point of, 42 - 43
predictive analytics, 8 predictive marketing analytics, 226 prescriptive analytics
Airbus and multi-objective optimization models, 128
Big Data and, 14 - 16 Blood Assurance and simulation
example, 304 Danaos Corporation and shipment
models, 190 First Tennessee Bank, 259 - 260 Hewlett-Packard and, 223 overview, 8 - 9 Zara and mixed-IP modeling, 160
prescriptive marketing analytics, 226 prices (shadow), 81 - 82 prioritizing goals, Rolls Bakery GP
model, 132 - 133
Q-R RAND function and simulation
models, 315 Random Seed option (Solver), 358 recency values in LP (linear
programming) models in a RFM value framework, 228 - 229 , 238 - 241
recency and frequency values, 261 - 270
recency and monetary values, 271 - 274

378 INDEX
three dimensional RFM models, 281 - 284
two dimensional RFM models, 261 - 274
recommendations from simulation model results, 313 - 314 , 318
Require Bounds on Variables option (Solver), 358
review questions GP (goal programming) model, 152 LP (linear programming)
models, 88 - 89 management science techniques,
17 - 19 NLP (nonlinear programming),
120 - 121 shipment models, 211 - 212 simulation models, 320 - 321 transportation models, 211 - 212 transshipment models, 211 - 212
RFID (radio free identification), shipment models and Big Data, 209
RFM (recency-frequency-monetary) value framework, 226 - 228 , 231 , 249 , 260 , 293
Big Data, 292 - 293 Excel analysis of, 231 - 232
record summary via pivot tables, 232 - 233
score assignments via VLOOKUP function, 234 - 237
frequency values, 229 - 230 GP (goal programming) models,
285 - 286 formulating, 287 - 288 GP model notations, 286 - 287 solving with Solver, 288 - 292
LP (linear programming) models, 238 , 261
frequency and monetary values, 275 - 278
frequency values, 242 - 244 monetary values, 245 - 247 one dimensional RFM models,
238 - 247 recency and frequency values,
261 - 270 recency and monetary values,
271 - 274 recency values, 238 - 241 three dimensional RFM models,
279 - 284
two dimensional RFM models, 261 - 278
marketing campaign optimization, 237
monetary values, 230 OCR model
record summary via pivot tables, 232 - 233
RFM (recency-frequency-monetary) value framework and GP models, 285 - 292
score assignments via VLOOKUP function, 234 - 237
recency values, 228 - 229 review questions, 250 - 251
Rolls Bakery GP model, 130 , 131 aspiration level, 132 decision variables, 133 deviational variables, 134 - 136 formulating, 134 - 135 , 138 - 139
constraints, 133 - 134 non-negativity constraints, 137 objective function, 137 - 138 steps of, 133 - 134 system constraints, 137
goals deviation, 132 prioritizing, 132 - 133
production requirements, 130 - 131 solving with Solver, 139 - 142
Rolls Bakery Integer GP model, 169 - 172
Rolls Bakery IP model, 162 - 163 , 165 - 166
Rolls Bakery LP model constraints
identifying, 31 non-negativity constraints, 31
decision variables, defining, 29 - 30 graphical approach, 35 , 38 - 39
area of feasible solutions, graphing, 35 - 37
coordinates for point of optimal solution, 39 - 40
value of objective function at point of optimal solution, 40
objective function formulating, 30 - 31 graphing, 38 - 39
overall formulation, 32 overview, 26 - 27

INDEX 379
solving Integer LP models with Solver, 165 - 166
solving with Solver, 48 - 51 Answer Report, 51 entering LP formulation, 49 - 51 Excel template creation, 48 - 49
S sensitivity analysis
changes in contribution coefficients, 84
changes in right-hand side values, 81 - 83
NLP (nonlinear programming), 109 - 110
transportation models, 198 contribution coefficients, 200 demand constraints, 198 - 199 supply constraints, 198 - 199
Sensitivity Report, 81 - 84 changes in contribution
coefficients, 84 changes in right-hand side
values, 81 - 83 sets of constraints
identifying, 76 - 77 PoliCom LP model, 33 - 34 Rolls Bakery LP model, 31
non-negativity constraints, 77 PoliCom LP model, 34 Rolls Bakery LP model, 31
shadow prices, 81 - 82 shipment models, 191 , 209 - 211
Big Data, 209 Danaos Corporation and ORISMA,
190 review questions, 211 - 212 RFID (radio free identification), 209 transportation models, 191
formulating, 191 - 193 network diagram, 193 - 195 , 198 sensitivity analysis, 198 - 200 solving with Solver, 195 - 198
transshipment models, 201 formulating, 202 - 205 network diagram, 201 , 208 - 209 solving with Solver, 205 - 209
shortcut keys, 329 - 330 Show Iteration Results option
(Solver), 354
simulation models, 305 - 306 , 319 - 320 BBA (Blood Bank Agency) model
computer simulation models, 315 - 316
conceptual models, 314 - 315 data collection, 315 design experiments, 316 - 318 output analysis, 318 problem description, 314 recommendations, 318 results, 318 simulation runs, 316 - 318
Big Data, 319 Blood Assurance and simulation
models example, 304 continuous simulation models, 307 deterministic simulation models,
307 - 308 discrete simulation models, 307 dynamic simulation models, 307 methodology of, 308 , 314
computer simulation models, 312 , 315 - 316
conceptual models, 310 - 311 data collection, 311 - 312 , 315 design experiments, 312 - 313 ,
316 - 318 output analysis, 313 , 318 problem description, 308 , 314 recommendations, 313 - 314 , 318 results, 313 - 314 , 318 simulation runs, 313 , 316 - 318
review questions, 320 - 321 state of a system, defining, 306 static simulation models, 307 stochastic simulation models,
307 - 308 systems
defining, 306 state of a system, 306
SIS (Small Investment Services) NLP model, 110
constraints identifying, 113 - 114 non-negativity constraints,
114 - 115 defining decision variables, 110 - 111 formulating objective function,
112 - 113 operational data, 110 - 111 solving with Solver, 115 - 117

380 INDEX
solutions feasible solutions, graphing area of,
35 - 37 , 40 - 41 generating with Solver, 79 - 81 , 358 optimal solutions
finding value of objection function at point of optimal solution, 40 , 43
graphing area of, 39 - 40 graphing point of, 42 - 43
possible outcome solutions to LP model, 43 . See also Solver
multiple solutions, 43 - 44 no solutions, 44 - 46 unbounded solutions, 46 - 47
Solver, 16 - 17 , 77 - 78, 349 accessing, 349 - 350 adding to Tools menu, 349 advantages of, 47 - 48 Answer Report, 79 - 80 constraints
NLP models, 108 setting up, 78 , 349 - 352
generating solutions, 358 GP (goal programming) model
Integer GP models, 169 - 172 RFM
(recency-frequency-monetary) value framework, 288 - 292
solving, 146 - 148 investment portfolio NLP model,
115 - 117 IP (integer programming) model
assignment method, 173 - 178 Integer GP models, 169 - 172 nonlinear IP (integer
programming) model, 167 - 168
Rolls Bakery IP model, 165 - 166 solving Integer LP models,
165 - 166 LP (linear programming) models
frequency and monetary values, 276 - 278
Rolls Bakery LP model, 165 - 166
solving Integer LP models, 165 - 166
LP (linear programming) models in a RFM value framework
frequency values, 244 monetary values, 247
recency and frequency values, 263 - 270
recency and monetary values, 272 - 274
recency values, 240 - 241 three dimensional RFM models,
281 - 284 NLGP (nonlinear goal
programming) model, 145 - 148 NLP models, solving, 104
applying Solver, 106 constraints, 108 creating Excel templates,
104 - 106 interpreting solution results,
107 - 108 objective cells, 107 SIS (Small Investment Services)
model, 115 - 117 variable cells, 108
objective function, setting up, 78 , 349 - 352
options, 352 - 353 All Methods options, 353 - 355 Evolutionary options, 356 - 358 GRG Nonlinear options,
355 - 356 overview, 349 PoliCom LP model, 52 results, generating, 79 - 81 RFM (recency-frequency-monetary)
value framework GP (goal programming) model,
288 - 292 LP (linear programming)
models in a RFM value framework, 240 - 241 , 244 , 247 , 263 - 270 , 272 - 274 , 281 - 284
Rolls Bakery GP model, 139 - 142 Rolls Bakery LP model, 48 - 51
Answer Report, 51 entering LP formulation, 49 - 51 Excel template creation, 48 - 49
Sensitivity Report, 81 - 84 changes in contribution
coefficients, 84 changes in right-hand side
values, 81 - 83 SIS (Small Investment Services)
NLP model, 115 - 117 solutions, generating, 79 - 81 Solver Parameters dialog box, 78
INDEX 381
Solver Results dialog box, 358 solving limits, 354 - 355 transportation models, solving,
195 - 198 transshipment models, solving,
205 - 209 spreadsheet modeling (LP)
big optimization, 86 - 87 large LP models
decision variables, defining, 74 - 75
model parameters, calculating, 70 - 73
objective function, formulating, 76
overview, 68 - 69 PMI (Primer Manufacturer
Inc.) operational data, 69 set of constraints, identifying,
76 - 77 set of non-negativity
constraints, identifying, 77 LP model formulation, 68 overview, 66 - 67 review questions, 88 - 89 solving with Excel, 77 - 78
constraints, 78 objective function, 78 results, generating, 79 - 81 sensitivity analysis, 81 - 84 solutions, generating, 79 - 81
summary, 87 SQL (Structured Query
Language), 6 - 7 state of a system (simulation models),
defining, 306 static simulation models, 307 stochastic models, 13 stochastic simulation models, 307 - 308 Structured Query Language
(SQL), 6 - 7 success stories, 1 - 3
First Tennessee Bank, 2 LinkedIn, 2 - 3 Target, 2
SUMIF function, 332 - 331 SUMPRODUCT function, 339 - 340
transportation models, 196 transshipment models, 206
supply constraints, 198 - 199 systems (simulation models)
defining, 306 state of a system, defining, 306
T Target, 2 Tools menu, adding Solver to, 349 transportation models, 191 , 209 - 211
formulating, 191 - 193 network diagram, 193 - 195 , 198 review questions, 211 - 212 sensitivity analysis, 198
contribution coefficients, 200 demand constraints, 198 - 199 supply constraints, 198 - 199
solving with Solver, 195 - 198 TRANSPOSE function, 337 - 339 transshipment models, 191 , 201 ,
208 - 211 formulating, 202 - 205 network diagram, 201 , 208 - 209 review questions, 211 - 212 solving with Solver, 205 - 209
Tukey, John, 87
U - V unbounded solutions, LP (linear
programming) models, 46 - 47 Use Automatic Scaling option
(Solver), 354 Use Multistart option (Solver), 356 use of business analytics, 1 - 3 value of objective function at point of
optimal solution finding, 40
PoliCom LP model, 43 variable cells, Solver and NLP
models, 108 , 117 variables
decision variables, 74 - 75 investment portfolio NLP
model, 112 PoliCom LP model, 33 Rolls Bakery GP model, 133 Rolls Bakery LP model, 29 - 30 SIS (Small Investment Services)
NLP model, 112 WCF (World Class Furniture)
NLP model, 102 deviational variables
Rolls Bakery GP model, 134 , 135 - 136
WCF (World Class Furniture) GP model, 144

382 INDEX
variety challenges to optimization
models, 16 explained, 13 - 14
velocity challenges to optimization
models, 16 explained, 13
VLOOKUP function, 336 score assignments in a RFM
(recency-frequency-monetary) value framework, 234 - 237
simulation models, 315 volume
challenges to optimization models, 16
explained, 12 - 13
W WCF (World Class Furniture) GP
model, 142- 143 deviational variables, 144 NLGP (nonlinear goal
programming) model, 145 - 148 objective function, 145 operational data, 142 prioritizing goals, 143 - 145 solving with Solver, 146 - 148
WCF (World Class Furniture) NLP model, 101 , 143
constraints, identifying, 103 defining decision variables, 102 formulating, 101 - 103 non-negativity constraints, 104 operational data, 101 sensitivity analysis, 109 - 110 solving with Solver, 104
applying Solver, 106 constraints, 108 creating Excel templates,
104 - 106 Integer LP models, 167 - 168 interpreting solution results,
107 - 108 objective cells, 107 variable cells, 108
X-Y-Z Zara and mixed-IP modeling, 160


