26
Prayas Energy Group, Pune Powering 1.2 billion people: Case of India’s Access Efforts Shantanu Dixit Prayas (Energy Group), Pune 23 th February, 2012, Washington DC World Bank Energy Days
| Date post: | 14-Dec-2015 |
| Category: |
Documents |
| Upload: | landyn-manor |
| View: | 214 times |
| Download: | 0 times |

Prayas Energy Group, Pune
Powering 1.2 billion people:Case of India’s Access Efforts
Shantanu DixitPrayas (Energy Group), Pune
23th February, 2012, Washington DCWorld Bank Energy Days

‘Prayas’ means
‘Focused Effort’
Based at Pune, India
Focus on protection of
“Public Interest” in electricity
sector
Research based, policy advocacy Voluntary Org.
About Prayas …
Activities:• Research & intervention (regulatory, policy)• Civil Society training, awareness, and support
www.prayaspune.org/peg
2

Outline
• Why access and what is access ?
• Case of India’s access efforts
• Concluding comments
3
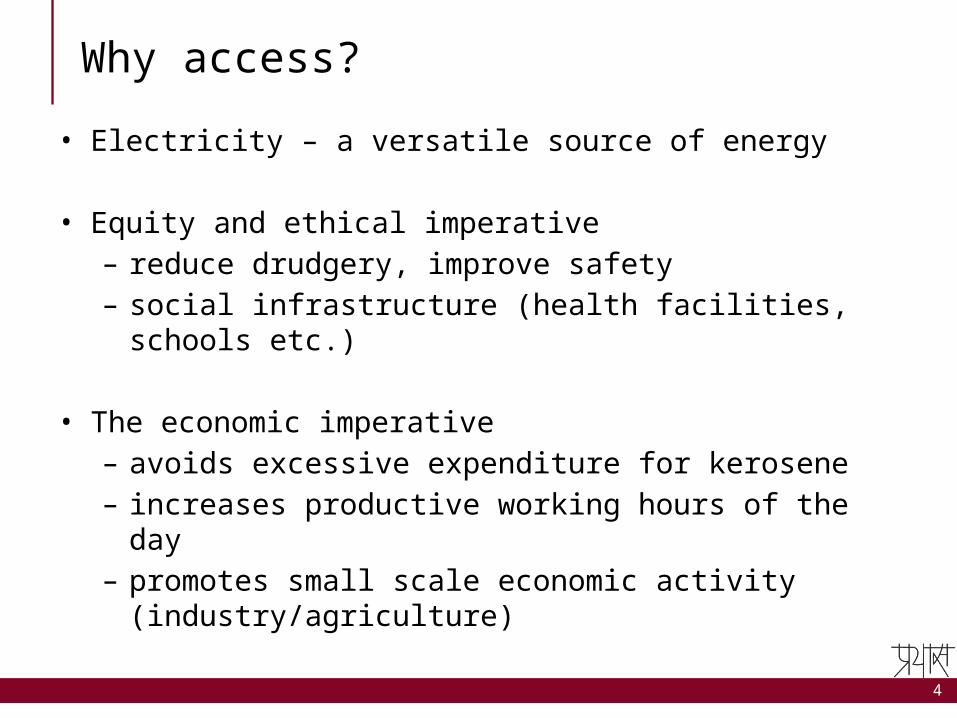
Why access?
• Electricity – a versatile source of energy
• Equity and ethical imperative– reduce drudgery, improve safety– social infrastructure (health facilities, schools etc.)
• The economic imperative– avoids excessive expenditure for kerosene – increases productive working hours of the day– promotes small scale economic activity
(industry/agriculture)
4

Electricity–HDI linkage
0 1,000 2,000 3,000 4,000 5,000 6,000 7,000 8,000 9,000 10,0000.00
0.10
0.20
0.30
0.40
0.50
0.60
0.70
0.80
0.90
1.00
f(x) = 0.0949324694151073 ln(x) + 0.0766045601341872R² = 0.838435463019572
HDI vs electricity consumption per capita/yr
Electricity consumption in kWh per capita per year (2007)
Hu
man
Dev
elo
pm
ent
Ind
ex (
HD
I, 2
007)
HDI=0.8; Elec use = 2210 kWh/capita according to the regression fit.
India (2007); HDI=0.612; Elec use = 542 kWh/capita
CubaEcuador
Sri Lanka
5

What is Access?
• Basic lighting • Basic domestic appliances• Social needs – schools, health facilities, street lighting• Productive needs – small industries, shops,
agriculture
6

India’s Access Efforts – Phase 1
• 1970s and 1980s– Food crisis led to adoption of ‘green revolution’– Need for increased irrigation and hence electrification of
agricultural pumps – through grid extension– Household and village electrification a by-product of this
productive load development
– Village electrification definition • “if electricity is being used within its revenue area .” (till
Oct 1997)
7

India’s Access Efforts – Phase 1
8
1971 1981 19910%
10%
20%
30%
40%
50%
60%
70%
80%
90%Percentage of Villages Electrified

India’s Access Efforts – Phase 2
• 1990s and 2000s
• Several grid based schemes: Kutir Jyoti Yojana (1988-89); Pradhan Mantri Gramodaya Yojana (2000-01); Accelerated RE programme (2003-04) & Accelerated Electrification of 1 lakh Villages & 1 crore Households (HHs) (2004-05)
• Attention to restructuring and financial viability
9

India’s Access Efforts – Phase 2
10
1971 1981 1991 20010%
10%
20%
30%
40%
50%
60%
70%
80%
90%Percentage of Villages Electrified

India’s Access Efforts – Phase 3
• Change in village electrification definition (2004): Electrified if basic infrastructure like Distribution Transformer and lines are provided in inhabited and dalit bastis; electricity is provided in public places like schools, PHCs etc and a minimum of 10% of HHs are electrified.
• National Electricity Policy 2005: “…the nation has set itself the target of providing access to all households in next five years.”– ensure minimum lifeline consumption 1 unit/household/day
as a merit good by 2012
• Challenge– Non-electrified population in India comparable to USA (> 300 Mil.
people), 1/5 persons in world without electricity lives in India
11

RGGVY Scheme Overview …1
Launch of RGGVY (rural electrification program)– Merging of earlier electrification schemes
• Launched in 2005 and addresses two components rural electrification– developing distribution infrastructure (Distribution
backbone with 33/11 kV or 66/11 kW substation and distribution transformer) in rural areas to meet electricity demand of all HHs
– free connections to all Below Poverty Line (BPL HHs)
12
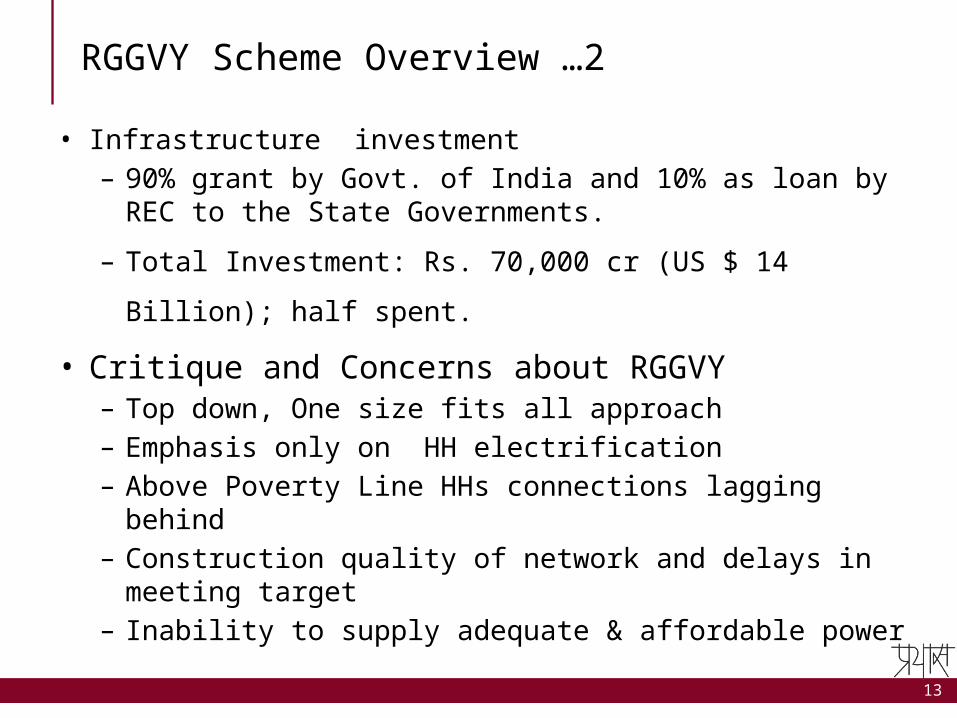
RGGVY Scheme Overview …2
• Infrastructure investment – 90% grant by Govt. of India and 10% as loan by REC to the
State Governments.
– Total Investment: Rs. 70,000 cr (US $ 14 Billion); half spent.
• Critique and Concerns about RGGVY– Top down, One size fits all approach – Emphasis only on HH electrification – Above Poverty Line HHs connections lagging behind– Construction quality of network and delays in meeting target– Inability to supply adequate & affordable power
13

RGGVY Achievements
• Physical infrastructure– 100,917 villages electrified (90% of target)– 18 Million HHs electrified (78% of target)
14
2001 2002 2003 2004 2005 2006 2007 2008 2009 2010 2011 2012 Jan
50
55
60
65
70
75
80
85
90
95
100
% Village electrification

Increase in rural HH electrification (%) through RGGVY
15
2005 2006 2007 2008 2009 2010 201140
50
60
70

RGGVY – What about electricity?
• Hrs. of supply often < 6 hrs./ day • PEG proposal for restructuring of RGGVY
– Less hrs of supply due to structural disincentive (loss of US cents 8/kWh of sale to HH)
– Central government to allocate low cost power to RGGVY consumers
– Need 14 GW capacity to address structural disincentive (likely addition in next 5 yrs ~ 100 GW)
(Refer Background Paper for Roundtable on Electricity for All : Challenges and Approaches, by PEG and PIC at Pune on 18th Feb 2012)
16

What about ‘Green Access’ ?
17
14989; 71%
1083; 5%
1779; 8%
3154; 15%
83; 0% 143; 1%
WindBiomassBagasseSmall HydroEnergy from WasteSolar
Decreasing costs and increasing potential of RE
Grid Connected RE Capacity (~24 GW) Generation (~ 50,000 MU)

18
CERC 09 MERC 10 MERC 11 CERC 10-11
RERC 10 KERC 10 GERC 10 Batch I, JNNSM
GERC 12 draft
CERC 12 draft
Batch II, JNNSM
0
2
4
6
8
10
12
14
16
18
20
Solar PV tariffs from Various ERCs/discovered tariffs from JNNSM Bidding
So
lar
PV
Ta
riff
in R
s/k
Wh
Bidding Range: 10.95 - 12.76;Avg tariff of 12.16, 32% lower than CERC benchmark
Bidding Range: 7.49 - 9.39;Avg tariff of 8.77, 43% lower than CERC benchmark
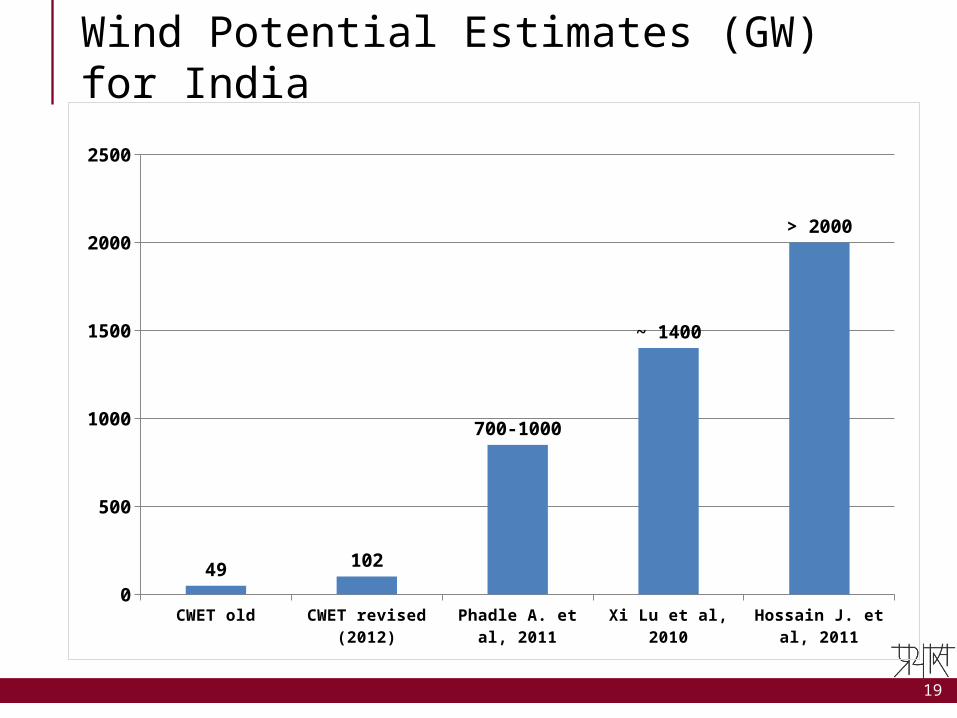
Wind Potential Estimates (GW) for India
19
CWET old CWET revised (2012) Phadle A. et al, 2011 Xi Lu et al, 2010 Hossain J. et al, 20110
500
1000
1500
2000
2500
49 102
700-1000
~ 1400
> 2000

Green Grid ?
• Grid essential for harnessing large scale RE – Geographically un-equal distribution– Varying generation, needs balancing mechanism
• Enables large investments, better monitoring, less drain on government finances
• Grid connected RE target ~15% by 2020 (~ 250 TWh)• Grid RE needed (2010-2010)
– 75 GW / 160 TWh – Equivalent to powering 100 mil. HH @ 100 units / month
20

21
Concluding Comments …1
• Grid– Enables large scale access– Green grid is feasible
• Challenges– Reliable supply, structural
disincentive– Grid O&M
• Off-grid– Suitable in specific
situations– Distributed grid-interactive
renewables
• Challenges– Equity in tariffs– High cost and O&M– Weak monitoring

Concluding Comments …2
• Primary objective should be providing ‘quality access’ as soon as possible
• Not just techno-economic optimum solution but must consider ‘political economy’ and ‘governance’ framework.
22

23
Thank You
Prayas Energy Groupwww.prayaspune.org/peg
Shantanu Dixit [email protected] Gambhir [email protected]
Sreekumar N. [email protected]

Off-grid approach …1
• From 2000, Ministry and New and Renewable Energy (MRNE) programs for remote villages – Village Energy Security Program, Remote Village Energy Program
• Current installation (as on 31.08.2011, source: MNRE):Remote villages/hamlets with DRE: 8846 nosBiomass gasifiers (rural): 15.5 MWSPV systems (> 1 kW): 72.5 MWWater mills/micro hydel: 1818 nos
• RGGVY – Decentralized Distributed Generation (DDG): for hamlets where grid connectivity is not feasible / cost effective. Capital subsidy of $ 100 Million earmarked.
24

Off-grid approach …2
Total HHs (Million) 259
HH Electrified by Central Grid (Million) 191 (74%)
Villages Electrified through Grid (31st Jan 2012) 551187(93%)
Number of Villages/Hamlets with lighting service through DRE (as per MNRE) 8846
HHs (Million) with lighting (4-5 hours) through DRE, assuming 100 HHs/hamlet. 0.9
25

Challenges for Off-grid
• Higher institutional capacity and community involvement need
• Limitations on provision of social and productive load in economical manner.
• In-equity in tariffs• Maintenance and Operation issues (technical, fuel,
costs, tariff collection etc)
26


