Page 1
UNIVERSITÀ DI PISA
Scuola di Dottorato in Ingegneria “Leonardo da Vinci” Stefano Bennati (Direttore)
Programma di Dottorato in Ingegneria Nucleare e Sicurezza
Industriale Walter Ambrosini (Presidente)
Pre-operational Tests
and Design Basis Accidents Simulations
for a Generation III+ Nuclear Power Plant
Tesi di Dottorato
Tutori Dottorando
Prof. Marino MAZZINI (Università di Pisa) Donato LIOCE
Prof. Walter AMBROSINI (Università di Pisa)
Dott. Alessandro ALEMBERTI (Ansaldo Nucleare S.p.A.)
Luglio 2013
Page 2
1
Abstract
This PhD thesis has been developed mainly at the Ansaldo Nucleare S.p.A. headquarters in
Genoa, in strict collaboration and with the support of Ansaldo and Westinghouse
personnel. The main topics of the present work are some peculiar preoperational tests
which will be performed on the first three built of the AP1000® nuclear power plants and
two Design Basis Accidents analyses performed to investigate and confirm the benefits of
a suitable combination of active and passive features of the plant. The first part of the work
covers one of the steps needed for the AP1000 licensing process and in particular for the
Combined Construction and Operating License. In fact, in the AP1000 design certification
(which constitutes the Appendix D to the 10 CFR 52 and, hence, it is a law for the United
States of America) it is clearly stated that, because of the first of a kind safety systems
characteristics of this plant, additional tests (“additional” with respect to the “traditional”
commissioning ones) are required in order to prove, on the first three built nuclear plants,
that the new features will operate as expected. Such tests must be performed before nuclear
fuel can be loaded and power production started.
In the first part of this thesis, three of these pre-operational tests have been considered:
1) Core Make-up Tanks hot recirculation test;
2) Core Make-up Tanks draindown test;
3) Automatic Depressurization System test.
Tests procedures have been developed in collaboration with Westinghouse and pre-tests
calculations have been performed by means of the Relap5 computer code. To this aim, a
detailed AP1000 Relap5 model has been developed and validated.
The second part of the thesis focuses on the benefits which can come by suitably
combining active and passive features. In fact, even if the safety related systems of the
AP1000 are all passive, active systems are anyway present and could be available
following an accident.
Analyzing two Design Basis Accidents, a 1” Cold Leg Small Break LOCA and an
Inadvertent Automatic Depressurization System Actuation, it is demonstrated that a
suitable combination of passive systems and active ones can decrease the impact on the
containment of the selected accidents, allowing a faster plant recovery and thus increasing
availability of the plant. Furthermore, it has been demonstrated that, should the active
Page 3
2
feature fail once it has been aligned, passive systems remain available and would restart
operation, so that no safety issue is raised due to the “interaction” between passive and
active systems.
The main motivation of this second part of the work is, in fact, the investigation of
“interaction” between passive and active systems. For plants which base their safety on
passive systems and are licensed taking into account only passive safety features,
interaction between active and passive systems can be considered to investigate the
possible benefits (if any, mainly in term of plant availability) so that suitable accident
management procedures can be developed.
In the following, section 1 details the motivations for the present work, section 2 reports a
summary of the AP600 and AP1000 Westinghouse test program conducted during the
Design Certification of the two designs, section 3 describes the developed Relap5 AP1000
model, section 4 and section 5 focus on the pre-operational tests and Design Basis
Accidents analyses (with suitable combination of active and passive safety systems)
respectively. Conclusions are drown in section 6.
The present work has been developed strictly following the Ansaldo Nucleare S.p.A.
Quality Assurance Procedures.
AP1000® is a trademark or registered trademark in the United States of Westinghouse Electric
Company LLC, its subsidiaries and/or its affiliates. This mark may also be used and/or registered in
other countries throughout the world. All rights reserved. Unauthorized use is strictly prohibited.
Other names may be trademarks of their respective owners.
©2012 Westinghouse Electric Company LLC
All Rights Reserved
Page 4
3
Acknowledgements
First of all I would like to thank my company, Ansaldo Nucleare S.p.A., and in particular
my manager Alessandro Alemberti to have given me the possibility to perform this PhD
work.
Ansaldo Nucleare S.p.A. and Westinghouse personnel helped me during the execution of
the different steps of this project and I wish to thank them all for their professionalism,
support and cooperation.
Even if it would be just too long to mention everyone, at least I would like to acknowledge
Ms Luciana Barucca who acted as my direct supervisor and Ms Monica Frogheri and Mr
Alessandro Alemberti who acted as internal peer reviewers of the performed activity. Their
technical contribution was essential.
Furthermore I would like to thank Mr Mike Asztalos and Mr John Bufford who were my
most direct interfaces in Westinghouse. The cooperation with Mike, John and the other
engineers of their team was strong and fruitful. Their suggestions, advices and review
activities were a big contribution. In addition Mike took charge to “mediate” with the
Westinghouse Upper Management, whose approval was necessary for the publications
related to this PhD.
Then I would like to thank my tutors at the University of Pisa, professor Marino Mazzini
and professor Walter Ambrosini, for their suggestions and for their supervising activities,
and moreover for everything I have learned from them during my University carrier.
Professor Mazzini encouraged me in starting a PhD at the University of Pisa, getting my
manager approval before informing me on this possibility! Really many thanks for that.
And professor Ambrosini encouraged me in trying to make some publications on the
performed work even if it was a difficult task because of the sensible data object of this
thesis: but I finally got my work published (at least in part).
The biggest thank goes to my wife, my family and my friends for their support and
patience (in particular my wife ).
Page 5
4
Content
Abstract ............................................................................................................................................... 1
Acknowledgements ............................................................................................................................. 3
Content ............................................................................................................................................... 4
List of abbreviations ............................................................................................................................ 6
1. Introduction ................................................................................................................................ 8
1.1. AP1000 passive approach to a LOCA .................................................................................. 9
1.2. 10 CFR 52 and AP1000 licensing process .......................................................................... 12
1.2.1. Early Site Permit ........................................................................................................ 13
1.2.2. Standard Design Certification ................................................................................... 15
1.2.3. Combined Construction and Operating License ....................................................... 17
1.2.4. The AP1000 case ....................................................................................................... 19
1.3. AP1000 Active Defense in Depth Systems ........................................................................ 21
2. AP600 and AP1000 test program summary .............................................................................. 25
2.1. Core Make-up Tank test program ..................................................................................... 25
2.2. Automatic Depressurization System test program ........................................................... 27
2.3. Advanced Plant Experiment (APEX-600) Test Program .................................................... 31
2.4. OSU APEX-1000 Test Program .......................................................................................... 35
2.5. SPES-2 High-Pressure, Full-Height Integral-Systems Test Program .................................. 37
3. AP1000 Relap5 Input Model Description .................................................................................. 44
3.1. Reactor Pressure Vessel .................................................................................................... 44
3.2. Reactor Coolant System Main Loops (SGs primary side included) ................................... 57
3.3. Reactor Coolant Pumps ..................................................................................................... 59
3.4. Pressurizer ......................................................................................................................... 59
3.5. Automatic Depressurization System ................................................................................. 60
3.6. Steam generators (secondary side) .................................................................................. 62
3.7. Passive Residual Heat Removal Heat Exchanger .............................................................. 65
3.8. In-containment Refueling Water Storage Tank ................................................................ 66
3.9. Core Make-up Tanks ......................................................................................................... 67
3.10. Accumulators .................................................................................................................... 69
Page 6
5
3.11. Chemical and Volume Control System .............................................................................. 69
3.12. Startup Feedwater System and Steam Dump System ...................................................... 70
3.13. Normal Residual Heat Removal System ............................................................................ 70
3.14. Containment Recirculation System ................................................................................... 71
3.15. Control and Protection System ......................................................................................... 71
3.16. Steady state calculations ................................................................................................... 72
4. Pre-operational tests: procedures definition and pre-tests calculations ................................. 73
4.1. Relap5 input model modifications .................................................................................... 75
4.2. CMTs hot recirculation test ............................................................................................... 76
4.2.1. CMTs hot recirculation test procedure ..................................................................... 76
4.2.2. CMTs hot recirculation test simulation results ......................................................... 77
4.3. CMTs draindown test ........................................................................................................ 85
4.3.1. CMTs draindown test procedure .............................................................................. 85
4.3.2. CMTs draindown test simulation results .................................................................. 86
4.4. ADS test ............................................................................................................................. 92
4.4.1. ADS test procedure ................................................................................................... 92
4.4.2. ADS test simulation results ....................................................................................... 93
5. Design Basis Accident Analyses with suitable combination of active and passive systems ... 104
5.1. RNS impact on ADS stage 4 actuation ............................................................................. 104
5.2. ADS inadvertent actuation: accident analysis ................................................................. 107
5.3. 1” SBLOCA: accident analysis .......................................................................................... 124
6. Conclusions and perspectives ................................................................................................. 140
7. References ............................................................................................................................... 144
Page 7
6
List of abbreviations
ACC Accumulator
ACRS Advisory Committee on Reactor Safeguards
ADS Automatic Depressurization System
AP1000 Advanced Passive 1000 plant
APEX Advanced Plant Experiment (facility)
AOV Air Operated Valve
CMT Core Make-up Tank
COL Combined Construction and Operating License
CVS Chemical and Volume Control System
DBA Design Basis Accident
DCD Design Control Document
DCR Design Certification Rule
DiD Defense in Depth (systems)
DVI Direct Vessel Injection
EPR European Pressurized Reactor
ESP Early Site Permit
IRWST In-containment Refueling Water Storage Tank
ITAAC Inspections Tests Analyses and Acceptance Criteria
FWS Start-up Feedwater System
HX Heat Exchanger
LBLOCA Large Break Loss of Coolant Accident
LOCA Loss of Coolant Accident
LSTF Large Scale Test Facility
OSU Oregon State University
Page 8
7
PC-DAS Personal Computer - Data Acquisition System
PMS Protection and Safety Monitoring System
PORV Power Operated Relief Valve
PRHR Passive Residual Heat Removal System
PCS Passive Containment Cooling System
PIRT Phenomena Identification and Ranking Table
PRZ Pressurizer
RCP Reactor Coolant Pump
RCS Reactor Coolant System
RNS Normal Residual Heat Removal System
ROSA Rig Of Safety Assessment
RPV Reactor Pressure Vessel
SBLOCA Small Break Loss of Coolant Accident
SDC Standard Design Certification
SG Steam Generator
SGTR Steam Generator Tube Rupture
SIET Società Informazioni Esperienze Termoidrauliche
SPES Simulatore per Esperienze di Sicurezza
SWR Steam Water Reservoir
T-H Thermal-Hydraulic
US-NRC Unites States-Nuclear Regulatory Commission
Page 9
8
1. Introduction
The well-known Figure 1 (Generation IV International Forum, 2012) shows the different
nuclear power plants generations: it can be seen how, nowadays, the so-called generation
III systems are the current operating ones, while generation III+ systems have been
designed and some of them are in an advanced construction stage (some even in
operation).
In the context of advancing the operating systems to more reliable, safe and secure ones,
the Westinghouse Electric Company research in conceiving and developing an advanced
but still based on proven technology nuclear reactor has been fulfilled in the design of the
AP600 (Tower et al., 1998), a nuclear power plant in which all the safety related functions
depend on passive systems with no operator action. The commercially available AP1000
plant design (Schulz, 2006), a generation III+ system, was developed starting from AP600
to be more cost competitive. This is the main reason for which Westinghouse initiated the
effort of developing the AP1000 design, which retains all the basic characteristics of the
AP600 design. In this design, passive systems are used for core cooling, containment
isolation and containment cooling, and maintenance of main control room emergency
habitability: following any design basis event, passive safety systems can maintain the
power plant in safe conditions for an indefinite period of time with no or very limited
operator action and no on-site or off-site AC power sources1. This plant is now being built
in two locations in China (Sheng Zhou and Xiliang Zhang, 2010).
While a detailed description of the AP1000 design can be found in Schulz (2006), also
section 3 (in which the developed AP1000 Relap5 model is described) of this thesis offers
some interesting details of this plant.
Next section 1.1 details the AP1000 passive approach to a LOCA.
1 The plant can cope against all the Design Basis Accidents for 72 hours. After that time, simple water
transfer actions, consisting essentially in restoring the Passive Containment Cooling Water Tank (see section
1.1) inventory, can extend the grace period practically indefinitely.
Page 10
9
Figure 1: Nuclear Power Plants generations (from Generation IV International Forum
website)
1.1. AP1000 passive approach to a LOCA
Figure 2 shows a scheme of the AP1000 passive safety injection system. There are three
sources of passive safety injection, in addition to the recirculation of the containment
sumps; they provide coolant to the RCS via two independent and redundant Direct Vessel
Injection (DVI) lines. In case of a LOCA, the reactor is tripped and the two Core Make-up
Tanks (CMTs) provide for immediate coolant make-up and boration. The CMTs are
connected to the Reactor Coolant System (RCS) through a discharge injection line and a
cold leg inlet pressure balance line. The discharge line is isolated by two normally closed,
parallel air-operated isolation valves that open on a loss of air pressure or electrical power.
The pressure balance line is normally open to maintain the CMTs at RCS pressure and it is
well insulated and routed continuously upward from the top of the cold leg to a high point
close to the top of the CMT. This arrangement ensures that the water in the line will remain
hot, which will provide for natural circulation injection of the CMT water, as the discharge
line valves open. The CMTs can operate in two different modes, depending on the RCS
conditions. If the cold legs are filled with water, CMTs operate in a water recirculation
mode driven by the differential density due to the hot reactor coolant in the CMT balance
Page 11
10
line and the colder water within the CMT. If the cold legs become voided, as they do
during LOCAs, the CMTs will operate in a steam-displacement (or compensated) injection
drain-down mode. In this mode, the driving force is based on gravity and the density
difference between steam from the cold legs and water in the CMTs (Westinghouse 2010).
Two ACCumulators (ACCs) are also provided which can inject borated water whenever
the RCS pressure becomes lower than the ACCs nitrogen cover gas pressure.
The IRWST water is available for RCS makeup: the atmospheric IRWST can inject into
the RCS whenever the RCS pressure becomes lower than the IRWST water head. The
injection of the ACCs and IRWST is dependent on the depressurization of the RCS, which
can be “controlled” via the Automatic Depressurization System. The ADS consists of two
identical trains of four stages each: the first three stages are connected to the pressurizer
dome and discharge within the IRWST through two spargers, while the fourth stages are
connected to the RCS hot legs and discharge directly in the containment loop
compartments. The ADS is capable, if needed, to depressurize the plant so that the gravity
driven water injection from IRWST is available. Finally, the AP1000 containment is
configured such that the water from the postulated break (including the safety injection
water) floods the lower portion of the containment to an elevation above the RCS loop
piping. This water is returned to the reactor through two redundant and diverse
containment recirculation paths.
The decay heat is evacuated through the Passive Residual Heat Removal Heat eXchanger
(PRHR-HX), which is located in the IRWST: heat is transferred to the initially cold water
contained in the IRWST by natural circulation of the RCS water. In this way decay power
is transferred from the primary coolant to the IRWST water which heats up and eventually
boils. The produced steam is passively condensed on the inner containment steel surface by
means of the Passive Containment Cooling System (PCS, illustrated in Figure 3) and re-
directed in the IRWST via a gutter system. The PCS cools the containment following any
event which results in energy release into the containment so that containment design
pressure is not exceeded and pressure inside containment is rapidly reduced. The steel
containment vessel provides the heat transfer surface that removes heat from inside the
containment and transfers it to the ultimate heat sink, the atmosphere. Heat is removed by
passively spraying water onto the outside surface of the containment steel shell, where the
water is heated and evaporates into the cooling passive air flow path. The water is provided
Page 12
11
from a tank located on top of the containment shield building and drains by gravity by
opening either one of two, normally closed, fail-open valves in parallel lines, or by opening
diverse, battery powered, motor operated valve in a third flow path.
Figure 2: AP1000 passive safety injection system scheme
Figure 3: AP1000 Passive Containment Cooling System
Page 13
12
From what reported above, it can be understood how this plant, whose nuclear safety is
based entirely on passive systems, is really a first of a kind. This peculiarity has had and
has some consequences on the AP1000 licensing process, which is described in some detail
in the next sections.
1.2. 10 CFR 52 and AP1000 licensing process
The AP1000 nuclear power plant is licensed according to the 10 CFR Part 52 (United
States Nuclear Regulatory Commission): this new licensing procedure is schematized in
Figure 4. Essentially the applicant has to obtain a Combined Construction and Operating
License (COL) in order to operate a nuclear power plant. In applying for a COL, an Early
Site Permit (ESP) and/or a Standard Design Certification (SDC) can be referenced - if the
case - in order to allow early resolution of the request. In fact safety and environmental
issues already resolved in the ESP and SDC are not re-considered during a COL
application. Following paragraphs give details on each of the three steps (from NRC
website).
Figure 4: NRC 10 CFR 52 licensing process (from NRC website)
Page 14
13
1.2.1. Early Site Permit
Under the NRC’s regulations in 10 CFR Part 52, the agency can issue an early site permit
for approval of one or more sites separate from an application for a construction permit or
combined license. Such permits are valid for 10 to 20 years and can be renewed for an
additional 10 to 20 years. They address site safety issues, environmental protection issues,
and plans for coping with emergencies, independent of the review of a specific nuclear
plant design. The scheme for ESP granting is reported in Figure 5.
An application for an early site permit must contain the following information:
the boundaries of the site, including a discussion of the exclusion area for which the
applicant has the authority to remove or exclude persons or property;
characteristics of the site, including seismic, meteorologic, hydrologic, and
geologic data;
the location and description of any nearby industrial, military, or transportation
facilities and routes;
the existing and projected future population of the area surrounding the site,
including a discussion of the expected low-population zone around the site and the
locations of the nearest population centers;
an evaluation of alternative sites to determine whether there is any obviously
superior alternative to the proposed site;
the proposed general location of each plant on the site;
the number, type, and power level of the plants, or a range of possible plants
planned for the site;
the maximum radiological and thermal effluents expected;
the type of cooling system expected to be used;
radiological dose consequences of hypothetical accidents;
plans for coping with emergencies.
Page 15
14
Figure 5: ESP granting process (from NRC website)
Once the application has been sub-mitted, NRC staff conducts its review according to the
applicable standards set out in 10 CFR part 50 (US-NRC) and its appendices and 10 CFR
part 100 (US-NRC). Several meetings allowing public participation are integral part of the
review process. NRC produces a safety evaluation report which, together with the
application, is reviewed by the Advisory Committee on Reactor Safeguards (ACRS, an
independent advisory group of technical experts) in a public meeting. The ACRS reports
results of the review to the NRC’s five members Commission. Finally decision on issuance
of the ESP is taken according to the whole produced documentation.
As an example, Figure 6 reports the ESP applications in US.
Page 16
15
Figure 6: ESP applications in US (from NRC website)
1.2.2. Standard Design Certification
Figure 7 shows the Standard Design Certification (SDC) granting process. By issuing a
design certification, NRC approves a nuclear power plant design, independent of an
application to construct or operate a plant. A design certification is valid for 15 years, but
can be renewed for an additional 10 to 15 years. An application for a standard design
certification must contain a detailed description of the design, including the proposed tests,
inspections, analyses, and acceptance criteria. Once the application is received, NRC staff
reviews it in accordance to the applicable documentation (e. g. NUREG-800, US-NRC)
and produces a safety evaluation report (several meetings allowing public participation are
integral part of the review process). The ACRS reviews each application for a standard
design certification, together with the NRC staff’s safety evaluation report, in a public
meeting. The ACRS reports results of the review to the NRC’s five members Commission.
If the design is acceptable, the NRC staff can then certify it through a rulemaking. Under
Page 17
16
this process, the NRC publishes a public notice of the proposed rule in the Federal Register
seeking public comments. The NRC reviews the comments and makes any changes to the
final rule, which is then published in the Federal Register and becomes an appendix to the
10 CFR Part 52 of the regulations.
As an example, Figure 8 reports the SDC applications in US.
Figure 7: SDC granting process (from NRC website)
Figure 8: SDC applications in US (from NRC website)
Page 18
17
1.2.3. Combined Construction and Operating License
Figure 9 shows the Combined Construction and Operating License (COL) granting
process. By issuing a COL, the NRC authorizes the licensee to construct and (with
specified conditions) operate a nuclear power plant at a specific site, in accordance with
established laws and regulations. A COL is valid for 40 years and can be renewed for an
additional 20 years. The application for a combined license must contain essentially the
same information required in an application for an operating license issued under 10 CFR
Part 50. The application must also describe the Inspections, Tests, Analyses, and
Acceptance Criteria (ITAAC) that are necessary to ensure that the plant has been properly
constructed and will operate safely:
Analysis: To be used when verification can be accomplished by calculation,
mathematical computation, or engineering or technical evaluations of the as-built
structures, systems, or components.
Inspection: To be used when verification can be accomplished by visual
observations, physical examinations, review of records based on visual
observations, or physical examinations that compare the as-built structure, system,
or component condition to one or more design description commitments.
Test: to be used when verification can be accomplished by the actuation or
operation, or establishment of specified conditions, to evaluate the performance or
integrity of the as-built structures, systems, or components.
An application for a combined license may reference a standard design certification, an
early site permit, both, or neither. If the application references a standard design
certification, the applicant must perform the inspections, tests and analyses for the certified
design (see section 1.2.2). If the application does not reference a standard design
certification, the applicant must provide complete design information, including the
information that they would otherwise have submitted for a standard design certification. If
the application references an early site permit, the applicant must demonstrate that the
design of the plant is compatible with the early site permit. The application must also
include information on those issues that were not required with the early site permit
application, such as the need for power from the proposed plant. If the application does not
reference an early site permit, the applicant must provide the site information that would be
included in an early site permit.
Page 19
18
Once the application is received, NRC staff reviews it in accordance with the Atomic
Energy Act (United States Atomic Energy Commission, 1954), NRC regulations (e.g.
NUREG-800, US-NRC) and the National Environmental Policy Act (US government).
Several meetings allowing public participation are integral part of the review process. NRC
produces a safety evaluation report. The ACRS reviews the application for a combined
license, together with the NRC staff’s safety evaluation report, in a public meeting. The
ACRS reports results of the review to the NRC’s five members Commission. Finally the
decision is taken.
After issuing a combined license, the NRC verifies that the licensee has completed the
required Inspections, Tests, and Analyses, and that the Acceptance Criteria have been met
before the plant can operate. In fact, during and following the construction, Inspections,
preoperational Tests and Analyses are performed to demonstrate that equipment and
systems perform in accordance with the Acceptance Criteria so that initial fuel loading,
initial criticality, and subsequent power operation can be safely undertaken.
As an example Figure 10 reports COL applications in US.
Figure 9: COL granting process (from NRC website)
Page 20
19
Figure 10: COL applications in US (from NRC website)
1.2.4. The AP1000 case
A good summary of the AP1000 licensing history can be found in Schulz (2006). Actually
AP1000 licensing process started very early in 1992 when AP600 safety analysis and
probabilistic risk assessment reports were submitted to the NRC. The Commission
documented its acceptance of the AP600 plant in the Final Design Approval (FDA) on
September 3, 1998. In December 1999, the NRC issued the Design Certification for AP600
as Appendix C of 10CFR Part 52. This made the AP600 the only licensed passive safety
system nuclear power plant in the world. Because of the first of a kind features of this
plant, several experimental campaigns were needed in order to validate the design of the
Page 21
20
new systems and to qualify the safety analysis codes (see section 2). A detailed summary
of these experimental campaigns can be found in the AP600 Final Safety Evaluation
Report (NUREG-1512).
On March 28, 2002, Westinghouse submitted to US NRC an application for Final Design
Approval and Design Certification of the AP1000 standard plant, based on the Revision 0
of the AP1000 Design Control Document (DCD, Westinghouse, 2002). The NRC formally
docketed the application on June 25, 2002 signifying its acceptance as a complete safety
case.
Because of the few design changes from AP600, approximately 80% of the AP600
Standard Safety Analysis Report remains unchanged for AP1000. In particular NRC found
the codes and test programs used for AP600 licensing applicable also to the AP1000
design, with few exceptions which required further testing (see section 2.4 and AP1000
Final Safety Evaluation Report, NUREG-1793).
After review of the submitted documentation and sub-sequent versions of the AP1000
DCD, on January 27, 2006, NRC issued the final Design Certification Rule (DCR) for the
AP1000 design in the Federal Register (71 FR 4464). Applicants or licensees intending to
construct and operate a plant based on the AP1000 design may do so by referencing its
DCR, as set forth in Appendix D to Title 10, Part 52, of the Code of Federal Regulations
(10 CFR Part 52, Appendix D).
Among the other information, the AP1000 DCD specifies all the tests which have to be
completed before the plant can start operation. Most of these tests are the normal
commissioning tests which will be performed for all the AP1000 plants. Anyway, since
AP1000 has some nuclear safety related features which are first of a kind, it is a
requirement of the licensing process to demonstrate, on the first three built plants, that such
systems perform as expected.
In particular in the DCD it is clearly stated that, for the first three plants, two additional
CMTs tests must be performed in order to verify their ability to work effectively in water
recirculation mode, transit to draindown mode and finally to drain. Furthermore, in the
DCD it is clearly stated that, for the first three plants only, the ADS must be tested by
blowing-down the reactor coolant system.
The first part of this PhD activity is related to these three tests:
1) CMTs hot recirculation test
Page 22
21
2) CMTs draindown test
3) ADS test
As said above it is a licensing requirement to perform these tests. They will be performed
without any nuclear fuel in the reactor pressure vessel: in fact successful performance of
these tests is required to be allowed to load the nuclear fuel thus starting power operation.
Since these tests are required in the AP1000 licensing process and will be performed on the
real plant, it is essential to develop suitable test procedures and perform accurate pre-tests
calculations in order to make sure that the tests will be successfully performed without
needing further runs and limiting the thermal and mechanical stresses to the plant.
The first part of this PhD activity has been focused on the design of the procedures for the
selected tests and on the performance of detailed pre-test calculations. The activity has
been performed in collaboration with Ansaldo Nucleare and Westinghouse Electric
Company personnel.
In order to perform the pre-tests calculations, the Relap5 computer code (Information
Systems Laboratories Inc., 2002.) has been used and a detailed AP1000 model has been
developed. The developed model is described in detail in section 3, while section 4
describes the pre-operational tests procedure and pre-tests calculations results.
Summarizing, it should be noted that the AP1000 is the first commercially available
nuclear power plant whose nuclear safety is guaranteed by passive safety systems. AP1000
licensing process requires peculiar pre-operational tests of these systems on the first three
built nuclear power plants. The first part of this PhD has given a contribution to this
process since tests procedures and pre-tests calculations for three selected tests have been
designed and performed.
1.3. AP1000 Active Defense in Depth Systems
As reported above, the over-arching design principle of the AP1000 plant with respect to
nuclear safety is that all the safety features are passive. They use natural driving forces
such as gravity and natural convection and the plant is capable to mitigate all the DBAs
with neither AC power source nor operator actions (Westinghouse, 2010) (or very limited
actions in some operational configurations to ensure adequate spent fuel pool cooling): in
Page 23
22
particular, the nuclear safety of the AP1000 plant in case of a DBA is by no means affected
by the coincidence of a loss of offsite power or station black-out event.
Looking back to Figure 1, it can be seen that this is a different philosophy in comparison to
what occurs for other generation III+ systems like, for example, the EPR (Bonhomme,
1999). In this reactor, the nuclear safety is guaranteed essentially by active systems: in
particular, for core cooling, four trains of essentially active safety systems are employed.
These trains are identical to each other and physically separated in order to prevent
common causes of failure.
It seems that relying on passive systems or active ones are rather alternative choices, but,
in this thesis it is highlighted how passive and active systems could be employed together
with tangible benefits for the nuclear power plant. Actually this is not drastically new: in
fact it can be easily noted that, even in the first generation of nuclear systems, a certain mix
between active and passive safety features has always existed and it is retained also in the
active-systems-safety-based generation III+ reactors, EPR included. In all the pressurized
water reactors (from generation I to generation III+) the active safety systems employed
for core cooling, like for example the High Pressure Injection System (HPIS) and Low
Pressure Injection System (LPIS), have always co-performed together with passive
systems like for example the accumulators (for core cooling) and the gravity driven control
rods (for reactor shut down). The difference is that if from one side some generation III+
designs, like the EPR, have maintained the traditional active (and passive) safety features,
some others, like the AP1000, employ only passive features to manage the nuclear safety
of the reactor.
In fact we should distinguish the licensing strategy of a plant from the practical accident
management. The nuclear safety authority dictates that some dedicated safety systems, be
them active or passive, have to be employed in order to protect the plant against selected
design basis accidents. What it is important to note is that, in the licensing process of the
plant, the safety authority requires the licensee to demonstrate the safety of the plant
relying only on those features clearly identified as “safety related” and which have been
designed specifically for that purpose. All the other systems, even if they could be
available following an accident, are assumed to fail and do not give any contribution to the
accident resolution. For the AP1000 this means that Westinghouse, in the DCD chapter 15
safety analyses (Westinghouse, 2002), has demonstrated the safety of the plant assuming
Page 24
23
the failure of all the active systems, relying only on the passive ones, which are the only
systems specifically designed as safety related. All this, as said, holds for the licensing
process of the plant.
When coming to the practical accident management procedures design, the whole spectrum
of possibly available systems, being them passive or active, safety related or not-safety
related, should be investigated in order to evaluate the possible benefits which could come
suitably combining different systems operation. At the same time it should also be
demonstrated that failure of the not-safety related systems during the accident, hence once
they have come into operation, does not raise any safety concern.
For the AP1000 design, when AC power is available, the AP1000 passive systems can be
supplemented with simple, active systems, so called “Defense in Depth (DiD)” systems.
These active DiD systems use reliable and redundant active equipment, supported by the
use of DiD standby diesels to facilitate their functions when offsite AC power is not
available. These systems, even if not required for the safe response of the plant to a DBA,
are designed to minimize the demand on passive systems for the most frequent (intact
loop) transients, so as to provide a faster plant recovery.
In this thesis, and in particular in the second part of the PhD work, the possibility to
employ DiD systems also for more un-frequent accidents, and hence to achieve a
cooperation or mixing between active and passive features in order to increase the benefits
for the plant, has been investigated. Two AP1000 DBAs, an ADS inadvertent actuation and
a 1” SBLOCA occurring during normal power operation have been considered to
investigate the mitigation capability of a DiD system, and thus illustrate the multiple lines
of defense offered in the AP1000 design also for infrequent faults such as LOCAs.
The DBA safety analyses of these accidents postulate the failure of all the DiD systems
and the accident is mitigated only by the passive systems: in particular for a LOCA, all
four stages of the ADS actuate to allow water injection from the IRWST (section 1.1). To
provide an additional line of defense, the Normal Residual Heat Removal System (RNS),
an active DiD system, could be used by the operator if AC power is available to
successfully mitigate the event without ADS stage 4 actuation and IRWST water injection.
In particular, in this work, the two selected DBAs have been simulated postulating the
availability of the RNS to verify if the RNS can actually avoid the requirement on ADS
stage 4 and IRWST water injection.
Page 25
24
It should be noted that, as explained in section 1.1, the first three ADS stages discharge in
the IRWST with a limited direct impact to the containment. ADS stage 4, instead,
discharges directly in the containment atmosphere with a more relevant direct impact to the
containment. Avoiding stage 4 opening limits the direct impact of the selected accidents to
the containment and allows a faster plant recovery.
For the 1” SBLOCA, during the SPES2 experimental campaign, i.e. for the AP600, a test
was run in which the RNS was kept active and avoided ADS stage 4 actuation, as reported
in Bacchiani et al. (1995). In the present work such a demonstration is given for the
AP1000 and, moreover, the effectiveness of the RNS is demonstrated for another accident,
an inadvertent actuation of the ADS, which was not considered in the SPES2 experimental
campaign and for which the benefit in using the RNS is actually bigger. Furthermore, in
the present work it has also been demonstrated how failure of the RNS during the two
selected accidents, once it has come into operation, does not raise any safety concern since
passive safety systems remain available and can enter in operation.
Section 5 details what briefly introduced above: in particular the physics by which RNS
can avoid ADS stage 4 actuation is described in section 5.1, while sections 5.2 and 5.3
describe accidents analyses results.
In the next section, a brief description of the AP600 and AP1000 test program performed
by Westinghouse Electric Company during the Design Certification of the two plants is
reported (NUREG-1512 and NUREG-1793).
Page 26
25
2. AP600 and AP1000 test program summary
For the AP600 design certification, Westinghouse developed a design certification test
program utilizing both separate-effects and integral-systems facilities to investigate the
behavior of the AP600 passive safety systems and to develop a database for the validation
of the computer codes used to perform the transient and accident analyses. The test
programs can be broadly characterized as programs relating to reactor systems, to
containment systems and to components testing. The test program to investigate the
behavior of the passive core cooling systems include (1) the separate-effects tests on the
PRHR-HX, ADS, and CMT and (2) the integral system tests performed at the Advanced
Plant Experiment (APEX) facility and at the Simulatore per Esperienze di Sicurezza
(SPES) facility. Furthermore, NRC performed independent additional and confirmatory
tests on the Rig of Safety Assessment (ROSA) / Large Scale Test Facility (LSTF) in
collaboration with the Japan Atomic Energy Research Institute (some details can be found
in NUREG-1512 and Kukita et al. 1996).
Tests performed for AP600 led to the qualification of the safety analyses codes to predict
AP600 peculiar phenomena and, hence, to the AP600 Design Certification.
During AP1000 Design Certification Process, NRC evaluated the adequacy of each of the
AP600 test program for the AP1000 design, and concluded that additional test data were
needed to address liquid entrainment in the upper plenum, hot-legs and ADS stage 4
piping. As a result, Westinghouse added the APEX-1000 integral test program to the
AP1000 test program.
For completeness, in this section a summary of the AP600 and AP1000 test program
developed by Westinghouse Electric Company, according to the US-NRC AP1000 Final
Safety Evaluation Report (NUREG-1793), is reported. The discussion is limited to the
Integral Test Facilities and to the CMTs and ADS separate effect tests facilities, since the
first part of this PhD work is focused on the pre-operational tests related to these systems.
2.1. Core Make-up Tank test program
The CMT test program was a separate-effects test program developed to characterize the
CMT over the range of Thermal-Hydraulic (T-H, pressure, temperature, flow) conditions
Page 27
26
in the AP600. Important phenomena studied included thermal stratification in the CMT
and the effects of recirculation, draining, and plant depressurization on CMT behavior.
Tests were performed at the facility located at the Westinghouse Waltz Mill site in
Pennsylvania (USA). The test facility was approximately 3.3 m (10 ft) in height and 0.49
m (1.6 ft) in diameter. Compared to the actual AP600 and AP1000 CMT, the facility was
one-half of the height, and 1/7.77 and 1/8.69, respectively, of the diameters of the AP600
and AP1000 designs. The reactor vessel was simulated by a steam/water reservoir (SWR).
The CMT test component was connected to the SWR by a pipe simulating the cold-
leg/CMT pressure balance line, which came directly off the SWR, and by a drain line,
simulating the DVI line. The RCS cold-leg was not represented in this facility. The CMT
test facility was capable of operating up to approximately 17.2 MPaa (2500 psia) and 364
°C (688 °F). Data acquisition was accomplished using a Personal Computer (PC)-based
Data Acquisition System (PC-DAS). The facility was equipped with thermocouples,
including those to obtain detailed spatial measurements of CMT fluid and wall
temperatures, pressure transducers, including differential pressure transducers to measure
CMT level, and flowmeters.
The CMT test program began with cold preoperational tests in May 1993. The program
proceeded though several series of tests. The “100” series investigated condensation of
steam on the CMT walls, with and without the effects of noncondensable gases. The “300”
series looked at mixing, condensation behavior, and CMT draining when steam was
injected into cold water, such as might occur during a large SBLOCA or LBLOCA (i.e., no
recirculation to heat the CMT water). The “400” test series was similar to the “300" series,
but the system was depressurized gradually during the tests to assess the effect of changing
pressure on the draining behavior. The final “500” series of tests included a period of
recirculation between the SWR and the CMT to establish a desired temperature profile in
the CMT. After the recirculation period, the SWR water level was reduced to allow steam
to flow to the CMT, and the CMT was depressurized and drained. This series most closely
represented conditions in the CMT expected during non-LOCA transients (CMT
recirculation) and most SBLOCAs (recirculation, followed by draindown and
depressurization).
The test program was completed in September 1994. WCAP-14217, “Core Makeup Tank
Test Data Report”, and WCAP-14215, “AP600 Core Makeup Tank Test analysis”,
Page 28
27
respectively, provided the CMT test program final data report and test analysis report. The
scaling of the CMT tests for the AP600 design was documented in WCAP-13963, Revision
1, “Scaling Logic for the Core Makeup Tank Test”. In topical report WCAP-15613,
“AP1000 PIRT and Scaling Assessment Report”, Westinghouse provided its evaluation to
justify that the AP600 CMT test program is applicable to the AP1000 design.
NRC evaluated the CMT test program during the AP600 design certification review. The
commission determined that the final design of the test facility provided an adequate
representation of the key features of the RCS and connecting piping that would affect CMT
performance, such as the relative elevations of the steam-water reservoir (representing the
reactor vessel) and the tested component (representing the CMT) and the resistances of the
pressure balance line and CMT drain line.
The commission reviewed the final test matrix, and determined that the testing program
would permit acquisition of data over most of the operating range of the CMT in the
AP600, with respect to temperature, pressure, and flow, and would address the “important”
phenomena, as determined from the AP600 Phenomena Identification and Ranking Table
(PIRT).
The design and operation of the facility did not permit acquisition of data at very low
pressures. However, this was judged to be acceptable, since both of the integral test
facilities (see below) would operate down to those pressures and would provide additional
data for code validation in that range.
The NRC overall assessment of the CMT test program was that the data acquired during
the test program and verified to meet the Westinghouse acceptance criteria are valid and
applicable for use to validate computer models for the AP600.
For what the AP1000 is concerned, NRC, after review of WCAP-15613, “AP1000 PIRT
and Scaling Assessment Report”, considered CMT tests to be acceptable for the AP1000
design as they were for the AP600 design.
2.2. Automatic Depressurization System test program
The ADS test program consisted of separate-effects tests performed at the facility called
“VAPORE”, located at the Casaccia (Rome. Italy) Research Center (see Figure 11). It has
a full-size configuration of the AP600/AP1000 ADS stages 1, 2, and 3 (ADS-1/2/3) piping
Page 29
28
network, exhaust pipe, and sparger. The tests consisted of two phases with somewhat
different objectives. Phase A tests were performed for the ADS-1/2/3 with steam flow
through a sparger into a larger water-filled tank to investigate the capacity of the ADS
sparger in the IRWST and determine the dynamic effects on the IRWST structure.
Parameters of interest were sparger flow and pressure drop, tank T-H and structural
response, including condensation, thermal stratification, and condensation-induced
pressure loads on the tank walls.
The second part, Phase B1, was a test of the T-H behavior of the ADS piping network that
extends from the pressurizer into the IRWST. The test objective was focused only on the
T-H behavior of the ADS valves, piping, and sparger. The main parameter of interest was
the flow from the pressurizer to the simulated IRWST with various combinations of ADS
stages open, including choking at various locations through the valve/piping/sparger
network. The major T-H variable for these tests was the quality of the fluid entering the
ADS network. Steam-only blowdowns were performed using a discharge line from the top
of the steam-water supply tank. This discharge line contained a separator to remove
entrained liquid. A discharge line was also provided from the bottom of the supply tank to
obtain two-phase mixtures through the ADS network. A control valve in the bottom
discharge line from the supply tank was adjusted to allow the flow to be varied from
saturated liquid conditions to two-phase flow over a range of qualities. In addition, a series
of tests was performed with cold water flowing through the valve/piping network to aid in
determining the hydraulic characteristics of the valve/piping/sparger system under single-
phase, non-choked conditions.
For Phase A, the actual test component was only the sparger, installed in the quench tank.
Saturated steam was supplied to the sparger from a large supply tank.
The test facility was modified extensively for Phase B1. The supply tank, the large water
quench tank, and the sparger were retained, and a piping network representing one
complete group of ADS valves (stages 1, 2, and 3, with two valves in series per stage) was
added. One ADS valve in each stage was represented by an actual valve. The other valve in
each stage was represented by a spool piece containing an orifice to simulate the throat
area and loss characteristics of various potential valve designs. Exhaust piping led from the
ADS piping network to the same quench tank and sparger assembly used in Phase A. The
ADS piping, the valves and simulated valves, and the sparger were full-size components,
Page 30
29
and could operate up to full AP600/AP1000 pressure. The facility was equipped with
flowmeters, pressure transducers and thermocouples. Instrumentation to measure pressure
loads and tank response in the IRWST were included. Data acquisition was accomplished
using a computer-controlled PC-DAS.
The ADS test program is described in WCAP-13342 (“AP600 Automatic Depressurization
System Test”) and the Phase A facility configuration is described in WCAP-14149
(“VAPORE Facility Description Report, AP600 Automatic Depressurization System Phase
A Test”). The Phase B1 facility is described WCAP-14303, “Facility Description Report
AP600 ADS Phase B1 Tests”. Because the VAPORE facility incorporated full-scale
components, a formal scaling report was not necessary for this test program.
The Phase A program and selected test data are described in WCAP-13891 (“AP600
Automatic Depressurization System Phase A Test Data Report”).
Phase B1 of the ADS test program was documented in the final data report WCAP-14234,
“LOFTRAN & LOFTTR2 AP600 Code Applicability Document”, and the test analysis
was documented in the final analysis report WCAP-14305, Revision 3, “AP600 Test
Program ADS Phase B1 Test Analysis Report”.
Westinghouse did not perform ADS-4 separate-effects testing for the AP600 design since
ADS-4 was treated/sized conservatively and tested as part of the integral effects tests, and
Westinghouse took the same approach for the AP1000 standard plant design.
NRC evaluated the ADS test program during the AP600 design certification review. The
agency original review of the ADS test program in the VAPORE facility focused primarily
on the Phase B1 facility design, instrumentation, and test matrix. Scaling was not a
significant issue because of the full-size configuration of the ADS piping network, exhaust
pipe, and sparger.
NRC concluded that the design certification test program provided adequate coverage of T-
H conditions and addressed the “important” phenomena related to ADS performance
identified in the AP600 PIRT and, therefore, was acceptable. The only issue raised related
to the fact that, for each of the three ADS stages simulated, the downstream valve was not
actually a valve but a spool piece containing an orifice to simulate the throat area and loss
characteristics of various potential valve designs. Westinghouse response was to perform a
final phase, so-called B2, in which actual ADS control valves were used. NRC found tests
results acceptable and declared the issue “closed”.
Page 31
30
The ADS-1/2/3 system for the AP1000 standard plant design is identical to that of the
AP600 design. During the RCS blowdown, the flow through the ADS-1/2/3 is expected to
be choked. Simulations have revealed that upstream pressures in the AP1000 are very
similar to those in the AP600 design, as well as T-H conditions affecting ADS-1/2/3
performance. Consequently, tests executed to investigate ADS-1/2/3 performance for the
AP600 design, which included a wide range of actuation pressures and flow qualities, were
considered appropriate to represent conditions in the AP1000 standard plant design.
Therefore, NRC concluded that the ADS test program for the AP600 design also applies to
the AP1000 design.
Figure 11: VAPORE test facility
Page 32
31
2.3. Advanced Plant Experiment (APEX-600) Test Program
The APEX-600 test program was a major integral test program conducted by
Westinghouse for the AP600 design certification. Tests were performed at a facility
located on the Oregon State University (OSU) campus in Corvallis, Oregon (USA) (see
Figure 12 and Figure 13). The objective of the test program was to obtain integral-systems
data for the validation of computer codes used for AP600 safety analyses. Particular
emphasis was placed on low-pressure and long-term cooling behavior in design-basis
SBLOCAs. APEX-600 was a low-pressure, one-quarter-height representation of the
AP600 design, including the RCS and related components and all safety systems in direct
communication with the primary system. Although containment cooling systems were not
represented, the containment sump was simulated by two tanks. The “primary” sump tank
simulated containment sump volumes from which fluid could be recirculated back to the
RCS during the long-term cooling phase of a LOCA, and was connected to DVI lines. The
“secondary” sump tank simulated volumes in the AP600 containment from which fluid
could not be recirculated back to the RCS; fluid that entered the secondary sump was
unrecoverable for long-term cooling, as would be the case in the AP600 plant. The volume
scale of the facility was 1/192 while the reactor power, flow areas, and flow rates were
designed to have, respectively, the ratios of 1/96, 1/48, and 1/96. This means that APEX
was designed to have a response twice as fast as in AP600. The layout of the facility was
similar to the AP600 design, with two cold-legs and one hot-leg per loop and vertically
mounted reactor coolant pumps with no loop seals. In addition to the safety injection
systems (CMTs, accumulators, and IRWST) and the four-stage ADS, the PRHR-HX was
simulated by a scaled bundle in the IRWST. The facility was instrumented with over 700
thermocouples, flowmeters, pressure transducers, and void detectors.
WCAP-14124 (“AP600 Low Pressure Integral Systems Test at Oregon State University —
Facility Description Report”) and WCAP-13234, Revision 1 (“Long-Term Cooling Test”),
respectively, documented the facility design and test program specifications. An extensive
scaling analysis was performed for the APEX-600 facility and documented in WCAP-
14270, Revision 1 (“Low Pressure Systems Test Facility Scaling Report”, August 1997).
Tests were performed in 1994. Most of the test runs in the APEX-600 facility simulated
design basis accidents (DBAs) for the AP600, primarily SBLOCAs of various sizes and at
Page 33
32
different locations in the RCS. All of the tests included an extended period after the loop
was fully depressurized to investigate integral system T-H behavior during injection from
the IRWST, transition from IRWST to sump injection, and long-term recirculatory cooling
from the simulated sump. The two major variables affecting system behavior were break
size and location. Break size varied from (scaled) 12.7 mm (0.5 in.) to approximately 203
mm (8 in.). Break locations tested included the cold-leg, hot-leg, CMT pressure balance
line, and DVI line.
NRC evaluated the OSU/APEX-600 test facility during the AP600 design certification
review. In addition to the Westinghouse design certification testing, the NRC conducted a
confirmatory testing program in the OSU/APEX-600 facility. Insights from those
confirmatory tests that bear upon integral system behavior in general, and facility response
in particular, had been factored into the test program review.
As originally conceived, the facility was to be a low-pressure [approximately 345 kPaa (50
psia)] loop to investigate the last part of the plant depressurization and long-term cooling
behavior in SBLOCA events. Westinghouse and OSU gradually changed the design to
increase the maximum pressure to about 2.7 MPaa (400 psia), which improved scaling and
allowed a wider range of test conditions to be explored.
NRC determined that the final design was acceptable. Essentially, the entire primary
system was represented, including all safety-related systems, in a geometry very similar to
the actual plant design. While the containment itself was not simulated, the two sump tanks
provided a scaled representation of the volumes into which flow from the break and ADS-4
discharge, and condensate from the PCS would drain and recirculate to the RCS. The
facility was extensively instrumented to provide temperature, pressure, flow, and void
fraction data throughout the system.
The test matrix focused on SBLOCAs because (1) LOCAs are the only events to cause the
ADS to actuate and to progress to long-term cooling within the design basis; and (2)
LBLOCA response in the AP600 was calculated to be similar in many ways to
conventional designs, and Westinghouse asserted that important phenomena in LBLOCAs
related to long-term cooling would be similar to SBLOCA behavior. NRC agreed with the
Westinghouse approach, found this reasoning acceptable, and determined that the
OSU/APEX-600 test matrix provided adequate coverage of break size and location to
address important system-related phenomena identified in the AP600 PIRT.
Page 34
33
WCAP-14252, “AP600 Low-Pressure Integral System Test at Oregon State University
Final Data Report”, and WCAP-14292, Revision 1, “AP600 Low-Pressure Integral System
Test at Oregon State University Test Analysis Report”, respectively, described the test data
and test analyses for the OSU/APEX-600 test program, while WCAP-14272, Revision 2,
described the Westinghouse scaling assessment of the OSU/APEX-600 facility.
NRC reviewed the submitted reports and, even if several requests for additional
information were raised (mainly related to potential scaling distortions and to some
oscillations occurring during the tests), the Westinghouse response was judged acceptable
and the issues considered resolved.
In addition the NRC performed a confirmatory test program which provided additional
data from the OSU/APEX-600 test facility and contributed to the commission
understanding of the plant integral system behavior in design-basis events.
For the AP1000 design certification, NRC also evaluated the applicability of the APEX-
600 test program to the AP1000 design. The commission determined that the APEX-600
facility is generally appropriately scaled for the AP1000 design, and is acceptable for the
AP1000 code validation for the periods of the IRWST injection/drain phase and the
IRWST/sump injection phase of a transient. However, NRC also found that the APEX-600
test data were inadequate for use in the AP1000 code validation in the areas of liquid
entrainment in the upper plenum , hot-legs and ADS4 piping (and core liquid level swell),
and that additional test data were needed for the AP1000. As a result, Westinghouse added
the APEX-1000 integral test program.
Page 35
34
Figure 12: APEX test facility – PRZ and SG dome view
Figure 13: APEX test facility – Hot leg, cold legs and RPV
Page 36
35
2.4. OSU APEX-1000 Test Program
The OSU APEX-600 integral system test facility was designed and used to assess the
passive safety systems for the AP600 design. As described above, NRC found that the
APEX-600 test data were inadequate for use in the AP1000 code validation in the areas of
liquid entrainment in the upper plenum, hot-legs, and ADS-4 piping (and core level swell),
and that additional test data were needed for the AP1000. To address performance specific
to the AP1000 design, the APEX-600 facility underwent significant modifications in 2002
to more accurately represent the AP1000 design and was renamed the APEX-1000 Test
Facility. Like APEX-600, the APEX-1000 is a low-pressure, 1/4-height representation of
the AP1000 design. Westinghouse submitted two topical reports describing the APEX-
1000 facility and the basis for its scaling. The details of the APEX-1000 test facility,
including the modifications from the original OSU APEX facility, are described in the
report OSU-APEX-03002, “OSU APEX-1000 Test Facility Description Report”. Topical
report OSU-APEX-03001, “Scaling Assessment for the Design of the OSU APEX-1000
Test Facility”, describes the scaling analysis performed to guide the OSU APEX-1000 test
facility modifications. The facility modifications include an increase in the maximum core
power, a larger pressurizer and reduced surge line diameter, and larger CMTs. The ADS
Stage 4 was replaced with appropriate sized valves and piping, and the line resistances
between the CMT and vessel, and through the PRHR were likewise reduced consistent
with the AP1000 design. Table 1 summarizes changes made to the APEX facility for
AP1000.
Table 1: AP600 to APEX1000 modifications
COMPONENT Modifications to APEX-600
Reactor Power
Increase core power by 67 percent (to nearly 1
MW).
Pressurizer
Increase pressurizer volume.
Reduce pressurizer surge line diameter.
SG Heat Transfer Area No change required for testing.
RCP Flow No change required for testing.
Page 37
36
CMTs
Increase CMT volumes by 25 percent.
Reduce line resistance by 64 percent.
Accumulators No change required for testing.
ADS Stages 1-3 No change required for testing.
ADS Stage 4
Increase ADS-4 flow area by 76 percent.
Reduce line resistance to 28 percent of original.
PRHR
Increase PRHR flow capacity by 74 percent.
No change in heat transfer area.
Containment Increase sump curb height.
Not all components in APEX were modified even though corresponding changes were
made to the plant design from AP600 to AP1000. For example, the AP1000 steam
generators, with 11477 m2 (123,538 ft
2) of heat transfer area, are substantially larger than
the AP600 steam generators, with 6984.5 m2 (75,180 ft
2). No changes were made to the
APEX steam generators, since the tube volume is small compared to the volume of the rest
of the primary system and the generators are oversized for the decay power involved in
testing. That is, the existing APEX steam generators have more heat transfer area than is
necessary to remove decay heat. An increase in the pump capacity was not necessary
because the pumps are tripped at the start of each transient, and their main contribution
thereafter is their resistance, which was preserved. Therefore, it was neither important nor
necessary to modify these components for AP1000 testing in either case. The upper core
plate and upper plenum of APEX were redesigned in order to improve the modeling of
upper plenum entrainment and core plate flooding, and to account for differences between
the AP600 and AP1000 designs. In the AP1000, in order to accommodate the higher core
power, twelve additional fuel assemblies were added to the AP600 core design. These
assemblies were positioned at the outer edge of the core, with some of the new assemblies
placed just below the two hot-leg nozzles. In the APEX-1000, additional holes were placed
in the upper core plate to capture the localized jetting of steam flow at these locations. The
upper core plate design utilized a hole pattern so that drainage from the upper plenum to
the core was preserved. Since there were numerous changes made to APEX-600 in
development of the APEX-AP1000 facility, scaling analyses were conducted by both
Page 38
37
Westinghouse and the NRC to ensure that the appropriate modifications were made, and
that the APEX-1000 facility was a reasonable representation of the full scale prototype.
Special emphasis was placed on scaling upper plenum entrainment, since this had been
identified as a non conservative distortion in the APEXAP600 facility for application to
AP1000 design. Testing in the APEX-1000 facility began in 2003, with several integral
experiments sponsored by the U.S. Department of Energy to investigate performance of
AP1000 passive safety systems at DBA conditions. The NRC also conducted confirmatory
tests on T-H processes for which data from the APEX-600 series of tests were not
adequate. The APEX-1000 integral test series performed for simulation of the DBAs
includes simulations of (1) two tests of a double-ended guillotine break of the DVI line
(DEDVI) with a single failure of one ADS-4 valve on the non-pressurizer side before and
after modifications to the ADS-4 piping and valves, respectively, (2) a DEDVI break with
failure of one ADS-4 valve on the pressurizer side, and (3) two tests of a 2-inch cold-leg
break with a single failure of one ADS-4 valve at 2.65 MPaa (370 psig) and 0.96 MPaa (125
psig), respectively. The test results are documented in test summary reports OSU-AP1000-
01, OSU-AP1000-02, OSU-AP1000-03, OSU-AP1000-04, and OSU-AP1000-05,
respectively.
NRC evaluated positively the experimental campaign performed at the APEX1000 facility,
considering resolved the issues on the applicability of the APEX600 test program to the
AP1000.
2.5. SPES-2 High-Pressure, Full-Height Integral-Systems Test
Program
The SPES-2 test program was the second integral-system test program performed for
design certification of the AP600. The objective of this test program was similar to that of
the OSU APEX-600 program (i.e. acquisition of integral-system data for the validation of
computer codes used to perform AP600 safety analyses). Unlike the APEX-600 facility,
however, SPES-2 could operate at pressures and temperatures up to prototypic
AP600/AP1000 values and was approximately full vertical scale. Because of this unique
capability, tests in SPES-2 focused primarily on integral system behavior in the period
from accident initiation (at prototypic pressure and temperature and scaled full power) to
Page 39
38
the establishment of stable injection from the IRWST. The test matrix included a range of
SBLOCAs from scaled 25 mm (1 in.) cold-leg breaks to double-ended guillotine breaks of
a DVI line and a CMT balance line. In addition, non-LOCA transients were simulated in
SPES-2, including single steam generator tube ruptures (SGTRs) and a main steamline
break. Other parameters tested included interactions with non-safety-related systems (one
1” cold-leg SBLOCA and one SGTR test) and inadvertent actuation of the ADS during an
SGTR event. Tests were performed at the facility located at the Societa’ Informazioni
Esperienze Termoidrauliche (SIET) laboratories in Piacenza, Italy, in 1994 (see Figure 14).
SPES-2 was a full-height representation of the AP600 design. The volume scale was
approximately 1/395. However, SPES was not designed from the beginning as an AP600
test facility. Rather, SPES-2 was a modification of the existing SPES-1 facility, which
represented a 1/427-volume-scale of a Westinghouse three-loop PWR. As a result, some
distortions and atypicalities existed in SPES-2 compared to the AP600/AP1000 design.
The most significant of these were as follows:
SPES-2 had only one pump per loop, rather than the two pumps per loop of the
AP600 and AP1000, so that outlet flow from the pump had to be split between the
two cold-legs;
SPES-2 had an external piped downcomer, rather than an annular downcomer. The
design was modified, however, so that there was an annular section at the top of the
simulated reactor vessel, which then fed into the piped downcomer below the
elevation of the DVI lines;
SPES-2 had a much larger surface-area-to-volume ratio than the AP600. This
caused distortions in two ways. In the initial stages of a transient, high heat losses
occurred. This was compensated by increasing the rod bundle power during the
period from accident initiation to the beginning of ADS blowdown. In the later
stages of a transient, the effect was reversed, and excessive heat input to the system
occurred from the structure. To relieve the excess steam resulting from this effect,
the vent area of the simulated ADS-4 valves in SPES-2 was significantly larger
than its nominal scaled (1/395) value, to achieve a depressurization rate calculated
to be approximately the same as in the AP600 design.
All AP600/AP1000 safety systems were represented, including CMTs, accumulators,
IRWST injection, four-stage ADS, and the PRHR system, in which the PRHR-HX was
Page 40
39
simulated by three C-tubes in the IRWST tank. Sump recirculation was not simulated in
the SPES-2 loop. The facility contained over 300 measurement instruments, including
thermocouples, flowmeters, pressure transducers, and void instrumentation. Data were
collected using a computer-controlled PC-DAS.
The SPES-2 test program was documented in several reports, including WCAP-13277
(“Scaling, Design, and Verification of SPES-2, the Italian Experimental Facility Simulator
of the AP600 Plant”); WCAP-13277, Revision 1 (“Scaling, Design, and Verification of
SPES-2, the Italian Experimental Facility Simulator of the AP600 Plant; Scaling Update”);
WCAP-14053 (“AP600 FHFP Integral Systems Test Specification”); and WCAP-14073
(“SPES-2 Facility Description”). Cold preoperational testing in the SPES-2 facility began
in May 1993; matrix testing began in February 1994 and was completed in November
1994. The final data report and the test analysis report for the SPES-2 program are
contained in WCAP-14309, Revision 1, “AP600 Design Certification Program SPES-2
Tests Final Data Report”, and WCAP-14254, “AP600 SPES-2 Test Analysis Report”,
respectively.
NRC evaluated the Westinghouse SPES-2 test program during the AP600 design
certification review. Early review of the SPES-2 program focused on test facility
modifications (since SPES was an existing facility), instrumentation, scaling, and the test
matrix. SPES-2 included several distortions that arose either as a result of its 1/395 scaling
ratio to the AP600 plant (e.g., heat loss, metal heat addition) or the necessity of modifying
an already-existing facility (e.g., external downcomer, one pump per loop). The impact of
these distortions was reviewed. The major design distortions were found to be acceptable.
In the case of the downcomer, the addition of an annular section to accommodate the cold-
legs and DVI lines was found to adequately characterize flow behavior within the context
of the one-dimensional system representation provided by the SPES-2 facility. The single
pump per loop, rather than the two pumps in the actual plant, was considered to be a
relatively minor distortion, since the safety system response in the types of events
simulated in SPES-2 included tripping the reactor coolant pumps early in the accident,
coincident with CMT actuation. The resistance to natural circulation flow through the
actual plant piping and two pumps was represented in SPES-2, and the elevation of the
cold-legs with reference to the steam generators was maintained.
Page 41
40
Because the SPES-2 facility was full-height and operated at full pressure and scaled full
power conditions, the scaling analysis was a relatively simple comparison of the
configuration (piping and key elevations), component flow areas, and pressure losses in
SPES-2 to the plant design. Except for those distortions identified above, the facility
compared well to the plant. Innovative designs were employed to minimize distortions
where possible. For example, the SPES-2 CMTs were full-pressure and full-height, but
were about 1/20 the diameter of the AP600 components. This can cause a distortion in the
structural heat content, which could affect CMT draining behavior. To minimize the
distortion, the SPES-2 CMTs were designed with thin walls. Since these tanks could not
withstand differential pressures up to full RCS pressure, they were placed inside larger
vessels that were pressurized with air to maintain acceptable stresses in the tank walls. As
the loop (and CMTs) depressurized during a test, air was exhausted from the vessels to
maintain acceptable structural conditions. NRC found the scaling approach and modified
facility design acceptable.
The commission reviewed the test matrix and determined that it covered an adequate range
of SBLOCA sizes and locations; the simulation of the SGTR and main steamline break
events was also found to be adequate. NRC also determined that the test program would
address many “important” items related to integral system behavior as identified in the
AP600 PIRT, especially at elevated system pressures and temperatures outside the range of
conditions covered in the OSU/APEX-600 tests. All of the tests represented DBA
scenarios (including a single active failure), with the exception of one SGTR test, and one
SBLOCA test that included the use of (simulated) non-safety systems.
The testing procedure for all SBLOCA tests was to consider the test as concluded when
stable IRWST injection was established (i.e., there was no attempt to represent long-term
cooling, as was the case in the OSU/APEX-600 tests). The only exception was the test with
non-safety systems simulated: use of the (simulated) RNS system as a low-pressure
injection system prevented the CMTs from draining to the ADS-4 level setpoint. For the
non-LOCA tests (SGTRs and main steamline break), the criterion for test termination was
for the system to be stabilized at elevated pressures, since, within the design basis, these
events were not predicted to result in ADS actuation.
The tests simulating design-basis SBLOCAs ended with the facility fully depressurized
and with the core covered and cooled using IRWST injection. The SBLOCA test that
Page 42
41
included use of non-safety systems ended with water injection using the RNS pumps
allowing the system to stabilize at a slightly elevated pressure. For the non-LOCA
transients, the system stabilized at elevated pressures with no ADS actuation: CMT
injection in the recirculation mode was successful in adding coolant inventory without
reducing CMT levels to the ADS-1 setpoint.
No core heatup was observed during any of the tests. Oscillations were observed during
several of the tests, and were especially persistent during the SGTR tests. However, the
reactor vessel liquid levels were well above the top of the simulated core. Responding to
the NRC requests, Westinghouse provided plausible explanations for the observed
phenomena, relating them to density-wave oscillations that ceased when the steam
generators drained. Since in a LOCA this would occur well before any possibility of
uncovering the core, the behavior did not raise safety concerns. In the SGTR test, the steam
generators did not drain for an extended period, causing the oscillations to persist.
However, this did not affect the ability of the CMTs to recirculate and stabilize the system
pressure and temperature without ADS actuation.
Westinghouse response adequately resolved the NRC concerns. The primary issues to be
addressed by the SPES-2 tests were related to integral systems behavior, especially at
elevated pressures beyond those covered in the OSU/APEX-600 experiments. Examples of
these issues were as follows:
system response and systems interactions in the early stages of DBAs, including
transition from CMT recirculation to CMT draining, accumulator injection, and
effects of early stages of depressurization;
for non-LOCA transients, ability of the system to come to a stable condition at
elevated pressures.
WCAP-14727, Revision 2, “AP600 Scaling and PIRT Closure Report”, addressed issues
related to distortions from identified sources (e.g., excess power to compensate for heat
losses) and “validation” of those aspects of the AP600 PIRT relevant to the SPES-2 tests.
The major technical issue not related to distortions was the oscillatory behavior, which was
acceptably resolved as discussed above.
NRC concluded that the SPES-2 test program accomplished its objectives and that
Westinghouse developed a database that addressed the raised issues. Also, as with the
APEX-600 test program, insights gained from NRC-sponsored AP600 confirmatory testing
Page 43
42
in both the ROSA facility and the OSU/APEX-600 facility were considered in the SPES-2
evaluation. Therefore, on the basis of its review of the test program reports and the
Westinghouse responses to the commission’s requests for additional information (RAIs),
the NRC determined that the SPES-2 testing program was acceptable.
For the AP1000 certification, NRC evaluated the applicability of the SPES-2 test program
to the AP1000 design, concluding that the program is applicable also to the AP1000 design
for small-break LOCAs in the initial stages of the accident, up to the high pressure phase
of ADS-4 blowdown.
Figure 14: SPES2 test facility – RPV and main loops
The above mentioned test programs, as specified, allowed Westinghouse to investigate the
main phenomena occurring in the passive features of the AP600/AP1000 and also to
qualify the codes used for safety analyses. For further details on the AP600 and AP1000
test program, please refer to the AP600 and AP1000 Final Safety Evaluation Reports
(NUREG-1512 and NUREG-1793).
Page 44
43
Nevertheless, as outlined above (section 1.2.4), the AP1000 licensing process requires the
new features to be tested on the first three built nuclear power plants. In this work, pre-
operational tests procedures have been developed and pre-tests calculations have been
performed by means the of the Relap5 computer code for three selected tests: CMTs hot
recirculation test, CMTs draindown test and ADS test.
Next section details the developed AP1000 Relap5 model.
Page 45
44
3. AP1000 Relap5 Input Model Description
In order to perform the pre-tests and Design Basis Accidents simulations, a fully detailed
AP1000 Relap5 model has been developed. The model scheme is reported in Figure 15,
while a summary description of the input can be found in Table 22.
It should be noted that an AP1000 input was already available in Ansaldo Nucleare S.p.A.
since 2001 but, for this work, the input has been completely revised and completed
according to the most recent available documentation.
The design parameters needed for model development have been taken from the AP1000
Design Control Document (Westinghouse Electric Company, 2010) and from other
classified documents (Westinghouse Electric Company and Ansaldo Nucleare
Documents).
For model development, the Relap5 modeling guidelines reported in the code manual
(Information Systems Laboratories, Inc. 2002) have been strictly followed. Furthermore an
extensive code validation process was carried out in Ansaldo Nucleare S.p.A. (Alemberti
et al., 1994 and 1995, Bacchiani et al., 1995): the developed model is consistent (noding
size, transition from one noding size to another, physical models activation, etc.) with the
performed in-house validation process.
The following sub-sections provide a description of the systems which have been modeled
and the status of the AP1000 modeling as developed during this work. Further
modifications needed to represent the actual configuration of the plant for pre-operational
tests are described in section 4.1
3.1. Reactor Pressure Vessel
All internal components of the Reactor Pressure Vessel (RPV) are considered in the
nodalization and all major bypass paths inside the vessel are simulated, resulting in a close
representation of the global bypass flow.
2 In the following of the document, for what the “components” accumulators, CMTs, DVI lines, etc. is
concerned, “component 1” and “component A” refers to the same “component”, as well as “component 2”
and “component B”. As an example: DVI-1 or DVI-A refers to the same DVI line, the one which connects to
pipe 101.
Page 46
45
Figure 16 shows the considered vessel sub-regions, while Figure 17 shows the noding
scheme. The following regions are modeled: lower plenum, downcomer, core and core
bypass, upper plenum, upper and lower guide tubes, upper head. They have all been
simulated by means of pipe or branch components. In particular, for what the core is
concerned, it has to be noted that the core is simulated by means of two different
components: one representing the hot channel and the other representing the remaining
portion of the core. Furthermore the bypass flow between the core and the barrel and the
flow through the control rods housing within the fuel assemblies are taken into account.
Heat structures are used to simulate the core and the main RPV internals and RPV walls:
vessel upper head, vessel wall cylindrical portion, lower head, lower head structures, lower
support plate, core barrel, upper core plate, upper plenum structures (support columns),
lower guide tubes, upper guide tubes, upper support plate, upper head structures.
For what the core is concerned, it has to be noted that the fuel bundle is subdivided into 4
heat structures, representing respectively the middle channel structure simulating the
power generated by 74 fuel elements, the peripheral channel structure consisting of 82 fuel
elements, the hot channel structure consisting of 263 fuel rods and the hot rod. Furthermore
the power axial profile is simulated together with the main reactivity feedbacks (simulated
by means of a combination of Relap5 control variables and general tables): boron
reactivity feedback, Doppler reactivity feedback and moderator density reactivity
feedback.
Page 47
46
Figure 15: AP1000 Relap5 input model scheme
1
1
6
1
1
8
120
130
131
140
1
0
1
1
0
2
92
89
125
1
3
5
1
5
5
150
110
160
91
1
1
4
1
1
5
670
650
610
630
610
1
2
3
4
5
6
3
2
1
40
39
38
1
2
3
1
2
3
37
36
35
34
33
32
4
5
6
4
5
6
7
8
9
7
8
9
31
30
29
10
11
12
10
11
12
28
27
26
25
24
2322
21 2019
11
12
13
14
15
16
17
18
8
9
10
5
6
7
2
3
4
1
9
8
7
6
5
4
3
9
8
7
6
5
4
3
12
11
10
14
13
12
11
10
14
13
13 1314 141 1
2 2
15
16
17
18
570
550
510
530
510
1
2
3
4
5
6
3
2
1
1
2
3
1
2
3
1
2
3
4
5
6
7
8
9
4
5
6
4
5
6
7
8
9
7
8
9
10
11
12
10
11
12
10
11
12
13
14
15
16
17
1819
20 2122
30
29
28
27
26
25
24
23
33
32
31
36
35
34
39
38
37
40
9
8
7
6
5
4
3
9
8
7
6
5
4
3
12
11
10
14
13
12
11
10
14
13
13 1314 141 1
2 2
15
16
17
18
620620
325
520
520
225
240
270
207205
242
272
245
275
250
280
340
370
307
342
372
345
375
305
350
380
603604
605606
Level control
608609
618619
STS
601602
FW
503504
505 506
Level control
508509
518519
STS
501502
FW
72
697PORV
71695 SRV3
70
693SRV2
69
691SRV1
64
597PORV
63595SRV3
62
593SRV2
61
591SRV1
785
787
798
789
799
7
8
6
Steam Header
681 684
683
MSIV
675
581584
583
MSIV
575
1
2
3
4
5
6
7
8
9
10
803
1
2
3
4
5
6
7
8
9
10
802
804
1
2
3
4
5
6
800
12
3
4
5
6
7
8
9
440
441
PRZ
443
442
1
7
234
5
6
347
245
3433
Pressure control Safety valves
940941
Level control
421 422
4
1
1
4
1
2
Spray lines
23
4
5
6
7
826
1
8 827 8281 12
830
829
831
832
824
1
825
PRHR
IRWST
823
1
20
880
CMT2
12879
878
1
2
3
4
5
6
876
877
875
1
20
860
CMT1
12859
858
1
2
3
4
5
6
856
857
855
881
1
7 1
11
1
11
2
VESSEL
ACC2
885
SG2SG1
ACC1
865
1 12 2
882 883 884
887
2 21 1
862 863 864
867
1
2
7
861
DVI1
DVI2
1
2
486
6476
479 7
ADS-4 26
2
3
4
5
4
7
2
477
478
4
5
ADS-4
481/485
1
11
480/484
348/349
358/359
368/369
ADS 1, 2, 3
8
1
4
8
1
3
88
812 811
816 815
942 943
944 945
Makeup (1 pump)
Makeup (2 pumps)
981
980
Level control
898
8
8
9
7
896790
788
Steam Dump
Turbine
866
886
611612
511512
846
847 850
851
848
849
845841
843
844
Cask
loading pit
840
RNS
1
10
852
853
IRWST
946
947
9
4
8
949
Auxiliary Spray
CVS
951950
Letdown
65
598PORV (Cooldown)
73
698PORV (Cooldown)
953 952
Auxiliary Spray
414
413415
4
7
4
492
488
445/545
446/450
444/544
451/551
447/547
448/449
458/459
468/469
18
1
1
6
6
Page 48
47
Table 2: AP1000 Relap5 input model summary
General zone Name Number Type
Pressure vessel
Downcomer
91, 92 annulus
88, 89 branch
101, 102 annulus
Lower plenum 110 branch
Core region 114, 115 pipe
Core bypass 116, 118 branch
Upper plenum 120, 130, 131 branch
Upper head 140, 150, 160 branch
Guide tubes 125, 135, 155 branch
Loop 1
Hot leg 205, 207 branch
SG U-tubes and plena 225 pipe
Pump 240, 270 pump
Cold leg
245, 242
275, 272
branch
branch
250, 280 snglvol
Loop 2
Hot leg 305, 307 branch
SG U-tubes and plena 325 pipe
Pump 340, 370 pump
Cold leg 345, 342
375, 372
branch
Page 49
48
Table 2: AP1000 Relap5 input model summary
General zone Name Number Type
350, 380 snglvol
DVI Lines
DVI 1
864 pipe
867 sngljun
DVI 2
884 pipe
887 sngljun
Pressurizer
Surge line 443 pipe
PRZ nozzle 442 sngljun
PRZ vessel
441 pipe
440 branch
PRZ valve 33 trpvlv
PRZ pres cntrl 34 tmdpvol
PRZ lev cntrl 941 tmdpjun
PRZ lev cntrl 940 tmdpvol
PRZ safety valves 45, 47 mtrvlv
PRZ safety valves
discharge 2, 3 tmdpvol
Spray line connections 411/412, 413/414, 415 branch
Spray line valves 421/422 srvvlv
Auxiliary Spray line 948 branch
Auxiliary Spray valves 949 mtrvlv
Page 50
49
Table 2: AP1000 Relap5 input model summary
General zone Name Number Type
Secondary side
(loop 1)
Feedwater junction 501, 511 tmdpjun
Feedwater junction 502, 512 tmdpvol
FWS junction (1 pump) 508 tmdpjun
FWS FW tank 509 tmdpvol
FWS junction (2 pump) 518 tmdpjun
FWS FW tank 519 tmdpvol
SG level cntrl 503, 505 tmdpjun
SG level cntrl 504, 506 tmdpvol
Downcomer
510 branch
520 pipe
521 sngljun
Riser 530 pipe
Separator 550 separatr
Dome
570 pipe
575 sngljun
Steam line 581, 584 pipe
MSIV 583 mtrlvlv
Safety valves (SRV) 591, 593, 595 mtrlvlv
PORV 597, 598 mtrvlv
Page 51
50
Table 2: AP1000 Relap5 input model summary
General zone Name Number Type
Secondary side
(loop 2)
Feedwater junction 601, 611 tmdpjun
Feedwater junction 602, 612 tmdpvol
FWS junction (1 pump) 608 tmdpjun
FWS FW tank 609 tmdpvol
FWS junction (2 pump) 618 tmdpjun
FWS FW tank 619 tmdpvol
SG level cntrl 603, 605 tmdpjun
SG level cntrl 604, 606 tmdpvol
Downcomer
610 branch
620 pipe
621 sngljun
Riser 630 pipe
Separator 650 separatr
Dome
670 pipe
675 sngljun
Steam line 681, 684 pipe
MSIV 683 mtrlvlv
Safety valves (SRV) 691, 693, 695 mtrlvlv
PORV 697, 698 mtrvlv
Page 52
51
Table 2: AP1000 Relap5 input model summary
General zone Name Number Type
CMT 1
CMT junction 856 sngljun
CMT balance line
857 pipe
858 pipe
CMT valve 855 trpvlv
CMT tank 860 pipe
CMT exit valve 861 mtrvlv
CMT surge line 862 pipe
CMT isolation valve 863 chkvlv
DVI1 connection 866 branch
CMT 2
CMT junction 876 sngljun
CMT balance line
877 pipe
878 pipe
CMT valve 875 trpvlv
CMT tank 880 pipe
CMT exit valve 881 mtrvlv
CMT surge line 882 pipe
CMT isolation valve 863 chkvlv
DVI2 connection 886 branch
ACCUMULATOR 1 ACC tank 865 accum
Page 53
52
Table 2: AP1000 Relap5 input model summary
General zone Name Number Type
ACCUMULATOR 2 ACC tank 885 accum
ADS 1/2 (I, II, III
stages)
ADS from PRZ to
isolation valves 445/545, 446/450 branch
ADS isolation valves 348/349, 358/359,
368/369
mtrvlv
ADS from isolation
valves to control valves
444/544, 447/547,
451/551
pipe
ADS control valves 448/449, 458/459,
468/469
mtrvlv
ADS outlet line 480/484 pipe
ADS spargers 481/485 branch
ADS 1 (IV stage)
From PRHR inlet line to
ADS squib valves 472/474 branch
ADS squib valves 477/478 mtrvlv
ADS 2 (IV stage)
From HL 2 to ADS
squib valves 486, 488/492 pipe, branch
ADS squib valves 476/479 mtrvlv
IRWST
PRHR bay
800 pipe
801 mtpljun
Central bay 802 pipe
Sparger bay
803 pipe
804 mtpljun
Overflow 896 sngljun
Page 54
53
Table 2: AP1000 Relap5 input model summary
General zone Name Number Type
897 tmdpvol
898 sngljun
IRWST discharge line
811, 812 sngljun
813, 814 pipe
IRWST valve 815, 816 trpvlv
PRHR
PRHR inlet line
823 sngljun
824 pipe
825 sngljun
PRHR exch. tubes 826 pipe
PRHR outlet line
827 sngljun
828 pipe
829 trpvlv
830 branch
Steam Header
Header connection 785 branch
Upstream turbine line 786 pipe
Turbine valve 787 mtrvlv
Turbine valve 798 mtrvlv
SL end volume 789, 799 tmdpvol
Steam Dump 788 tmdpjun
Page 55
54
Table 2: AP1000 Relap5 input model summary
General zone Name Number Type
Steam Dump end
volume 790 tmdpvol
CVS
CVS (1 pump) 942 tmdpjun
CVS tank 943 tmdpvol
CVS (2 pump) 944 tmdpjun
CVS tank 945 tmdpvol
CVS line 946 snglvol
CVS connection to SG1 947 chkvlv
CVS Letdown
connection 950 tmdpjun
CVS Letdown tank 951 tmdpvol
PRZ auxiliary spray 953 tmdpjun
PRZ auxiliary spray 952 tmdpvol
PRZ auxiliary spray line 948 branch
PRZ auxiliary spray
valve 949 mtrvlv
RNS
IRWST line valve 840 trpvlv
RNS line 841,847 branch
Cask Loading Pit valve 843 trpvlv
Cask Loading Pit tank 844 tmdpvol
RNS line 845 snglvol
Page 56
55
Table 2: AP1000 Relap5 input model summary
General zone Name Number Type
RNS pump 846 pump
DVI1 discharge line 848 snglvol
DVI1 connection 849 chkvlv
DVI2 discharge line 850 snglvol
DVI2 connection 851 chkvlv
IRWST discharge line 852 pipe
IRWST connection 853 trpvlv
Containment
Recirculation
System
Containment sump 162 pipe
First MOV 163/183 trpvlv
From first MOV to
second MOV 164/184 pipe
Second MOV 165/185 trpvlv
From second MOV to
common header 166/186 pipe
Common header 174/194 Pipe
Check valve 169/189 chkvlv
From check valve to
MOV 170/190 pipe
MOV 171/191 trpvlv
From MOV to common
header 172/192 pipe
Page 57
56
Table 2: AP1000 Relap5 input model summary
General zone Name Number Type
From common header to
IRWST injection line 175/195 Sngljun
Figure 16: AP1000 RPV sub-regions
Page 58
57
Figure 17: AP1000 RPV noding scheme
3.2. Reactor Coolant System Main Loops (SGs primary side
included)
The two loops, each one containing one hot leg, one steam generator, two reactor coolant
pumps and two cold legs are separately modeled. For each loop, the hot legs have been
modeled by means of two branches, one for the horizontal part of the pipe and one for the
sloping part, leading to the SG. The two cold legs can be subdivided in three regions: pump
discharge, middle portion and portion up to downcomer connection. Figure 18 shows the
11
10
9
8
7
6 114
5
4
3
2
1
115
1
2
3
4
5
6
7
1
2
3
4
5
6
7
116 118
120
130
131
140
101 102
88
1
2
91 1
2
92
89
125
135
155
150
110
160
CL2A
CL2B
CL1A
CL1B
HL2HL1
Page 59
58
noding scheme of the main reactor coolant loops. For what the primary side of the steam
generators is concerned, the inlet plenum, the U-tubes and the outlet plenum (to which the
reactor coolant pumps are connected) are modeled as represented in Figure 19.
Heat structures are introduced to simulate the hot legs and cold legs metallic structure. For
each leg, one heat structure has been modeled: it is connected to the hydrodynamic volume
on its left surface, while an insulation condition is set on the right surface, as the heat
transfer from the fluid to the environment can be considered negligible. For what the
primary side of the SGs is concerned, the U-tubes walls are simulated, together with the
lower head walls and tube sheet.
Figure 18: AP1000 main coolant loops noding scheme (x=2 for loop 1 and x=3 for loop 2)
Inlet S.G. Outlet S.G.
X40 X70
X42 X45 X50
X72 X75 X80
X07
X05 RV Outlet
RV Inlet
RV Inlet
X40 X1
Page 60
59
Figure 19: AP1000 SG primary side noding scheme (loop 1)
3.3. Reactor Coolant Pumps
The RCPs have been modeled using the special hydrodynamic component “pump”, where
both geometric and hydraulic data have been specified. The reactor coolant pumps are
connected to the SGs outlet plena and discharge in the two cold legs. The homologous
curves of pump head and pump torque have been introduced in order to describe the pump
performance in all the operating conditions, i. e. the four quadrants: normal pump, energy
dissipation, normal turbine, reverse pump performance.
3.4. Pressurizer
The pressurizer model consists of the following regions or subsystems:
The surge line, simulated by a pipe component and connected to the hot leg of loop
1;
Page 61
60
The pressurizer (bottom head, cylindrical part and upper head) connected to the
surge line;
RCS overpressure protection system: the PRZ safety valves are simulated with two
motor valves which connect the PRZ head to two tmdpvol components simulating
the containment at atmospheric pressure;
Spray system: it connects the cold legs A and B of loop 1, just downstream of the
pumps discharge, to the PRZ head;
Proportional and backup heaters, simulated by the heat structures associated to the
PRZ.
Figure 20: AP1000 Pressurizer noding scheme
3.5. Automatic Depressurization System
The Automatic Depressurization System (ADS) consists of four different valve stages that
open sequentially to reduce RCS pressure.
Page 62
61
The ADS valves for stages 1, 2 and 3 are located in lines connected to the pressurizer,
whereas the ADS final stage valves are located in lines connected to the hot legs. The
piping and valves for the first three ADS stages are arranged in two identical trains, each
containing one stage 1 path, one stage 2 path and one stage 3 path, a common inlet line
connected to the PRZ top and a common discharge line connected to the sparger in the
IRWST. The ADS final stage consists of two valves trains, one connected to the PRHR
inlet line and the other connected to the loop 2 hot leg. Each train consists of two lines,
containing a normally closed ADS squib valve discharging directly to the containment
atmosphere. Figure 21 and Figure 22 show the model scheme for the first three stages and
for the fourth stage respectively.
Figure 21: ADS stages 1, 2 and 3 noding scheme (train A)
445
BRANCH
PRZ dome (ID 440)
V 002AV 012A
V 001AV 011A
V 013A V 003A
446
BRANCH
444
PIPE
447
PIPE
451
PIPE
480
PIPE
481
BRANCH
IRWST (ID 803-05)
Page 63
62
Figure 22: ADS stages 4 noding scheme
3.6. Steam generators (secondary side)
The nodalization scheme of Steam Generators is reported in Figure 23.
The following zones can be recognized (component numbers refer to loop 1):
SG primary side, including inlet plenum, U tubes and outlet plenum, simulated by a
pipe (225);
the feed water ring (510);
the downcomer, simulated by an annulus (520);
the riser, modeled by means of a pipe (530), subdivided in 18 nodes: the first 14
volumes are thermally connected to the primary side U-tubes, while the other nodes
simulate the channels feeding the separators swirl;
the separators, modeled through the component “separator” (550);
the top of SG (570);
Heat structures are used to simulate the U-tube walls, steam generator inlet and outlet
plena, tube sheet, shroud and shell.
Furthermore the following sub-systems are modeled, as shown in Figure 24:
Page 64
63
Steam line: each steam line departing from each SG dome and leading to the
steam header is separately modeled together with the steam header itself.
Downstream the steam header the four steam lines have been collapsed in one
component having the same hydraulic characteristics;
Turbine: the turbine is simulated by two tmdpvol components: one is used for
steady state achievement and the other during transients simulations. The
turbine representation is very schematic but it is judged suitable for the analyses
to be performed with the developed AP1000 Relap5 input model. In particular
what is important is to be able to simulate the turbine isolation signal, for which
a schematic representation of the turbine is sufficient;
Containment Isolation: the main steam line isolation valve is simulated with a
motor valve (583) joining components 581 and 584 (components numbers refer
to SG-1);
Secondary Side Overpressure Protection: each Steam Generator is equipped
with six safety relief valves, plus one PORV. The six safety valves have been
collapsed into three components, modeled through the motor valves 591, 593
and 595 connecting the outlet of the steam dome (570) to time dependent
volumes simulating the external environment at atmospheric conditions. The
PORV is modeled by means of another motor valve (597) (components
numbers refer to SG-1).
The feed water injection is simulated schematically by means of time dependent
junctions (Figure 15).
Page 65
64
Figure 23: Steam generator noding scheme (loop 1)
570
550
510
530
510
1
2
3
4
5
6
3
2
1
1
2
3
1
2
3
1
2
3
4
5
6
7
8
9
4
5
6
4
5
6
7
8
9
7
8
9
10
11
12
10
11
12
10
11
12
13
14
15
16
17
1819
20 2122
30
29
28
27
26
25
24
23
33
32
31
36
35
34
39
38
37
40
9
8
7
6
5
4
3
9
8
7
6
5
4
3
12
11
10
14
13
12
11
10
14
13
13 1314 141 1
2 2
15
16
17
18
520
520
225
Page 66
65
Figure 24: Steam generator system noding scheme (loop 1)
3.7. Passive Residual Heat Removal Heat Exchanger
The PRHR-HX (Figure 25) consists of inlet and outlet channel heads connected by vertical
C-shaped tubes. The PRHR-HX inlet and outlet lines are connected to RCS loop 1,
respectively to the hot leg and to the SG cold leg plenum. The model of the PRHR-HX can
be subdivided into four main regions: inlet line, inlet and outlet PRHR-HX channel heads,
PRHR-HX tubes, outlet line: they have all been modeled.
The PRHR-HX inlet line connects to the top of the loop 1 hot leg: it has been modeled with
a pipe component (824). PRHR-HX tubes are simulated by means of pipe 826
characterized by 8 nodes and by the associated heat structures. The PRHR-HX channel
heads consist of two volumes located at the HX inlet and HX outlet, respectively. The
channel heads are identical and their shape consists of a hemispheric portion coupled to a
cylindrical portion. These volumes are simulated by means of branches 825 and 827. The
PRHR outlet line is simulated by means of pipe 828 (representing the line connecting the
HX exit to the Air Operated Valve (AOV)), valve 829 (representing the AOV), branch 830
(representing the AOV discharge volume) and pipe 831 (representing the line connecting
to the SG, see Figure 25 and also Figure 15).
Only the PRHR-HX tubes walls have been simulated by means of heat structures which
couple the PRHR-HX tubes to the IRWST, where strong water recirculation occurs upon
Page 67
66
PRHR-HX operation: such water recirculation is simulated in the model (see IRWST
model description).
Figure 25: PRHR HX noding scheme
3.8. In-containment Refueling Water Storage Tank
IRWST provides low pressure gravity injection to each of the two direct vessel injection
connections. These injection lines are shared with the accumulators and CMTs. It also
provides heat sink for the PRHR heat exchanger and receives discharge from the first three
ADS stages.
The tank has been modeled by three pipe components, vertically oriented. The first pipe is
the PRHR Bay 800, the second the Central Bay 802, the third is the Sparger Bay 803. The
PRHR Bay is the portion of the pool that contains the vertical portion of the PRHR. It is
connected at the bottom and the top to the central bay by two vertically oriented junctions.
Multiple - cross flow junctions allows for water recirculation within IRWST. The
arrangement of the IRWST is reported in Figure 26.
CENTRAL BAY
Heat Structure
From CCC=824 1 2 6
5 3
PRHR
BAY 5
4 4 4
3 5 CCC 800 3
2 6 2
To CCC=828 8 7
1
Heat Structure
CENTRAL BAY
Page 68
67
Figure 26: IRWST noding scheme
The discharge line, connecting the IRWST to the DVI line, is simulated by means of the
following components (numbers between brackets refer to loop 2):
single junction 811 (812), joining the pipe 802, simulating the IRWST Central bay,
to the discharge pipe 813 (814);
pipe 813 (814), simulating the discharge line 1 (2), respectively;
check valve 815 (816), connecting the pipe 813 (814) to the pipe 864 (884),
simulating the DVI line.
3.9. Core Make-up Tanks
The CMT model can be subdivided into three regions: balance line, discharge line and
CMT tank. A scheme of the CMT nodalization is reported in Figure 27. The two CMTs
have the same hydrodynamic characteristics: in the following, values in brackets are
referred to CMT B.
The balance line is simulated by the pipes 857 (877) and 858 (878). The sngljun 855 (875)
simulates the always open motor valve, while branch 859 (879) the CMT inlet. The CMT
injection line is constituted by pipe 862 (882), subdivided into 2 volumes, and a branch
866 (886). The motor valve 861 (881) simulates the CMT discharge motor valve, which is
normally closed and opens on “S” signal, ADS actuation, etc. The junction 863 (883),
connecting the discharge line to the DVI line, has been simulated with a check valve, in
order to prevent reverse flow in the CMT loop. The branch 866 (886) simulates the tee
connection with RNS injection line, while junction 867 (887) represents the connection to
Component Number
Central bay 802 Sparger bay 803 Vol. height 10 10 (1) 1.2500 29.0000
9 9 896 1.1980 27.8020 8 8 1.0000 26.8020 7 6 7 3.3125 23.4895 6 PRHR 5 6 3.5833 19.9062 5 Bay 4 5 3.5833 16.3229 4 800 3 4 3.5833 12.7396 3 2 3 3.5833 9.1563 2 1 2 3.3125 5.8438 1 y 1 5.8438 0
(1) Crossflow Junction to simulate Overflow - Vent Area is also attributed to this
El. from Bottom
Page 69
68
the RPV. The CMT tank is modeled using a pipe [860 (880)] composed by 20 volumes.
The detailed schematization of the tank is needed in order to simulate a realistic behavior
of the CMT tank draining. In fact, due to RELAP5 code models limitation related to the
evaluation of heat transfer area, condensation is one of the phenomenology that can affect
CMT performances. If large nodes are used, strong steam condensation occurs on the CMT
cold walls and at the cold CMT water interface, preventing the tank to drain. The use of a
more detailed nodalization (i.e. thinner nodes) can limit the occurrence of this
phenomenon. The metallic structures of CMT tank and lines have been modeled with four
heat structures (for each CMT), simulating respectively injection and balance line, CMT
upper head, CMT cylindrical part and CMT lower head walls.
Figure 27: CMT noding scheme (CMT A)
1
2
3
4
5
6
7
8
9
10
11
12
13
14
15
16
17
18
19
20
1
2
3
4
5
6
12859
856
857
855858
860
From cold
leg
1 12 2
861
862 863
864
From ACC
867
To vessel866
From RNS
Page 70
69
3.10. Accumulators
The Accumulators System consists of two trains (ACC1 and ACC2), each composed by a
tank, a discharge line, an isolation valve and two check valves. ACC1 and ACC2 discharge
water in DVI1 and in DVI2, respectively. The ACC1 (ACC2) system has been modeled
using the special RELAP5 hydrodynamic component “accumulator”. In the “accumulator”
model input cards, all the data referring to the tank geometry, to the discharge line and
valves configuration and to the hydraulic parameters have been set according to the
nominal safeguard data.
3.11. Chemical and Volume Control System
RCS makeup function has been simulated, using two components: a tank (e.g. tmdpvol
943) and a pump (e. g. tmdpjun 942) injecting the makeup water in the SG outlet plenum
(volume 225). Furthermore the auxiliary PRZ spray and the letdown functions are taken
into account. A scheme of the CVS nodalization is shown in Figure 28. Specific
pressurizer water level setpoints control the operation of this system.
Figure 28: Chemical and Volume Control System noding scheme
946
947
225-40
9
4
8
949
Auxiliary Spray Line
440
PRZ Dome
SG1 Outlet Plenum
242
951950
Letdown
Cold leg 1a240
942 943
944 945
Makeup (1 pump)
Makeup (2 pumps)
953 952
Auxiliary Spray
Page 71
70
3.12. Startup Feedwater System and Steam Dump System
The Startup Feedwater System (FWS) has been modeled as an interface to the Steam
Generators. This means that for each steam generator a tmdpjun (508 for loop 1, 608 for
loop 2) has been used which takes suction from a tmdpvol (509 for loop 1, 609 for loop 2)
and injects the required flow to the dedicated steam generator. The startup feedwater
system flow is imposed to each tmdpjun. Specific steam generator water level and cold leg
temperature setpoints control the operation of this system.
The steam dump has been simulated through a time dependent junction (788) which
connects the steam header to a time dependent volume (790).
3.13. Normal Residual Heat Removal System
In the AP1000 design, the normal residual heat removal system has several functions. In
the developed AP1000 Relap5 model only the following functions have been taken into
account:
Low Pressure Reactor Coolant System Makeup and Cooling;
In-Containment Refueling Water Storage Tank Cooling.
A scheme of the RNS nodalization is shown in Figure 29.
Figure 29: Normal Residual Heat Removal System noding scheme
846
847 850
851
848
849
845841
843
844
Cask
loading pit
840
1
10
852
853
8
1
4
IRWST-B
DVI-2
DVI-1
IRWST
Page 72
71
3.14. Containment Recirculation System
A scheme of the Containment Recirculation System noding is shown in Figure 30. Pipe
component 162 represents the containment sump in which, following a LOCA, water
accumulates. Water can be passively re-injected from the sump to the RPV by means of
two trains (A and B) of two lines each which take suction from the sump and are connected
to the IRWST injection lines. From here water can reach the DVI lines and, hence, the
RPV. The lines from containment sump to IRWST injection lines are shown in Figure 30.
Figure 30: Containment Recirculation System noding scheme
3.15. Control and Protection System
Combination of several control variables, general tables and trips allows for the
simulations of the plant protection and safety monitoring system. The following control
logic has been implemented: reactor trip, Safeguard (S) actuation signal, turbine trip, main
feed water and main steam line isolation, CMTs injection, reactor coolant pumps trip,
PRHR HX actuation, SGs PORV actuation, ADS actuation, PRZ spray actuation, PRZ
heaters actuation, startup feedwater actuation, CVS operation, steam dump actuation,
containment recirculation system actuation.
163
(183)
164
(184)
165
(185)
166
(186)167
(187)174
(194)162
1
10
175
(195)
169
(189)
170
(190)
171
(191)
172
(192)
173
(193)To IRWST injection line
volume 813-01 (814-01)
020
019
010
009
70.5 ft
109.13 ft
91.29 ft 98.54 ft
Page 73
72
3.16. Steady state calculations
Some dedicated control options are activated during steady state calculations in order to
reach the steady state at the specified conditions. At a specified time instant these
dedicated controls are disabled and the run is continued in order to verify that a good
steady state has been actually reached. The table below reports a small portion of steady
state calculation results for the nominal reactor operating conditions: they are compared to
the reference values. It can be seen that deviations are negligible.
Table 3: AP1000 Relap5 steady state calculation results summary
Plant parameter BEF 0% value Relap value %Error°
Vessel flow (lb/s) 33,444 33,444 -
Thimble flow (lb/s) 635 614 3.4%
Bypass flow (cavity + shroud +
nozzle leakage) lb/s 835 838 0.36%
Head cooling flow (lb/s) 501 498 0.6%
PRZ pressure (psia) 2250 2250 -
Core out temp. F 614 613.3 0.11%
Vessel out temp F 610 609.7 0.05%
SG out temp F 536.9 536.2 0.13%
Core in temp F 537.2 536.6 0.11%
Steam pressure (psia) 850 848 0.24%
SG steam flow (lb/s) 2079.2 2077.5 0.08%
SG level (from tubesheet), ft 46.285 46.285 -
Heat exchanged by each SG
(MW) 1707.5 1707.4 -
(°)The % error is defined as:
| valuemeasuredor reference|
| valuecalculated - valuemeasuredor reference|100
Page 74
73
4. Pre-operational tests: procedures definition and pre-
tests calculations
As explained in section 1.2, one of the steps in the AP1000 licensing process is the
execution of some pre-operational tests on the first three built plants in order to
demonstrate the proper operation of the “first of a kind” systems. Such tests have to be
successfully performed to be allowed to load the nuclear fuel and to start power operation.
In this chapter the selected pre-operational tests, i. e. CMTs hot recirculation and
draindown tests and the ADS tests, are described in detail: first the AP1000 Relap5 model
adaptation to reproduce the actual RPV configuration which will be used for tests
performance is described. Then for each of the three pre-operational tests, the test
procedure and simulation results are reported. The following Table 4 summarizes the tests
procedures.
Page 75
74
Table 4: pre-operational tests procedures
TEST DESCRIPTION INITIAL CONDITIONS RELAP5 RUN DESCRIPTION
1 CMTs hot recirculation test RCS temperature: about 540 °F (555 K)
PRZ pressure: 2250 psia (15.5 MPaa)
PRZ level: 58% of span
Secondary loops at about 540 °F (555 K)
and corresponding saturation pressure
(about 962 psi, i. e. 6.6 MPa), isolated from
turbine
ACCs, PRHR, ADS, RNS, etc. disabled
RCPs at maximum speed
The plant is at the initial conditions summarized in column 3. The test starts opening the CMTs discharge
valves and tripping the RCPs with 10 s delay. The operation of CMTs in water recirculation mode is verified:
the RPV cools down and the CMTs heat up. The test is secured closing the CMTs discharge valves once the
CMTs discharge valves mass flow rate zeros.
2 CMTs draindown test Same as for CMTs recirculation test (TEST
1) with the following differences:
o PRZ level: 25% span
o CMTs temperature as at the end
of CMTs hot recirculation test
o All ADS stages but 1A disabled
The plant is at the initial conditions summarized in column 3. The RCPs are tripped and the test is initiated
with an ADS actuation signal after the RCPs have been tripped. This signal leads to open the CMTs discharge
valves with a small delay and ADS train A stage 1 control valve opening. Due to ADS stage 1 operation, the
primary system depressurizes and the operator opens the SGs PORVs when PRZ pressure becomes 300 psi
(2.07 MPa) smaller than SGs pressure. The operation of the CMTs in water recirculation mode, the transition
from recirculation to draindown mode and the operation in draindown mode are verified. The test is secured
closing the CMTs discharge valves, the ADS stage 1 control valve and the SGs PORVs when CMTs level
reaches the ADS stage 4 actuation set-point.
3 ADS test Same as for CMTs recirculation test (TEST
1), with CMTs disabled and both ADS
trains enabled.
The plant is at the initial conditions summarized in column 3. The RCPs are tripped and the test is initiated
with an ADS actuation signal which opens the first three ADS stages starting from stage 1 followed by stage 2
and stage 3 after short time delays. The operator opens the SGs PORVs when PRZ pressure becomes 300 psi
smaller than SGs pressure. Once the ADS control valves are fully open, the spargers are tested at full flow for
10 s and then operators start closing the ADS isolation valves one at a time in the reverse order, with each
close command following a 10 s delay after the previous one. Once all the isolation valves are closed, SGs
PORVs start closing and the test is secured.
Page 76
75
4.1. Relap5 input model modifications
It has to be noted that the selected tests are performed without any nuclear fuel in the
Reactor Pressure Vessel, hence without any decay heat. The successful demonstration of
these tests (as well as of other tests on the Passive Core Cooling System) is needed to be
allowed to load the nuclear fuel.
In order to represent the vessel configuration which will be used to perform these tests, the
Relap model as described in chapter 3, has been slightly modified (see Figure 31 and
Figure 32) respect to its reference configuration. In particular the components representing
the core and the core bypass have been substituted with a single pipe component of the
same height but with the total cross flow area equal to that included within the core shroud
plates. Furthermore the heat structures which were connected to the old pipe components
representing core and bypass have been disabled, as it was reactor kinetics. In this way the
Reactor Pressure Vessel input reflects the exact configuration which will be used to
perform the tests.
Figure 31: standard RPV noding
11
10
9
8
7
6 114
5
4
3
2
1
115
1
2
3
4
5
6
7
1
2
3
4
5
6
7
116 118
120
130
131
140
101 102
88
1
2
91 1
2
92
89
125
135
155
150
110
160
CL2A
CL2B
CL1A
CL1B
HL2HL1
Page 77
76
Figure 32: modified RPV noding used for the performed pre-tests calculations
4.2. CMTs hot recirculation test
The following two paragraphs describe the CMTs hot recirculation test procedure and
simulation results respectively.
4.2.1. CMTs hot recirculation test procedure
This test verifies that CMTs will operate in natural circulation, cooling the RCS while the
CMTs are heated up by the recirculated flow from the cold legs. The AP1000 Design
Control Document requires this test, as well as the others, to be performed at a RCS
temperature greater than 550 K (530 °F) and normal operating pressure (2250 psi, i. e. 15.5
MPa). A temperature of 540 °F (555 K) has been judged appropriate for this test, as well as
for the others. The secondary side is also at 540 °F (555 K) since all the selected tests are
performed at zero power, before loading the nuclear fuel. As said, in order to be allowed to
11
10
9
8
7
6 114
5
4
3
2
1
1
2
3
4
5
6
7
1
2
3
4
5
6
7
116
120
130
131
140
101 102
88
1
2
91 1
2
92
89
125
135
155
150
110
160
CL2A
CL2B
CL1A
CL1B
HL2HL1
Page 78
77
load the nuclear fuel, the whole envisaged test program has to be successfully completed.
Initial pressurizer water level is programmed at the upper bound of the normal operating
range to reduce the requirement for makeup as the RCS cools due to CMTs water
recirculation, and the PRZ heaters are in automatic control. Various Protection and Safety
Monitoring System (PMS) safeguards signals will have to be blocked to prevent unneeded
equipment actuation (this applies to all the tests). At test initiation the Startup Feedwater
System (FWS) is feeding both Steam Generators (SGs) and turbine bypass valves and/or
SGs PORVs3 are controlling RCS temperature and SGs pressure. The test is initiated by
simulating a safety signal to open the CMTs outlet isolation valves; all the Reactor Coolant
Pumps (RCPs) are tripped after a time delay of 10 seconds. Feedwater is simultaneously
secured to the SGs. Turbine bypass valves or PORVs are closed. This procedure is chosen
to be able to verify, without any doubt, that natural circulation is due to CMT—RCS
average temperature difference and not from that between SGs—RCS. The CMTs water
recirculation test is continued until the CMTs discharged mass flow rate zeros. At this
point CMTs discharge valves are closed and it is verified whether the average temperature
in the CMTs has reached a temperature indicative of recirculation - 350 °F (450 K) - as
required in the AP1000 Design Control Document. Once this has been verified, RCPs are
started to heat up the RCS back up to 540 °F in preparation for the draindown test.
4.2.2. CMTs hot recirculation test simulation results
The first 3000 s of the Relap5 run are used to reach the initial conditions reported in Table
4. At 3000 s the CMTs discharge valves are opened and the turbine stop valves are closed
(SGs isolation), and at 3010 s the RCPs are tripped.
Figure 334 shows the mass flow rate entering the CMT A through the corresponding
pressure balance line and the mass flow rate discharged through CMT A discharge valves
(for CMT B the trend is practically the same, as shown in Figure 34). It can be seen that, as
soon as the CMTs discharge valves open, the CMTs start injecting cold water into RPV
3 Whether to use SGs PORVs or turbine bypass valves to evacuate the produced steam, does not affect the
test results. 4 The initial spike is due to the fact that, in this test, when CMTs discharge valves open, the Reactor Coolant
Pumps are running (it is recalled that the pressure balance lines inlet is downstream loop 2 reactor coolant
pumps). They are tripped after 10 s.
Page 79
78
while hot water enters the CMTs from the pressure balance lines (the outlet mass flow rate
is bigger than inlet mass flow rate). The mass flow rate through CMTs discharge valves
continues for thousands of seconds until it practically zeroes. At the end of the test the
water mass injected into RPV from CMT A (integral of discharged mass flow rate) is about
97% of the mass initially stored (Figure 35). Hence, at the end of the transient, each CMT,
operating in water recirculation mode, has discharged a total mass practically equal to the
initial CMT inventory; in other terms all the water initially stored in the CMTs is actively
mixed with the RCS water inventory.
The cold water discharged from the CMTs enters the RPV downcomer through the DVI
lines: it cools the RPV flowing downward through the downcomer, then it reaches the
lower plenum, the core region (core structures not present) and the upper plenum/head.
This is shown in Figure 365.
Figure 33: mass flow rate entering and exiting CMT A [% of max flow]
5 The water stratification in the RPV is due to the fact that the CMTs water, injected in the downcomer via
the DVI lines, mixes with the initially hot water within the RPV and it is heated up, diminishing its “cooling
power”.
It should be noted that, at about 7500 s, the mass flow rate practically zeroes. At that time, the downcomer
wall temperature has remained few degrees higher than lower plenum wall temperature (it is recalled that the
vessel cylindrical wall is thicker than lower head wall): this explains why downcomer water temperature
increases few degrees after about 7500 s. Furthermore at about 6200 s, a small flow reversal is predicted in
loop 1 (PRHR loop). Some hot water from loop-1 hot leg enters the upper plenum and this explains the upper
plenum water temperature behavior around 6200 s.
-2.00E+01
0.00E+00
2.00E+01
4.00E+01
6.00E+01
8.00E+01
1.00E+02
1.20E+02
2000 3000 4000 5000 6000 7000 8000 9000 10000 11000 12000
ma
ss flo
w r
ate
[%
of
ma
x f
low
]
time [s]
CMT inlet and outlet mass flow rate
inlet outlet
Page 80
79
Figure 34: mass flow rate entering and exiting the CMTs [% of max flow]
Figure 35: water mass injected in RPV from CMT A [% of CMT initial water mass]
-2.00E+01
0.00E+00
2.00E+01
4.00E+01
6.00E+01
8.00E+01
1.00E+02
1.20E+02
2000 3000 4000 5000 6000 7000 8000 9000 10000 11000 12000
ma
ss f
low
ra
te [
% o
f m
ax
flo
w]
time [s]
CMTs inlet and outlet mass flow rates
inlet-CMT A
outlet-CMT A
inlet-CMT B
outlet-CMT B
-2.00E+01
0.00E+00
2.00E+01
4.00E+01
6.00E+01
8.00E+01
1.00E+02
1.20E+02
2000 3000 4000 5000 6000 7000 8000 9000 10000 11000 12000
inje
cte
d w
ate
r m
ass
[%
of
CM
T i
nit
ial w
ate
r m
ass
]
time [s]
CMT injected water mass
CMT injected water mass
Page 81
80
Figure 36: water temperature in some RPV regions [K]
While the CMTs are discharging cold water into RPV, hot water enters the tanks through
the cold legs pressure balance lines (Figure 37). At the end of the transient the lowest sub-
volume has reached a temperature of about 381.5 K (i. e. 227 °F), while the average CMT
temperature is about 460 K (i. e. 368 °F, mass averaged temperature). Hence the objective
of the test to have CMTs at a temperature greater than 350 °F (450 K, see section 4.2.1) is
achieved.
Figure 38 shows the mass flow rate entering hot leg 2 and Figure 39 shows the CMT A
balance line mass flow rate, cold leg 2A to RPV mass flow rate, SG-2 to cold leg 2A mass
flow rate. It can be seen that hot leg 2 mass flow rate zeros and eventually reverses, while
the CMTs mass flow rates are still significant (Figure 33), hence CTMs water does not
enter the SGs anymore.
From Figure 39, we distinguish three time intervals:
before about 3400 s the mass flow rate reaching the cold leg 2A from SG-2 enters
in part the RPV downcomer and in part the CMT A balance line;
from about 3400 s to about 4600 s the mass flow rate from SG-2 to cold leg 2A is
still positive (it zeroes at about 4600 s) while the mass flow rate from cold leg 2A
to RPV downcomer has become negative: this means that CMT A pressure balance
3.50E+02
4.00E+02
4.50E+02
5.00E+02
5.50E+02
6.00E+02
2000 3000 4000 5000 6000 7000 8000 9000 10000 11000 12000
tem
pera
ture [
K]
time [s]
water temperature in the RPV [K]
downcomer
lower plenum
core region
upper plenum
upper head
Page 82
81
line is fed in part through the water coming from SG-2 and in part through the
water coming from RPV downcomer;
after about 4600 s the mass flow rate from SG-2 to cold leg 2A zeroes while the
mass flow rate entering the cold leg from RPV downcomer equals the CMT A
pressure balance line mass flow rate. This means that now CMT A pressure balance
line is fed only through the water coming from RPV upper downcomer.
The same applies to CMT-B, CMT-B pressure balance line and cold leg 2B.
Figure 37: water temperature in CMT A [K]
2.50E+02
3.00E+02
3.50E+02
4.00E+02
4.50E+02
5.00E+02
5.50E+02
2000 3000 4000 5000 6000 7000 8000 9000 10000 11000 12000
tem
pera
ture [
K]
time [s]
CMT water temperature
upper
middle
lower
Page 83
82
Figure 38: mass flow rate entering hot leg 2 [% of max flow]
Figure 39: CMT A balance line mass flow rate, cold leg 2A to RPV mass flow rate, SG-2 to
cold leg 2A mass flow rate [% of max flow]
Figure 40 shows the temperatures in the hot leg 2. It can be seen that the temperature
initially, until about 4600 s, goes down because of CMT injection and because the mass
flow rate entering hot leg 2 is still positive (Figure 38). At about 4600 s hot leg 2 mass
-5.00E-01
-3.00E-01
-1.00E-01
1.00E-01
3.00E-01
5.00E-01
7.00E-01
9.00E-01
2000 3000 4000 5000 6000 7000 8000 9000 10000 11000 12000
ma
ss flo
w r
ate
[%
of
ma
x f
low
]
time [s]
hot leg 2 inlet mass flow rate
mass flow rate
-5.00E-01
-3.00E-01
-1.00E-01
1.00E-01
3.00E-01
5.00E-01
7.00E-01
9.00E-01
2000 3000 4000 5000 6000 7000 8000 9000 10000 11000 12000
ma
ss flo
w r
ate
[%
of
ma
x f
low
]
time [s]
mass flow rates in cold leg 2A
SG-2 to cold leg 2A
cold leg 2A to RPV
CMT A balance line
Page 84
83
flow reverses (Figure 38) and temperature in hot leg 2 increases. Figure 41 shows the
temperature in cold leg 2A (for cold leg 2B it is similar): the temperature goes down
because of CMTs operation.
Figure 40: loop 2 hot leg temperature [K]
Figure 41: cold leg 2A temperature [K]
4.80E+02
4.90E+02
5.00E+02
5.10E+02
5.20E+02
5.30E+02
5.40E+02
5.50E+02
5.60E+02
2000 3000 4000 5000 6000 7000 8000 9000 10000 11000 12000
tem
pera
ture [
K]
time [s]
hot leg 2 water temperature
hot leg 2 temperature
4.20E+02
4.40E+02
4.60E+02
4.80E+02
5.00E+02
5.20E+02
5.40E+02
5.60E+02
2000 3000 4000 5000 6000 7000 8000 9000 10000 11000 12000
tem
pera
ture [
K]
time [s]
cold leg 2A water temperature
cold leg 2A temperature
Page 85
84
The PRZ dome pressure and PRZ water volume are shown in Figure 42 and Figure 43
respectively: when CMTs discharge valves are actuated, PRZ pressure decreases, then it is
recovered by means of the PRZ heaters operation. Moreover, because of RCS cooldown
due to CMTs operation, PRZ water volume decreases.
Figure 42: PRZ pressure [Pa]
Figure 43: PRZ water volume [m3]
1.51E+07
1.52E+07
1.52E+07
1.53E+07
1.53E+07
1.54E+07
1.54E+07
1.55E+07
1.55E+07
1.56E+07
2000 3000 4000 5000 6000 7000 8000 9000 10000 11000 12000
press
ure [
Pa
]
time [s]
pressurizer dome pressure
PRZ pressure
2.00E+01
2.20E+01
2.40E+01
2.60E+01
2.80E+01
3.00E+01
3.20E+01
3.40E+01
3.60E+01
3.80E+01
4.00E+01
2000 3000 4000 5000 6000 7000 8000 9000 10000 11000 12000
wa
ter v
olu
me [
m^
3]
time [s]
pressurizer water volume
PRZ water volume
Page 86
85
From the figures and transient description reported above it can be seen that the performed
CMTs hot recirculation test simulation shows that CMTs are able to operate in water
recirculation mode, cooling down the RPV. Furthermore, the CMTs average temperature
reaches, at the end of the test, a final value of about 368 °F (460 K), hence greater than the
limit value of 350 °F (450 K) specified in the AP1000 Design Control Document.
4.3. CMTs draindown test
The following two paragraphs describe the CMTs draindown test procedure and simulation
results respectively.
4.3.1. CMTs draindown test procedure
The goal of this test is to verify the CMTs will transition from the recirculation mode to the
draindown mode. This is done by depressurizing the RCS using one valve in the ADS: in
this way the hot RCS water will flash and, in particular, steam will feed the CMTs pressure
balance line causing the CMTs draindown. The smallest ADS valve (stage 1), with the
maximum opening time, will be used in order to limit the mechanical and thermal stresses
to the plant. This test is performed shortly after the CMTs hot recirculation test: the RCPs
are restarted and the plant is re-heated while the temperature in the CMTs, isolated at the
end of the CMTs hot recirculation test, remains the same as at the end of the first test. At
test initiation startup feedwater is feeding both SGs, while turbine bypass valves and/or
SGs PORVs are controlling RCS temperature and SGs pressure. The pressurizer (PRZ)
level is lower in order to allow a quicker draindown. PRZ heaters are disabled in order to
prevent any heaters uncovering while they are energized. The test is initiated tripping all
the RCPs and closing the turbine bypass valves and/or SGs PORVs and securing the
startup feedwater. After a time delay, an ADS actuation signal is generated. This signal
leads to open the CMTs discharge valves and, then, the only activated ADS stage 1
discharge valve. The RCS depressurization, due to ADS stage 1 operation, is expected to
trigger the CMTs draindown after a certain time. Operators are instructed to open SGs
PORVs whenever the RCS pressure becomes 300 psi (2.07 MPa) smaller than SGs
pressure: this is done in order to limit the reverse pressure difference between primary and
Page 87
86
secondary side. The draindown is continued until the water level in the CMTs reaches the
ADS stage 4 actuation set-point. Then the test is secured closing the CMTs discharge
valves, the ADS stage 1 control valve and the SGs PORVs.
4.3.2. CMTs draindown test simulation results
The first 800 s of the Relap5 run are used to reach the initial conditions specified in Table
46. At 800 s the RCPs are tripped and an ADS actuation signal occurs with a specified
delay (only train A stage 1 is enabled). This signal leads to the opening of the CMTs
discharge valves and ADS train A stage 1 control valve opening.
Figure 44 shows the mass flow rate through ADS stage 1 control valve: mass flow rate
initially increases, until stage 1 control valve has reached the fully open position; then it
decreases because valve operation is depressurizing the primary system (Figure 45). The
primary water swelling due to RCS depressurization sudden fills the PRZ (Figure 467,
Figure 47 and Figure 48) and the liquid fraction at stage 1 control valve sudden increases
(Figure 49). This results in the increasing of the mass flow rate discharged through ADS
stage 1 control valve. Then the combined operation of stage 1 control valve and SGs
PORVs, which open when the PRZ pressure has become 300 psi (2.07 MPa) smaller then
SGs pressure, is responsible for the mass flow rate decrease. When the CMTs water
volume has reached the stage 4 actuation set point, the stage 1 control valve is closed
(together with CMTs discharge valves and SGs PORVs) and the test is secured.
6 This test simulation is performed after the first one, so that the input file contains the conditions reached at
the end of the first simulation. This allows a faster steady state attainment which occurs in about 800 s. 7 It should be noted that in the AP1000 Protection and Safety Monitoring System architecture, 0% PRZ span
and 100% PRZ span do not correspond to completely full and completely void PRZ respectively. In
particular, when the level is 100% span, the PRZ is not yet completely full of water but there is still some
space to accommodate more liquid water. Hence, the level can go beyond 100% span.
Page 88
87
Figure 44: mass flow rate through ADS stage 1 control valve [% of max flow]
Figure 45: PRZ steam pressure [Pa]
-2.00E+01
0.00E+00
2.00E+01
4.00E+01
6.00E+01
8.00E+01
1.00E+02
1.20E+02
500 1000 1500 2000 2500 3000 3500
ma
ss flo
w r
ate
[%
of
ma
x f
low
]
time [s]
ADS 1A mass flow rate
mass flow rate
0.00E+00
2.00E+06
4.00E+06
6.00E+06
8.00E+06
1.00E+07
1.20E+07
1.40E+07
1.60E+07
1.80E+07
500 1000 1500 2000 2500 3000 3500
press
ure [
Pa
]
time [s]
pressurizer dome pressure
PRZ pressure
Page 89
88
Figure 46: PRZ water level [% of span]
Figure 47: PRZ water volume [m3]
-2.00E+01
0.00E+00
2.00E+01
4.00E+01
6.00E+01
8.00E+01
1.00E+02
1.20E+02
500 1000 1500 2000 2500 3000 3500
wa
ter lev
el [%
of
spa
n]
time [s]
pressurizer water level
PRZ water level
0.00E+00
1.00E+01
2.00E+01
3.00E+01
4.00E+01
5.00E+01
6.00E+01
7.00E+01
500 1000 1500 2000 2500 3000 3500
wa
ter v
olu
me [
m^
3]
time [s]
pressurizer water volume
PRZ water volume
Page 90
89
Figure 48: PRZ surge line inlet mass flow rate [% of max flow]
Figure 49: liquid fraction at ADS stage 1 control valve [-]
-4.00E+01
-2.00E+01
0.00E+00
2.00E+01
4.00E+01
6.00E+01
8.00E+01
1.00E+02
500 1000 1500 2000 2500 3000 3500
ma
ss flo
w r
ate
[%
of
ma
x f
low
]
time [s]
surge line mass flow rate
mass flow rate
-2.00E-01
0.00E+00
2.00E-01
4.00E-01
6.00E-01
8.00E-01
1.00E+00
1.20E+00
500 1000 1500 2000 2500 3000 3500
liq
uid
fra
cti
on
[-]
time [s]
ADS 1A liquid fraction
liquid fraction
Page 91
90
Figure 50 shows the mass flow rate through CMT A discharge valves (for CMT B it is
practically the same, as shown in Figure 51) and CMT A pressure balance line (for CMT B
it is practically the same, as shown in Figure 51), Figure 52 shows the liquid fraction in
cold leg 2A (for cold leg 2B it is practically the same) and CMT A pressure balance line
inlet (for CMT B pressure balance line inlet it is practically the same). It can be seen that
until the pressure balance line is full of water, the CMTs operate in water circulation mode
with the cold discharged mass flow rate bigger than the hot mass flow rate entering the
CMTs through the pressure balance lines (Figure 50). At about 1700-1750 s, some
significant void forms in the pressure balance lines because of RCS depressurization due to
ADS stage 1 operation. When the void fraction in the cold legs becomes significant and
stable (Figure 52), the pressure balance lines are fed mainly by steam (they void). This
causes a rapid voiding of the CMTs. In this phase the discharged mass flow rate rapidly
increases (Figure 50) to values of about 2.5 times the recirculation value. The CMTs
transition from their recirculation mode to their draindown mode has just occurred and it is
well visible from the plotted figures. When the water volume in the CMTs reaches the
ADS 4 actuation set point, the test is secured closing the CMTs discharge valve and the
stage 1 control valve.
Figure 50: mass flow rate through CMT A discharge valves and CMT A pressure balance
line [% of max flow]
-2.00E+01
0.00E+00
2.00E+01
4.00E+01
6.00E+01
8.00E+01
1.00E+02
1.20E+02
500 1000 1500 2000 2500 3000 3500
ma
ss flo
w r
ate
[%
of
ma
x f
low
]
time [s]
CMT inlet and outlet mass flow rate
inlet outlet
Page 92
91
Figure 51: mass flow rate through CMTs discharge valves and CMTs pressure balance lines
[% of max flow]
Figure 52: liquid fraction in cold leg 2A and CMT A pressure balance line inlet [-]
Figure 53 shows the CMT A and CMT B outlet temperatures. As the CMTs voiding
proceeds, the hotter water initially contained in the upper part is discharged.
-4.00E+01
-2.00E+01
0.00E+00
2.00E+01
4.00E+01
6.00E+01
8.00E+01
1.00E+02
1.20E+02
500 1000 1500 2000 2500 3000 3500
ma
ss f
low
ra
te [
% o
f m
ax
flo
w]
time [s]
CMTs inlet and outlet mass flow rates
inlet-CMT A
outlet-CMT A
inlet-CMT B
outlet-CMT B
-2.00E-01
0.00E+00
2.00E-01
4.00E-01
6.00E-01
8.00E-01
1.00E+00
1.20E+00
500 1000 1500 2000 2500 3000 3500
liq
uid
fra
cti
on
[-]
time [s]
balance line inlet and cold leg liquid fraction
cold leg 2A
CMT A pressure balance line
Page 93
92
Figure 53: CMT A outlet temperature and CMT B outlet temperature [K]
From the figures and transient description reported above, it can be seen that, the
performed CMTs draindown test simulation clearly shows the ability of the CMTs to
transition from water recirculation to water draindown mode, as required in the AP1000
Design Control Document (2010).
4.4. ADS test
The following two paragraphs describe the ADS test procedure and simulation results
respectively.
4.4.1. ADS test procedure
The goal of this test is to prove, on the real plant, the effectiveness of the ADS in operating
as expected. This is done by generating an ADS actuation signal which will cause opening
of ADS stages 1, followed by stages 2 and 3 after short time delays. In order to minimize
the mechanical and thermal stresses to the plant, the maximum opening time will be used.
At test initiation startup feedwater is feeding both SGs, while turbine bypass valves and/or
3.80E+02
4.00E+02
4.20E+02
4.40E+02
4.60E+02
4.80E+02
5.00E+02
5.20E+02
500 1000 1500 2000 2500 3000 3500
tem
pera
ture [
K]
time [s]
CMTs outlet temperature
CMT A CMT B
Page 94
93
SGs PORVs are controlling RCS temperature and SGs pressure. The test is initiated by
tripping the RCPs and closing the turbine bypass valves and/or SGs PORVs. The ADS
actuation signal is generated after a delay allowing RCS flow coastdown. Once the ADS
control valves are all fully open, the spargers are tested at full flow for 10 seconds.
Furthermore operators are instructed to open SGs PORVs whenever the RCS pressure
becomes 300 psi (2.07 MPa) smaller than SGs pressure: this is done in order to limit the
reverse pressure difference between primary and secondary side. Once the spargers have
been exposed to full flow for ten seconds, the ADS isolation valves are closed starting
from stage 3 and then, after short time delays, continuing with stage 2 and 1. Once all the
ADS stages have been closed, i. e. the RCS is not being depressurized anymore by ADS
operation, the test is completed closing the SGs PORVs.
4.4.2. ADS test simulation results
The first 500 s of the Relap5 run are used to reach the initial conditions reported in Table
38. At 500 s the RCPs are tripped (Figure 54) and at 980 s an ADS actuation signal occurs.
ADS stage 1 control valves start opening (Figure 55) discharging the loop seals water
(stage 1 liquid fraction becomes 0 in Figure 56) and then steam. After some delay also
stage 2 control valves start opening discharging the corresponding loop seals water (stage 2
liquid fraction becomes 0 in Figure 56) and then steam. Because of RCS depressurization
due to ADS operation (Figure 57) saturation conditions are reached within the primary
loop: primary coolant swelling causes the PRZ to fill with water (Figure 58, Figure 59 and
Figure 60) and a two-phase mixture is discharged through ADS stage 2 and stage 1 control
valves (stage 1 and stage 2 liquid fraction are not 0 anymore in Figure 56) with an increase
in the discharged mass flow rate (Figure 55).
Finally stage 3 control valves open discharging a two phase mixture (Figure 55 and Figure
56).
When the PRZ pressure has become 300 psi (2.07 MPa) lower than SGs pressure,
operators open SGs PORVs, as shown in Figure 62. It has to be noted that, PORVs
actuation depressurizes and cools the secondary side but the effect on the primary side,
8 This test simulation is performed after the second one, so that the input file contains the conditions reached
at the end of the first simulation. This allows a faster steady state attainment which occurs in about 500 s.
Page 95
94
even if present, is practically negligible in comparison to the depressurization and cooling
action of both ADS trains (Figure 61).
When all the ADS control valves are fully open, the spargers are tested in these conditions
for 10 s. Then the securing procedure starts: operators start closing ADS isolation valves
one at a time in the reverse order (starting from ADS stage 1 isolation valve), with each
close command following a small delay after the previous one. Once all the ADS isolation
valves are closed, and hence the primary side is not being depressurized anymore, SGs
PORVs close and the test is secured.
Figure 54: RCS flow fraction [% of nominal]9
9 It can be seen that the initial RCS flow is higher than nominal, since the RCPs are at the maximum speed
and, since the core is not present, the primary system pressure drops are smaller.
-2.00E+01
0.00E+00
2.00E+01
4.00E+01
6.00E+01
8.00E+01
1.00E+02
1.20E+02
0 150 300 450 600 750 900 1050 1200 1350 1500
ma
ss f
low
ra
te [
% o
f n
om
ina
l fl
ow
]
time [s]
RCS mass flow rate
RCS flow
Page 96
95
Figure 55: mass flow rate through ADS train A stage 1, stage 2 and stage 3 control valves [%
of max flow]
Figure 56: liquid fraction at ADS train A stage 1, stage 2 and stage 3 control valves [-]
-2.00E+01
0.00E+00
2.00E+01
4.00E+01
6.00E+01
8.00E+01
1.00E+02
1.20E+02
1000 1100 1200 1300 1400 1500
ma
ss f
low
ra
te [
% o
f n
om
ina
l fl
ow
]
time [s]
ADS train A mass flow rate
ADS stage 1
ADS stage 2
ADS stage 3
-2.00E-01
0.00E+00
2.00E-01
4.00E-01
6.00E-01
8.00E-01
1.00E+00
1.20E+00
1000 1100 1200 1300 1400 1500
liq
uid
fra
cti
on
[-]
time [s]
Liquid fraction at ADS train A control valves
ADS stage 1
ADS stage 2
ADS stage 3
Page 97
96
Figure 57: PRZ steam pressure and RCS pressure (at SG 1 pressure tap) [Pa]
Figure 58: PRZ water level [% of span]
0.00E+00
2.00E+06
4.00E+06
6.00E+06
8.00E+06
1.00E+07
1.20E+07
1.40E+07
1.60E+07
1.80E+07
1000 1100 1200 1300 1400 1500
press
ure [
Pa
]
time [s]
Reactor Coolant System pressure
PRZ dome
SG-1 pressure tap
-2.00E+01
0.00E+00
2.00E+01
4.00E+01
6.00E+01
8.00E+01
1.00E+02
1000 1100 1200 1300 1400 1500
wa
ter lev
el [%
of
spa
n]
time [s]
pressurizer water level
PRZ level
Page 98
97
Figure 59: PRZ water volume [% of max]
Figure 60: PRZ surge line mass flow rate [% of max]
0.00E+00
2.00E+01
4.00E+01
6.00E+01
8.00E+01
1.00E+02
1.20E+02
1000 1100 1200 1300 1400 1500
wa
ter v
olu
me [
% o
f m
ax
]
time [s]
pressurizer water volume
PRZ water volume
-2.00E+01
0.00E+00
2.00E+01
4.00E+01
6.00E+01
8.00E+01
1.00E+02
1.20E+02
1000 1100 1200 1300 1400 1500
ma
ss f
low
ra
te [
% o
f m
ax
]
time [s]
surge line mass flow rate
mass flow rate
Page 99
98
Figure 61: pressure in PRZ dome, SG 1 dome and SG 2 dome [Pa]
Figure 62: mass flow rate discharged through SG 1 PORV and SG 2 PORV [% of max]
Figure 63 shows the total mass flow rate entering ADS train A and total steam mass flow
rate at ADS train A control valves, while Figure 64 shows the total steam mass flow rate at
ADS train A control valves and total steam mass flow rate at ADS train A sparger. It can
0.00E+00
2.00E+06
4.00E+06
6.00E+06
8.00E+06
1.00E+07
1.20E+07
1.40E+07
1.60E+07
1.80E+07
1000 1100 1200 1300 1400 1500
press
ure [P
a]
time [s]
RCS and SGs pressure
PRZ dome
SG-1 dome
SG-2 dome
-2.00E+01
0.00E+00
2.00E+01
4.00E+01
6.00E+01
8.00E+01
1.00E+02
1.20E+02
1000 1100 1200 1300 1400 1500
ma
ss f
low
ra
te [
% o
f m
ax
]
time [s]
PORVs mass flow rate
SG-1 PORV
SG-2 PORV
Page 100
99
be seen that, before reaching the saturation conditions, practically only steam is discharged
through ADS. When saturation conditions are reached in the RCS, the total discharged
mass flow rate contains only a small part of steam (Figure 63). Moreover the quantity of
steam within the discharged mass flow rate increases from ADS control valve to ADS
sparger because some part of the discharged liquid flashes along the ADS piping (Figure
64).
Figure 63: total mass flow rate entering ADS train A and total steam mass flow rate at ADS
train A control valves [% of max]
-2.00E+01
0.00E+00
2.00E+01
4.00E+01
6.00E+01
8.00E+01
1.00E+02
1.20E+02
1000 1100 1200 1300 1400 1500
ma
ss f
low
ra
te [
% o
f m
ax
]
time [s]
ADS train A mass flow rate
ADS total flow rate
ADS steam mass flow rate
Page 101
100
Figure 64: total steam mass flow rate at ADS train A control valves and total steam mass flow
rate at ADS train A sparger [% of max]
Figure 65, Figure 66, Figure 67 and Figure 68 shows the temperatures in some portions of
the primary system: all the temperatures decrease because of RCS depressurization.
Figure 65: water temperature in hot leg 1 and in hot leg 2 [K]
-2.00E+01
0.00E+00
2.00E+01
4.00E+01
6.00E+01
8.00E+01
1.00E+02
1.20E+02
1000 1100 1200 1300 1400 1500
ma
ss f
low
ra
te [
% o
f m
ax
]
time [s]
ADS train A steam mass flow rate
ADS sparger
ADS control valves
5.00E+02
5.10E+02
5.20E+02
5.30E+02
5.40E+02
5.50E+02
5.60E+02
5.70E+02
1000 1100 1200 1300 1400 1500
tem
pera
ture [K
]
time [s]
hot legs temperature
HL-1
HL-2
Page 102
101
Figure 66: water temperature in cold leg 1A and in cold leg 2A [K]
Figure 67: PRZ steam temperature [K]
5.00E+02
5.10E+02
5.20E+02
5.30E+02
5.40E+02
5.50E+02
5.60E+02
5.70E+02
1000 1100 1200 1300 1400 1500
tem
pera
ture [K
]
time [s]
cold legs temperature
CL-1A
CL-2A
5.00E+02
5.20E+02
5.40E+02
5.60E+02
5.80E+02
6.00E+02
6.20E+02
6.40E+02
1000 1100 1200 1300 1400 1500
tem
pera
ture [K
]
time [s]
PRZ dome steam temperature
PRZ dome temperature
Page 103
102
Figure 68: PRZ water temperature [K]
Figure 69 shows the SG 1 and SG 2 steam temperature: it can be seen that temperatures
remain practically constant until SGs PORVs actuation. Then temperatures decrease
because of SGs depressurization due to PORVs operation (Figure 62). When SGs PORVs
close, temperatures slightly increase because of heat released by metallic structures
surrounding SGs domes (Figure 70).
Figure 69: SG 1 steam temperature and SG 2 steam temperature [K]
5.00E+02
5.20E+02
5.40E+02
5.60E+02
5.80E+02
6.00E+02
6.20E+02
6.40E+02
1000 1100 1200 1300 1400 1500
tem
pera
ture [K
]
time [s]
PRZ water temperature
lower head
middle portion
5.00E+02
5.10E+02
5.20E+02
5.30E+02
5.40E+02
5.50E+02
5.60E+02
5.70E+02
1000 1100 1200 1300 1400 1500
tem
pera
ture [K
]
time [s]
SGs dome steam temperature
SG-1 SG-2
Page 104
103
Figure 70: SG 1 upper shell inner wall temperature and SG 1 steam temperature [K]
From the figures and transient description reported above, it can be seen that the ADS test,
as currently planned, allows for the reproduction of the main phenomena due to this system
operation. Furthermore the SGs PORVs opening (in order to limit the pressure difference
between the primary and secondary side, once primary side pressure has become lower
than the primary side one) does not impact on the primary side pressure, hence on the ADS
behavior.
5.00E+02
5.10E+02
5.20E+02
5.30E+02
5.40E+02
5.50E+02
5.60E+02
5.70E+02
1000 1100 1200 1300 1400 1500
tem
pera
ture [K
]
time [s]
SGs dome steam temperature
SG-1 steam
SG-1 wall
Page 105
104
5. Design Basis Accident Analyses with suitable
combination of active and passive systems
As explained in sections 1.1 and 1.3, the AP1000 DCD safety analyses demonstrate that
the AP1000 can cope against all the DBAs employing only passive safety features with no
need for external power or operator action. In other words, AP1000 DiD systems, which
are assumed not to be available in DCD analyses, do not contribute to the nuclear safety of
the plant which is guaranteed by passive features. Anyway, being designed against high
standards, they could be available also following a DBA. Such scenario is analyzed in this
part of the thesis.
The DiD systems are actually designed to prevent passive systems actuation for the more
common (i. e. intact loop) transients. In this thesis their impact on more uncommon
accidents, such as LOCAs, is investigated. In particular, for the two selected accidents, a
1” SBLOCA and an inadvertent ADS actuation signal, the availability of the Normal
Residual Heat Removal System (RNS) is postulated. In the AP1000 safety analyses, for
both these accidents, the ADS stage 4 squib valves open allowing IRWST water injection
and securing the transient. The availability of RNS could avoid the requirement on the 4th
stage opening (and IRWST water injection) thus constituting an additional line of defense.
Moreover, avoiding stage 4 opening, the impact of the selected accidents to the
containment would be lower allowing for a faster plant recovery, with a considerable
impact on plant availability. Finally RNS failure during the accident, once it has been
aligned and it is operating, has also been considered in order to investigate its impact on
accident behavior.
The following section 5.1 summarizes how the RNS can prevent ADS stage 4 actuation,
while sections 5.2 and 5.3 report simulation results for the inadvertent ADS actuation and
the 1” SBLOCA cases respectively.
5.1. RNS impact on ADS stage 4 actuation
As described in section 1.1, in case of a LOCA, the CMTs are automatically actuated.
During a LOCA, the CMTs start to operate in their first mode of operation (water
Page 106
105
recirculation mode) until saturation conditions are reached within the RCS. Then the
pressure balance lines void and CMTs start to operate in their second mode of operation
(water draindown mode). At this point the water level in the CMTs starts decreasing.
The AP1000 Protection and Safety Monitoring System (PMS) logic actuates the ADS first
stage whenever the water level in the CMTs reaches the low-1 set point (67.5 % of CMT
volume, Westinghouse 2010). The second and third stages open based on suitable time
delays after actuation of stage one. The 4th
stage, instead, is opened whenever the CMTs
water level reaches the low-2 set-point, i. e. 20 % of CMTs volume (Westinghouse, 2010).
Looking at Figure 71 it can be seen that there are two check valves between the CMT
discharge and the RNS connection point to the Direct Vessel Injection Line (DVI). The
only way to prevent ADS 4th
stage actuation is to avoid the CMTs water level reaching the
low-2 level set-point which, in turn, can be obtained closing the downstream check valve
before the set-point is reached and keeping it closed. Since the RNS connection point to the
DVI is downstream of the check valves, the head developed by the RNS pumps, together
with the friction pressure drops generated in the piping between the RNS connection point
and the Reactor Pressure Vessel, could be used to generate a backpressure on the second
check valve, high enough to close and keep it closed while the water level in the CMTs
remains above the set-point.
Because of the configuration of the CMTs loop, the water column which can be held up in
the CMTs during RNS operation is function of the friction pressure drop generated in the
path between the RNS-DVI connection and the DVI injection point to vessel. The RNS
flow capacity is such that the developed pressure drops are high enough to maintain a
water column in the CMTs higher than the water column corresponding to ADS stage 4
actuation set point.
Page 107
106
Figure 71: AP1000 passive safety injection system scheme
Hence, the RNS is designed such that its availability can provide an additional success
path, without demand on the ADS-4 and IRWST injection.
The challenge is that RNS can only be aligned when the primary pressure has reached a
pressure low enough so that the pump discharge pressure, pumping from a water storage
source, overcomes the RCS pressure (this will occur when the RCS pressure is below 1.28
MPaa (185 psia)) and when the RCS temperature drops below the RNS design temperature,
450 K (350 °F).
Hence a complete and detailed simulation of the selected transients (1” SBLOCA and ADS
inadvertent actuation) is needed in order to investigate if RCS conditions allowing RNS
effectiveness are reached before CMTs water level drops below the stage 4 actuation set-
point and, once aligned, RNS is capable to close the check valve and keep it closed for an
indefinite period of time.
As explained above, RNS is designed to provide an additional line of defense for more
common (intact loop) transients, in order to prevent the requirement on passive systems.
Demonstrating RNS capability in preventing ADS stage 4 actuation also for the two
selected uncommon accidents (ADS inadvertent actuation and the 1” SBLOCA) would
mean not only that the AP1000 can provide an additional line of defense also for more
uncommon accidents, but it also provides for greater availability of the plant in the case of
more un-frequent faults accelerating the plant recovery and return to operation.
Page 108
107
Additionally, as demonstrated in the following analyses, using the RNS will not result in a
reduction of plant safety as the passive systems remain available to actuate should the
conditions in the plant require so. If the RNS stops providing injection to the RCS, the
check valves isolating the CMTs will re-open, the level in the CMTs will progressively
drop and will eventually reach the ADS stage 4 actuation set-point, allowing IRWST
injection later on.
5.2. ADS inadvertent actuation: accident analysis
The ADS inadvertent actuation has been simulated by means of the Relap5 computer code
using the developed AP1000 model. The accident occurs being the plant operating at full
power. The possibility to align RNS has been credited 1000 s10
after the first safety
injection, making RNS capable to actually inject into the RCS whenever the RCS pressure
has become lower than 1.28 MPa and RCS temperature lower than 450 K. Simultaneously
to RNS actuation, operator actions are credited to start a controlled cooldown of the SGs
secondary side using the SGs PORVs.
In the following, a description of the main plant parameters trends is reported with
particular attention on the CMTs, ADS and RNS behavior.
At 0 s the ADS actuation signal occurs, causing reactor trip and CMTs actuation signal
which in turn aligns the Passive Residual Heat Removal System (PRHR) (Westinghouse,
2010). ADS first stage control valves start opening at 30 s.
Figure 72 and Figure 73 show the ADS train A control valves mass flow rate and liquid
fraction respectively (the same occurs for ADS train B). Stage 1 opens, discharging the
loop seal water and then steam (liquid fraction goes to zero in Figure 73). Pure steam
discharge from stage 1 control valve reaches its maximum when stage 1 reaches the fully
open position. Then the discharged mass flow rate decreases because ADS is
depressurizing the RCS (Figure 74). Eventually, stage 2 control valves start opening
discharging the corresponding loop seals water and then steam. Because of ADS operation,
saturation conditions are reached within the primary system (Figure 75). Pressurizer
suddenly fills with water, as visible in Figure 76 and Figure 77 (initial negative surge line
mass flow rate and level decreasing are due to reactor trip and PRHR and CMTs actuation)
10
Maximum time for RNS alignment is 15 minutes, i. e. 900 s, after the first safety injection.
Page 109
108
and a two phase mixture is discharged by the ADS, with a sudden increase in the
discharged mass flow rate. The mass flow rate discharged by stage 1 and stage 2 reaches
its maximum when stage 2 control valves have reached the fully open position. Then,
because ADS operation is discharging primary coolant out of RCS, pressurizer level
decreases, causing a reduction of the liquid fraction at the ADS valves so that the ADS
mass flow rate, in turn, decreases. Then ADS stage 3 control valves start opening
discharging a two-phase mixture.
Figure 72: ADS train A stage 1, stage 2 and stage 3 mass flow rate [% of max flow]
-2.00E+01
0.00E+00
2.00E+01
4.00E+01
6.00E+01
8.00E+01
1.00E+02
1.20E+02
1.00E+00 1.00E+01 1.00E+02 1.00E+03 1.00E+04 1.00E+05
ma
ss f
low
ra
te [
% o
f m
ax
flo
w]
time [s]
ADS train A mass flow rate
ADS 1A mass flow rate [%]
ADS 2A mass flow rate [%]
ADS 3A mass flow rate [%]
Page 110
109
Figure 73: liquid fraction at ADS train A stage 1, stage 2 and stage 3 control valves [-]
Figure 74: RCS pressure [Pa]
-2.00E-01
0.00E+00
2.00E-01
4.00E-01
6.00E-01
8.00E-01
1.00E+00
1.20E+00
1.00E+00 1.00E+01 1.00E+02 1.00E+03 1.00E+04 1.00E+05
liq
uid
fra
cti
on
[-]
time [s]
liquid fraction at ADS train A control valves
ADS 1A liquid fraction [-]
ADS 2A liquid fraction [-]
ADS 3A liquid fraction [-]
1.00E+05
1.00E+06
1.00E+07
1.00E+08
1.00E+00 1.00E+01 1.00E+02 1.00E+03 1.00E+04 1.00E+05
press
ure [
Pa
]
time [s]
Reactor Coolant System pressure
Reactor Coolant System pressure [Pa]
Page 111
110
Figure 75: RCS water temperature and saturation temperature [K]
Figure 76: pressurizer surge line inlet mass flow rate [% of max flow]
0.00E+00
1.00E+02
2.00E+02
3.00E+02
4.00E+02
5.00E+02
6.00E+02
7.00E+02
1.00E+00 1.00E+01 1.00E+02 1.00E+03 1.00E+04 1.00E+05
tem
pera
ture [
K]
time [s]
reactor coolant temperature and saturation temperature
temperature [K]
saturation temperature [K]
-6.00E+01
-4.00E+01
-2.00E+01
0.00E+00
2.00E+01
4.00E+01
6.00E+01
8.00E+01
1.00E+02
1.20E+02
1.00E+00 1.00E+01 1.00E+02 1.00E+03 1.00E+04 1.00E+05
ma
ss f
low
ra
te [
% o
f m
ax
flo
w]
time [s]
surge line mass flow rate
surge line mass flow rate [%]
Page 112
111
Figure 77: pressurizer water level [% of span]
Figure 78 shows the CMT A inlet and outlet mass flow rates (for CMT B it is practically
the same). Initially CMTs operate in water recirculation mode, with hot water entering
through the pressure balance line and cold water discharged to the DVI line. Eventually,
because of the depressurization due to ADS operation, saturation conditions are reached
within the RCS (Figure 75) with consequent void formation. In particular the pressure
balance lines void (they are fed by steam, as shown in Figure 79) and CMTs start operating
in their second mode of operation: draindown mode. The inlet mass flow rate practically
stops, the discharged mass flow rate suddenly increases11
(Figure 78) and the CMTs water
levels start decreasing (Figure 80).
The RCS pressure drop allows also accumulators (ACCs) injection (Figure 81).
11
Note that, when draining starts, the discharged mass flow rate suddenly increases, almost doubling its
value during the recirculation phase. Then the discharged mass flow rate decreases because accumulators
injection starts. Eventually, the discharged mass flow rate increases because the accumulators have voided.
0.00E+00
2.00E+01
4.00E+01
6.00E+01
8.00E+01
1.00E+02
1.20E+02
1.00E+00 1.00E+01 1.00E+02 1.00E+03 1.00E+04 1.00E+05
lev
el [%
of
spa
n]
time [s]
pressurizer water level
pressurizer water level [%]
Page 113
112
Figure 78: CMT A balance line inlet and CMT A discharged mass flow rate [% of max flow]
Figure 79: liquid fraction in CMT A pressure balance line inlet and CMT A discharge [-]
-4.00E+01
-2.00E+01
0.00E+00
2.00E+01
4.00E+01
6.00E+01
8.00E+01
1.00E+02
1.20E+02
1.00E+00 1.00E+01 1.00E+02 1.00E+03 1.00E+04 1.00E+05
ma
ss f
low
ra
te [
% o
f m
ax
flo
w]
time [s]
CMT A inlet and outlet mass flow rate
CMT inlet mass flow rate [%]
CMT outlet mass flow rate [%]
0.00E+00
2.00E-01
4.00E-01
6.00E-01
8.00E-01
1.00E+00
1.20E+00
1.00E+00 1.00E+01 1.00E+02 1.00E+03 1.00E+04 1.00E+05
liq
uid
fra
cti
on
[-]
time [s]
CMT A balance line and discharge line liquid fraction
CMT inlet liquid fraction [-]
CMT outlet liquid fraction [-]
Page 114
113
Figure 80: CMT A and CMT B water level [% of tank volume]
Figure 81: accumulators discharged mass flow rate [% of max flow]
Because of the increased injection mass flow rate due to CMTs draindown and ACCs, the
pressurizer water level partially recovers.
It has to be noted that, up to this point, all the primary mass discharged by the ADS has
been directed into the IRWST. With an assumed failure of all the active systems, the
0.00E+00
1.00E+01
2.00E+01
3.00E+01
4.00E+01
5.00E+01
6.00E+01
7.00E+01
8.00E+01
9.00E+01
1.00E+02
1.00E+00 1.00E+01 1.00E+02 1.00E+03 1.00E+04 1.00E+05
wa
ter lev
el [%
of
tan
k v
olu
me]
time [s]
CMTs water level
CMT A liquid level [%]
CMT B liquid level [%]
-2.00E+01
0.00E+00
2.00E+01
4.00E+01
6.00E+01
8.00E+01
1.00E+02
1.20E+02
1.00E+00 1.00E+01 1.00E+02 1.00E+03 1.00E+04 1.00E+05
ma
ss f
low
ra
te [
% o
f m
ax
flo
w]
time [s]
accumulators mass flow rate
ACC A mass flow rate [%]
ACC B mass flow rate [%]
Page 115
114
CMTs water level would continue to drop reaching the ADS stage 4 opening set point.
ADS stage 4 would actuate discharging directly into the containment, ultimately
depressurizing the RCS and allowing gravity head safety injection from the IRWST,
securing the plant.
However, in this analysis, RNS is postulated to be aligned after the first safety injection
(CMTs injection in this case) but it can actually start injecting in the RCS whenever the
primary pressure has reached a pressure low enough so that the pump discharge pressure,
pumping from a water storage source, overcomes RCS pressure.
Figure 74 shows the RCS pressure: ADS operation is responsible for the steep pressure
reduction within the RCS. It can be seen that the RCS pressure soon becomes lower than
1.28 MPaa (185 psia) setting the first condition for the potential RNS injection. Figure 82
shows the loop 1 and loop 2 average temperatures: it can be seen that, soon after ADS
actuation signal, the average temperatures start decreasing because of reactor trip and
PRHR and CMTs actuation12
. Then, because of ADS operation, saturation conditions are
reached within the RCS and average temperatures decrease more steeply.
When the postulated time delay from the first safety injection has passed so that operators
can be credited for RNS alignment, conditions allowing RNS alignment and injection have
already been reached so that RNS can inject into the RCS (Figure 83). The RNS injected
mass flow rate stabilizes with an RCS pressure of about 0.4-0.5 MPaa. The mass flow rate
is such that the created friction pressure drops between the RNS-DVI tee and the DVI
injection point to vessel are high enough to close the CMTs discharge check valves and
keep them closed, so that CMTs stop draining before ADS stage 4 actuation level setpoint
is reached. Then RNS continues to cooldown and refill the RCS (pressurizer level
recovered in Figure 77) and RCS refilling starts to involve CMTs also. In fact a mass flow
rate through balance lines takes place (Figure 78) and CMTs water volume increases
(Figure 80).
12
CMTs and PRHR actuation occur at 2 s and this explains the temperature decrease after 2 s. Loop 1
average temperature decreases slightly more than loop 2 average temperature since PRHR discharge flow
rate is directed in loop 1 SG, and, from here, to loop 1 cold legs. At the beginning, since the loop 1 hot leg is
full of water, the PRHR operates in single phase mode. At about 100-120 s some void starts to be present in
loop 1 hot leg: PRHR starts operating in two-phase mode, condensing the two phase mixture coming from
hot leg 1. This mode of operation is more efficient, the PRHR mass flow rate increases and this explains why
the loop 1 average temperature drops more steeply around 100 s. Once the depressurization effect due to
ADS operation becomes dominant, loop 1 and loop 2 average temperatures realign following the same trend.
Page 116
115
At 15000 s the simulation is stopped since the phenomena of interest for this analysis
(CMTs recirculation, CMTs draindown initiation, CMTs draindown stopped by RNS flow
rate, etc.) have occurred, the beneficial action of RNS in avoiding ADS stage 4 actuation
has been investigated and the plant is being stably cooled by RNS.
Figure 82: loop 1 and loop 2 TAVG [K]
Figure 83: RNS injected mass flow rate [% of max flow]
3.50E+02
4.00E+02
4.50E+02
5.00E+02
5.50E+02
6.00E+02
6.50E+02
7.00E+02
1.00E+00 1.00E+01 1.00E+02 1.00E+03 1.00E+04 1.00E+05
tem
pera
ture [
K]
time [s]
loop 1 and loop 2 average temperature
loop 1 average temperature [K]
loop 2 average temperature [K]
-2.00E+01
0.00E+00
2.00E+01
4.00E+01
6.00E+01
8.00E+01
1.00E+02
1.20E+02
1.00E+00 1.00E+01 1.00E+02 1.00E+03 1.00E+04 1.00E+05
ma
ss f
low
ra
te [
% o
f m
ax
flo
w]
time [s]
RNS mass flow rate
RNS mass flow rate [%]
Page 117
116
When investigating a suitable combination of active and passive systems, as done above, it
is important to make sure also that, should the active feature fail during its operation,
passive systems remain available and would restart operation, so that no safety issue is
raised due to the “interaction” between passive and active systems.
In particular it can be noted how the RNS actually inhibits the operation of a passive safety
system, i. e. CMTs. If the RNS fails, CMTs should restart injecting even if plant conditions
have been modified by RNS, and, in particular, are different from those conditions in
which, normally, CMTs start operating. Hence it is essential to demonstrate that, should
the RNS fail, CMTs would restart draining, leading to ADS stage 4 actuation and
subsequent IRWST water injection.
Since in principle RNS could fail at any time instant, hence at several different plant
conditions, two bounding cases are considered:
CASE 1: early RNS failure, at 1600 s
CASE 2: late RNS failure, at 6000 s.
The rationale for selecting these two bounding cases is to minimize the driving force for
CMTs operation. As explained in section 1.1, if the cold legs are filled with water, CMTs
operate in a water recirculation mode driven by the differential density due to the hot
reactor coolant in the CMT balance line and the colder water within the CMT. If the cold
legs become voided, as they do during LOCAs, the CMTs will operate in a steam-
displacement (or compensated) injection drain-down mode. In this mode, the driving force
is based on gravity and the density difference between steam from the cold legs and water
in the CMTs (Westinghouse 2010).
Looking at the figures above it can be seen that for the early RNS failure (CASE 1), CMTs
have reached the minimum inventory during the transient and the pressure balance lines
are void. For the late RNS failure (CASE 2), CMTs, as well as the pressure balance lines,
have become full of water.
Normally (as occurs also in the here analyzed “base case” at the beginning of the transient)
when CMTs start recirculation (i. e. CMTs and the pressure balance lines are full of water)
the water temperature in the pressure balance lines is practically equal to the cold legs
normal operation temperature while CMTs water is at ambient temperature. In the CASE 2
here analyzed, CMTs and pressure balance lines have become full of water due to RNS
operation: this means that the pressure balance lines water temperature is surely lower than
Page 118
117
that of the cold legs during normal operation, i. e. the driving force to trigger CMTs
recirculation is lower.
Furthermore normally (as occurs also in the here analyzed “base case” at the beginning of
the transient) when CMTs start draining they are full of water while the pressure balance
lines have voided. In the CASE 1 here analyzed the pressure balance lines have voided but
the CMTs water level is lower, i. e. the driving force for CMTs draindown is lower.
Hence it has to be demonstrated that, should the RNS fail, the reduced driving forces for
CMTs operation do not affect adversely the course of the accident.
Figure 84 and Figure 85 show the RNS mass flow rate and CMT A inlet/outlet mass flow
rates for CASE 1 (early RNS failure). It can be seen that as soon as the RNS mass flow rate
stops, the CMTs injection restart. CMTs water level in turn decreases rapidly (Figure 86)
reaching the ADS stage IV actuation set-point, i. e. 20% of CMTs water volume. Then
ADS stage 4 starts discharging the primary coolant to the containment (Figure 87) and
when the RCS pressure becomes lower than the IRWST water head, the gravity driven
discharge from IRWST to RCS starts (Figure 88). Once the RCS is cooled by IRWST
injection the transient can be considered secured.
Figure 84: RNS injected mass flow rate for CASE 1 [% of max flow]
-2.00E+01
0.00E+00
2.00E+01
4.00E+01
6.00E+01
8.00E+01
1.00E+02
1.20E+02
1.00E+00 1.00E+01 1.00E+02 1.00E+03 1.00E+04 1.00E+05
ma
ss f
low
ra
te [
% o
f m
ax
flo
w]
time [s]
RNS mass flow rate
RNS mass flow rate [%]
Page 119
118
Figure 85: CMT A balance line inlet and CMT A discharged mass flow rate for CASE 1 [%
of max flow]
Figure 86: CMT A and CMT B water level for CASE 1 [% of tank volume]
-2.00E+01
0.00E+00
2.00E+01
4.00E+01
6.00E+01
8.00E+01
1.00E+02
1.20E+02
1.00E+00 1.00E+01 1.00E+02 1.00E+03 1.00E+04 1.00E+05
ma
ss flo
w r
ate
[%
of
ma
x f
low
]
time [s]
CMT A inlet and outlet mass flow rate
CMT inlet mass flow rate [% of max flow]
CMT outlet mass flow rate [% of max flow]
RNS failure
-2.00E+01
0.00E+00
2.00E+01
4.00E+01
6.00E+01
8.00E+01
1.00E+02
1.00E+00 1.00E+01 1.00E+02 1.00E+03 1.00E+04 1.00E+05
wa
ter l
ev
el [%
of
tan
k v
olu
me]
time [s]
CMTs water level
CMT A liquid level [%]
CMT B liquid level [%]
RNS failure
Page 120
119
Figure 87: ADS stage 4 mass flow rate for CASE 1 [% of max flow]
Figure 88: IRWST to RCS mass flow rate for CASE 1 [% of max flow]
Figure 89 and Figure 90 show the RNS mass flow rate and CMT A inlet/outlet mass flow
rates for CASE 2 (late RNS failure). It can be seen that, in this case, in which the CMTs
and pressure balance lines have been refilled by previous RNS operation, once RNS is
0.00E+00
2.00E+01
4.00E+01
6.00E+01
8.00E+01
1.00E+02
1.20E+02
0.00E+00 3.00E+03 6.00E+03 9.00E+03 1.20E+04 1.50E+04
ma
ss f
low
ra
te [
% o
f m
ax
flo
w]
time [s]
ADS stage 4 mass flow rate
ADS stage 4 mass flow rate [% of max flow]
0.00E+00
2.00E+01
4.00E+01
6.00E+01
8.00E+01
1.00E+02
1.20E+02
0.00E+00 3.00E+03 6.00E+03 9.00E+03 1.20E+04 1.50E+04
ma
ss f
low
ra
te [
% o
f m
ax
flo
w]
time [s]
IRWST to RCS mass flow rate
IRWST to RCS mass flow rate [% of max flow]
Page 121
120
stopped CMTs draining does not start immediately, as it was for CASE 1. This can be
more easily seen in Figure 91 in which the CMT A inlet and outlet mass flow rate in the
time frame [6000 s; 8000 s] is reported. It can be noted that, as soon as RNS is stopped,
CMTs start operating in water recirculation mode, with a strongly reduced mass flow rate
in comparison to that experienced at the beginning of the transient because of the reduced
driving force (see discussion above). Then an oscillating trend is present for few minutes
until the pressure balance lines stably void (Figure 92) and CMTs drain with a stable
increased mass flow rate (Figure 91). Once draindown is triggered CMTs water level
decreases again (Figure 93 and Figure 94) until ADS stage 4 actuation set-point is reached
and ADS stage 4 is actuated (Figure 95). When the RCS pressure becomes lower than the
IRWST water head the gravity driven discharge from IRWST to RCS start (Figure 96).
Once the RCS is cooled by IRWST injection the transient can be considered secured.
Figure 89: RNS injected mass flow rate for CASE 2 [% of max flow]
-2.00E+01
0.00E+00
2.00E+01
4.00E+01
6.00E+01
8.00E+01
1.00E+02
1.20E+02
1.00E+00 1.00E+01 1.00E+02 1.00E+03 1.00E+04 1.00E+05
ma
ss f
low
ra
te [
% o
f m
ax
flo
w]
time [s]
RNS mass flow rate
RNS mass flow rate [%]
Page 122
121
Figure 90: CMT A balance line inlet and CMT A discharged mass flow rate for CASE 2 [%
of max flow]
Figure 91: CMT A balance line inlet and CMT A discharged mass flow rate for CASE 2 [%
of max flow] (zoom 5500 s to 8000 s)
-4.00E+01
-2.00E+01
0.00E+00
2.00E+01
4.00E+01
6.00E+01
8.00E+01
1.00E+02
1.20E+02
1.00E+00 1.00E+01 1.00E+02 1.00E+03 1.00E+04 1.00E+05
ma
ss flo
w r
ate
[%
of
ma
x f
low
]
time [s]
CMT A inlet and outlet mass flow rate
CMT inlet mass flow rate [% of max flow]
CMT outlet mass flow rate [% of max flow]
RNS failure
-4.00E+01
-2.00E+01
0.00E+00
2.00E+01
4.00E+01
6.00E+01
8.00E+01
1.00E+02
1.20E+02
5.50E+03 6.00E+03 6.50E+03 7.00E+03 7.50E+03 8.00E+03
ma
ss flo
w r
ate
[%
of
ma
x f
low
]
time [s]
CMT A inlet and outlet mass flow rate
CMT inlet mass flow rate [% of max flow]
CMT outlet mass flow rate [% of max flow]
RNS failure
Page 123
122
Figure 92: liquid fraction in CMT A pressure balance line inlet and CMT A discharge for
CASE 2 [-] (zoom 5500 s to 8000 s)
Figure 93: CMT A and CMT B water level for CASE 2 [% of tank volume]
0.00E+00
2.00E-01
4.00E-01
6.00E-01
8.00E-01
1.00E+00
1.20E+00
5.50E+03 6.00E+03 6.50E+03 7.00E+03 7.50E+03 8.00E+03
liq
uid
fra
cti
on
[-]
time [s]
CMT A balance line and discharge line liquid fraction
CMT inlet liquid fraction [-]
CMT outlet liquid fraction [-]
RNS failure
-2.00E+01
0.00E+00
2.00E+01
4.00E+01
6.00E+01
8.00E+01
1.00E+02
1.00E+00 1.00E+01 1.00E+02 1.00E+03 1.00E+04 1.00E+05
wa
ter l
ev
el [%
of
tan
k v
olu
me]
time [s]
CMTs water level
CMT A liquid level [%]
CMT B liquid level [%]
RNS failure
Page 124
123
Figure 94: CMT A and CMT B water level for CASE 2 [% of tank volume] (zoom 5500 s to
8000 s)
Figure 95: ADS stage 4 mass flow rate for CASE 2 [% of max flow]
-2.00E+01
0.00E+00
2.00E+01
4.00E+01
6.00E+01
8.00E+01
1.00E+02
5.50E+03 6.00E+03 6.50E+03 7.00E+03 7.50E+03 8.00E+03
wa
ter l
ev
el [%
of
tan
k v
olu
me]
time [s]
CMTs water level
CMT A liquid level [%]
CMT B liquid level [%]RNS failure
0.00E+00
2.00E+01
4.00E+01
6.00E+01
8.00E+01
1.00E+02
1.20E+02
0.00E+00 3.00E+03 6.00E+03 9.00E+03 1.20E+04 1.50E+04
ma
ss f
low
ra
te [
% o
f m
ax
flo
w]
time [s]
ADS stage 4 mass flow rate
ADS stage 4 mass flow rate [% of max flow]
Page 125
124
Figure 96: IRWST to RCS mass flow rate for CASE 2 [% of max flow]
Results demonstrate that, for the selected accident, the availability of the RNS reduces the
direct impact on the containment. In fact RNS operation avoids ADS stage 4 actuation,
improving plant recovery after the accident. This is particularly important for this accident:
in fact the first three stages which open following an inadvertent ADS actuation signal
discharge RCS inventory in the IRWST with a very limited direct impact to the
containment. Avoiding stage 4 actuation (which would affect directly containment
atmosphere since stage 4 squib valves discharge directly in the containment loops
compartments) would keep limited the direct impact of this DBA for the containment
allowing a faster plant recovery and, hence, increasing plant availability.
It has also been demonstrated that failure of RNS during its operation is followed by a
restart of the operation of passive safety systems: in fact, upon failure of RNS, CMTs
draining recommences and ADS stage 4 actuates allowing IRWST water injection.
5.3. 1” SBLOCA: accident analysis
In this paragraph a detailed description of the transient following the occurrence of a 1”
break in the cold leg 2A CMT region is reported. The break occurs at 0 s with the plant
0.00E+00
2.00E+01
4.00E+01
6.00E+01
8.00E+01
1.00E+02
1.20E+02
0.00E+00 3.00E+03 6.00E+03 9.00E+03 1.20E+04 1.50E+04
ma
ss f
low
ra
te [
% o
f m
ax
flo
w]
time [s]
IRWST to RCS mass flow rate
IRWST to RCS mass flow rate [% of max flow]
Page 126
125
operating at nominal conditions. Operators are assumed to align RNS 1000 s13
after the
first safety injection (CMTs actuation in this case). RNS pumps can inject in the RCS when
pressure has become lower than 1.28 MPaa and temperature lower than 450 K. At that time
operators are also assumed to start a controlled cooldown of SGs secondary side using SGs
PORVs. The transient is terminated at 19500 s as the major plant parameters have
stabilized and the main phenomena have occurred.
The pressurizer level response is shown in Figure 97. As a result of the break flow,
pressurizer level rapidly decreases. PRZ low level causes CMTs actuation signal and, with
few seconds delay, CMTs discharge valves opening, reactor trip and PRHR initiation.
Reactor trip causes FW isolation and turbine trip. Pressurizer remains completely empty
until ADS control valves open depressurizing the RCS: the pressurizer level increases to
about 80% because of the void formation in the RCS, due to RCS depressurization by ADS
operation. Further the pressurizer level tends to decrease but the injection from the CMTs
and the accumulators maintains the level at about 50-60 %. When RCS conditions allow
RNS injection (see below), PRZ level newly increases: at about 14000 s the PRZ is full of
water.
Figure 97: PRZ water level [% of span]
13
Maximum time for RNS alignment is 15 minutes, i. e. 900 s, after the first safety injection.
-2.00E+01
0.00E+00
2.00E+01
4.00E+01
6.00E+01
8.00E+01
1.00E+02
1.20E+02
0 2000 4000 6000 8000 10000 12000 14000 16000 18000 20000
wate
r level
[%
of
span
]
time [s]
pressurizer water level
PRZ water level
Page 127
126
RCS and SG pressure response are shown in Figure 98. The RCS pressure decreases
rapidly, mainly because of the break and the reactor trip. Afterwards it stabilizes for some
time around SGs pressure, to start decreasing again because of the break and RCS
cooldown due to safety systems.
When ADS valves begin to open, RCS pressure rapidly decreases, while when RNS
injection starts (same time after ADS actuation), SGs PORVs are opened for a controlled
SGs secondary side cooldown: SGs pressure goes down.
Figure 98: PRZ steam dome and SGs steam dome pressure [Pa]
The hot leg and two of the cold legs temperatures (1A and 2A) are shown in Figure 99.
Prior to reactor trip and safety injection by CMTs and PRHR, the temperatures are
relatively constant in the two hot legs (about 594 K, i. e. about 610 °F) and four cold legs
(about 554 K, i. e. about 537 F): actually they slightly decrease because of the break.
After the reactor trip, the cold leg temperatures decrease due to the cooldown. The cold leg
temperature in loop 2 remains higher than the one in loop 1 of about 50-55 K. Decay heat
removal occurs primarily via natural circulation. The natural circulation stops because of
ADS operation, which is responsible for the sharp temperature decrease visible in Figure
99. After some tens of seconds following ADS actuation, RCS pressure becomes lower
0.00E+00
2.00E+06
4.00E+06
6.00E+06
8.00E+06
1.00E+07
1.20E+07
1.40E+07
1.60E+07
1.80E+07
0 2000 4000 6000 8000 10000 12000 14000 16000 18000 20000
press
ure [P
a]
time [s]
PRZ and SGs pressures
PRZ dome
SG-1 dome
SG-2 dome
Page 128
127
than 1.28 MPaa (Figure 98) and both loops TAVG lower than 450 K (Figure 100): RNS
injection starts (Figure 101).
Figure 99: hot and cold legs water temperature [K]
Figure 100: loop 1 and loop 2 TAVG [K]
0.00E+00
1.00E+02
2.00E+02
3.00E+02
4.00E+02
5.00E+02
6.00E+02
7.00E+02
0 2000 4000 6000 8000 10000 12000 14000 16000 18000 20000
tem
peratu
re [K
]
time [s]
HLs and CLs temperatures
HL-1
HL-2
CL-1A
CL-2A
0.00E+00
1.00E+02
2.00E+02
3.00E+02
4.00E+02
5.00E+02
6.00E+02
7.00E+02
0 2000 4000 6000 8000 10000 12000 14000 16000 18000 20000
tem
peratu
re [K
]
time [s]
loop 1 and loop2 average temperatures
loop 1
loop 2
Page 129
128
Figure 101: RNS injected mass flow rate [% of max flow]
The response of the core level is illustrated in Figure 102. Initially the core exit region is
subcooled as shown in Figure 103. Afterwards RCS subcooling goes to zero and some void
forms in the core upper portion (Figure 104): core level slightly decreases (Figure 102).
Core level is then recovered because of RNS injection. It has to be noted that the minimum
liquid fraction in the uppermost region of the core is about 60%: this does not cause any
problem for core cooling.
-2.00E+01
0.00E+00
2.00E+01
4.00E+01
6.00E+01
8.00E+01
1.00E+02
1.20E+02
0 2000 4000 6000 8000 10000 12000 14000 16000 18000 20000
mass
flo
w r
ate
[%
of
max f
low
]
time [s]
RNS mass flow rate
RNS flow
Page 130
129
Figure 102: core level [% of max level]
Figure 103: RCS subcooling [K]14
14
Evaluated as mean between hot leg 1 and hot leg 2 subcooling
8.60E+01
8.80E+01
9.00E+01
9.20E+01
9.40E+01
9.60E+01
9.80E+01
1.00E+02
1.02E+02
0 2000 4000 6000 8000 10000 12000 14000 16000 18000 20000
level
[%
of
max l
evel
]
time [s]
core level
core level
-2.00E+01
-1.50E+01
-1.00E+01
-5.00E+00
0.00E+00
5.00E+00
1.00E+01
1.50E+01
2.00E+01
2.50E+01
3.00E+01
0 2000 4000 6000 8000 10000 12000 14000 16000 18000 20000
sub
cooli
ng [K
]
time [s]
RCS subcooling
RCS subcooling
Page 131
130
Figure 104: liquid fraction in the upper portion of the core [-]
The hot legs flow is shown in Figure 105. In particular, looking also at Figure 106, it can
be noted that hot leg 1 mass flow rate is practically equal to PRHR mass flow rate until
PRHR is active, hence until ADS actuation occurs. Then hot leg 1 mass flow is equal to
ADS mass flow rate, which in turn, is practically equal to RNS injected mass flow rate:
RCS conditions stabilize with a mass flow rate injected by RNS and discharged by ADS
(PRZ full of water, see also above) and, only for a small part, by the break (see the
following).
0.00E+00
2.00E-01
4.00E-01
6.00E-01
8.00E-01
1.00E+00
1.20E+00
0 2000 4000 6000 8000 10000 12000 14000 16000 18000 20000
liq
uid
fgracti
on
[-
]
time [s]
upper core liquid fraction
114070000
114080000
114090000
114100000
114110000
Page 132
131
Figure 105: hot leg 1 and hot leg 2 mass flow rate [% of max flow]
Figure 106: hot leg 1, PRHR inlet, ADS train A inlet and RNS injected mass flow rate [% of
max flow]
The break, CVS, ADS train A and RNS injected mass flow rate are shown in Figure 107.
Between CVS actuation (on PRZ low-1 level, reached because of the break) and CVS
-3.00E+01
-2.00E+01
-1.00E+01
0.00E+00
1.00E+01
2.00E+01
3.00E+01
0 2000 4000 6000 8000 10000 12000 14000 16000 18000 20000
mass
flo
w r
ate
[%
of
max f
low
]
time [s]
HLs mass flow rates
HL-1
HL-2
-2.00E+01
-1.50E+01
-1.00E+01
-5.00E+00
0.00E+00
5.00E+00
1.00E+01
1.50E+01
2.00E+01
2.50E+01
3.00E+01
0 2000 4000 6000 8000 10000 12000 14000 16000 18000 20000
mass
flo
w r
ate
[%
of
max f
low
]
time [s]
HL-1, PRHR, ADS train A and RNS mass flow rates
HL-1
PRHR
ADS train A
RNS
Page 133
132
isolation (on PRZ high-1 water level, reached because of ADS operation and induced void
formation in RCS), the CVS operates at its nominal capacity. The flow rate exiting the
break is significantly bigger than that injected by means of the CVS, which cannot sustain
reactor pressure and PRZ level: this causes reactor trip and safety systems actuation. When
ADS is actuated, primary coolant swelling causes CVS isolation and also the break flow
becomes significantly lower. When RNS starts injecting only a small portion of the
injected flow is discharged by the break: hence practically all the water injected by RNS is
discharged by ADS.
Figure 107: break, CVS, ADS train A and RNS injected mass flow rate [% of max flow]
In Figure 108 the accumulators flow rates are shown. It can be noted that the accumulators
begin to operate at about 5000 s when the pressure conditions promote the injection, but
only at about 12200 s, because of ADS operation, the high depressurization allows a
consistent mass flow rate from the accumulators. At about 12900 s the accumulators are
empty.
-2.00E+01
0.00E+00
2.00E+01
4.00E+01
6.00E+01
8.00E+01
1.00E+02
0 2000 4000 6000 8000 10000 12000 14000 16000 18000 20000
mass
flo
w r
ate
[%
of
max f
low
]
time [s]
break, CVS, ADS train A and RNS mass flow rates
break
CVS
ADS train A
RNS
Page 134
133
Figure 108: ACC 1 and ACC 2 discharged mass flow rate [% of max flow]
Figure 109 shows the CMT A inlet and outlet mass flow rates (for CMT B the trends are
similar). Initially CMTs operate in water recirculation mode until when some void starts to
be present at pressure balance line inlet. The CMTs inlet and outlet mass flow rates present
an oscillating trend from about 8200 s to about 12200 s when, because of ADS actuation
and consequent void formation in RCS, the pressure balance lines are fed by steam and
CMTs drain.
Figure 110 shows the CMTs water level. CMTs remain full of water up to about 10000 s.
Then CMT B starts to drain slowly, reaching 67.5 % of tank volume (i. e. low-1 level). The
asymmetric behavior of the two CMTs id due to the break size and location15
. As explained
also for the CMTs hot recirculation test, once the mass flow rate coming from SG-2
practically zeros, the CMTs are fed mainly by the water coming from the RPV upper
downcomer (reverse flow from cold legs). For the affected (by the break) cold leg, the
RPV, in addition to the water “required” by the corresponding pressure balance line,
supplies also the water “required” by break. In fact, for a so small break, the RPV can be
considered as a reservoir which supplies water to the different “users”, CMTs pressure
balance lines and break in particular. The point is that the RPV the water temperature is
decreasing because of the safety system operation and the break depressurization and
15
It is recalled that the break is supposed in the cold leg 2A (CMT region). CMT A is connected to cold leg
2A, while CMT B is connected to the intact cold leg 2B.
-2.00E+01
0.00E+00
2.00E+01
4.00E+01
6.00E+01
8.00E+01
1.00E+02
1.20E+02
0 2000 4000 6000 8000 10000 12000 14000 16000 18000 20000
mass
flo
w r
ate
[%
of
max f
low
]
time [s]
ACCs mass flow rate
ACC 1
ACC 2
Page 135
134
cooling effect. Hence in the affected cold leg (cold leg 2A), which “requires” more mass
flow rate in comparison to the intact one (because of the break), the temperature is slightly
lower than the temperature in the intact one (cold leg 2B). Hence it is in the intact cold leg
that some steam starts to be present, which, feeding the corresponding pressure balance
line, trigger the draindown of CMT B. This leads to the ADS actuation signal and, in turn,
to the ADS stage 1 control valves opening, followed by stage 2 and stage 3 control valves
after short time delays.
Figure 111 shows the mass flow rate discharged by ADS train A control valves (the same
applies for train B). ADS depressurization enhances CMTs draining: CMTs start to void
very rapidly (see the change of water level derivative for CMT B once ADS actuates in
Figure 110).
Because of ADS depressurization and cooling effect, RCS pressure and temperature
decrease rapidly reaching soon the values allowing RNS pumps to inject water into RCS
from cask loading pit (Figure 101). RNS water injection, because of the pressure drops
from RNS-DVI tee to DVI injection point to vessel, creates enough friction so that CMTs
check valves close, CMTs draining stops and level in CMTs stabilizes. CMT A level
reaches about 33% of tank volume at the end of the transient, while CMT B level stops at
about 25%. Hence ADS stage 4 is not actuated and the plant is stably cooled by the RNS.
Figure 109: CMT A balance line and CMT A discharged mass flow rate [% of max flow]
-2.00E+01
0.00E+00
2.00E+01
4.00E+01
6.00E+01
8.00E+01
1.00E+02
0 2000 4000 6000 8000 10000 12000 14000 16000 18000 20000
mass
flo
w r
ate
[%
of
max f
low
]
time [s]
CMT A inlet and outlet mass flow rates
inlet
outlet
Page 136
135
Figure 110: CMT A and CMT B water volume [% of tank volume]
Figure 111: ADS train A stage 1, stage 2 and stage 3 mass flow rate [% of max flow]
0.00E+00
2.00E+01
4.00E+01
6.00E+01
8.00E+01
1.00E+02
1.20E+02
0 2000 4000 6000 8000 10000 12000 14000 16000 18000 20000
wate
r level
[%
of
tan
k v
olu
me]
time [s]
CMTs water level
CMT A CMT B
-2.00E+01
0.00E+00
2.00E+01
4.00E+01
6.00E+01
8.00E+01
1.00E+02
1.20E+02
10000 12000 14000 16000 18000 20000
mass
flo
w r
ate
[%
of
max f
low
]
time [s]
ADS train A mass flow rate
stage 1
stage 2
stage 3
Page 137
136
Also for this accident as done in section 5.2 for the ADS inadvertent actuation, it is
essential to demonstrate that, should the RNS fail, the CMTs would restart operation
without any problem (see the discussion in section 5.2).
In the present case, upon failure of RNS, CMTs should recommence draining from a level
lower than that at which normally they start draining (as occurred soon after ADS stages
1,2,3 actuation in the “base case” here analyzed), i. e. with a lower driving force.
Hence a failure of the RNS has been assumed at 17100 s, some time after its operation
started.
Figure 112 and Figure 113 show the RNS mass flow rate and CMT A inlet/outlet mass
flow rates. It can be seen that as soon as the RNS mass flow rate stops, the CMTs injection
restart (see also Figure 114). CMTs water level in turn decreases rapidly (Figure 115)
reaching the ADS stage IV actuation set-point. Then ADS stage 4 starts discharging the
primary coolant to the containment (Figure 116) and when the RCS pressure becomes
lower than the IRWST water head, the gravity driven discharge from IRWST to RCS starts
(Figure 117). Once the RCS is cooled by IRWST injection the transient can be considered
secured.
Figure 112: RNS mass flow rate [% of max flow], with RNS failure at 17100 s
-2.00E+01
0.00E+00
2.00E+01
4.00E+01
6.00E+01
8.00E+01
1.00E+02
1.20E+02
8000 10000 12000 14000 16000 18000 20000
ma
ss f
low
ra
te [
% o
f m
ax
flo
w]
time [s]
RNS mass flow rate
RNS mass flow rate [%]
Page 138
137
Figure 113: CMT A balance line and CMT A discharged mass flow rate [% of max flow],
with RNS failure at 17100 s
Figure 114: CMT A balance line and CMT A discharged mass flow rate [% of max flow],
with RNS failure at 17100 s (zoom 1700 s to 19000 s)
-4.00E+01
-2.00E+01
0.00E+00
2.00E+01
4.00E+01
6.00E+01
8.00E+01
1.00E+02
1.20E+02
8000 10000 12000 14000 16000 18000 20000
ma
ss flo
w r
ate
[%
of
ma
x f
low
]
time [s]
CMT A inlet and outlet mass flow rate
CMT inlet mass flow rate [% of max flow]
CMT outlet mass flow rate [% of max flow]
RNS failure
-2.00E+01
0.00E+00
2.00E+01
4.00E+01
6.00E+01
8.00E+01
1.00E+02
17000 17200 17400 17600 17800 18000 18200 18400 18600 18800 19000
ma
ss flo
w r
ate
[%
of
ma
x f
low
]
time [s]
CMT A inlet and outlet mass flow rate
CMT inlet mass flow rate [% of max flow]
CMT outlet mass flow rate [% of max flow]
RNS failure
Page 139
138
Figure 115: CMT A and CMT B water volume [% of tank volume], with RNS failure at
17100 s
Figure 116: ADS stage 4 mass flow rate [% of max flow], with RNS failure at 17100 s
-2.00E+01
0.00E+00
2.00E+01
4.00E+01
6.00E+01
8.00E+01
1.00E+02
1.20E+02
6000 8000 10000 12000 14000 16000 18000 20000
wa
ter l
ev
el [%
of
tan
k v
olu
me]
time [s]
CMTs water level
CMT A liquid level [%]
CMT B liquid level [%]
RNS failure
0.00E+00
2.00E+01
4.00E+01
6.00E+01
8.00E+01
1.00E+02
1.20E+02
8000 10000 12000 14000 16000 18000 20000
ma
ss f
low
ra
te [
% o
f m
ax
flo
w]
time [s]
ADS stage 4 mass flow rate
ADS stage 4 mass flow rate [% of max flow]
Page 140
139
Figure 117: IRWST to RCS mass flow rate [% of max flow], with RNS failure at 17100 s
Results have demonstrated that, for a 1” SBLOCA, RNS can secure the accident without
the requirement on ADS stage 4 and IRWST water injection. Furthermore the use of the
RNS, a non safety related system, to this scope does not affect the nuclear safety of the
plant. In fact should the RNS become unavailable during the accident, CMTs draining
would restart reaching 20% of the tank volume, thus activating ADS stage 4. Then RCS
pressure would be very rapidly reduced and IRWST water would become available for
injection.
0.00E+00
2.00E+01
4.00E+01
6.00E+01
8.00E+01
1.00E+02
1.20E+02
8.00E+03 1.00E+04 1.20E+04 1.40E+04 1.60E+04 1.80E+04 2.00E+04
ma
ss f
low
ra
te [
% o
f m
ax
flo
w]
time [s]
IRWST to RCS mass flow rate
IRWST to RCS mass flow rate [% of max flow]
Page 141
140
6. Conclusions and perspectives
The very first milestone of the present work has been the development of a fully detailed
Relap5 AP1000 model, which can be used to simulate a variety of steady state and
transient conditions. The developed AP1000 input model has been extensively used in this
work, which can be thought as divided in two main parts.
The first part regards the simulation of three pre-operational tests, namely:
1) Core Make-up Tanks hot recirculation test
2) Core Make-up Tanks draindown test
3) Automatic Depressurization System test
which will be performed on the first three built AP1000 nuclear power plants. The AP1000
licensing process, in fact, requires that proper operation of passive systems is demonstrated
by means of dedicated pre-operational tests, to be performed on the first three built plants
to obtain the Combined Construction and Operating License (COL). The present work
covers one of the steps for AP1000 COL, since tests procedures have been developed and
pre-tests calculations have been performed for the selected tests. The simulations results
confirm that the selected boundary and initial conditions, as well as tests procedures, are
suitable for a successful performance of the tests.
In particular the CMTs ability to operate in single phase natural circulation to provide
immediate coolant make up and boration following Non-LOCA and LOCA events is well
visible in the CMTs hot recirculation test simulation. Furthermore the CMTs transition
from hot recirculation mode of operation to draindown mode of operation, and subsequent
CMTs draining, has been demonstrated in the CMTs draindown test simulation. Finally the
main phenomena expected for the ADS operation are captured in the ADS test.
Even if the selected tests concern the AP1000 and its licensing process, the framework is
absolutely more general and easily extendable to future, generation IV, nuclear plants. In
fact passive safety systems employment is a characteristic which will be increasing in the
future nuclear generation and a licensing process for future (Generation IV) nuclear power
plants could be preliminarily envisaged: in such a process, no power operation should be
allowed if, at least on the first built plant, proper operation of the first of a kind systems has
been demonstrated by means of dedicated pre-operational tests, with no compromise on the
scaling issue but looking at the real and whole plant response/behavior. Hence it will be
Page 142
141
essential, as done in this work for the AP1000, to develop tests procedures which on one
side allow for a clear demonstration of the effectiveness of the selected feature, but, on the
other, do not unduly stress the plant. To this scope, pre-tests (and post-tests) calculations
will be fundamental, as it was shown here for the AP1000.
The second part of this thesis has been focused on the simulation of two AP1000 Design
Basis Accidents, namely
1. 1” SBLOCA
2. Inadvertent Automatic Depressurization System Actuation.
The selected accidents were already analyzed in the AP1000 Design Certification
Document, postulating, as for all AP1000 Design Basis Accidents, the failure of all the
active systems and coping against the accidents relying only on passive features. In this
thesis instead, the availability of an active system, the Normal Residual Heat Removal
System (RNS) has been considered in order to evaluate its impact on the transients
progression, and in particular the capability to mitigate it. It has been demonstrated that the
availability of the RNS can secure the selected accidents without ADS stage 4 opening and
subsequent IRWST water injection. In fact, for the selected accidents, RNS can be aligned
before the CMTs level reaches the ADS stage 4 activation set-point and once aligned the
generated friction pressure drops are high enough to stop CMTs draining. This is particular
important since avoiding actuation of ADS stage 4, which discharges directly into the
containment loops compartments (differently from the first three ADS stages which
discharge in the IRWST), limits the direct impact of the selected accidents to the
containment, allowing a faster plant recovery. Furthermore the use of the RNS constitutes
an additional and independent line of defense, which, as demonstrated, does not adversely
impact on the “normal” passive management of DBAs in the AP1000 design. In fact,
should the RNS fail during its operation, CMTs draining would restart, ADS 4th
stage
would open and IRWST water would be passively (by gravity) injected terminating the
transient.
Also here, even if the calculations have been performed for the AP1000, the framework is
absolutely general and easily extendable to the generation III+ and generation IV nuclear
plants which will use extensively passive safety systems.
In fact we should distinguish the licensing strategy of a plant from the practical accident
management. The nuclear safety authority, in fact, dictates that some dedicated safety
Page 143
142
systems, be them active or passive, to be employed in order to protect the plant against
selected design basis accidents. Even if a certain mix between passive and active features
always existed (e. g. the gravity driven control rods for reactor shutdown and the
accumulators for emergency injection from one side, and the High Pressure Injection
System and the Low Pressure Injection System from the other), the first nuclear power
plants generations (I, II and III) have relied mostly on active safety features for emergency
core and containment cooling. Most of the generation III+ and IV systems, instead, rely on
passive safety features to accomplish emergency core and containment cooling. What is
important to note is that, in the licensing process of the plant, the safety authority requires
the licensee to demonstrate the safety of the plant relying only on those features clearly
identified as “safety related” and which have been designed specifically for that purpose.
All the other systems, even if they could be available following an accident, are assumed to
fail and do not give any contribution to the accident resolution. For the AP1000 this means
that Westinghouse has demonstrated the safety of the plant assuming the failure of all the
active systems, relying only on the passive ones, which are the only systems specifically
designed as safety related. All this, as said, in the licensing process of the plant.
When coming to the practical accident management procedures design, any conceptual
dichotomy between active and passive systems should always be avoided and any possible
interaction between active and passive systems and between safety related and not safety
related systems should always be considered in order to evaluate the corresponding effects.
In fact a suitable mix between active and passive systems can lead to a better outcome of
the accident, as it was for the cases analyzed in this work for the AP1000 in which some
passive features (CMTs and ADS first three stages) “control” the plant until an active
system (the RNS) can be aligned and provide a better plant response in comparison to what
would happen postulating a completely passive transient management.
Anyway it should be highly stressed that in principle the interaction between active and
passive features could lead also to adverse effects. In fact, also looking to the analyzed
cases, the RNS, an active not safety related system, actually stops a passive safety related
system operation (CMTs draining). What is important is to make sure that should the
active feature become un-available, the possibly affected passive systems would
recommence operation without any problem. This is the case for the selected transients but,
Page 144
143
in principle, any possible adverse effect of interaction between active and passive safety
features should be taken into account to avoid and excluding it.
Concluding, in a scenario in which, most likely, the use of passive safety features for future
nuclear systems will increase, any possible interaction of these features with the active
ones should always be analyzed in order to evaluate any possible positive or adverse effect.
Even if not at a licensing level, this should be performed at least at the accident
management procedures design level, exploring all the possibilities for a full exploitation
of the defense-in-depth principle.
Page 145
144
7. References
A. Alemberti, C. Frepoli, G. Graziosi, “Comparison of the SPES-2 pre-test predictions and
AP600 plant calculations using Relap5/Mod3”, Intern. Conference - New Trends in
Nuclear System Thermohydraulics, Pisa, May 30th
- June 2nd
, 1994.
A. Alemberti, C. Frepoli, G. Graziosi, “SPES-2 cold break experiments: scaling approach
for decay power, heat loss compensation and metal heat release”, Intern. Conference - New
Trends in Nuclear System Termohydraulics, Pisa, May 30th
- June 2nd
, 1994.
A. Alemberti, C. Frepoli, G. Graziosi, “SPES-2 Relap5/Mod3 noding and 1” cold leg break
tests S00401”, NRC 22nd
Water Reactor Safety information Meeting, Washington D.C.,
October 1994.
A. Alemberti, C. Frepoli, G. Graziosi, “Relap5/Mod3 pre-test predictions for the SPES-2
break tests S01613”, Technical Committee Meeting on Progress in Design, R&D and
Testing of Safety Systems for Advanced Water Cooled Reactors, IAEA Conference,
Piacenza - Italy, May 1995.
M. Bacchiani, C. Medich, M. Rigamonti, O. Vescovi, A. Alemberti, L. E. Conway, “SPES-
2, AP600 integral system test S00706 -DEG break of DVI line”, ICONE-3, Kioto – Japan,
23/27 April 1995, Serial Number 141.
M. Bacchiani, C. Medich, M. Rigamonti, O. Vescovi, A. Alemberti, L. E. Conway, “SPES-
2, AP600 integral system test S01007 2” CL to Core Make-up Tank pressure balance line
break”, NURETH-7, Saratoga Spring - New York, September 10/15 1995.
N. Bonhomme, 1999, “Systems organization for the European pressurized water reactor
(EPR)”, Nuclear Engineering and Design 187, 71-78.
Generation IV International Forum Website.
Page 146
145
Information Systems Laboratories Inc., 2002. RELAP5/MOD3.3 code manual.
Y. Kukita, T. Yonomoto, H. Asaka, H. Nakamura, H. Kumamaru, Y. Anoda,
“ROSA/APGOO Testing: Facility Modifications and Initial Test Results”, Journal of
Nuclear Science and Technology 3, 259-265.
Schulz T. L., 2006, “Westinghouse AP1000 advanced passive plant”, Nuclear Engineering
and Design 236, 1547-1557.
Sheng Zhou, Xiliang Zhang, 2010, “Nuclear energy development in China: A study of
opportunities and challenges”, Energy 35, 4282–4288.
Tower S.N., Schulz T.L., Vijuk R.P., 1988, “Passive and simplified system features for the
advanced Westinghouse 600 MWe PWR”, Nuclear Engineering and Design 109, 147-154.
United States Atomic Energy Commission, “Atomic Energy Act”, first version and
following amendments.
United States Nuclear Regulatory Commission, “NUREG-800”, first version and following
amendments.
United States Nuclear Regulatory Commission, “NUREG-1512”.
United States Nuclear Regulatory Commission, “NUREG-1793”.
United States Nuclear Regulatory Commission website.
United States Nuclear Regulatory Commission, “10 CFR part 52”, first version and
following amendments.
United States Nuclear Regulatory Commission, “10 CFR part 100”, first version and
following amendments.
Page 147
146
United States Nuclear Regulatory Commission, “10 CFR part 50”, first version and
following amendments.
United States Government, “Environmental Policy Act”, first version and following
amendments.
Westinghouse Electric Company, 2002, “AP1000 Design Control Document”, Revision 0.
Westinghouse Electric Company, 2010, “AP1000 Design Control Document”, Revision
17.


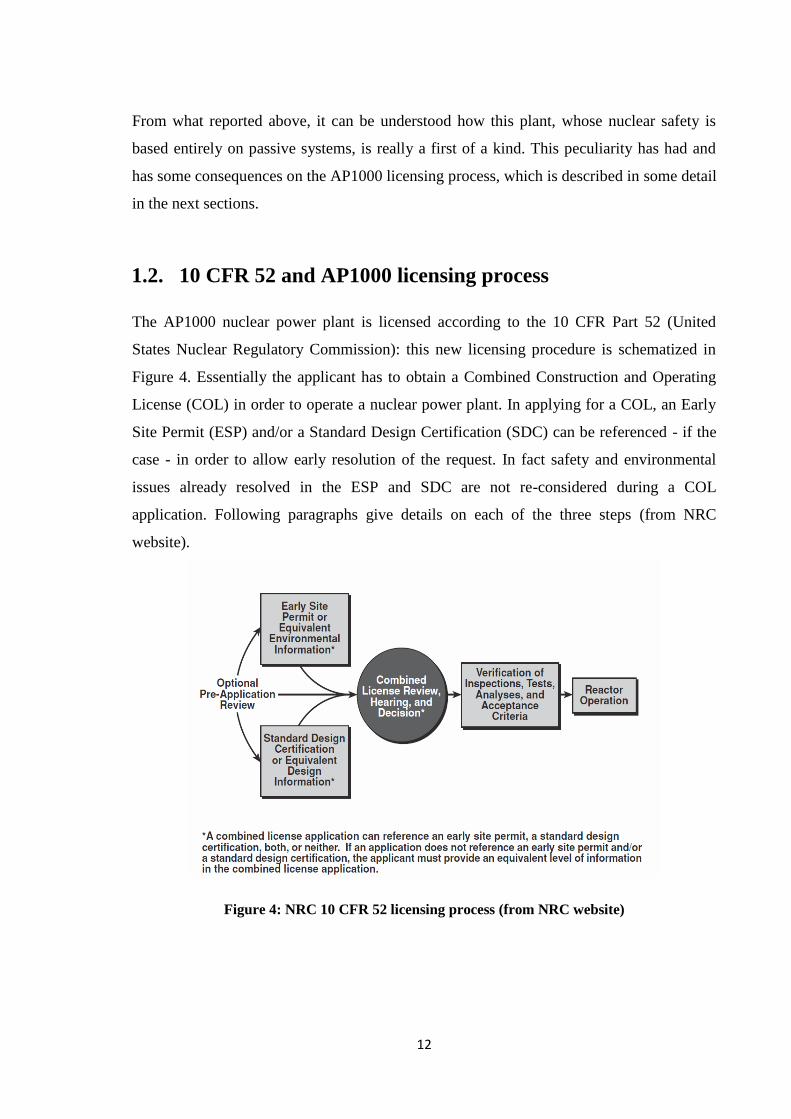


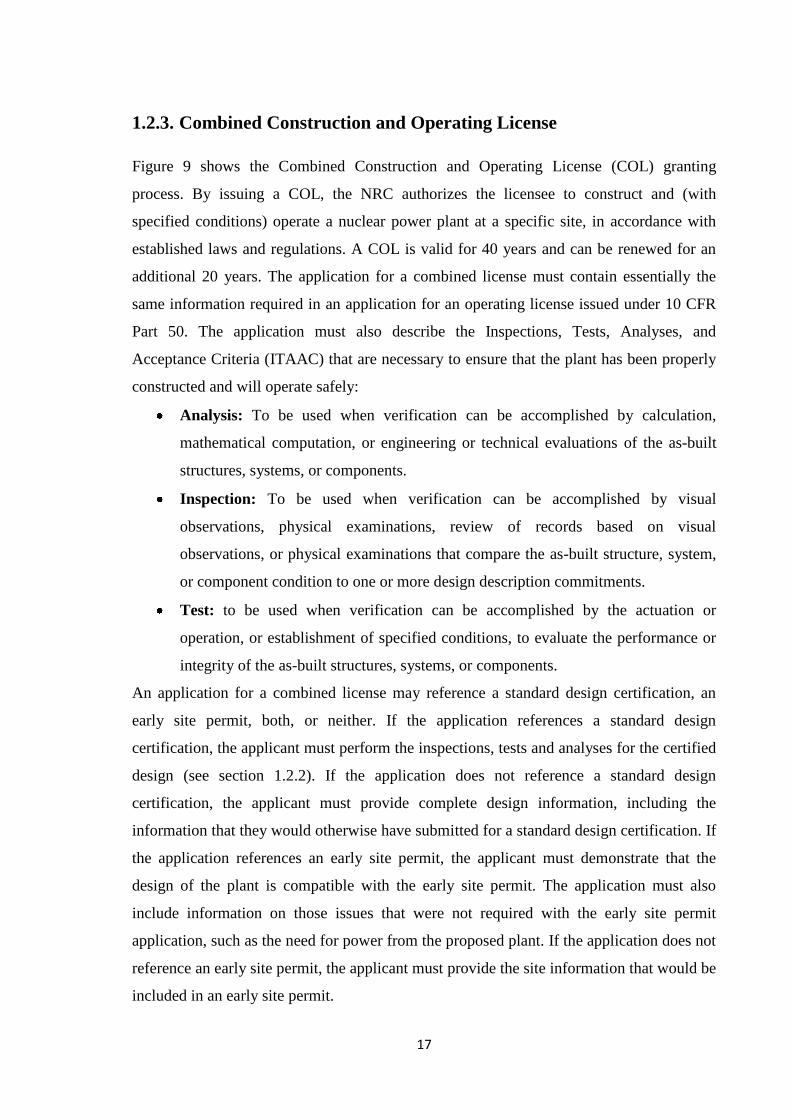

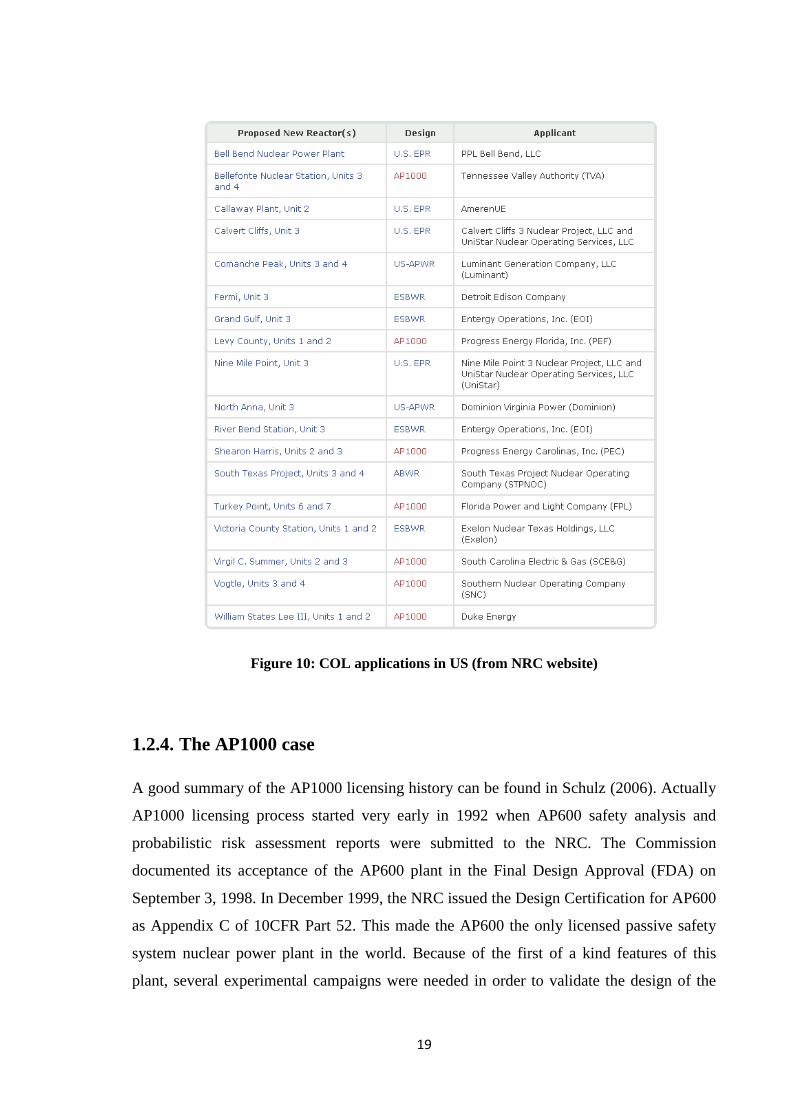


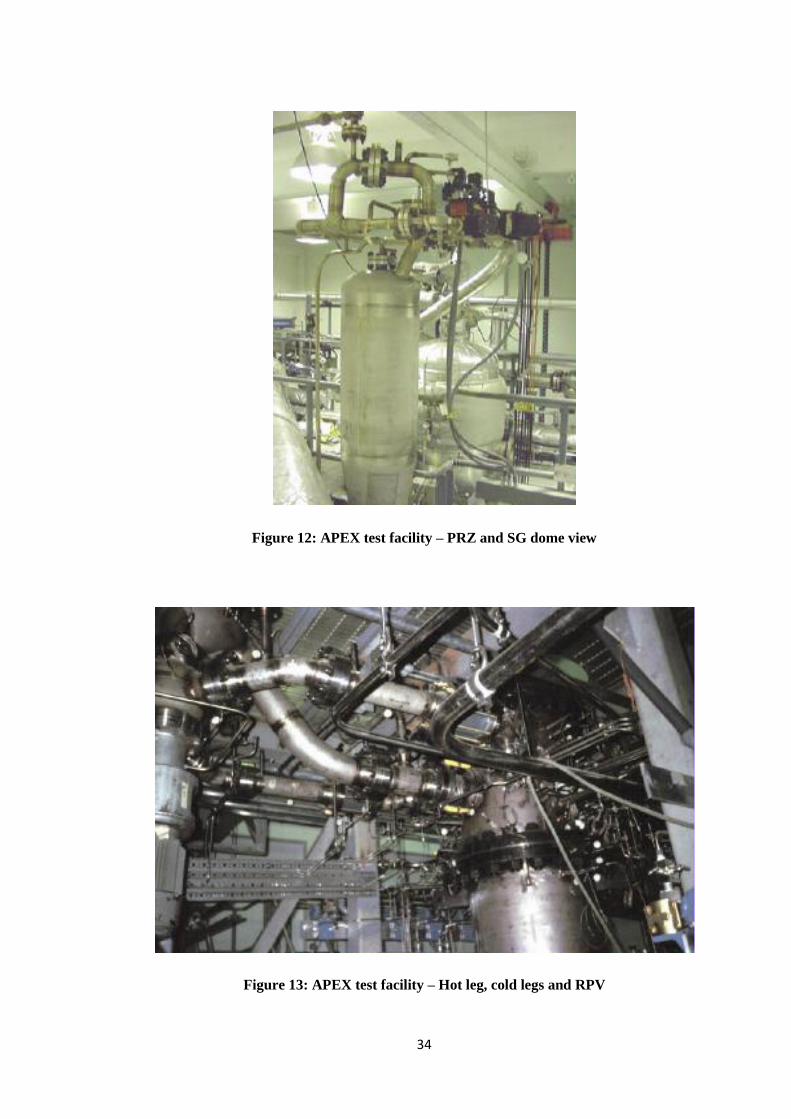
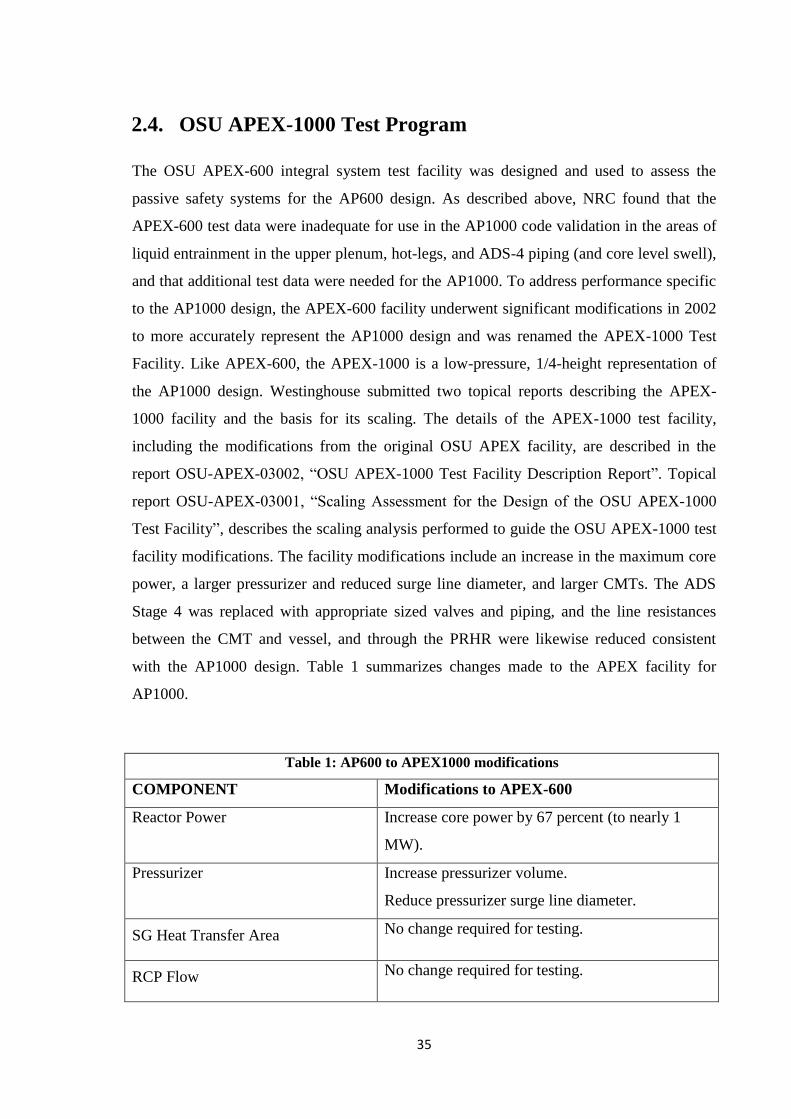


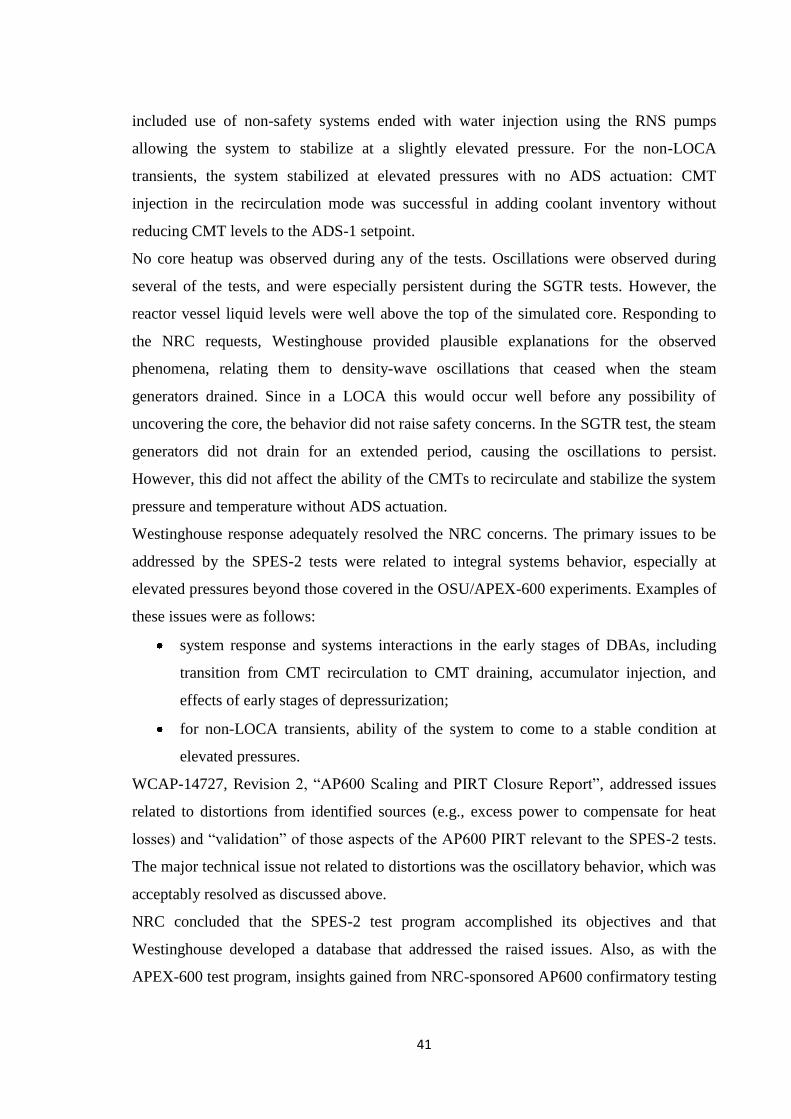
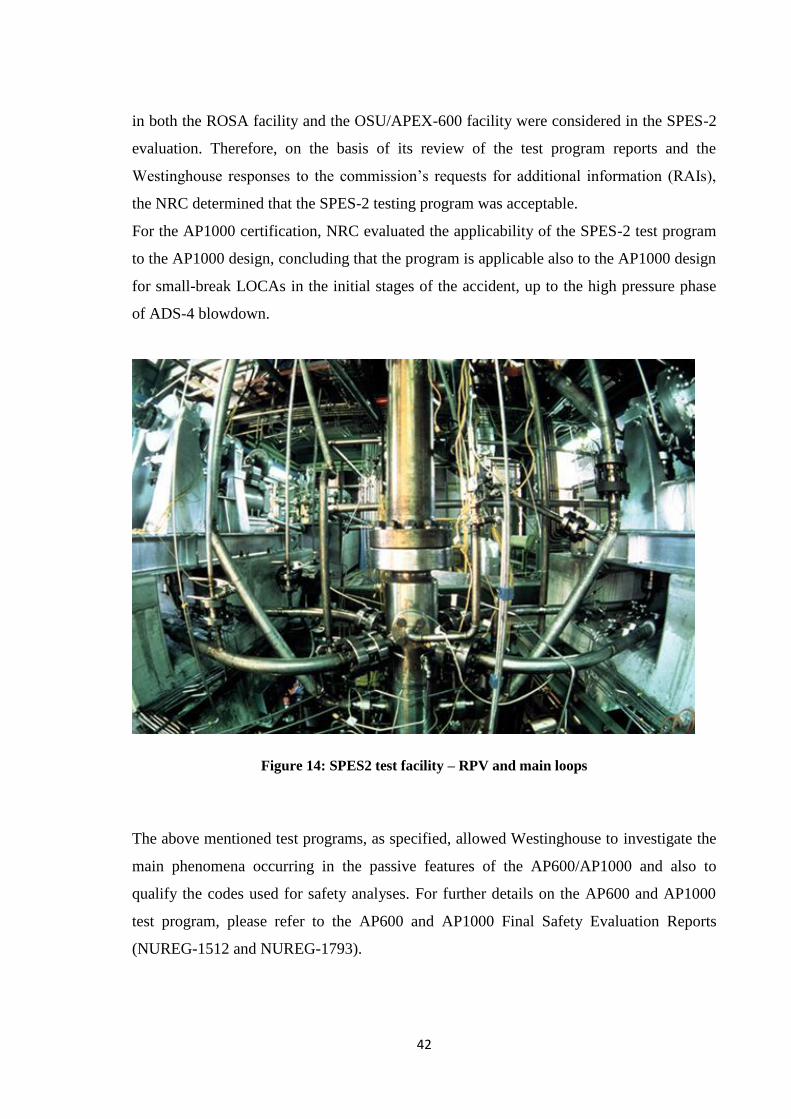


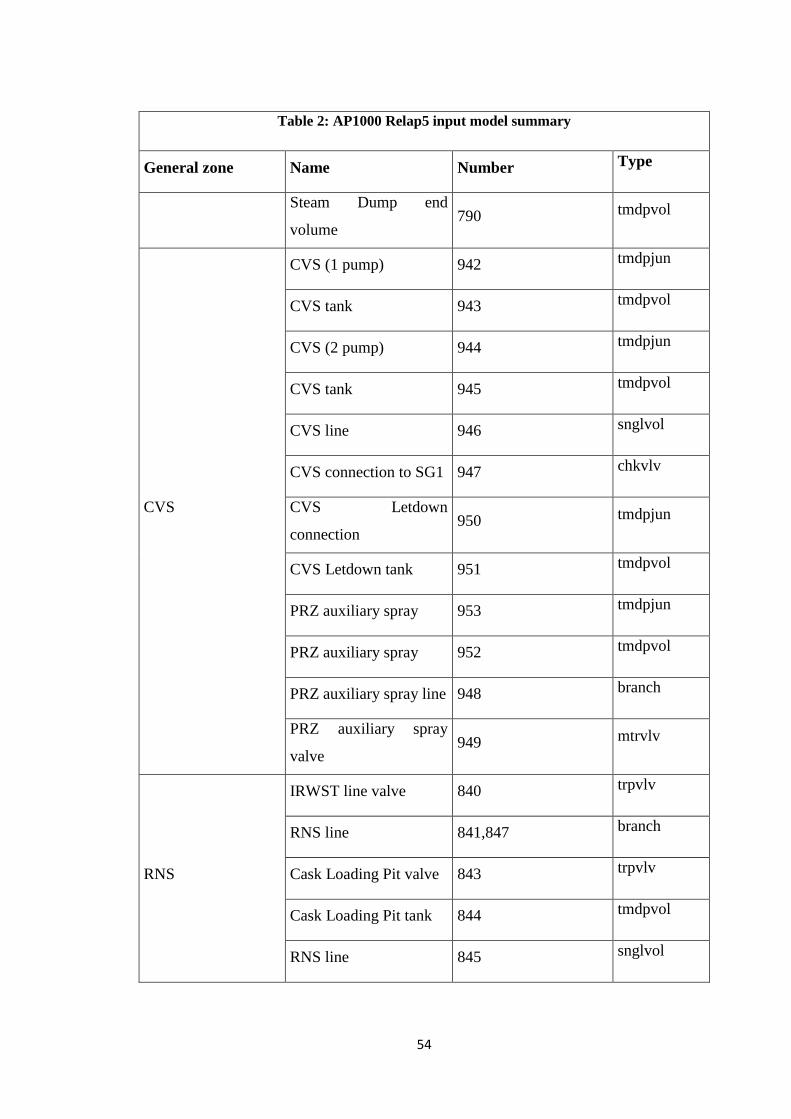


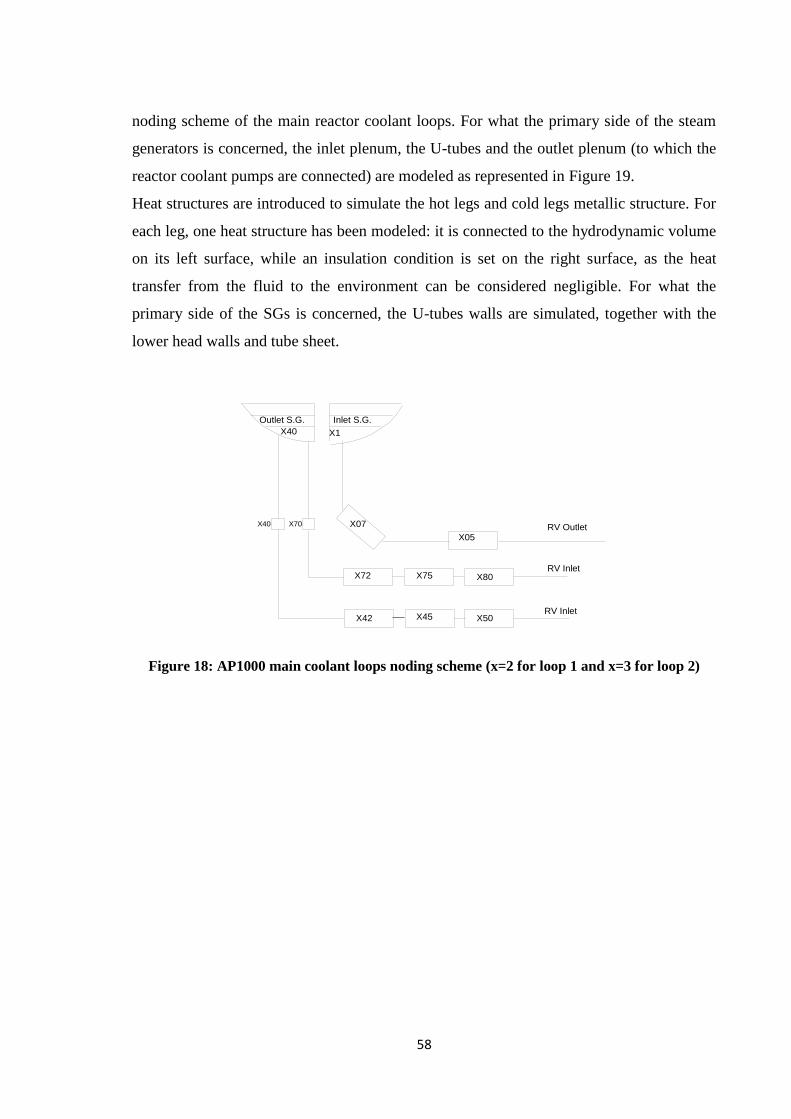
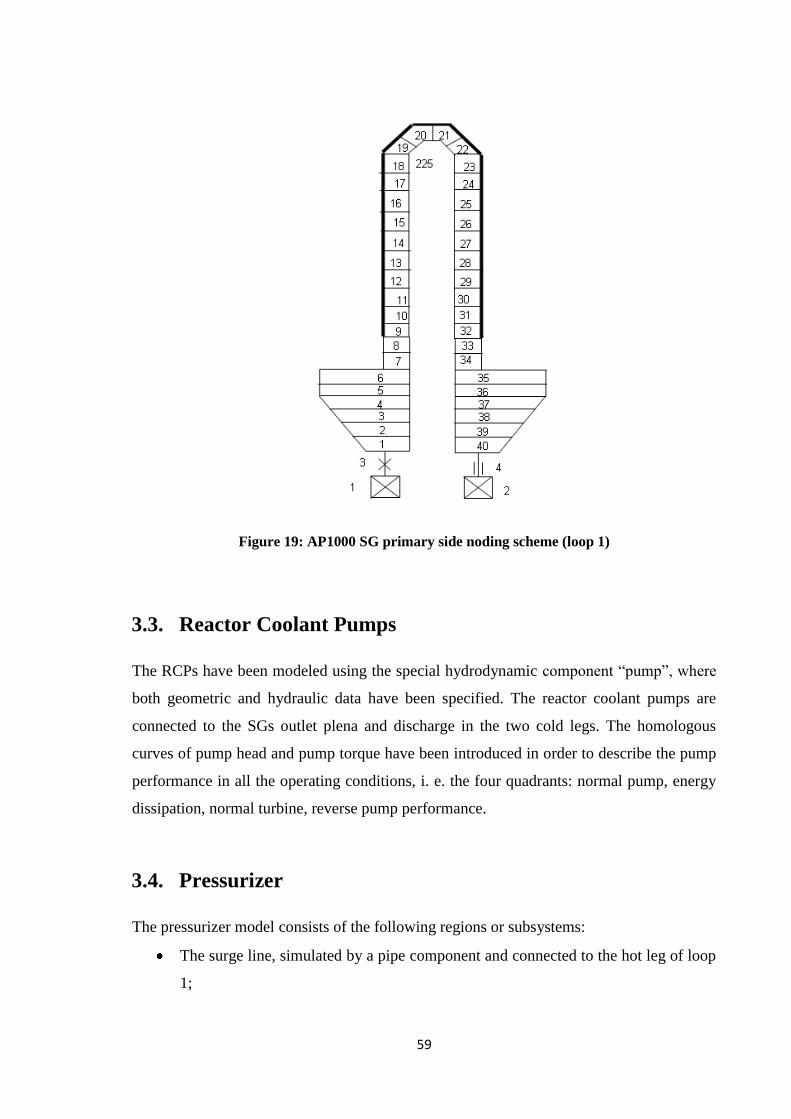

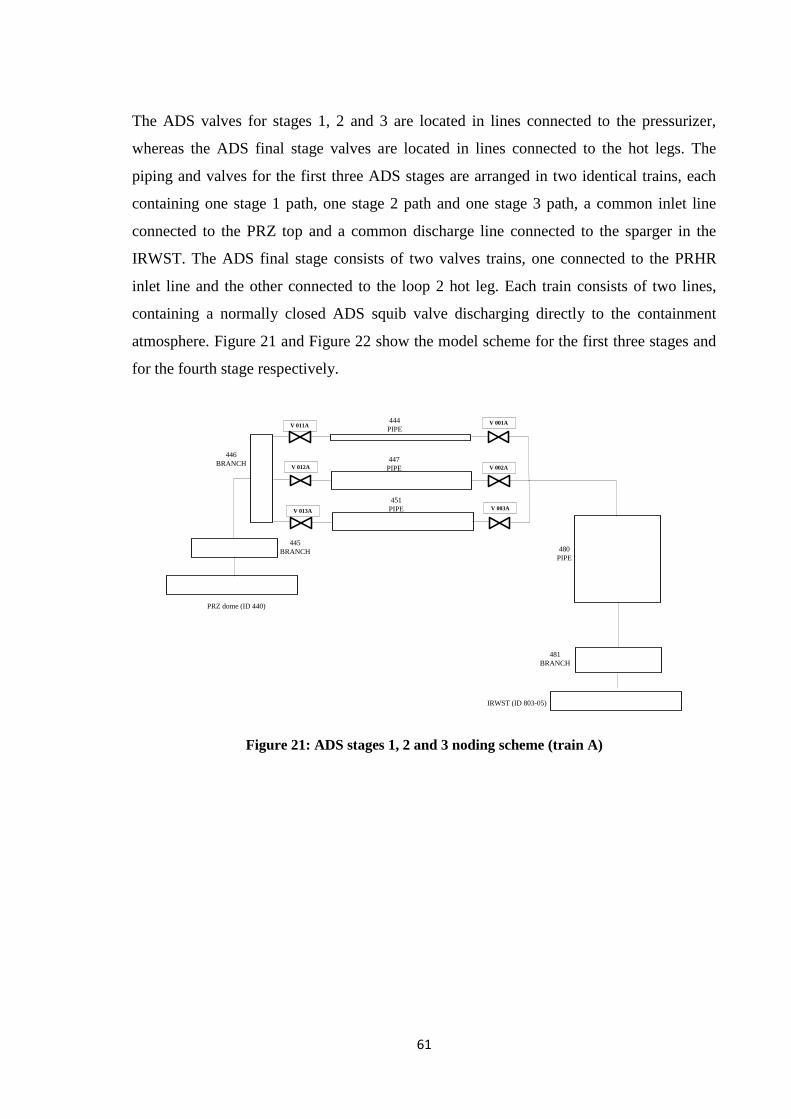


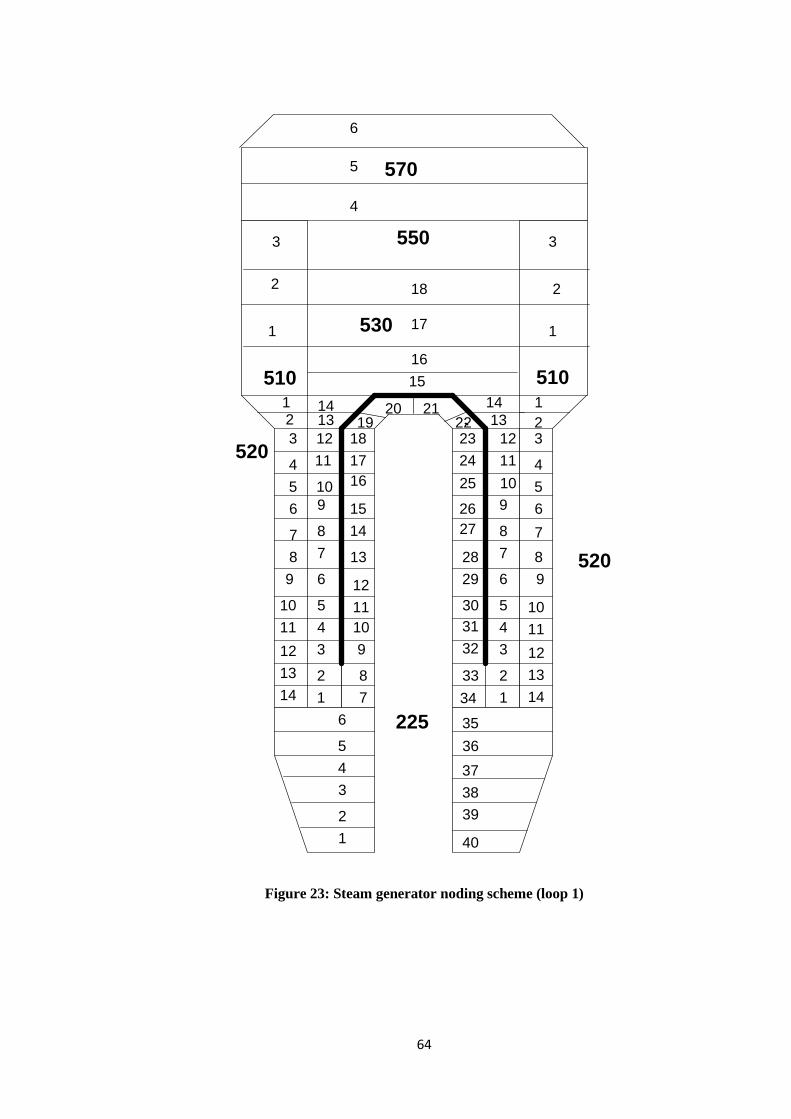
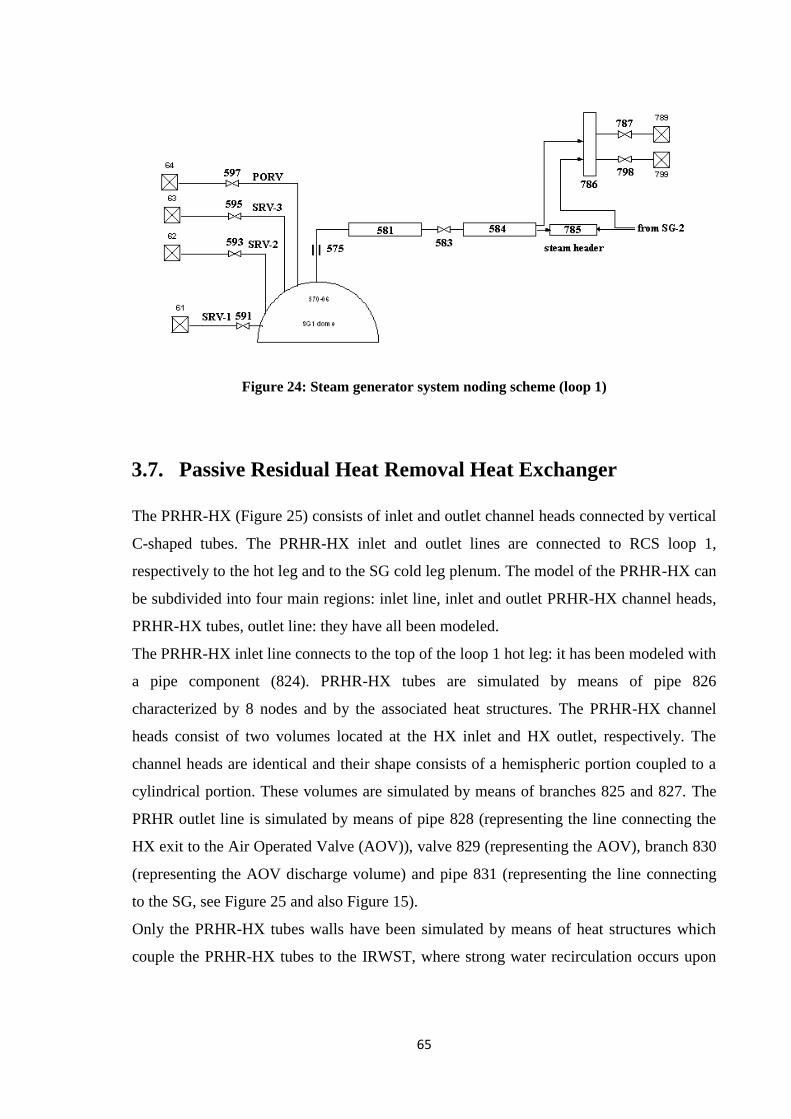


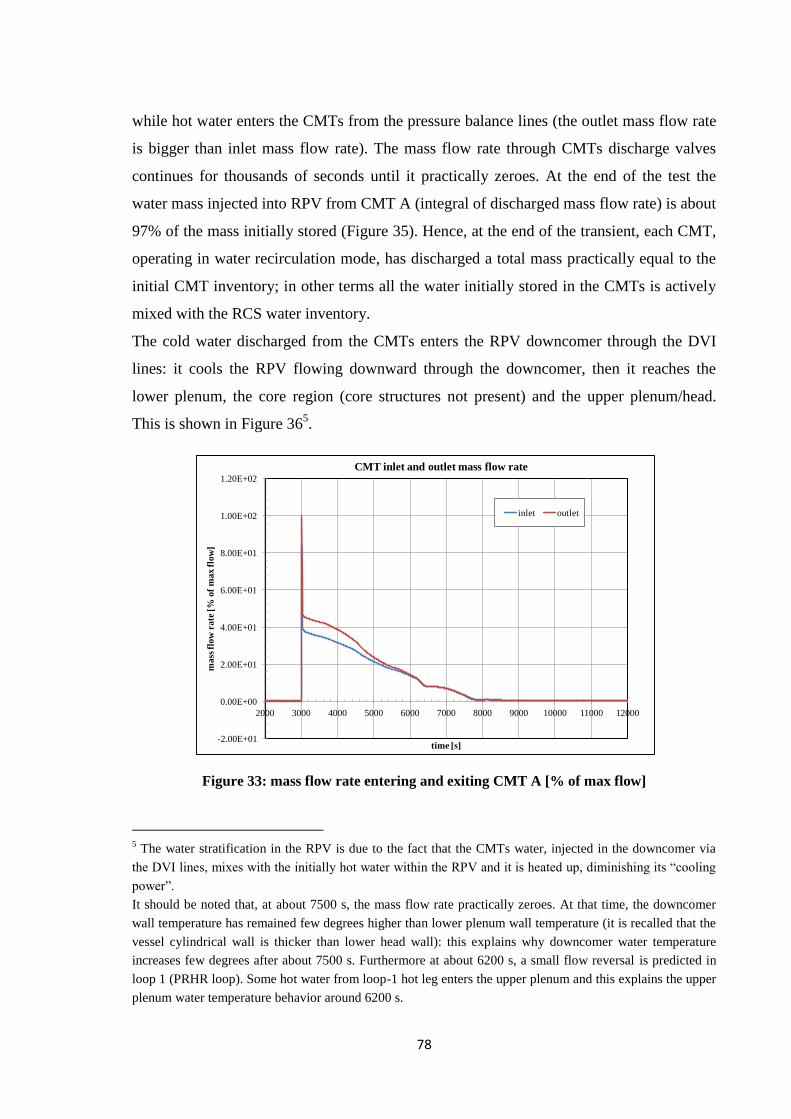


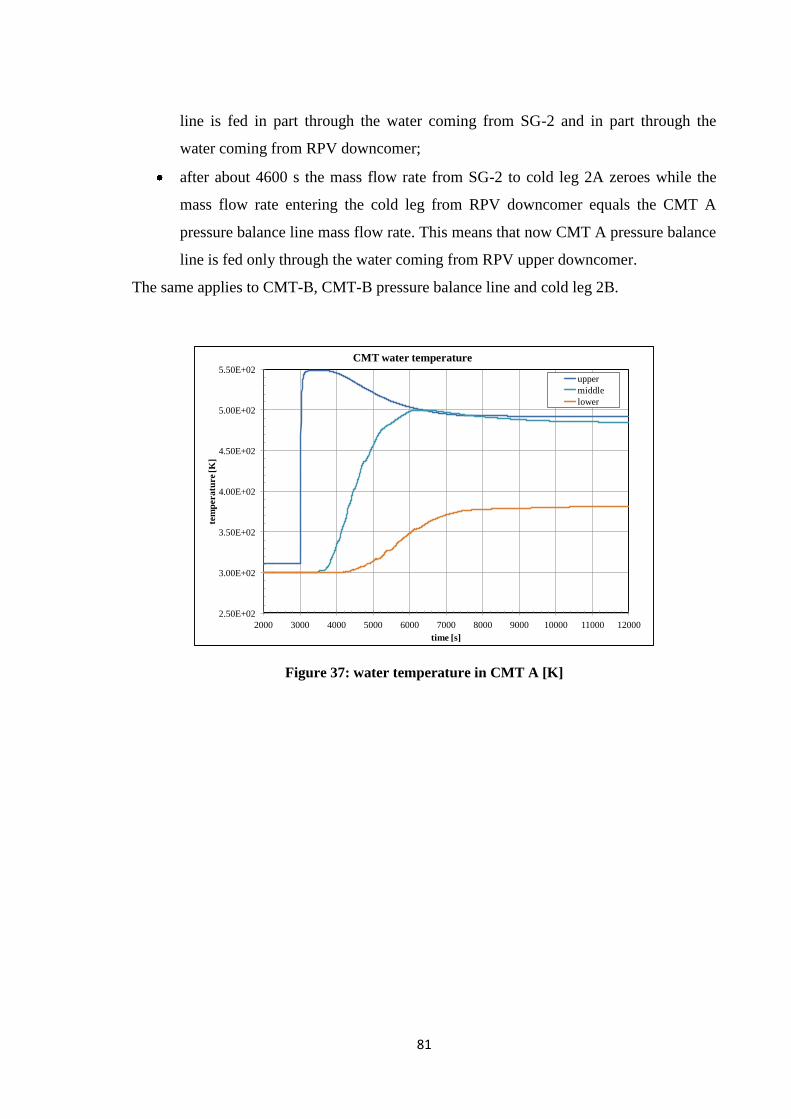


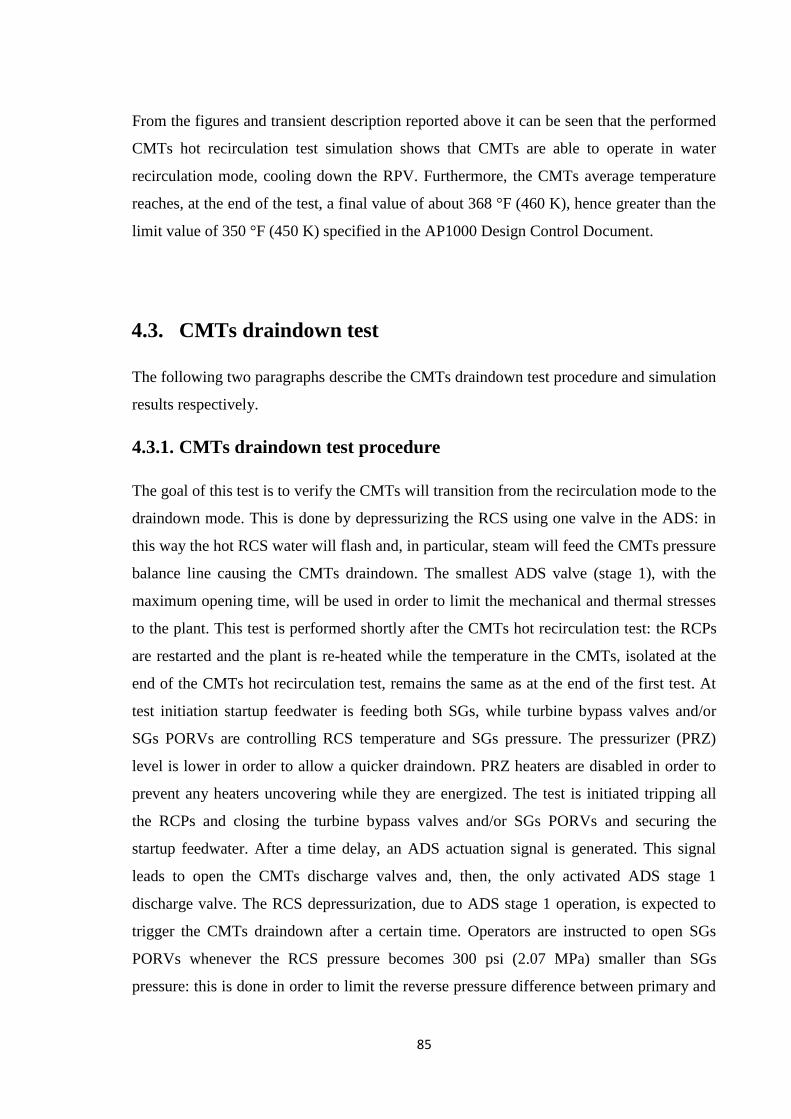
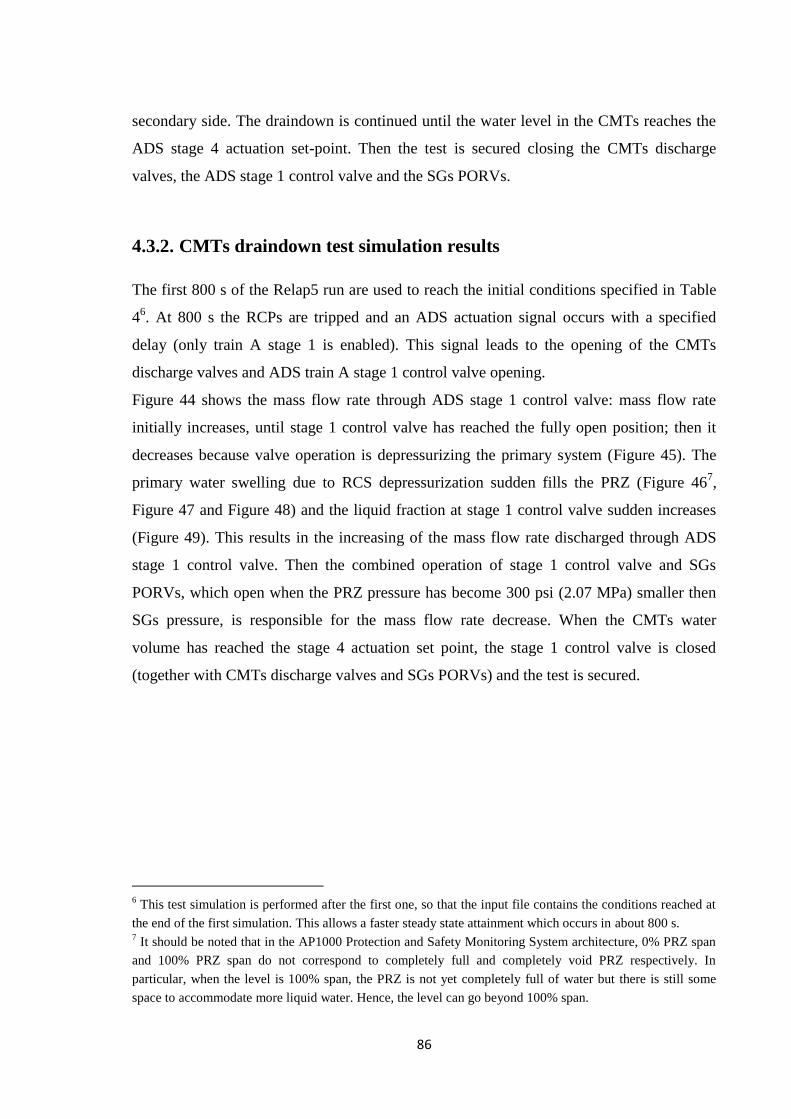


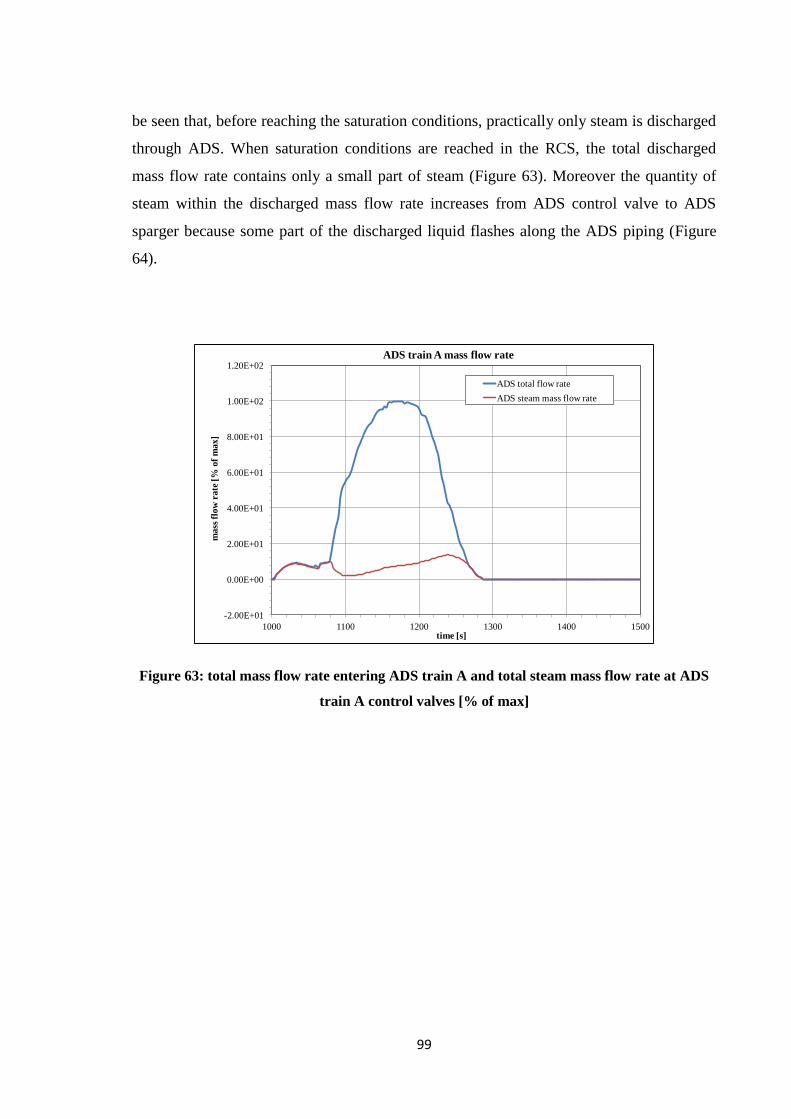


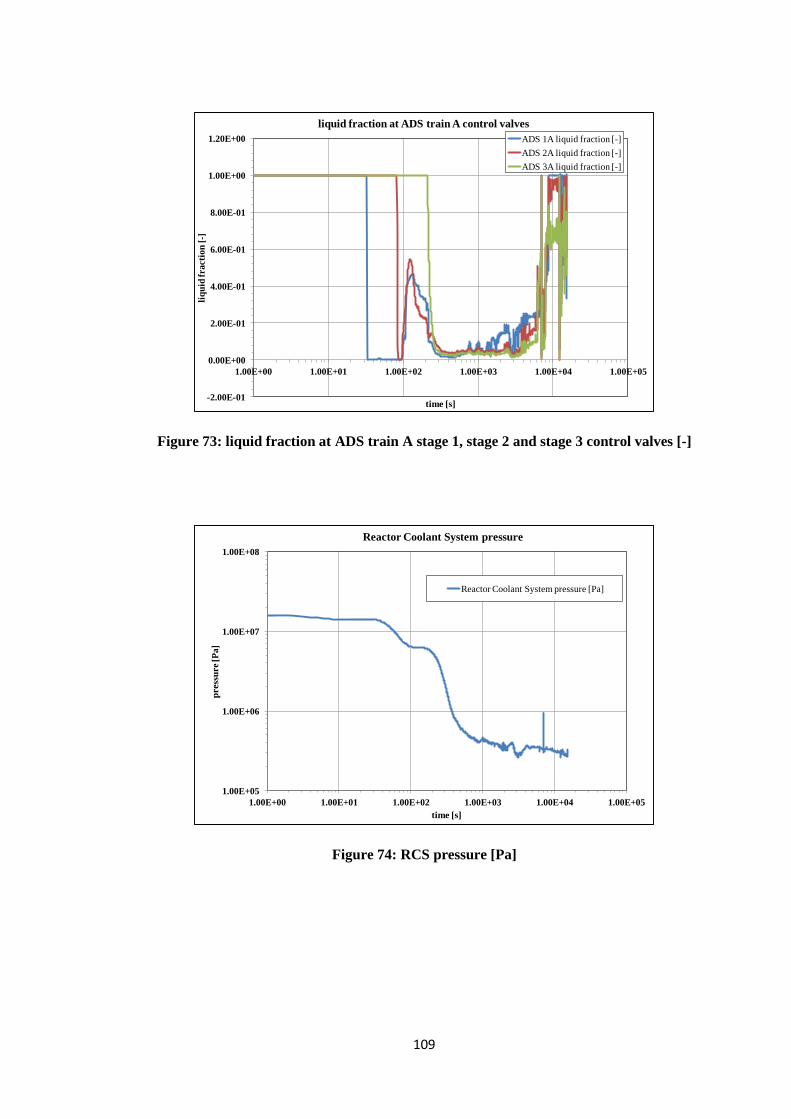


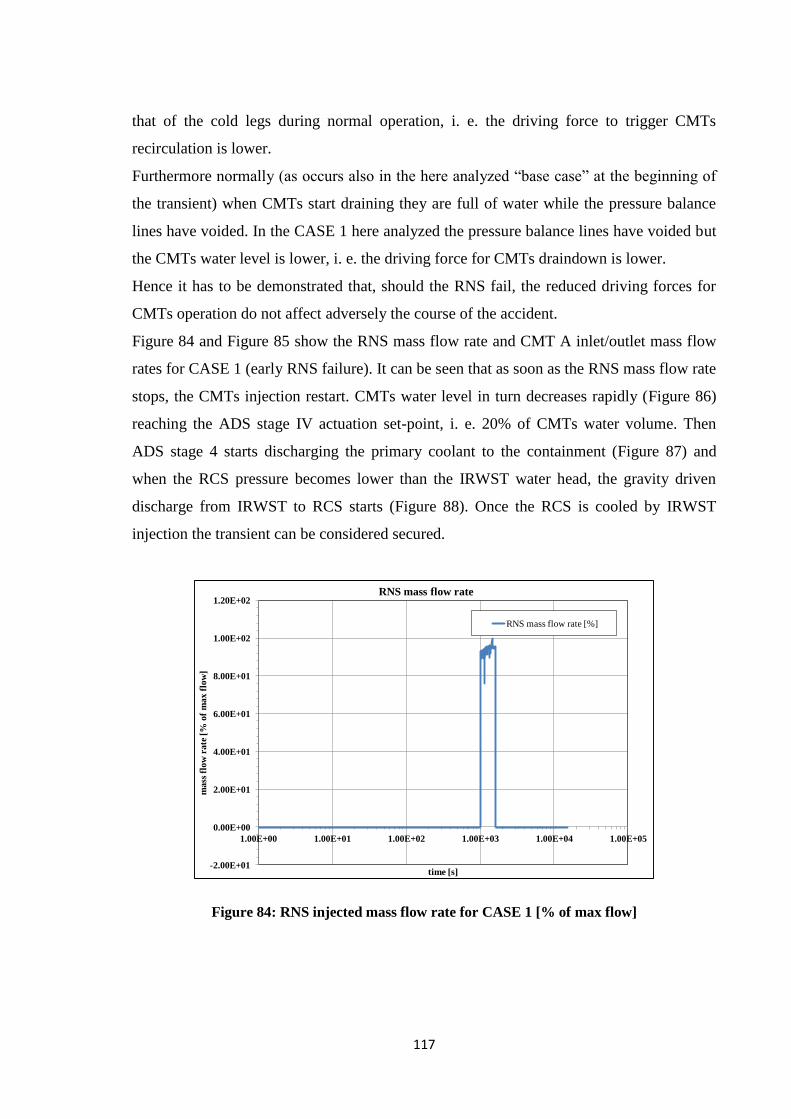


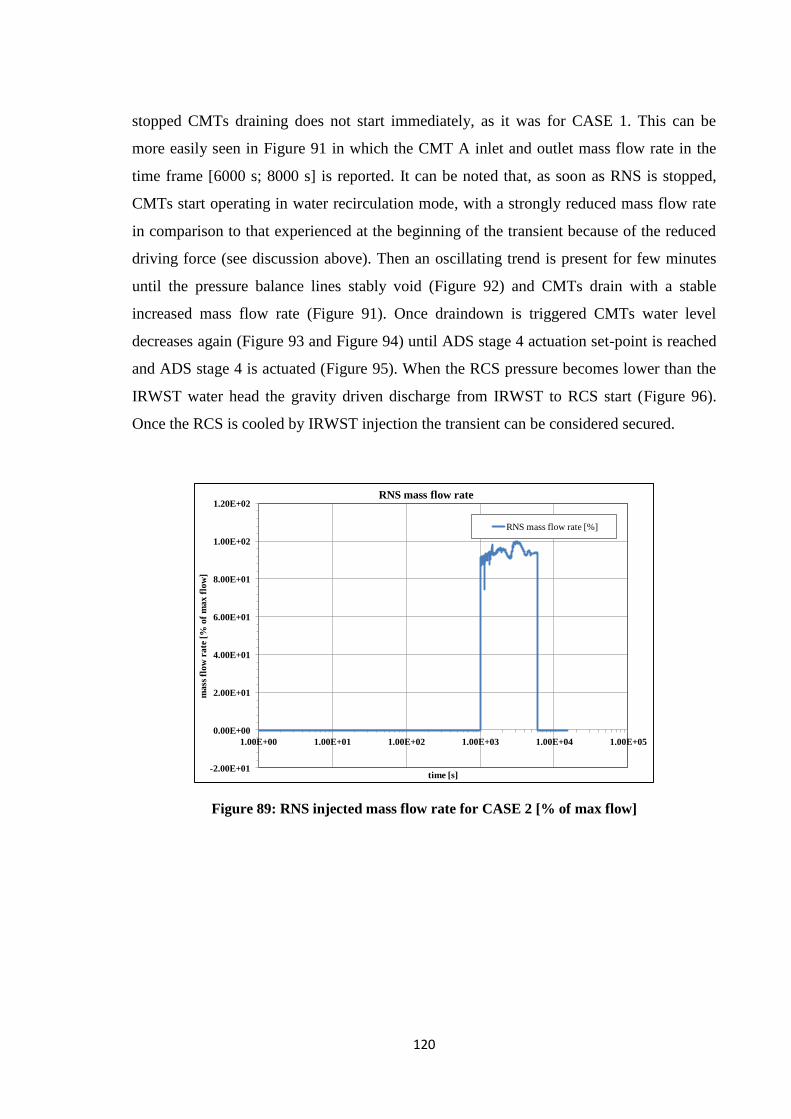


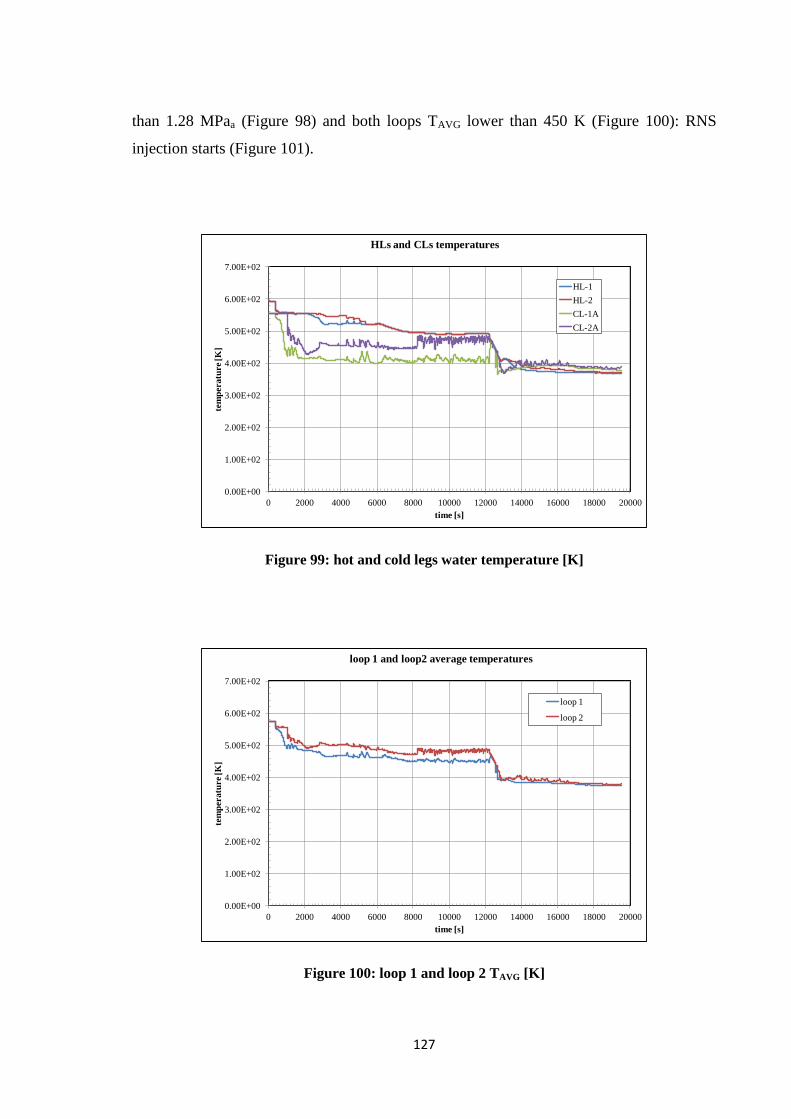


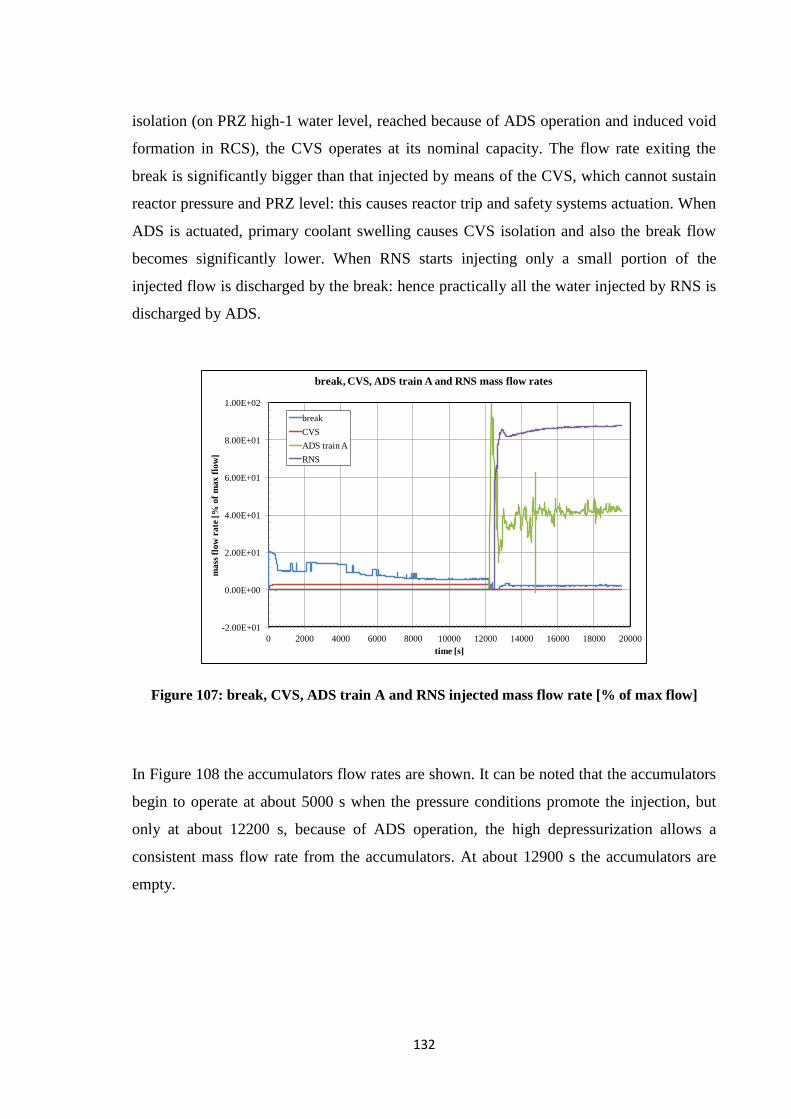
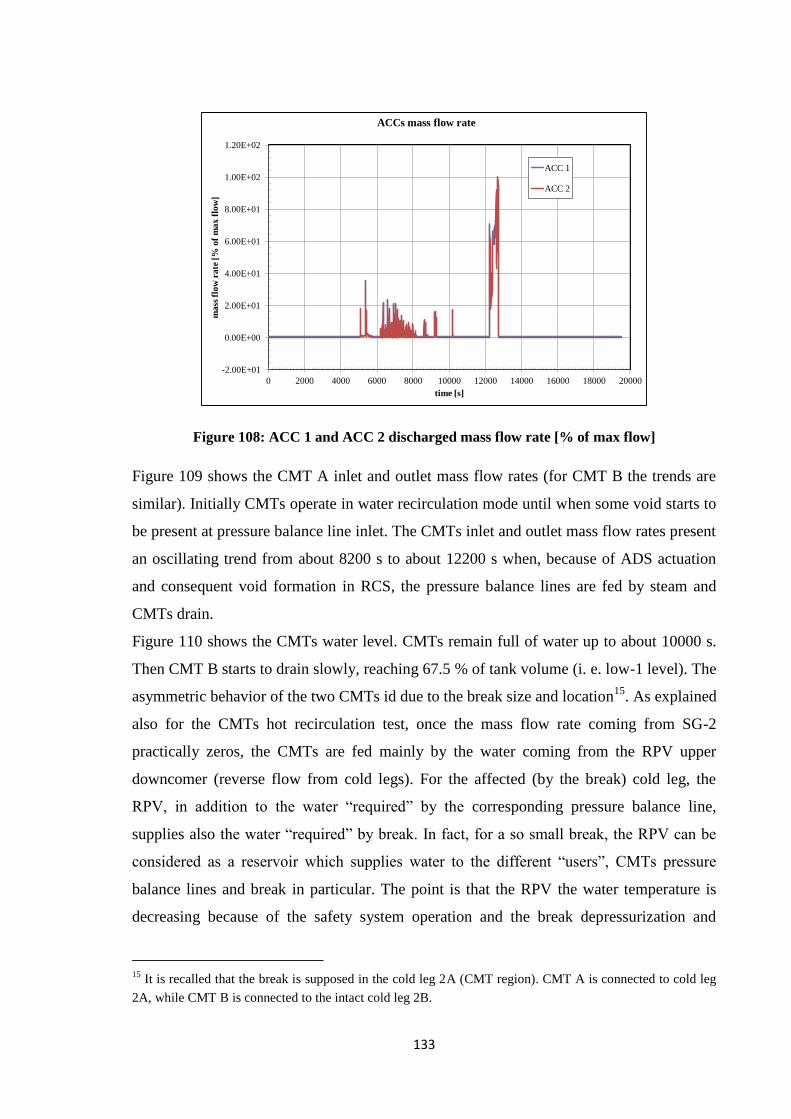
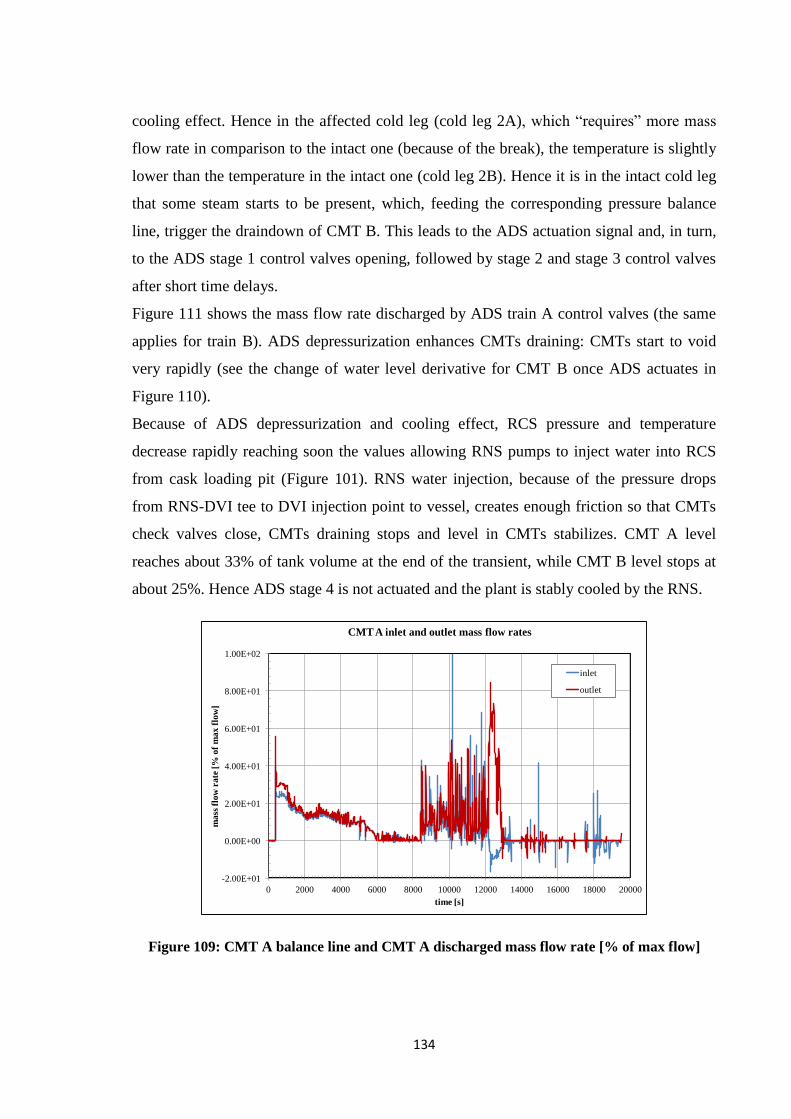


![QUANTIFICATION OF OPERATIONAL RISKS IN BANKS … · QUANTIFICATION OF OPERATIONAL RISKS IN BANKS: ... provisions, pricing, margin income and budgeting [13], ... Many tests can be](https://static.documents.pub/doc/80x56/5b3224f87f8b9ae1108c3162/quantification-of-operational-risks-in-banks-quantification-of-operational-risks.jpg)


