Page 1
Pre-Processing of Feedstuffs to Improve Their Feeding Value For Aquaculture Feeds
Dominique P. Bureau&
PJ Saez, ESM Abdel-Aal, YH Yang, CF Cai, XW Yi, AS Lemoine, G Pfeuti
Fish Nutrition Research LaboratoryDept. of Animal Biosciences
University of [email protected]
Page 2
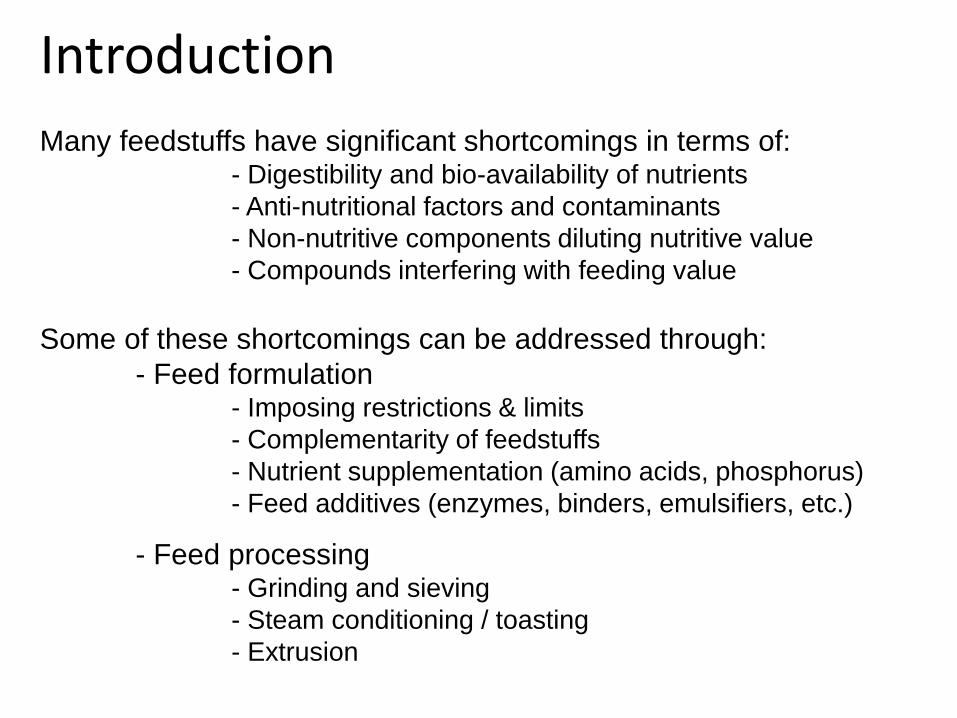
Introduction
Many feedstuffs have significant shortcomings in terms of:- Digestibility and bio-availability of nutrients
- Anti-nutritional factors and contaminants
- Non-nutritive components diluting nutritive value
- Compounds interfering with feeding value
Some of these shortcomings can be addressed through:
- Feed formulation- Imposing restrictions & limits
- Complementarity of feedstuffs
- Nutrient supplementation (amino acids, phosphorus)
- Feed additives (enzymes, binders, emulsifiers, etc.)
- Feed processing- Grinding and sieving
- Steam conditioning / toasting
- Extrusion
Page 3
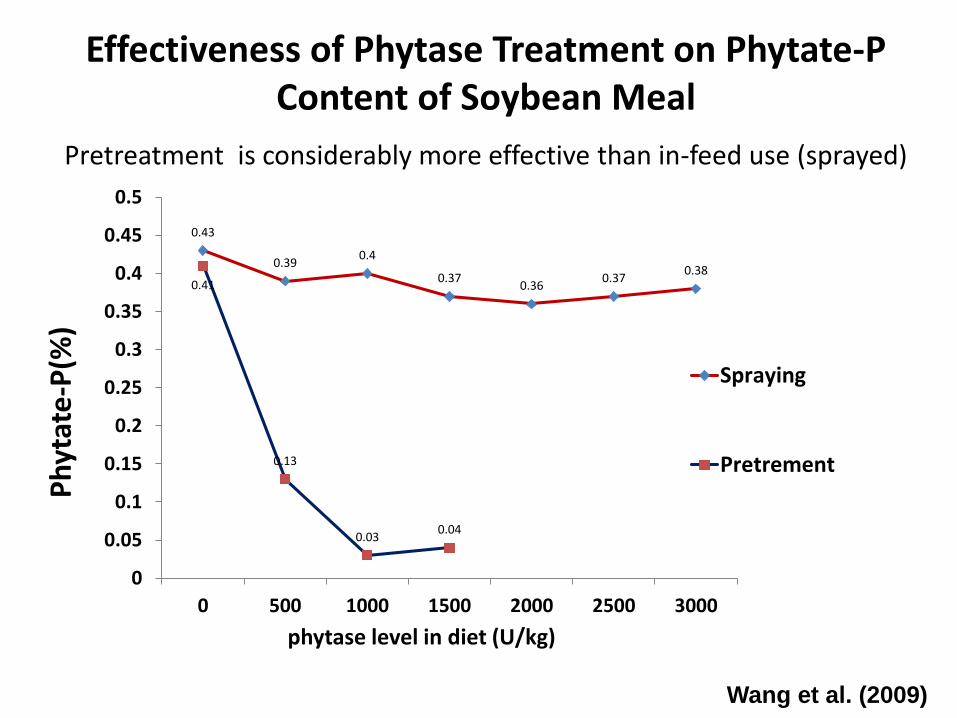
Effectiveness of Phytase Treatment on Phytate-P Content of Soybean Meal
Pretreatment is considerably more effective than in-feed use (sprayed)
0.43
0.390.4
0.370.36
0.370.38
0.41
0.13
0.030.04
0
0.05
0.1
0.15
0.2
0.25
0.3
0.35
0.4
0.45
0.5
0 500 1000 1500 2000 2500 3000
Ph
ytat
e-P
(%)
phytase level in diet (U/kg)
Spraying
Pretrement
Wang et al. (2009)
Page 4
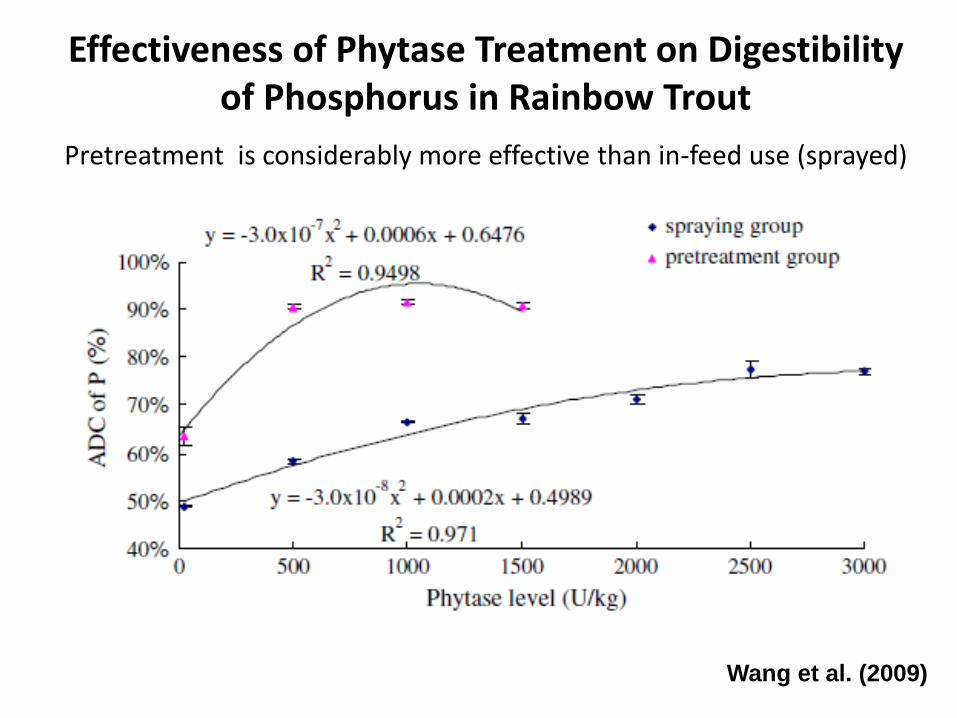
Effectiveness of Phytase Treatment on Digestibility of Phosphorus in Rainbow Trout
Pretreatment is considerably more effective than in-feed use (sprayed)
Wang et al. (2009)
Page 5
Opportunities exist to improve the
digestibility, nutritive value, safety,
suitability and economical value of feed
resources used in animal feeds through
simple and cost-effective pre-treatment
Page 6
Practical Strategies for Improving the Feeding Value of Corn Products for
Salmonid Fish
Patricio Saez, El-Sayed M. Abdel-Aal & Dominique P. Bureau
UG/OMNR Fish Nutrition Research LaboratoryDept. of Animal and Poultry Science
Page 7
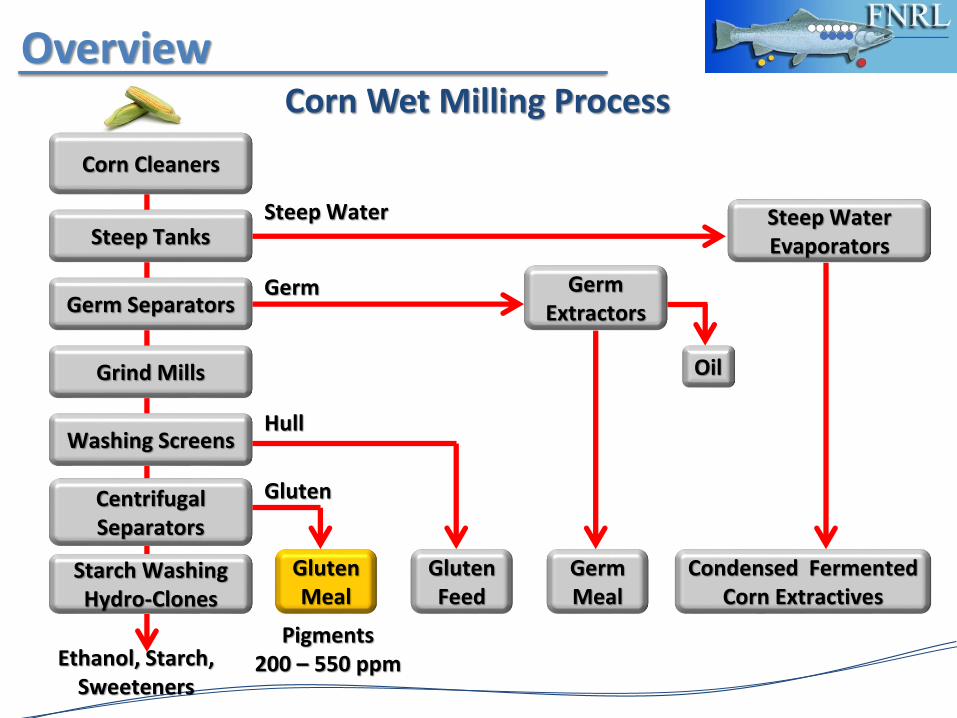
Overview
Corn Cleaners
Steep Tanks
Germ Separators
Grind Mills
Washing Screens
Centrifugal Separators
Starch Washing Hydro-Clones
Gluten Meal
Gluten Feed
Germ Meal
Condensed FermentedCorn Extractives
Steep Water Evaporators
Germ Extractors
Steep Water
Germ
Hull
Gluten
Oil
Ethanol, Starch,Sweeteners
Corn Wet Milling Process
Pigments200 – 550 ppm
Page 8
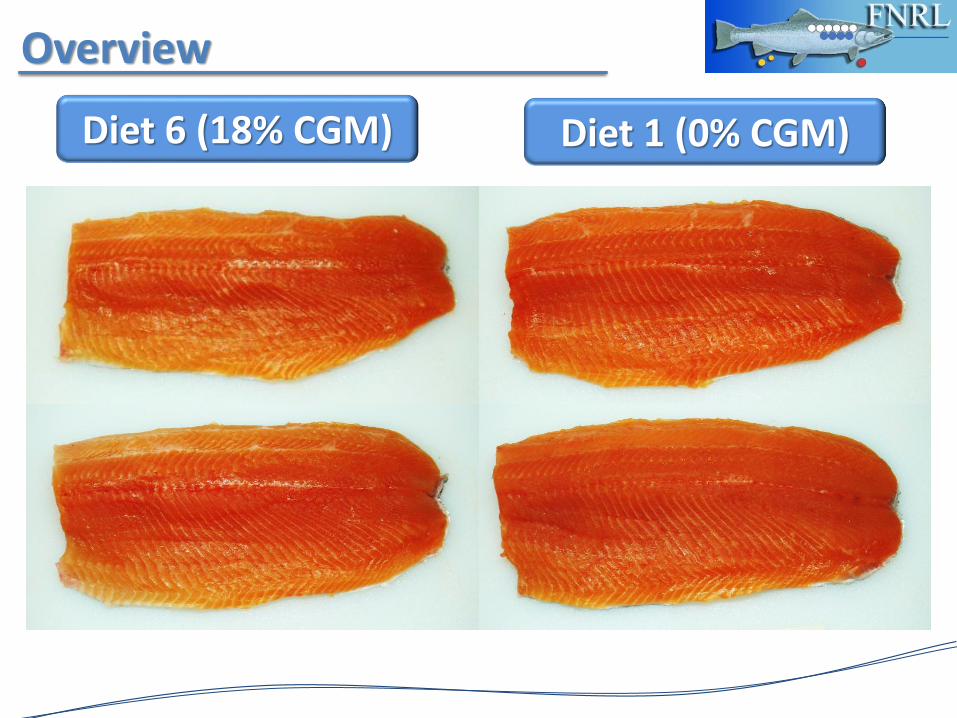
Overview
Diet 6 (18% CGM) Diet 1 (0% CGM)
Page 9
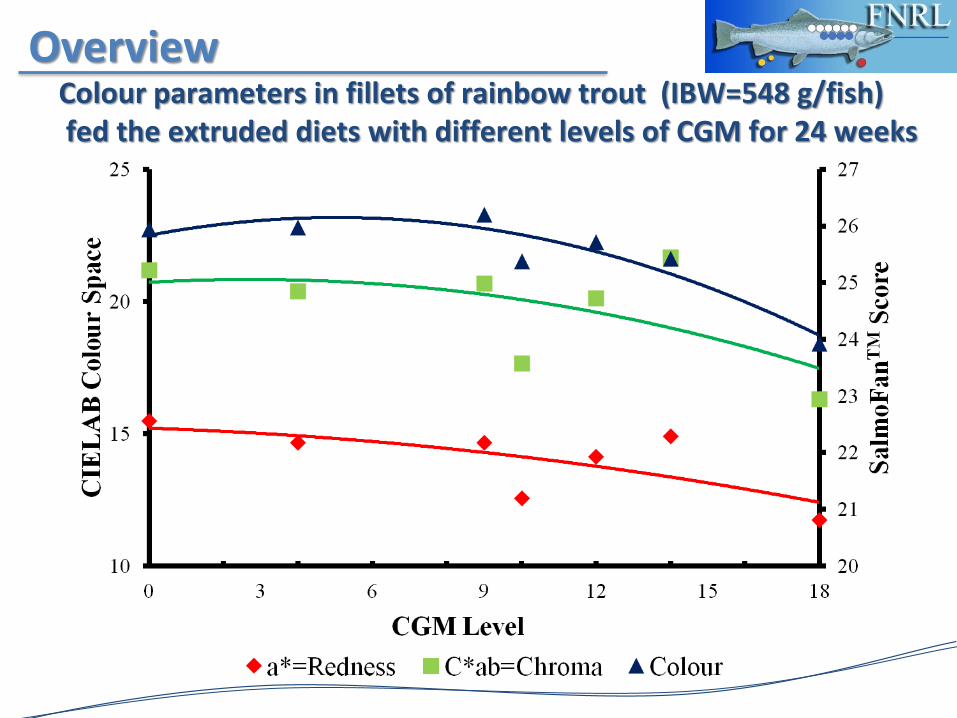
OverviewColour parameters in fillets of rainbow trout (IBW=548 g/fish)fed the extruded diets with different levels of CGM for 24 weeks
Page 10
Overview
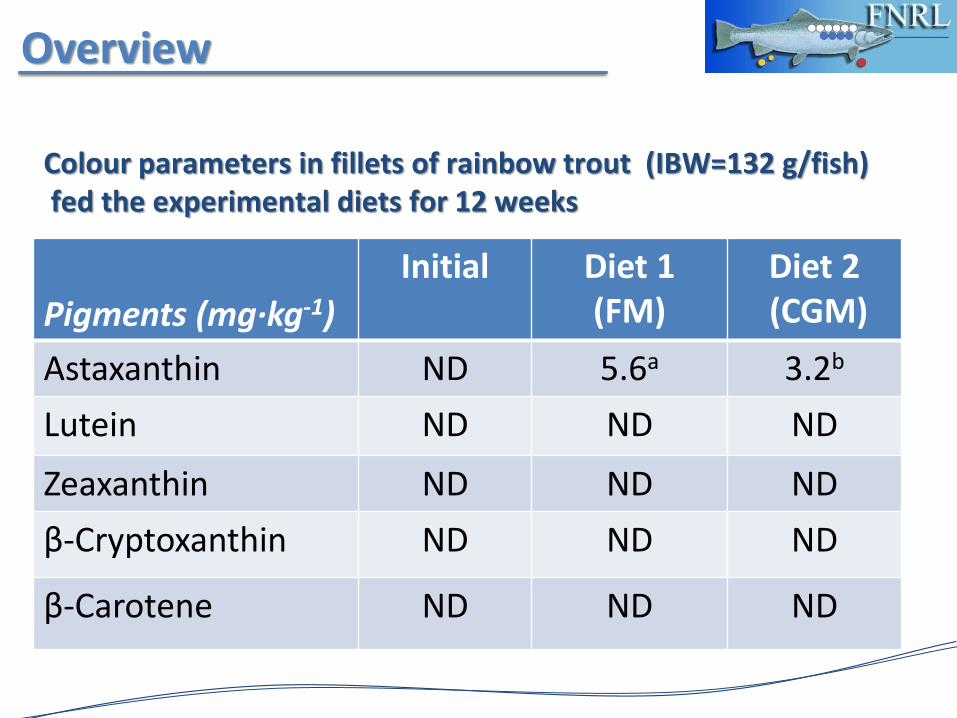
Pigments (mg·kg-1)
Initial Diet 1 (FM)
Diet 2(CGM)
Astaxanthin ND 5.6a 3.2b
Lutein ND ND ND
Zeaxanthin ND ND ND
β-Cryptoxanthin ND ND ND
β-Carotene ND ND ND
Colour parameters in fillets of rainbow trout (IBW=132 g/fish)fed the experimental diets for 12 weeks
Page 11
Yellow Pigment Bleaching from CornGluten Meal for it Use in Salmonid Feeds
Page 12
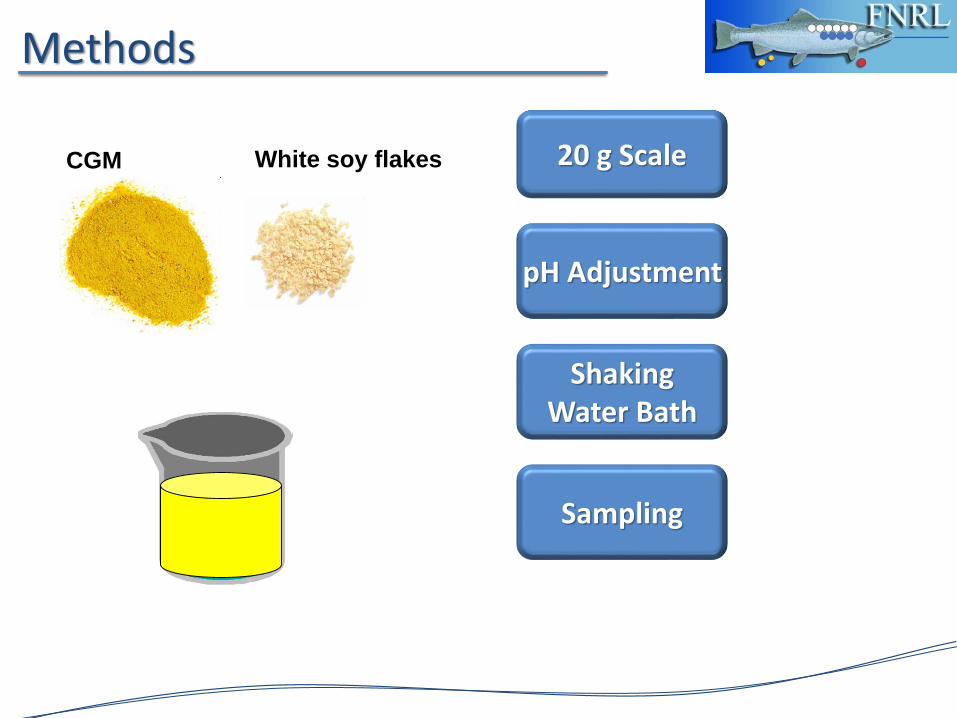
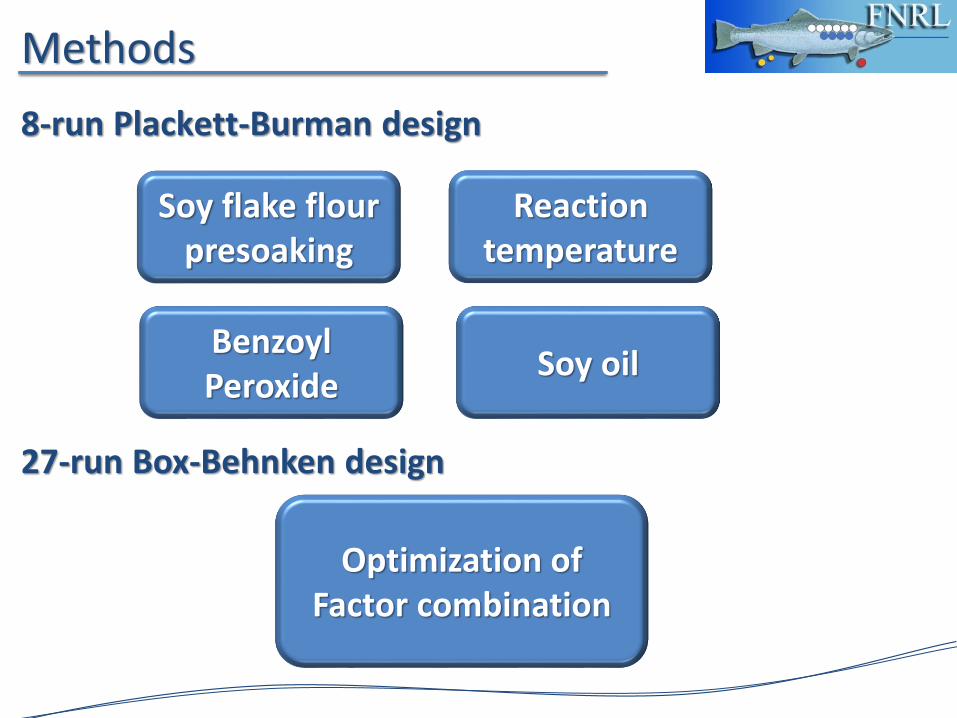
Methods
20 g Scale
pH Adjustment
Shaking Water Bath
Sampling
CGM White soy flakes
Page 13
Soy flake flour presoaking
Reaction temperature
Benzoyl Peroxide
Soy oil
8-run Plackett-Burman design
27-run Box-Behnken design
Optimization of Factor combination
Methods
Page 14
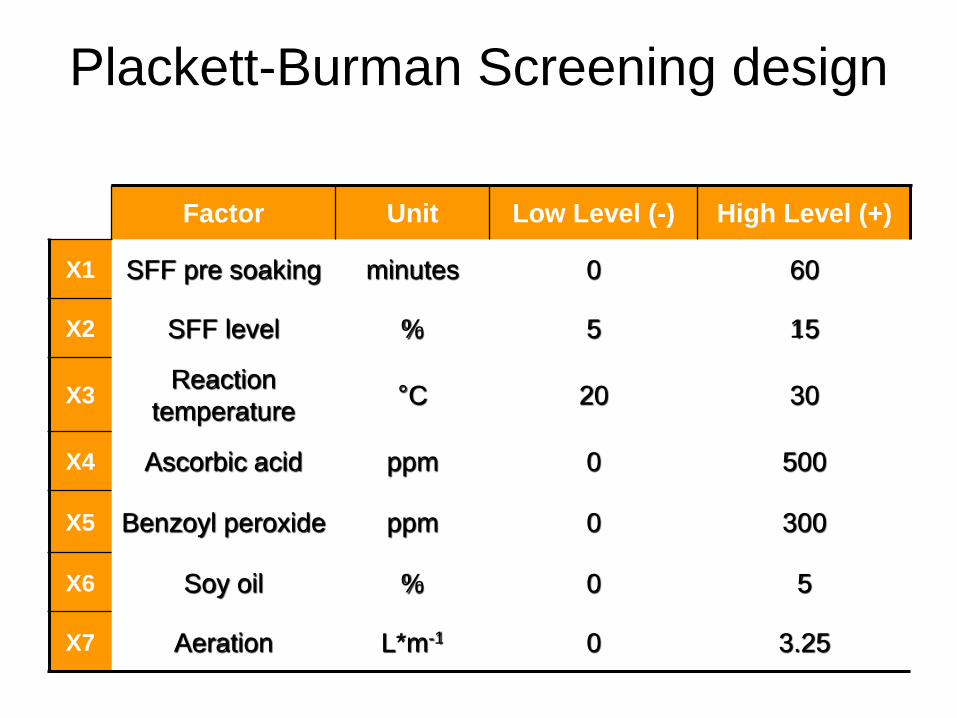
Plackett-Burman Screening design
Factor Unit Low Level (-) High Level (+)
X1 SFF pre soaking minutes 0 60
X2 SFF level % 5 15
X3Reaction
temperature°C 20 30
X4 Ascorbic acid ppm 0 500
X5 Benzoyl peroxide ppm 0 300
X6 Soy oil % 0 5
X7 Aeration L*m-1 0 3.25
Page 15
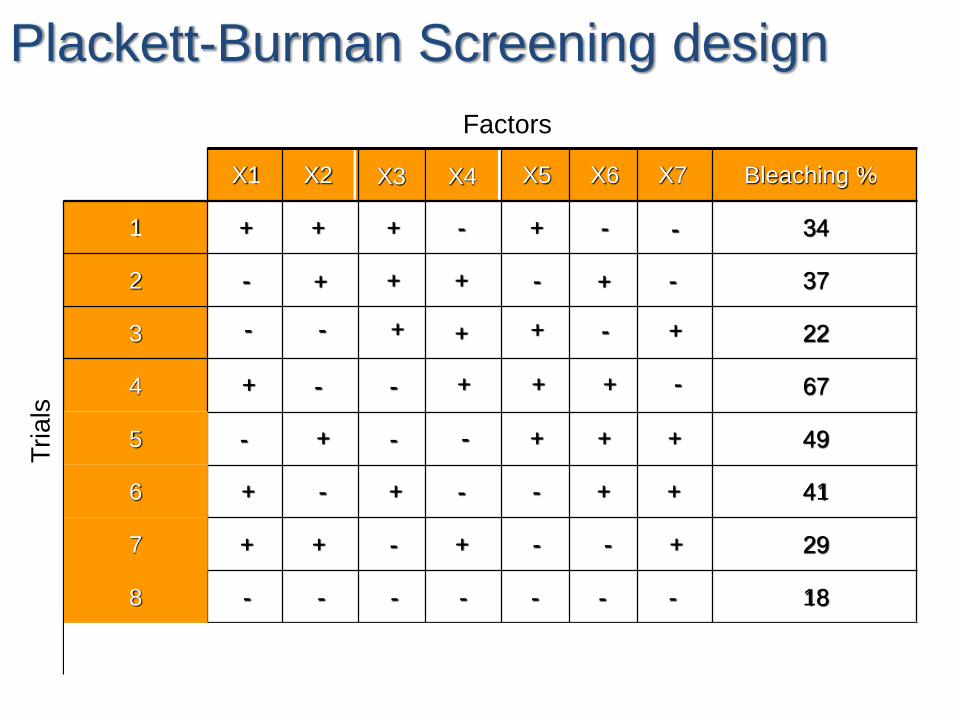
Plackett-Burman Screening design
18-------8
-21162-4-0.16
29+--+-++7
41++--+-+6
49+++--+-5
67-+++--+4
22+-+++--3
37-+-+++-2
34--+-+++1
Bleaching %X7X6X5X4X3X2X1
Factors
Tria
ls
6
5
7
6
5
8
7
6
5
8
7
6
5
Page 16
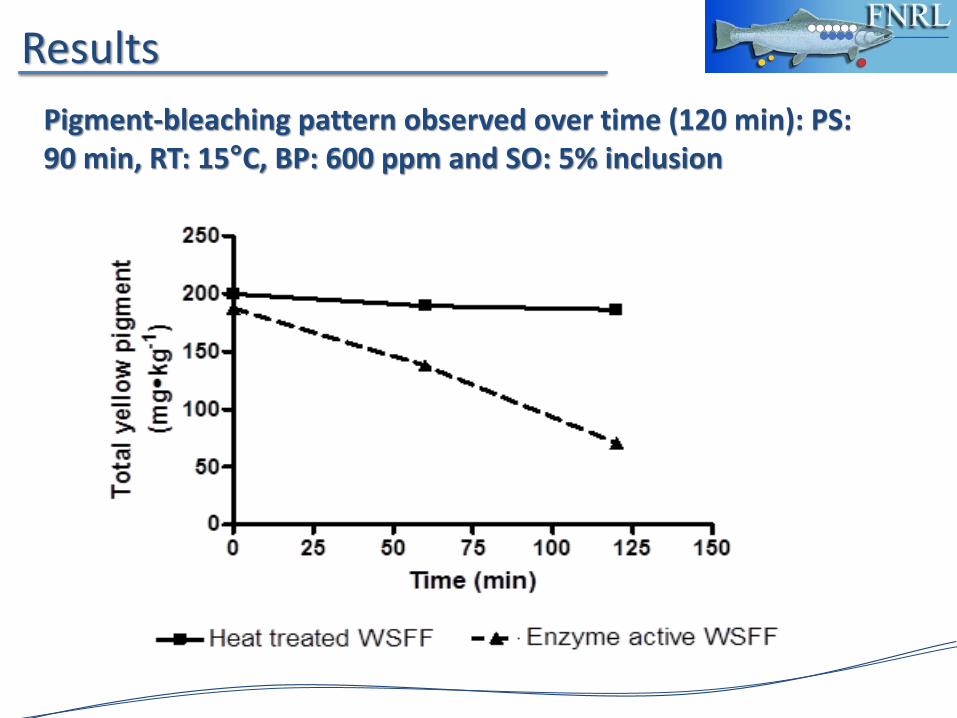
Pigment-bleaching pattern observed over time (120 min): PS: 90 min, RT: 15°C, BP: 600 ppm and SO: 5% inclusion
Results
Page 17
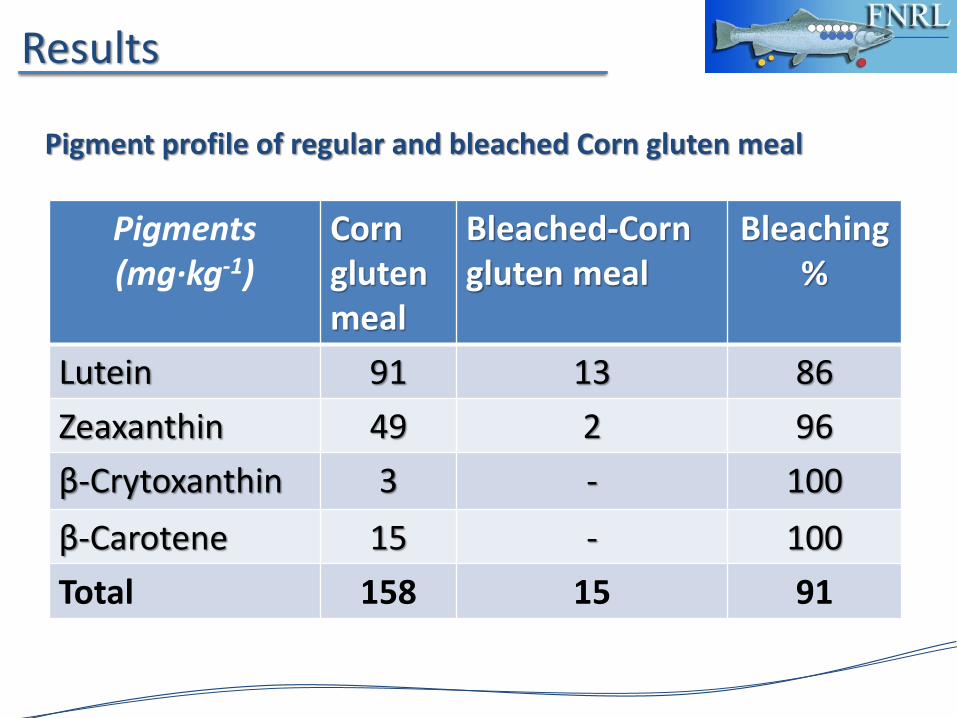
Pigments (mg·kg-1)
Corngluten meal
Bleached-Corngluten meal
Bleaching%
Lutein 91 13 86
Zeaxanthin 49 2 96
β-Crytoxanthin 3 - 100
β-Carotene 15 - 100
Total 158 15 91
Pigment profile of regular and bleached Corn gluten meal
Results
Page 18
Results
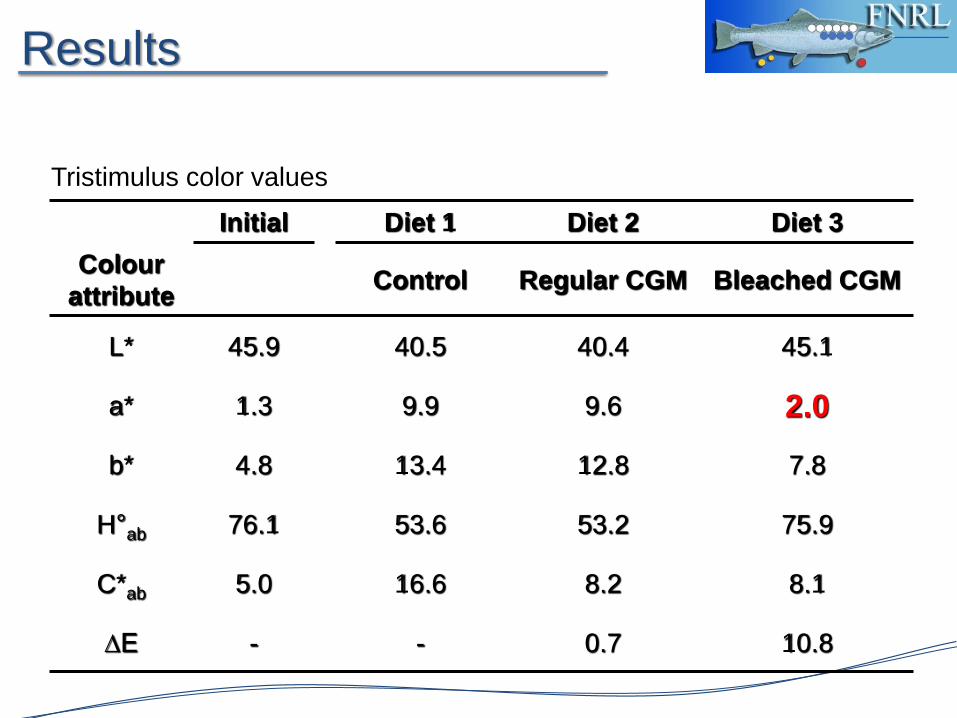
Initial Diet 1 Diet 2 Diet 3
Colour
attributeControl Regular CGM Bleached CGM
L* 45.9 40.5 40.4 45.1
a* 1.3 9.9 9.6 2.0
b* 4.8 13.4 12.8 7.8
H°ab 76.1 53.6 53.2 75.9
C*ab 5.0 16.6 8.2 8.1
∆E - - 0.7 10.8
Tristimulus color values
Page 19
IMPROVEMENT OF BIOAVAILABILITY
PHOSPHORUS IN FISH FEED INGREDIENT
YUHONG YANG ET AL
Page 20
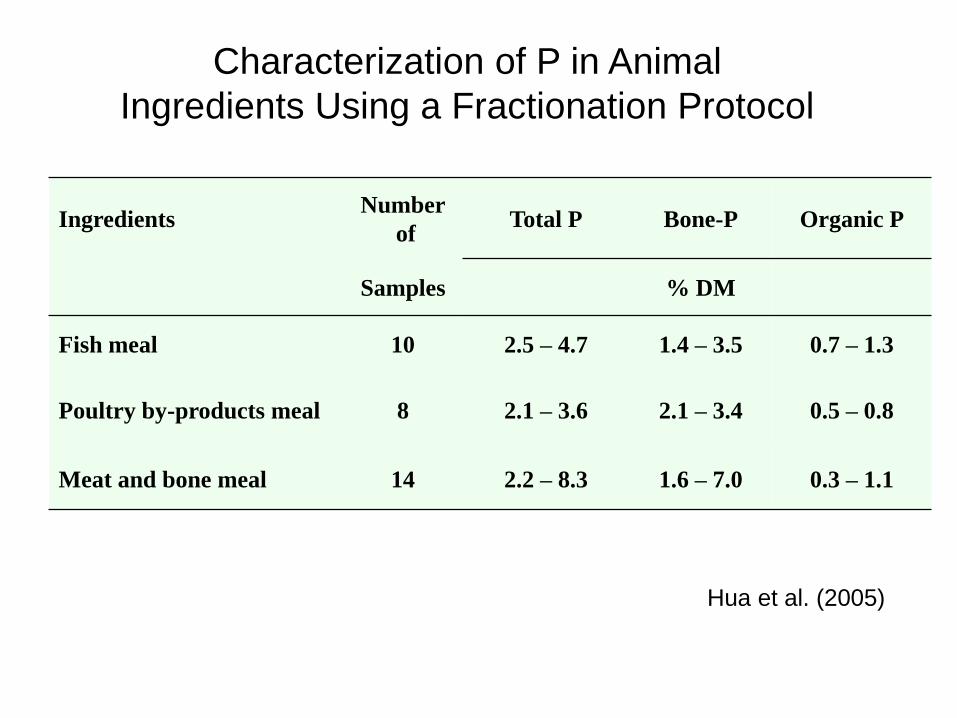
Characterization of P in Animal
Ingredients Using a Fractionation Protocol
IngredientsNumber
ofTotal P Bone-P Organic P
Samples % DM
Fish meal 10 2.5 – 4.7 1.4 – 3.5 0.7 – 1.3
Poultry by-products meal 8 2.1 – 3.6 2.1 – 3.4 0.5 – 0.8
Meat and bone meal 14 2.2 – 8.3 1.6 – 7.0 0.3 – 1.1
Hua et al. (2005)
Page 21
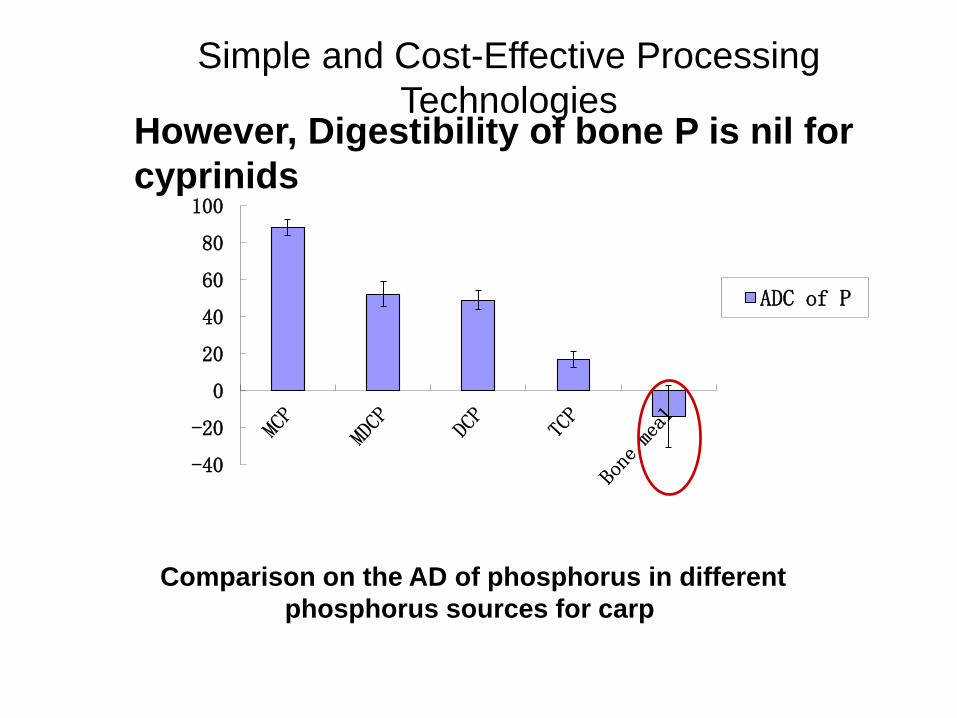
However, Digestibility of bone P is nil for
cyprinids
-40
-20
0
20
40
60
80
100
ADC of P
Comparison on the AD of phosphorus in different
phosphorus sources for carp
Simple and Cost-Effective Processing
Technologies
Page 22
Feed additivesDietary supplementation of citric acid, Na citrate,
and EDTA improved P digestibility in fish meal(Sugiura et al. 1998)
Formic acid improved P digestibility in fish meal
based diet (Vielma and Lall 1999)
Simple and Cost-Effective Processing
Technologies
Dietary organic acids (citric acid, formic acid)
appears to
be more or less effective in improving
digestibility of
bone P. They appear to affect feed intake and
acid
balance
Page 23
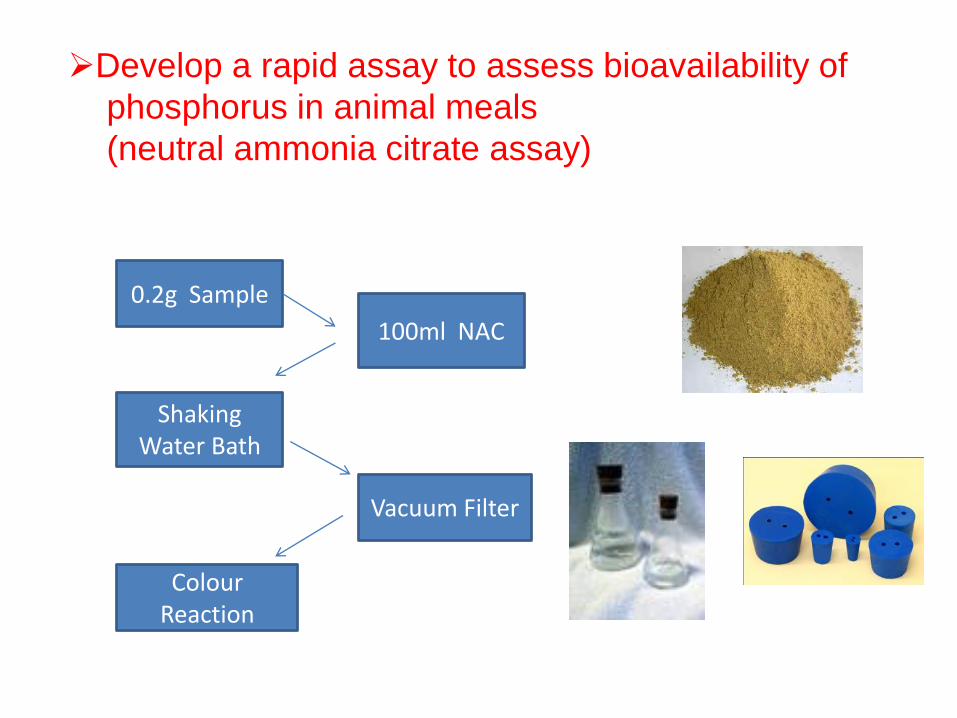
Develop a rapid assay to assess bioavailability of
phosphorus in animal meals
(neutral ammonia citrate assay)
0.2g Sample
100ml NAC
Shaking Water Bath
Vacuum Filter
ColourReaction
Page 24
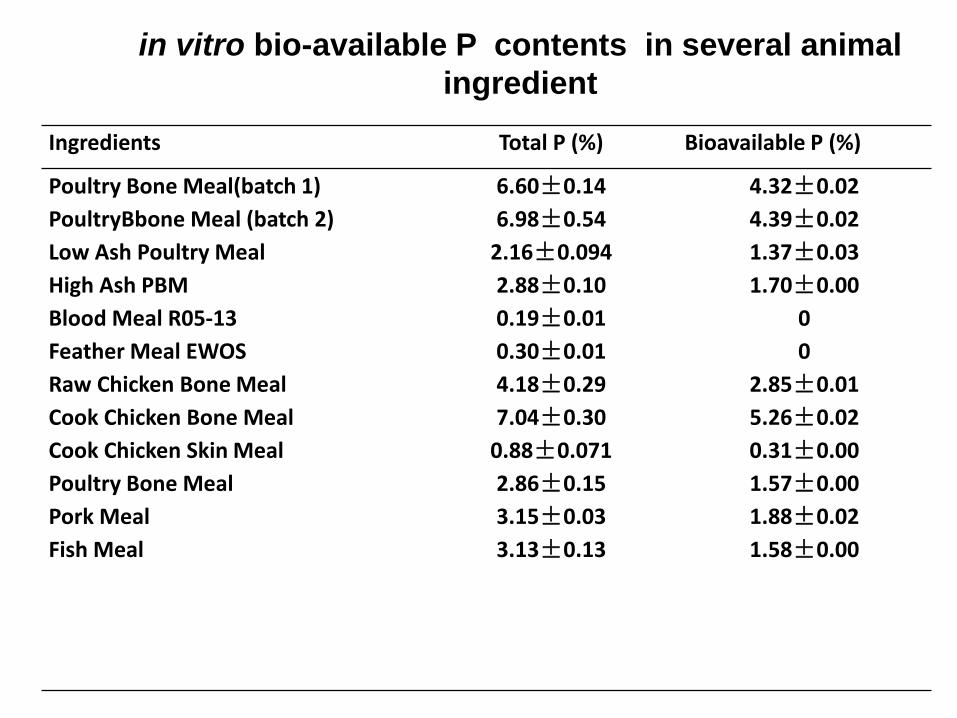
Ingredients Total P (%) Bioavailable P (%)
Poultry Bone Meal(batch 1)
PoultryBbone Meal (batch 2)
Low Ash Poultry Meal
High Ash PBM
Blood Meal R05-13
Feather Meal EWOS
Raw Chicken Bone Meal
Cook Chicken Bone Meal
Cook Chicken Skin Meal
Poultry Bone Meal
Pork Meal
Fish Meal
6.60±0.14
6.98±0.54
2.16±0.094
2.88±0.10
0.19±0.01
0.30±0.01
4.18±0.29
7.04±0.30
0.88±0.071
2.86±0.15
3.15±0.03
3.13±0.13
4.32±0.02
4.39±0.02
1.37±0.03
1.70±0.00
0
0
2.85±0.01
5.26±0.02
0.31±0.00
1.57±0.00
1.88±0.02
1.58±0.00
in vitro bio-available P contents in several animal
ingredient
Page 25
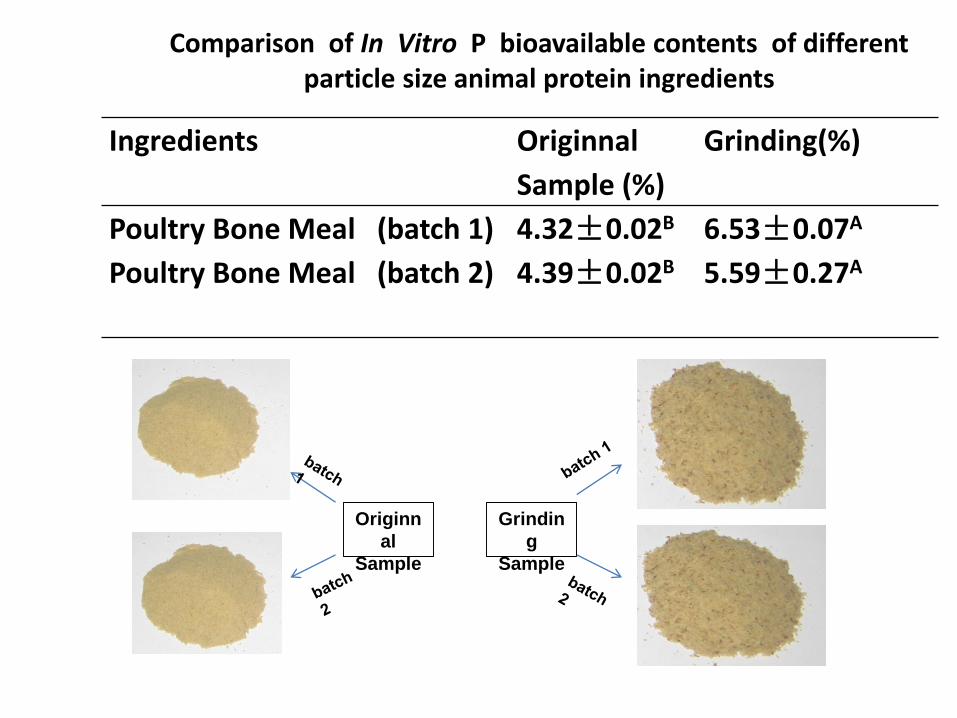
Ingredients Originnal
Sample (%)
Grinding(%)
Poultry Bone Meal (batch 1)
Poultry Bone Meal (batch 2)
4.32±0.02B
4.39±0.02B
6.53±0.07A
5.59±0.27A
Comparison of In Vitro P bioavailable contents of different particle size animal protein ingredients
Grindin
g
Sample
Originn
al
Sample
Page 26
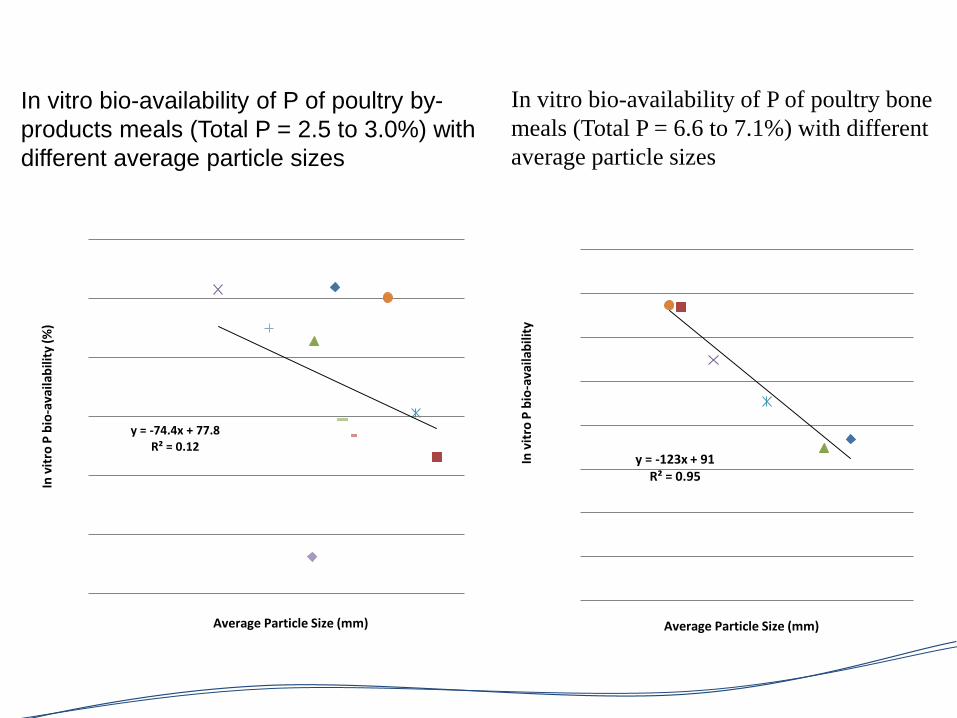
y = -123x + 91R² = 0.95
In v
itro
P b
io-a
vaila
bili
ty
Average Particle Size (mm)
y = -74.4x + 77.8R² = 0.12
In v
itro
P b
io-a
vaila
bili
ty (%
)
Average Particle Size (mm)
In vitro bio-availability of P of poultry by-
products meals (Total P = 2.5 to 3.0%) with
different average particle sizes
In vitro bio-availability of P of poultry bone
meals (Total P = 6.6 to 7.1%) with different
average particle sizes
Page 27
Future research work
screening the best treatment conditions
(tempeture, pH, revolution per minute,shaking
water bath time,particle size) with acidifier
(lactic acid, citric acid,formic acid,Corn steep
liquor) in which phosphorus bioavailability in
high
ash ingredients can be improved effectively by
treatmentFinally, we can produce novel value-
added
ingredients from high ash protein
ingredients.
Page 28
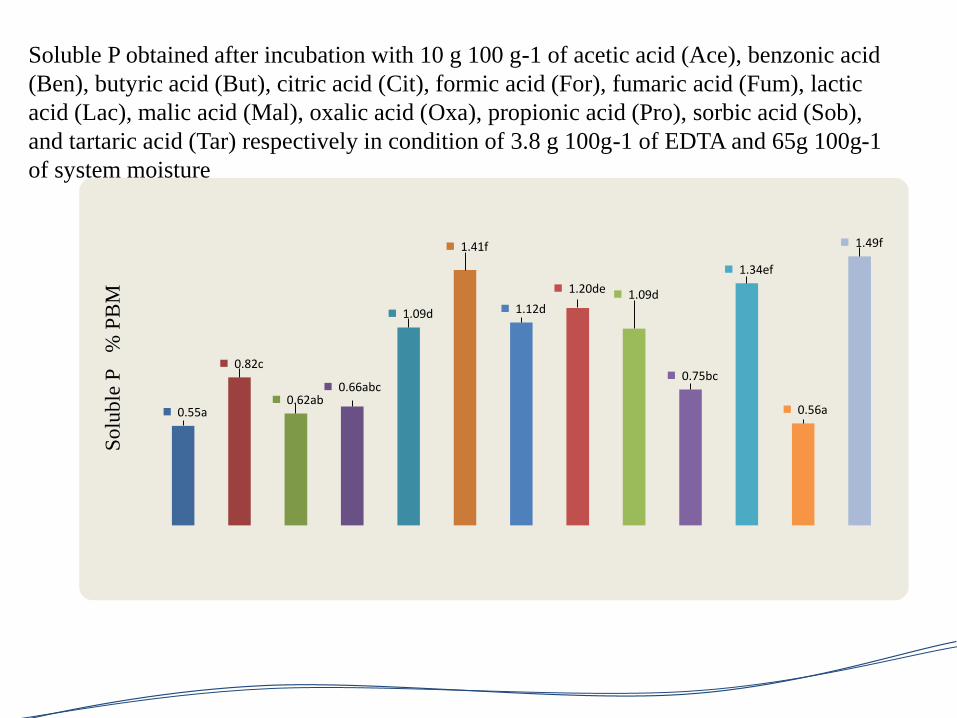
0.55a
0.82c
0.62ab 0.66abc
1.09d
1.41f
1.12d
1.20de 1.09d
0.75bc
1.34ef
0.56a
1.49f
So
lub
leP
%
PB
M
Soluble P obtained after incubation with 10 g 100 g-1 of acetic acid (Ace), benzonic acid
(Ben), butyric acid (But), citric acid (Cit), formic acid (For), fumaric acid (Fum), lactic
acid (Lac), malic acid (Mal), oxalic acid (Oxa), propionic acid (Pro), sorbic acid (Sob),
and tartaric acid (Tar) respectively in condition of 3.8 g 100g-1 of EDTA and 65g 100g-1
of system moisture
Page 29
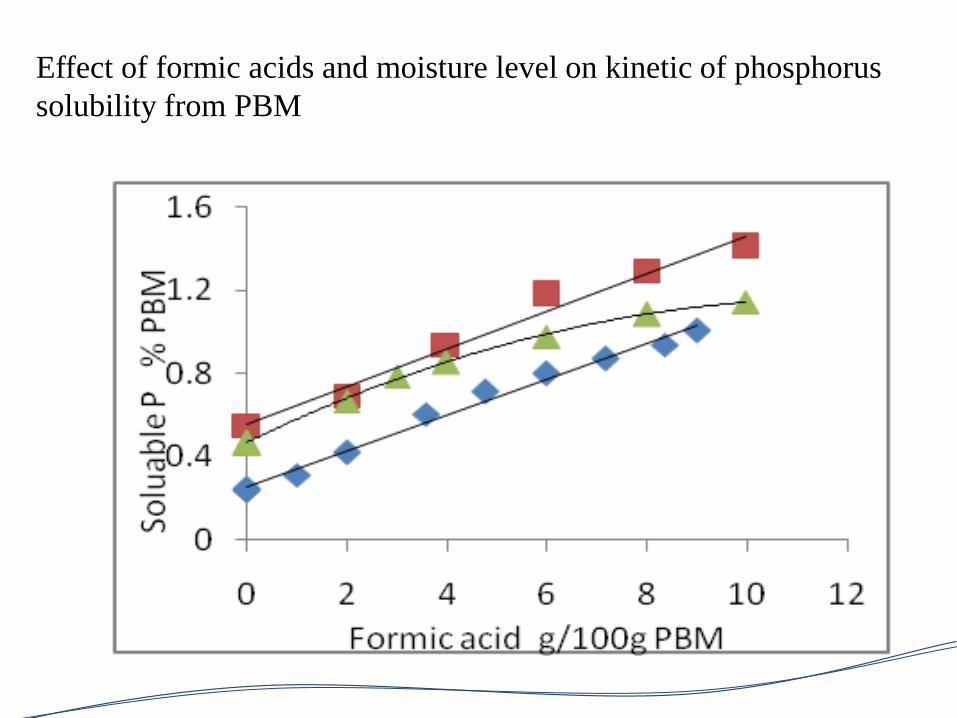
Effect of formic acids and moisture level on kinetic of phosphorus
solubility from PBM
Page 30
0.00
0.20
0.40
0.60
0.80
1.00
1.20
0 2 4 6 8 10 12
Solu
ble
P (
%)
Citric acid concentration (% w/w)
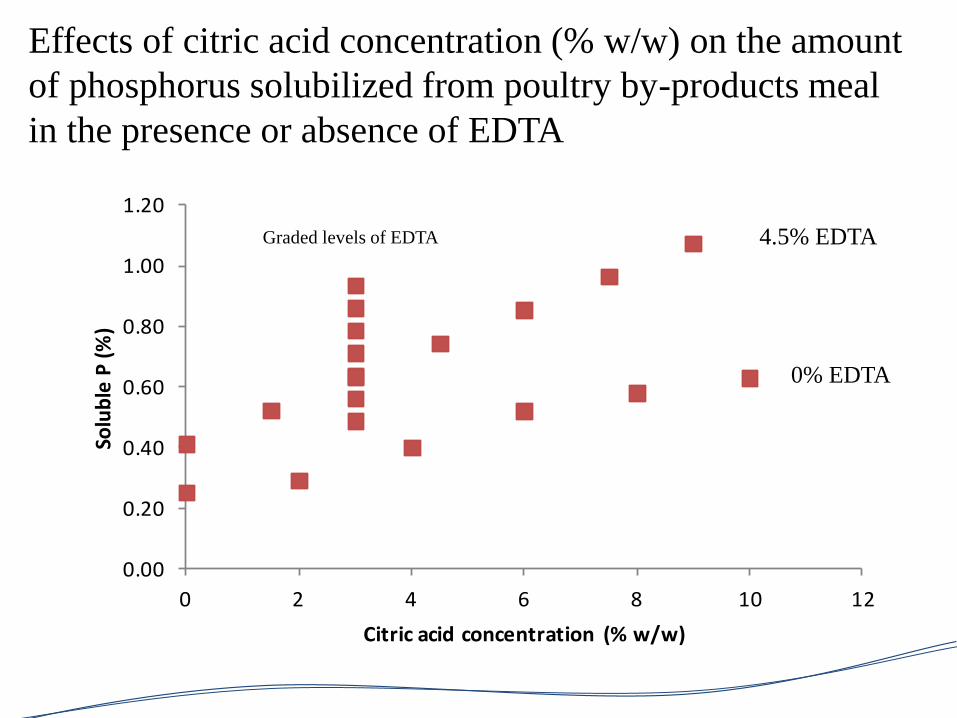
Effects of citric acid concentration (% w/w) on the amount
of phosphorus solubilized from poultry by-products meal
in the presence or absence of EDTA
Graded levels of EDTA 4.5% EDTA
0% EDTA
Page 31
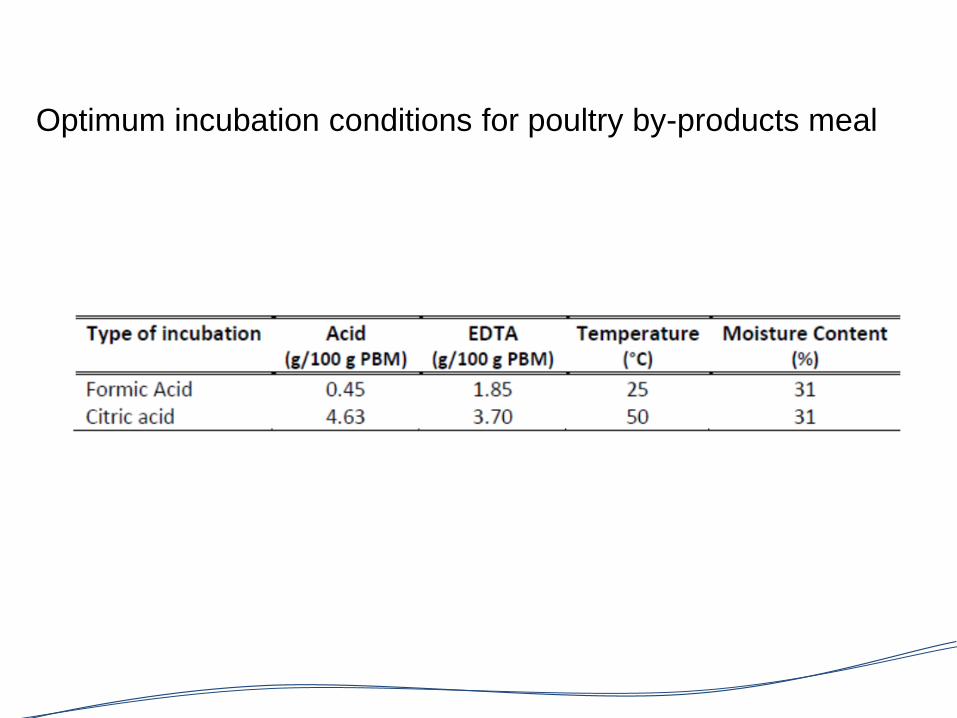
Optimum incubation conditions for poultry by-products meal
Page 32
PhD Research Project
Characterizing and Improving the Nutritional Value of Feather Meals
Guillaume PfeutiPhD Student
Fish Nutrition Research LaboratoryDept. of Animal and Poultry Science
University of Guelph
Page 33
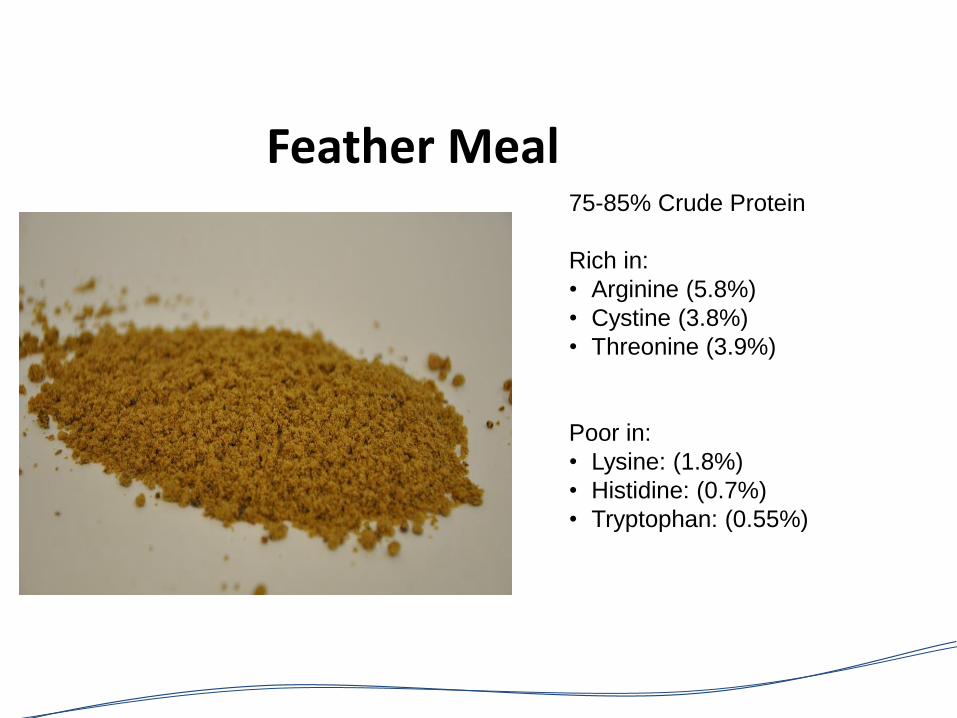
Feather Meal75-85% Crude Protein
Rich in:
• Arginine (5.8%)
• Cystine (3.8%)
• Threonine (3.9%)
Poor in:
• Lysine: (1.8%)
• Histidine: (0.7%)
• Tryptophan: (0.55%)
Page 34
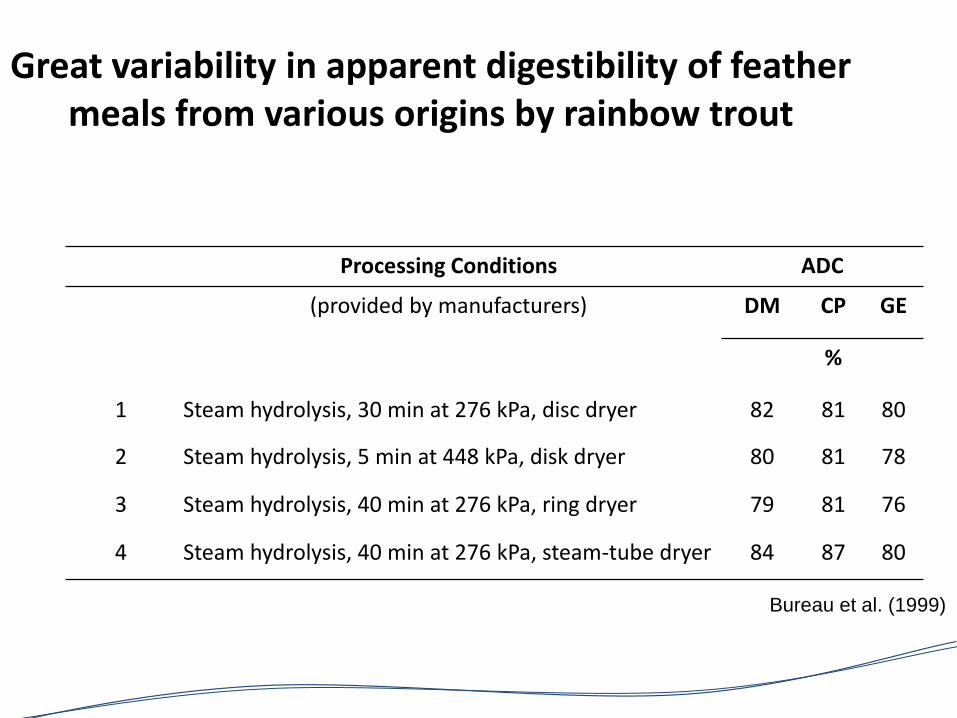
Great variability in apparent digestibility of feather meals from various origins by rainbow trout
Processing Conditions ADC
(provided by manufacturers) DM CP GE
%
1 Steam hydrolysis, 30 min at 276 kPa, disc dryer 82 81 80
2 Steam hydrolysis, 5 min at 448 kPa, disk dryer 80 81 78
3 Steam hydrolysis, 40 min at 276 kPa, ring dryer 79 81 76
4 Steam hydrolysis, 40 min at 276 kPa, steam-tube dryer 84 87 80
Bureau et al. (1999)
Page 35
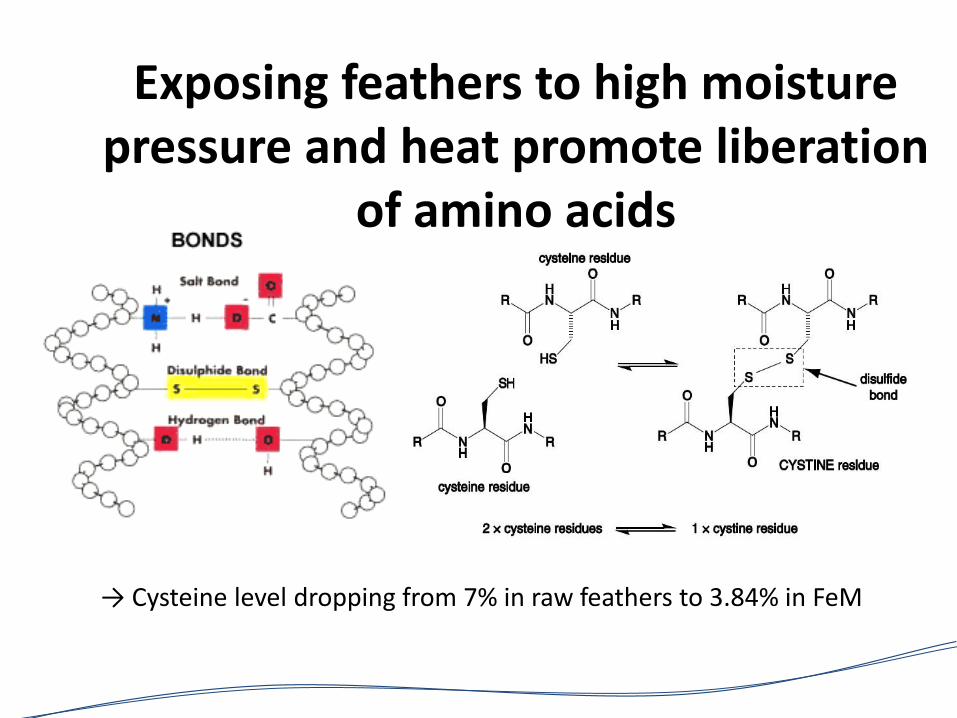
Exposing feathers to high moisture pressure and heat promote liberation
of amino acids
→ Cysteine level dropping from 7% in raw feathers to 3.84% in FeM
Page 36
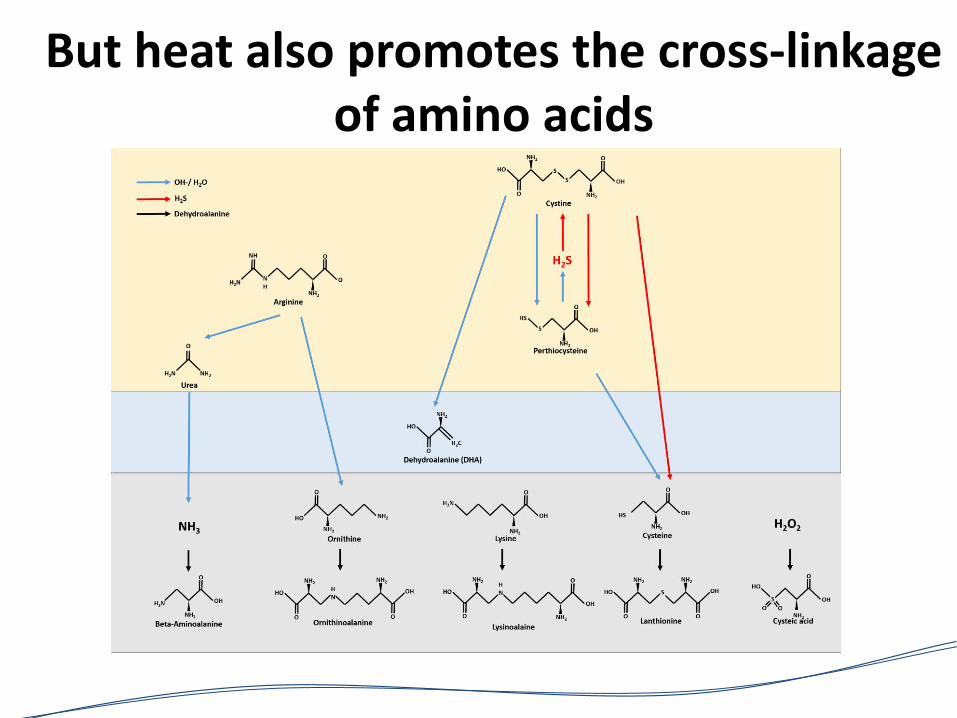
But heat also promotes the cross-linkage of amino acids
Page 37
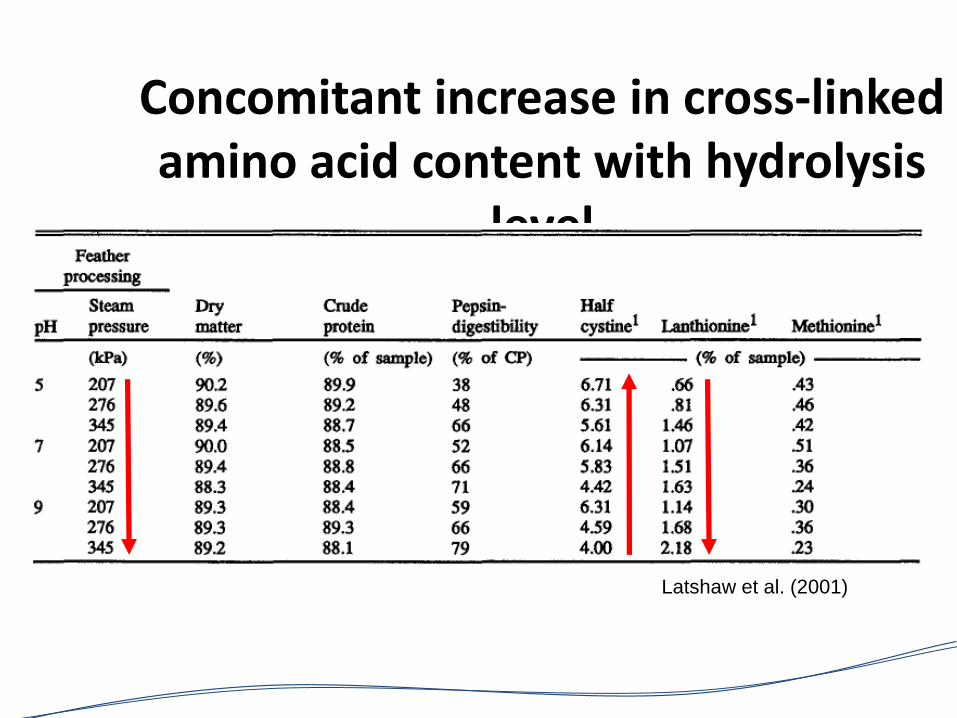
Concomitant increase in cross-linked amino acid content with hydrolysis
level
Latshaw et al. (2001)
Page 38
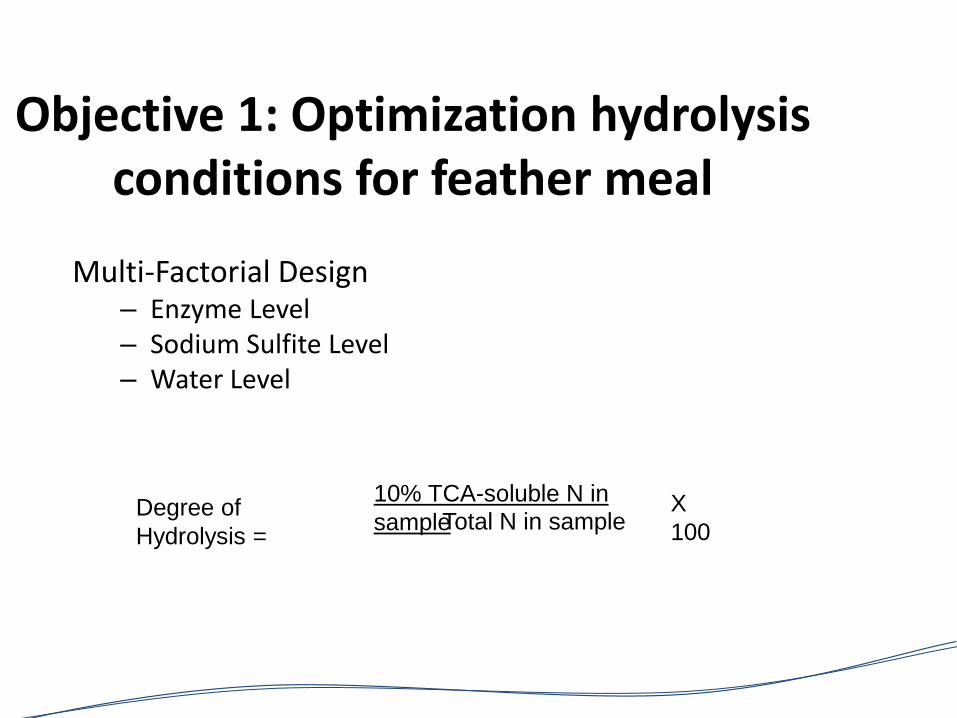
Objective 1: Optimization hydrolysis conditions for feather meal
Multi-Factorial Design– Enzyme Level– Sodium Sulfite Level– Water Level
Degree of
Hydrolysis =
10% TCA-soluble N in
sampleTotal N in sampleX
100
Page 39
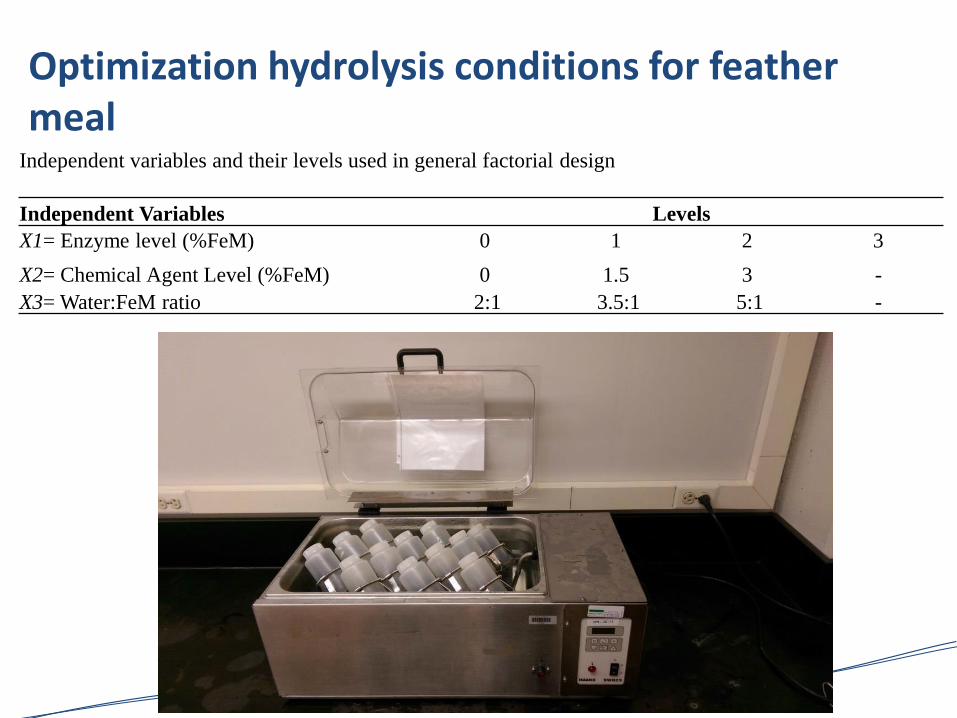
Optimization hydrolysis conditions for feather meal
Independent variables and their levels used in general factorial design
Independent Variables Levels
X1= Enzyme level (%FeM) 0 1 2 3
X2= Chemical Agent Level (%FeM) 0 1.5 3 -
X3= Water:FeM ratio 2:1 3.5:1 5:1 -
Page 40
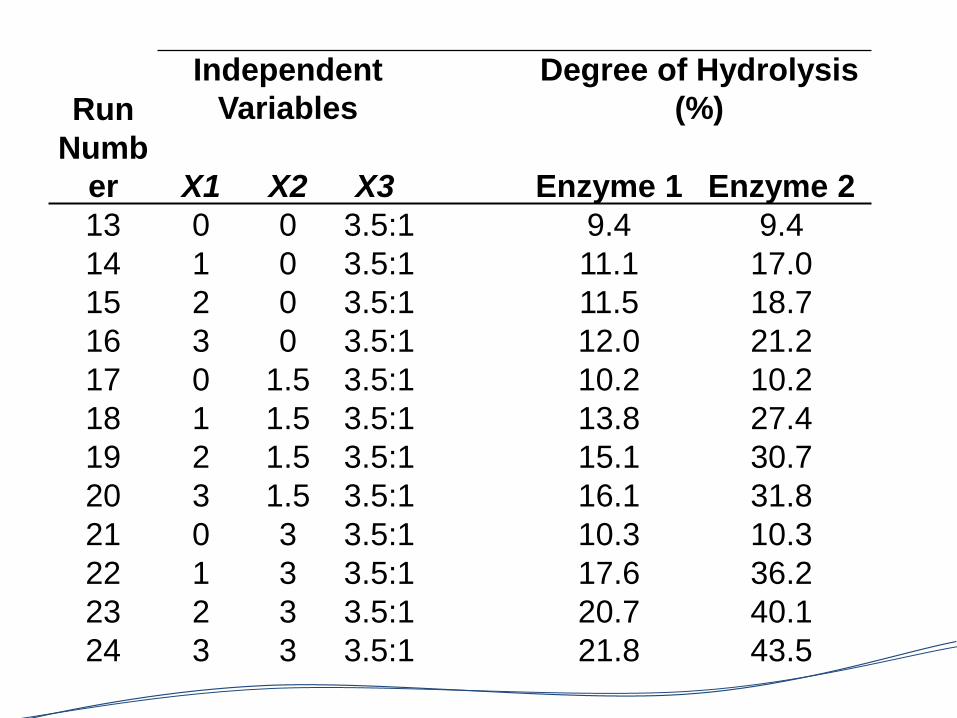
Run
Independent
Variables
Degree of Hydrolysis
(%)
Numb
er X1 X2 X3 Enzyme 1 Enzyme 2
13 0 0 3.5:1 9.4 9.4
14 1 0 3.5:1 11.1 17.0
15 2 0 3.5:1 11.5 18.7
16 3 0 3.5:1 12.0 21.2
17 0 1.5 3.5:1 10.2 10.2
18 1 1.5 3.5:1 13.8 27.4
19 2 1.5 3.5:1 15.1 30.7
20 3 1.5 3.5:1 16.1 31.8
21 0 3 3.5:1 10.3 10.3
22 1 3 3.5:1 17.6 36.2
23 2 3 3.5:1 20.7 40.1
24 3 3 3.5:1 21.8 43.5
Page 41
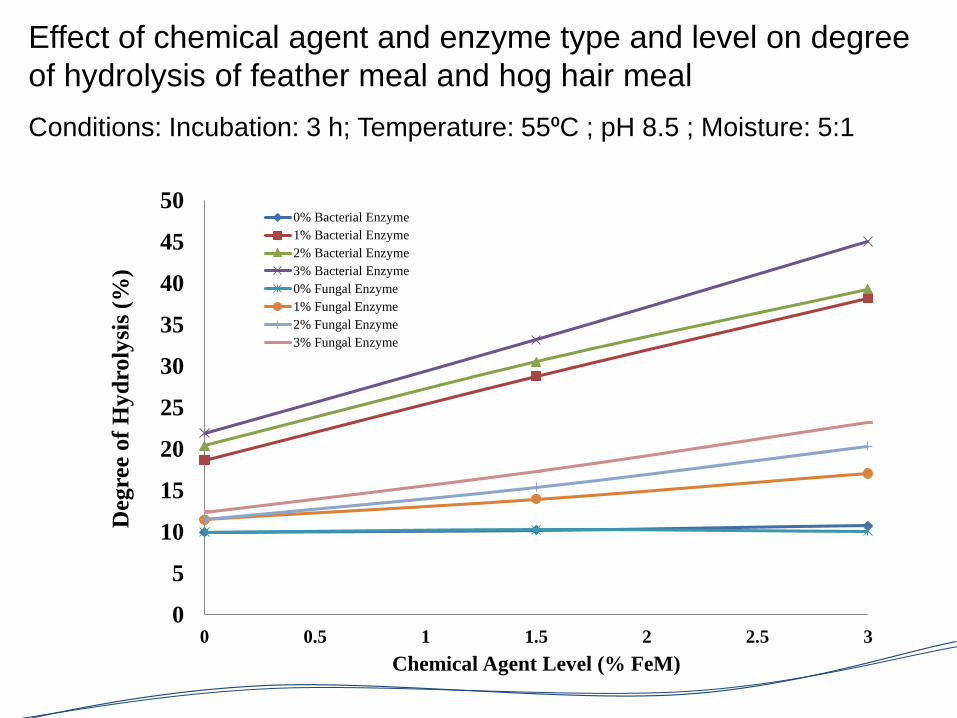
Effect of chemical agent and enzyme type and level on degree
of hydrolysis of feather meal and hog hair meal
Conditions: Incubation: 3 h; Temperature: 55⁰C ; pH 8.5 ; Moisture: 5:1
0
5
10
15
20
25
30
35
40
45
50
0 0.5 1 1.5 2 2.5 3
Deg
ree o
f H
yd
roly
sis
(%)
Chemical Agent Level (% FeM)
0% Bacterial Enzyme
1% Bacterial Enzyme
2% Bacterial Enzyme
3% Bacterial Enzyme
0% Fungal Enzyme
1% Fungal Enzyme
2% Fungal Enzyme
3% Fungal Enzyme
Page 42
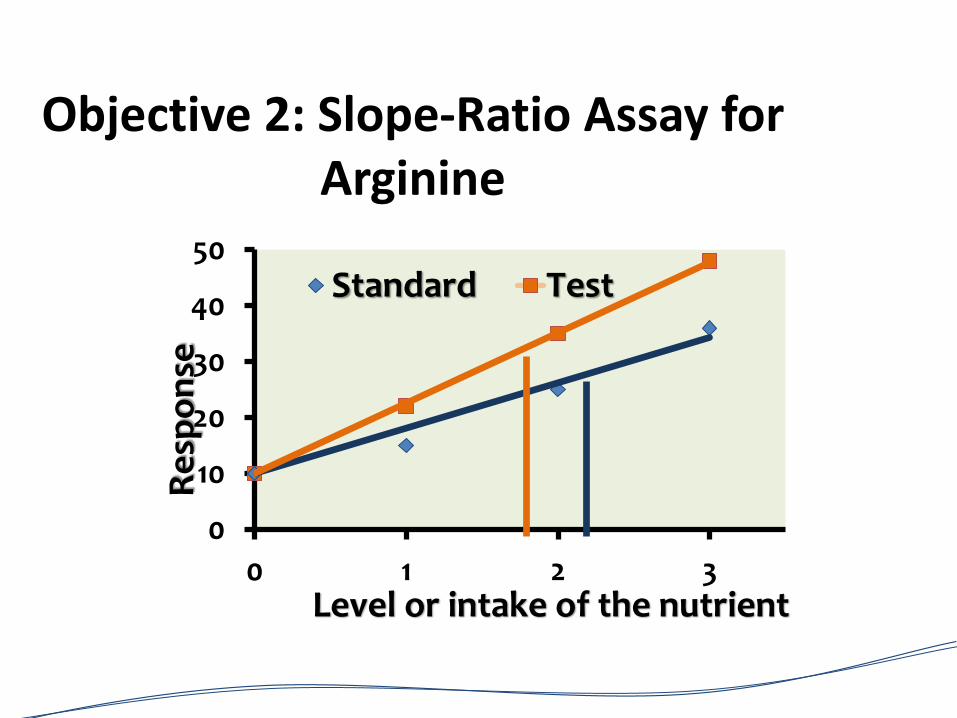
Objective 2: Slope-Ratio Assay for Arginine
0
10
20
30
40
50
0 1 2 3
Re
spo
nse
Level or intake of the nutrient
Standard Test
Page 43
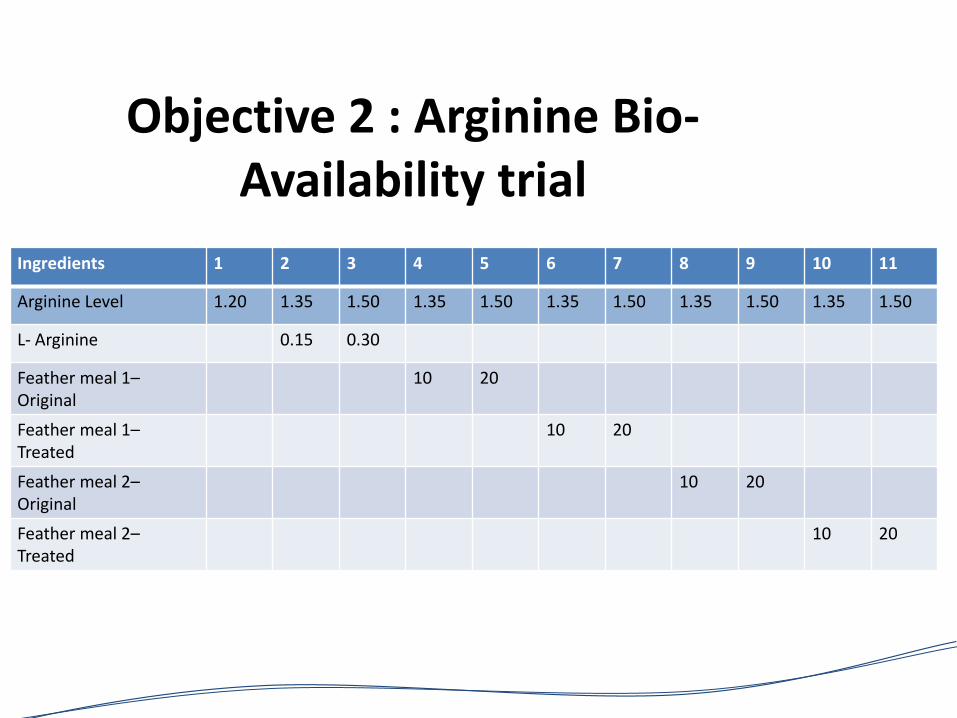
Objective 2 : Arginine Bio-Availability trial
Ingredients 1 2 3 4 5 6 7 8 9 10 11
Arginine Level 1.20 1.35 1.50 1.35 1.50 1.35 1.50 1.35 1.50 1.35 1.50
L- Arginine 0.15 0.30
Feather meal 1–Original
10 20
Feather meal 1–Treated
10 20
Feather meal 2–Original
10 20
Feather meal 2–Treated
10 20
Page 44
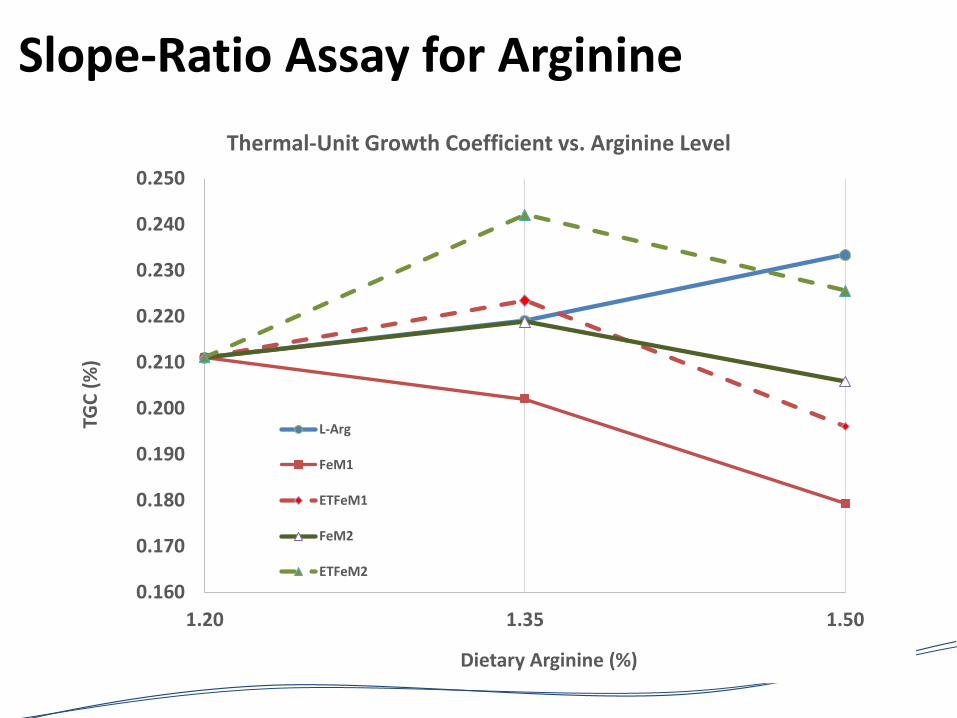
Slope-Ratio Assay for Arginine
0.160
0.170
0.180
0.190
0.200
0.210
0.220
0.230
0.240
0.250
1.20 1.35 1.50
TGC
(%
)
Dietary Arginine (%)
Thermal-Unit Growth Coefficient vs. Arginine Level
L-Arg
FeM1
ETFeM1
FeM2
ETFeM2
Page 45
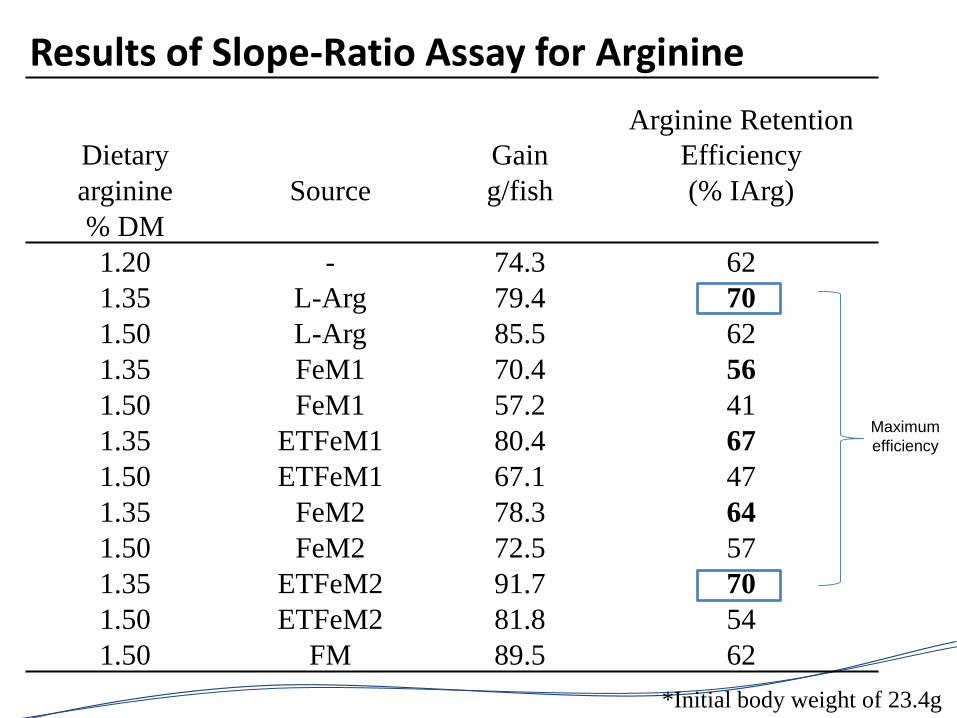
Results of Slope-Ratio Assay for Arginine
*Initial body weight of 23.4g
Dietary Gain
Arginine Retention
Efficiency
arginine Source g/fish (% IArg)
% DM
1.20 - 74.3 62
1.35 L-Arg 79.4 70
1.50 L-Arg 85.5 62
1.35 FeM1 70.4 56
1.50 FeM1 57.2 41
1.35 ETFeM1 80.4 67
1.50 ETFeM1 67.1 47
1.35 FeM2 78.3 64
1.50 FeM2 72.5 57
1.35 ETFeM2 91.7 70
1.50 ETFeM2 81.8 54
1.50 FM 89.5 62
Maximum
efficiency
Page 46
Guidelines / Limitations
• No need to do what the animal can do themselves
• Pay attention to experimental design
• Pay attention to cost-effectiveness
• Something digestible is not necessarily bio-available or useful
• Be careful of experimental artefact • What you measure may not be true
• Pay attention to the chemistry
Page 47
Thanks for your attention
Questions/comments