42
Sara Pasqualetti PREANALYTICAL AND ANALYTICAL ASPECTS AFFECTING CLINICAL RELIABILITY OF PLASMA GLUCOSE RESULTS
Sara Pasqualetti
PREANALYTICAL AND ANALYTICAL ASPECTS
AFFECTING CLINICAL RELIABILITY OF
PLASMA GLUCOSE RESULTS
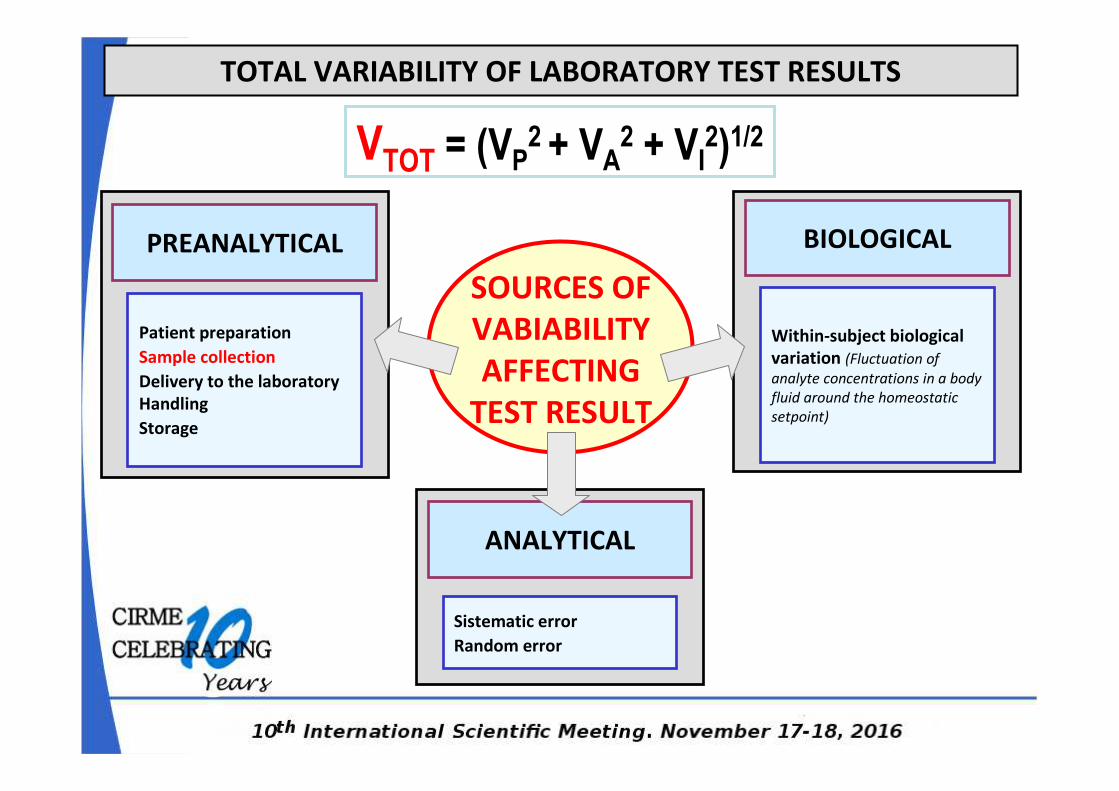
ANALYTICAL
PREANALYTICAL
SOURCES OF
VABIABILITY
AFFECTING
TEST RESULT
BIOLOGICAL
TOTAL VARIABILITY OF LABORATORY TEST RESULTS
Patient preparation
Sample collection
Delivery to the laboratory
Handling
Storage
Sistematic error
Random error
Within-subject biological
variation (Fluctuation of
analyte concentrations in a body
fluid around the homeostatic
setpoint)
VTOT = (VP2 + VA
2 + VI2)1/2
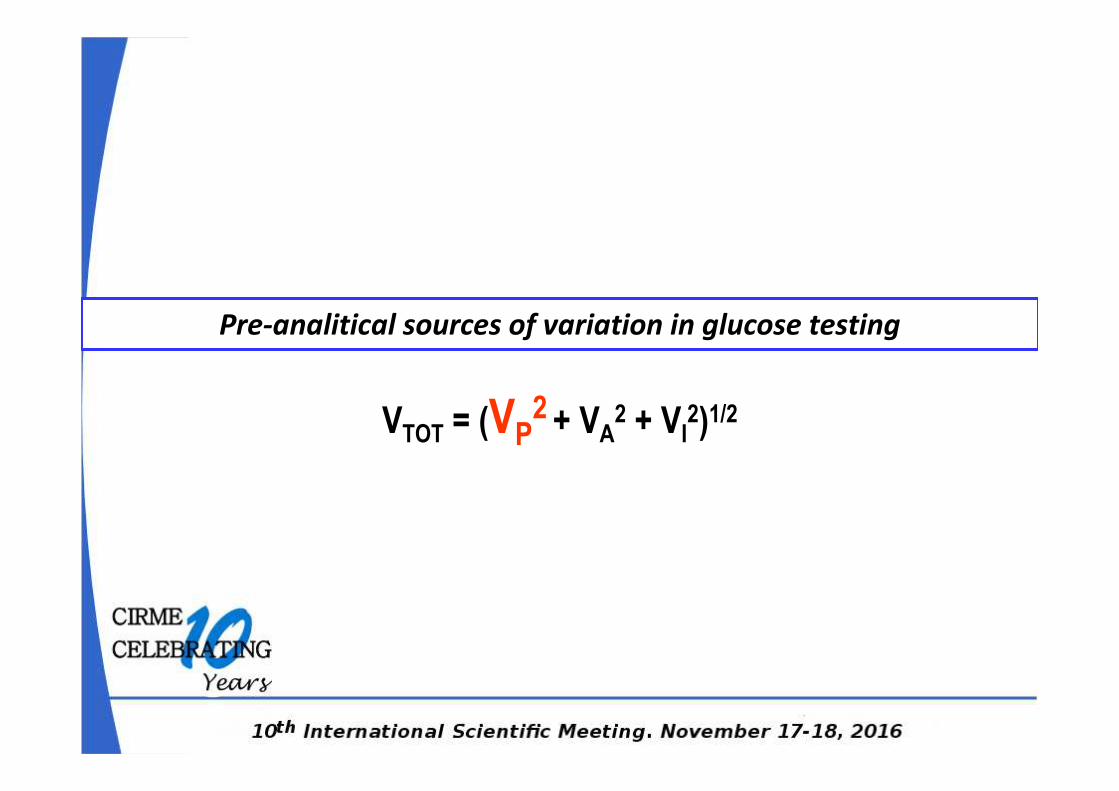
Pre-analitical sources of variation in glucose testing
VTOT = (VP2 + VA
2 + VI2)1/2
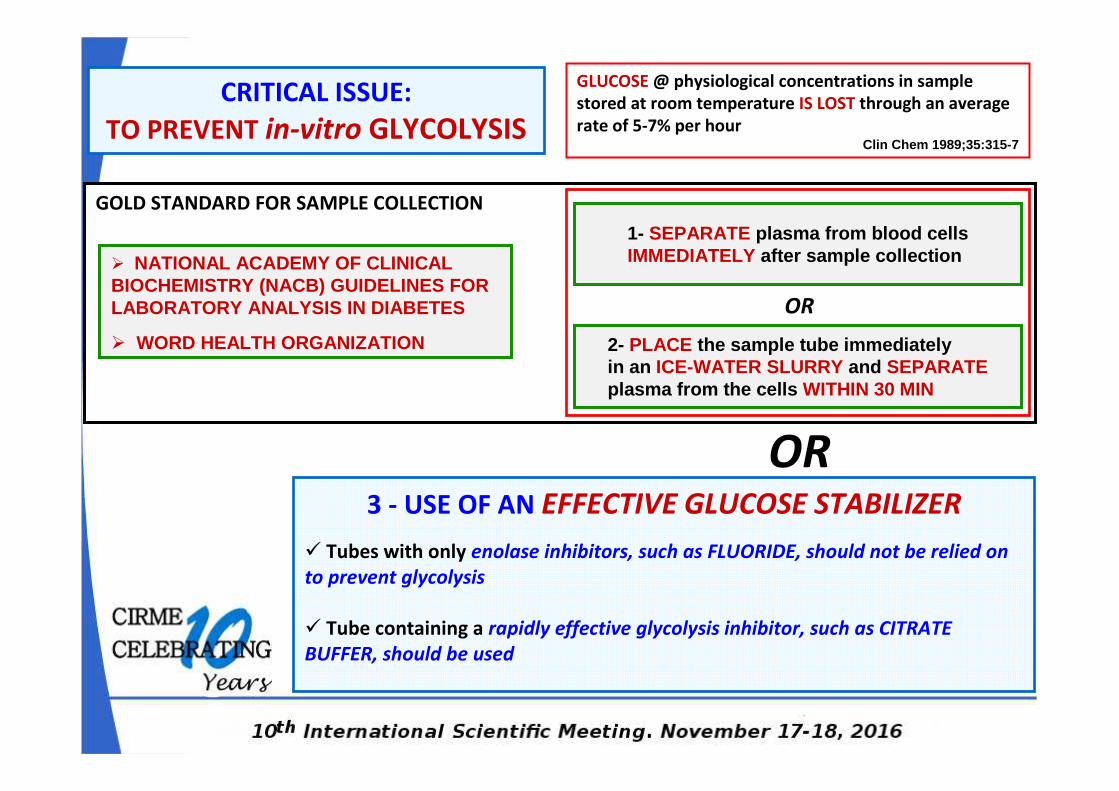
GOLD STANDARD FOR SAMPLE COLLECTION
CRITICAL ISSUE:
TO PREVENT in-vitro GLYCOLYSIS
GLUCOSE @ physiological concentrations in sample
stored at room temperature IS LOST through an average
rate of 5-7% per hourClin Chem 1989;35:315-7
3 - USE OF AN EFFECTIVE GLUCOSE STABILIZER
� Tubes with only enolase inhibitors, such as FLUORIDE, should not be relied on
to prevent glycolysis
� Tube containing a rapidly effective glycolysis inhibitor, such as CITRATE
BUFFER, should be used
� NATIONAL ACADEMY OF CLINICAL BIOCHEMISTRY (NACB) GUIDELINES FOR LABORATORY ANALYSIS IN DIABETES
� WORD HEALTH ORGANIZATION
1- SEPARATE plasma from blood cellsIMMEDIATELY after sample collection
2- PLACE the sample tube immediately in an ICE-WATER SLURRY and SEPARATEplasma from the cells WITHIN 30 MIN
OR
OR
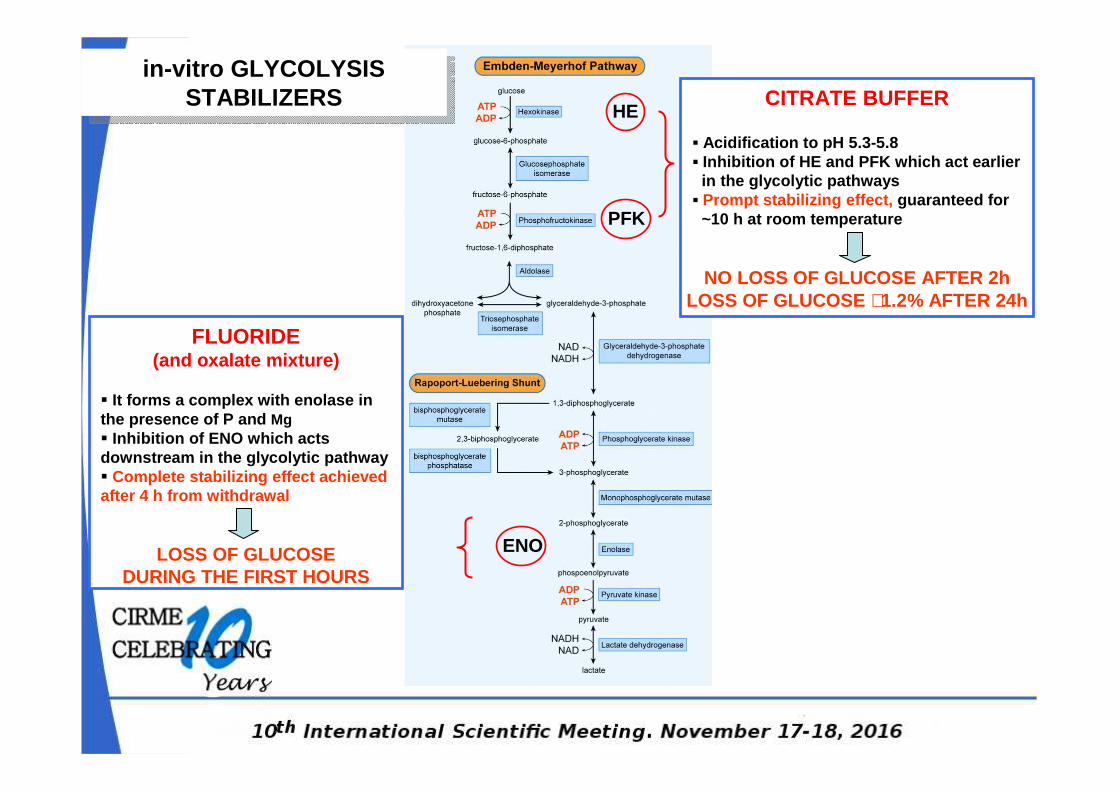
CITRATE BUFFER
▪ Acidification to pH 5.3-5.8 ▪ Inhibition of HE and PFK which act earlier
in the glycolytic pathways ▪ Prompt stabilizing effect, guaranteed for
~10 h at room temperature
NO LOSS OF GLUCOSE AFTER 2h LOSS OF GLUCOSE ∼1.2% AFTER 24h
FLUORIDE (and oxalate mixture)
� It forms a complex with enolase in the presence of P and Mg� Inhibition of ENO which acts downstream in the glycolytic pathway� Complete stabilizing effect achieved after 4 h from withdrawal
LOSS OF GLUCOSE DURING THE FIRST HOURS
PFK
ENO
in-vitro GLYCOLYSIS STABILIZERS
in-vitro GLYCOLYSIS STABILIZERS
HE
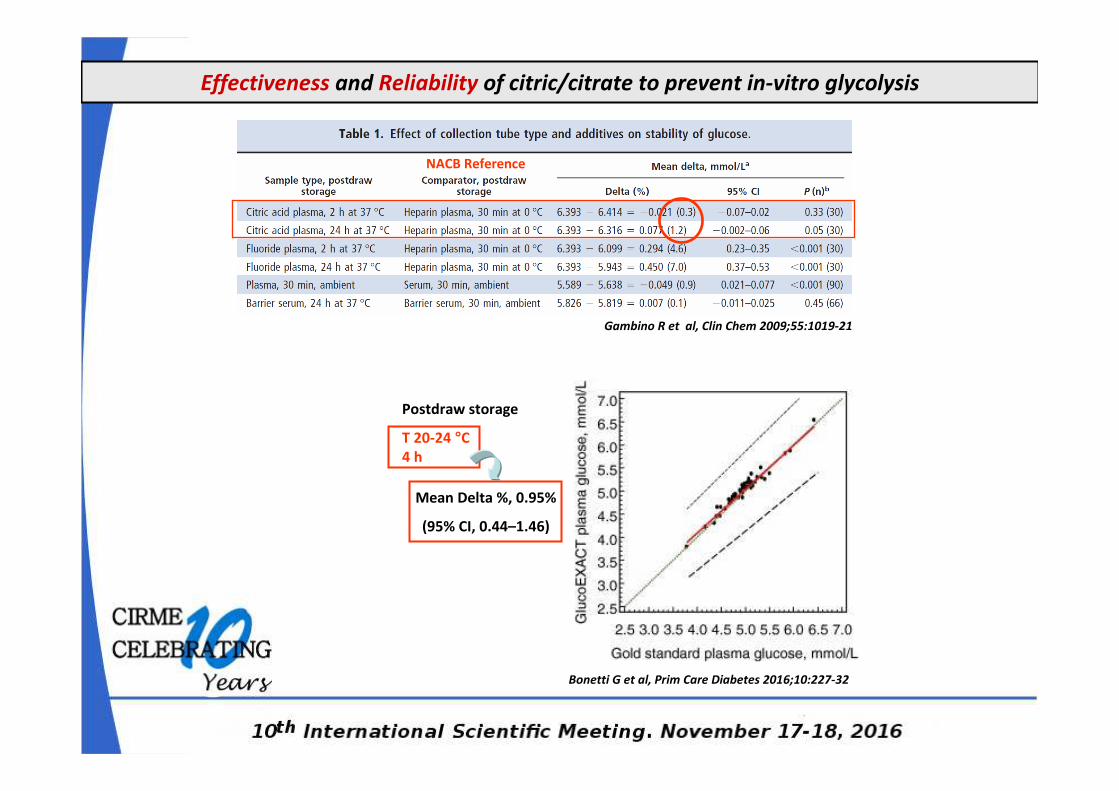
Effectiveness and Reliability of citric/citrate to prevent in-vitro glycolysis
Bonetti G et al, Prim Care Diabetes 2016;10:227-32
Gambino R et al, Clin Chem 2009;55:1019-21
NACB Reference
Postdraw storage
T 20-24 °C
4 h
Mean Delta %, 0.95%
(95% CI, 0.44–1.46)
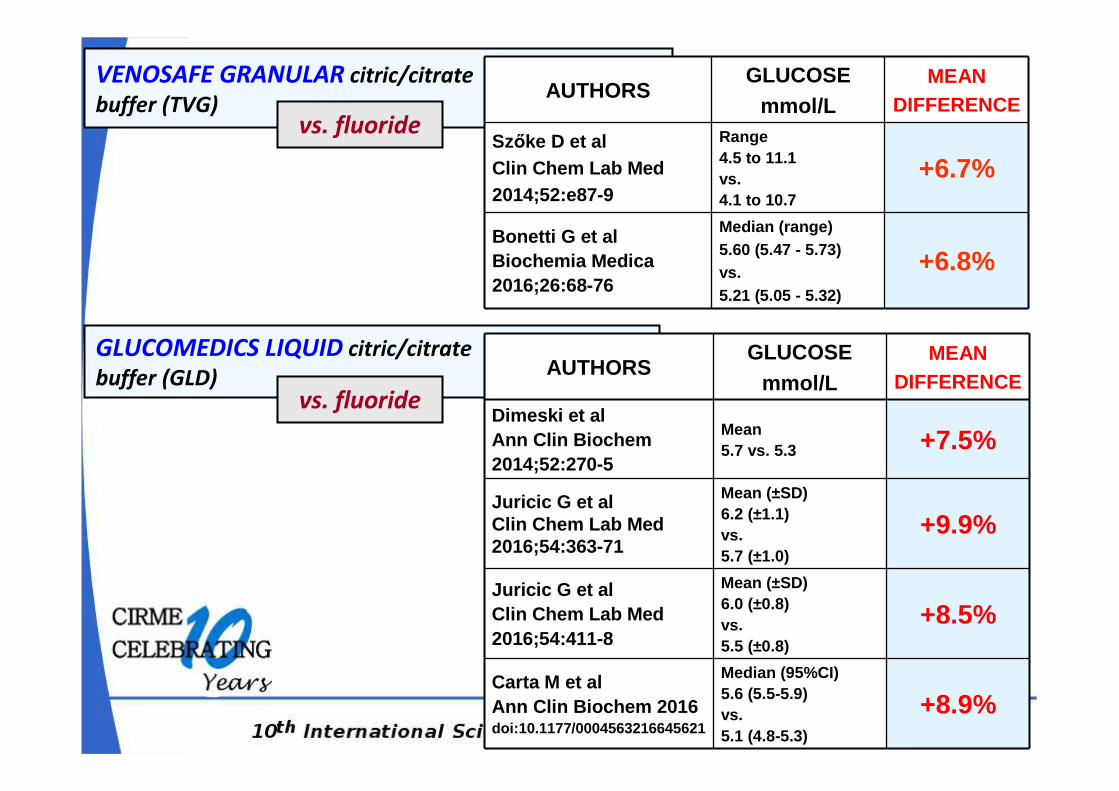
VENOSAFE GRANULAR citric/citrate
buffer (TVG)AUTHORS
GLUCOSEmmol/L
MEANDIFFERENCE
Szőke D et alClin Chem Lab Med2014;52:e87-9
Range4.5 to 11.1vs.4.1 to 10.7
+6.7%
Bonetti G et alBiochemia Medica2016;26:68-76
Median (range)5.60 (5.47 - 5.73)vs.5.21 (5.05 - 5.32)
+6.8%
GLUCOMEDICS LIQUID citric/citrate
buffer (GLD) AUTHORSGLUCOSE
mmol/LMEAN
DIFFERENCE
Dimeski et alAnn Clin Biochem2014;52:270-5
Mean5.7 vs. 5.3 +7.5%
Juricic G et alClin Chem Lab Med2016;54:363-71
Mean (±SD) 6.2 (±1.1)vs. 5.7 (±1.0)
+9.9%
Juricic G et alClin Chem Lab Med2016;54:411-8
Mean (±SD) 6.0 (±0.8)vs. 5.5 (±0.8)
+8.5%
Carta M et alAnn Clin Biochem 2016doi:10.1177/0004563216645621
Median (95%CI)5.6 (5.5-5.9)vs.5.1 (4.8-5.3)
+8.9%
vs. fluoride
vs. fluoride
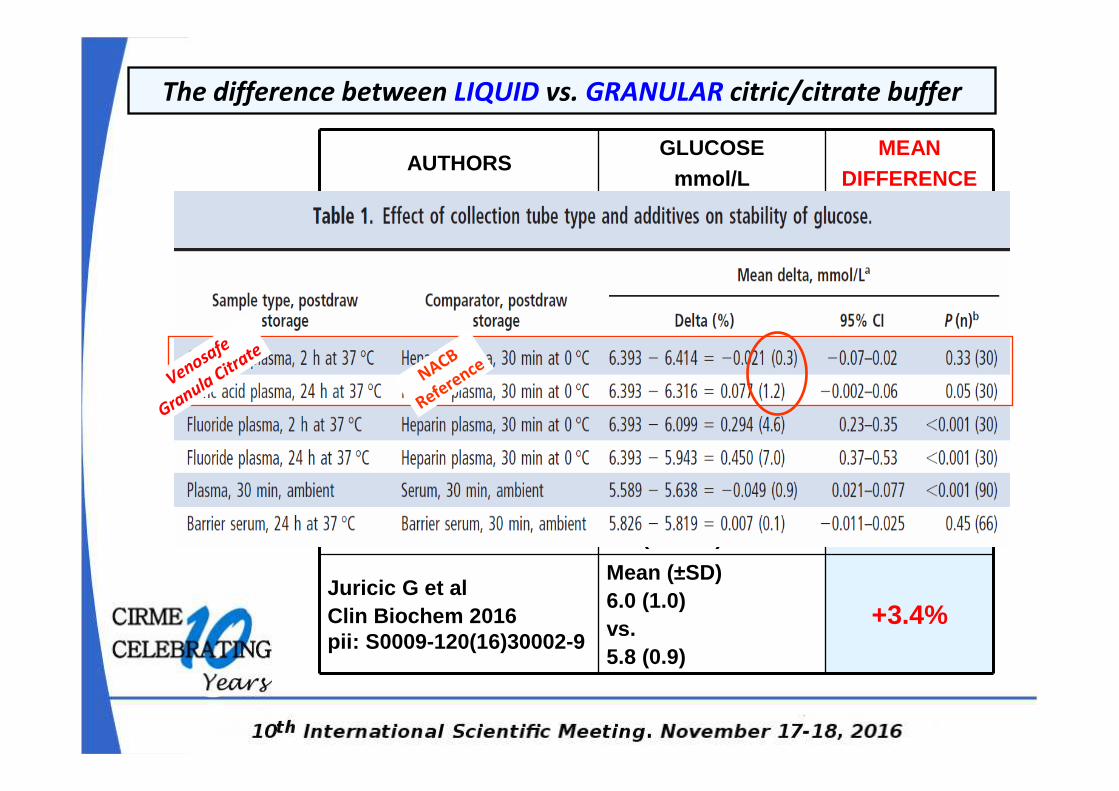
The difference between LIQUID vs. GRANULAR citric/citrate buffer
AUTHORSGLUCOSE
mmol/LMEAN
DIFFERENCE
Juricic G et alClin Chem Lab Med2015;53:eA226-P46
Mean (±SD) 5.8 (0.8) vs. 5.6 (0.7)
+3.2%
Pasqualetti S et alClin Chem Lab Med2016;54:e281-3
Range 4.1- 22.7vs.4.0-21.9
+3.8%
Carta M et alAnn Clin Biochem 2016doi:10.1177/0004563216645621
Median (95% CI)5.6 (5.5-5.9) vs.5.4 (5.1-5.7)
+3.7%
Juricic G et alClin Biochem 2016pii: S0009-120(16)30002-9
Mean (±SD) 6.0 (1.0)vs.5.8 (0.9)
+3.4%
NACB
Reference
Venosafe
Granula Citr
ate
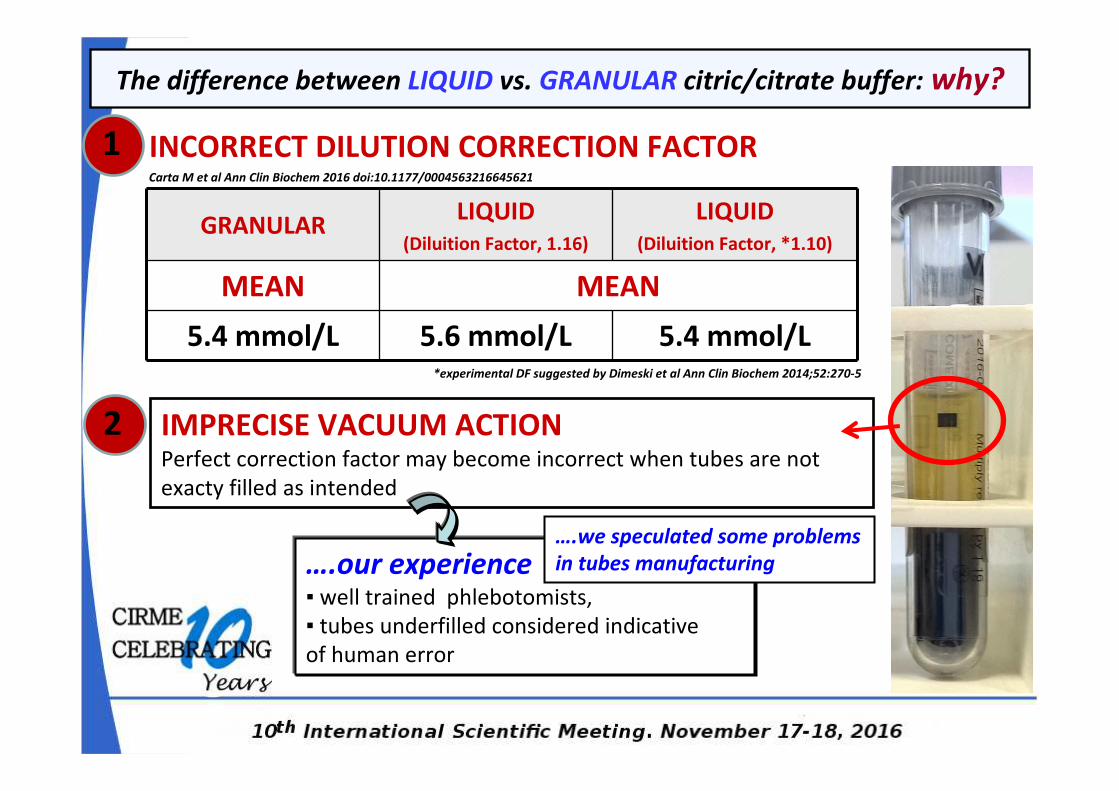
The difference between LIQUID vs. GRANULAR citric/citrate buffer: why?
IMPRECISE VACUUM ACTIONPerfect correction factor may become incorrect when tubes are not
exacty filled as intended
Carta M et al Ann Clin Biochem 2016 doi:10.1177/0004563216645621
2
GRANULARLIQUID
(Diluition Factor, 1.16)
LIQUID
(Diluition Factor, *1.10)
MEAN MEAN
5.4 mmol/L 5.6 mmol/L 5.4 mmol/L*experimental DF suggested by Dimeski et al Ann Clin Biochem 2014;52:270-5
1
….our experience▪ well trained phlebotomists,
▪ tubes underfilled considered indicative
of human error
INCORRECT DILUTION CORRECTION FACTOR
….we speculated some problems
in tubes manufacturing
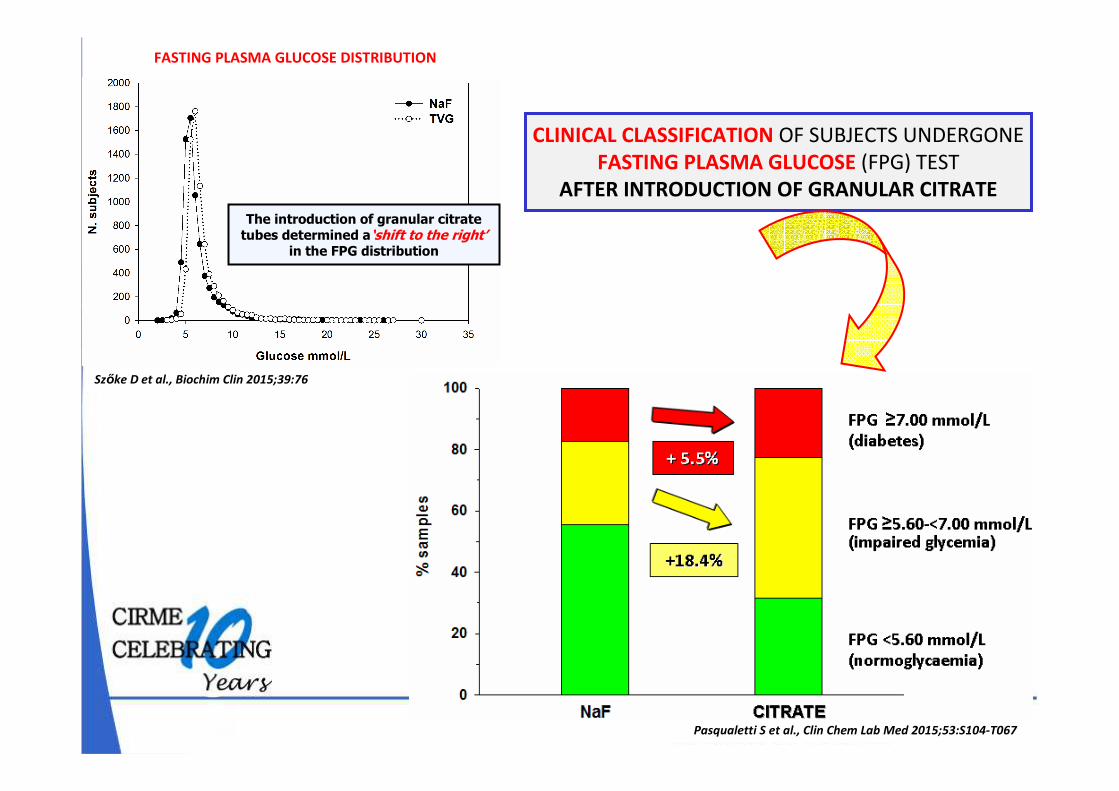
Szőke D et al., Biochim Clin 2015;39:76
CLINICAL CLASSIFICATION OF SUBJECTS UNDERGONE
FASTING PLASMA GLUCOSE (FPG) TEST
AFTER INTRODUCTION OF GRANULAR CITRATE
Pasqualetti S et al., Clin Chem Lab Med 2015;53:S104-T067
The introduction of granular citrate tubes determined a‘shift to the right’
in the FPG distribution
FASTING PLASMA GLUCOSE DISTRIBUTION
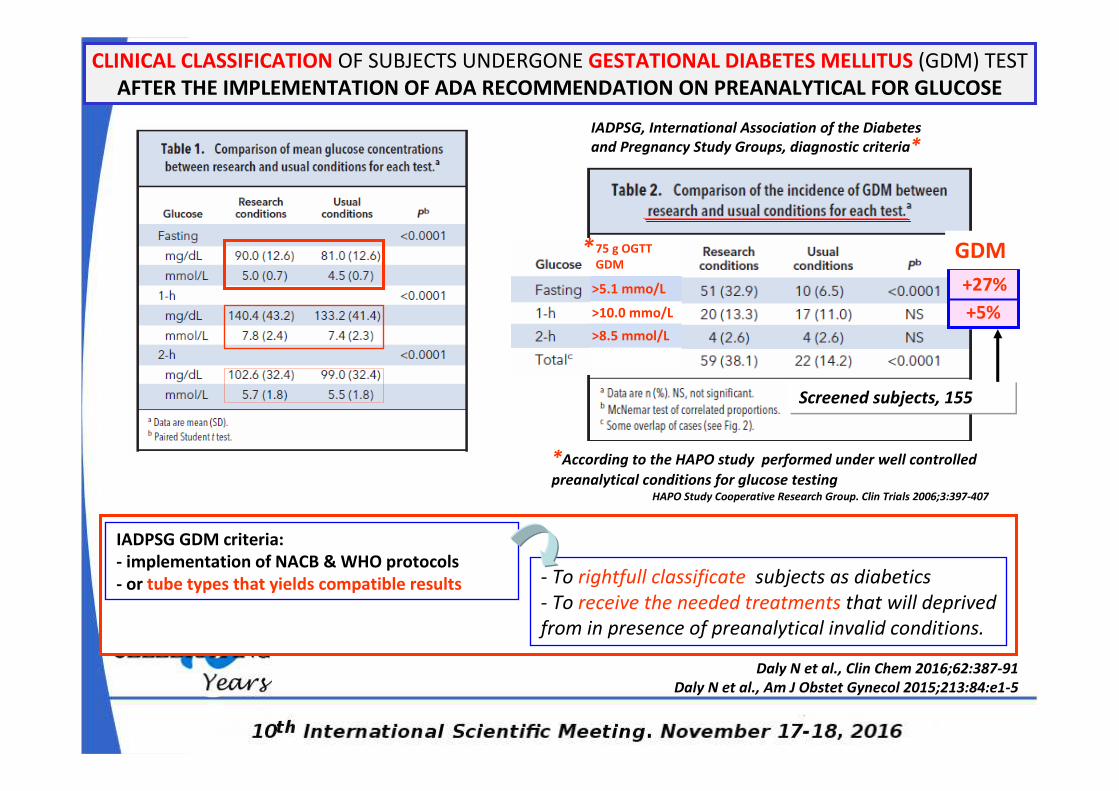
CLINICAL CLASSIFICATION OF SUBJECTS UNDERGONE GESTATIONAL DIABETES MELLITUS (GDM) TEST
AFTER THE IMPLEMENTATION OF ADA RECOMMENDATION ON PREANALYTICAL FOR GLUCOSE
Daly N et al., Clin Chem 2016;62:387-91
Daly N et al., Am J Obstet Gynecol 2015;213:84:e1-5
IADPSG GDM criteria:
- implementation of NACB & WHO protocols
- or tube types that yields compatible results
Screened subjects, 155
+27%
+5%
*According to the HAPO study performed under well controlled
preanalytical conditions for glucose testingHAPO Study Cooperative Research Group. Clin Trials 2006;3:397-407
75 g OGTT
GDM
>5.1 mmo/L
>10.0 mmo/L
>8.5 mmol/L
IADPSG, International Association of the Diabetes
and Pregnancy Study Groups, diagnostic criteria*
*
- To rightfull classificate subjects as diabetics
- To receive the needed treatments that will deprived
from in presence of preanalytical invalid conditions.
GDM
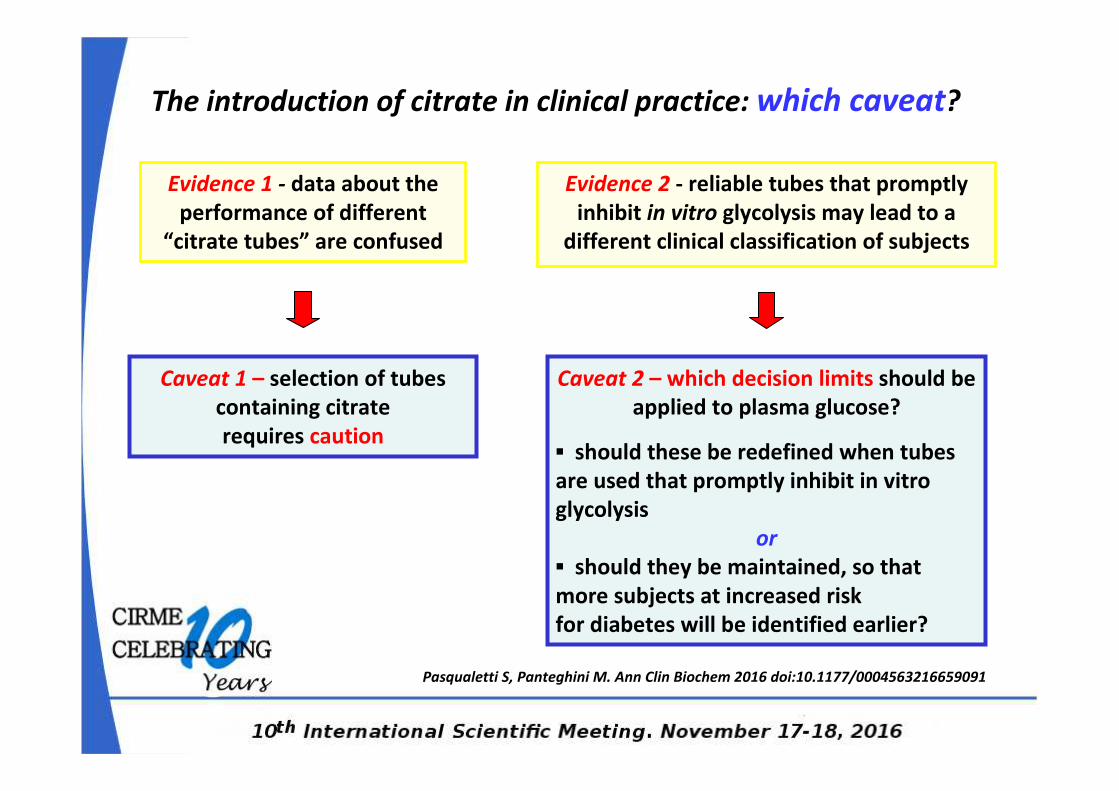
The introduction of citrate in clinical practice: which caveat?
Evidence 1 - data about the
performance of different
“citrate tubes” are confused
Caveat 1 – selection of tubes
containing citrate
requires caution
Evidence 2 - reliable tubes that promptly
inhibit in vitro glycolysis may lead to a
different clinical classification of subjects
Caveat 2 – which decision limits should be
applied to plasma glucose?
▪ should these be redefined when tubes
are used that promptly inhibit in vitro
glycolysis
or
▪ should they be maintained, so that
more subjects at increased risk
for diabetes will be identified earlier?
Pasqualetti S, Panteghini M. Ann Clin Biochem 2016 doi:10.1177/0004563216659091
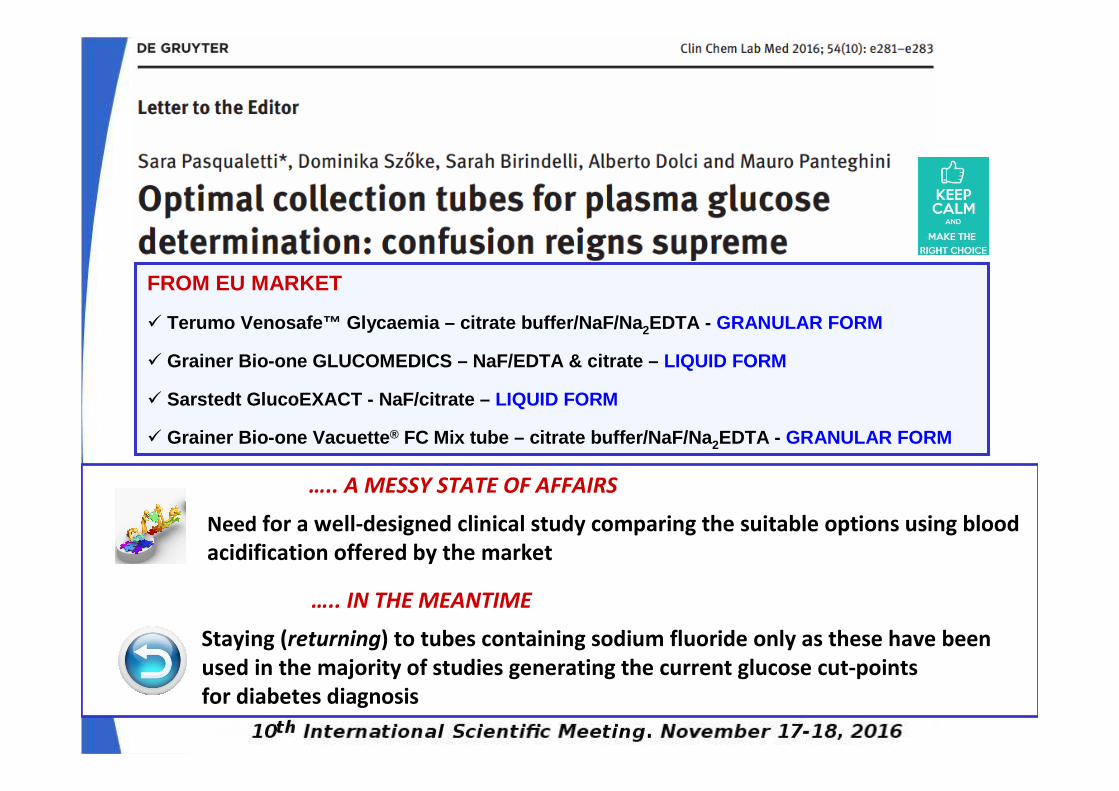
….. A MESSY STATE OF AFFAIRS
Need for a well-designed clinical study comparing the suitable options using blood
acidification offered by the market
….. IN THE MEANTIME
Staying (returning) to tubes containing sodium fluoride only as these have been
used in the majority of studies generating the current glucose cut-points
for diabetes diagnosis
FROM EU MARKET
� Terumo Venosafe™ Glycaemia – citrate buffer/NaF/Na 2EDTA - GRANULAR FORM
� Grainer Bio-one GLUCOMEDICS – NaF/EDTA & citrate – LIQUID FORM
� Sarstedt GlucoEXACT - NaF/citrate – LIQUID FORM
� Grainer Bio-one Vacuette ® FC Mix tube – citrate buffer/NaF/Na 2EDTA - GRANULAR FORM
Plasma Glucose and its Biological Variation
VTOT = (VP2 + VA
2 + VI2)1/2
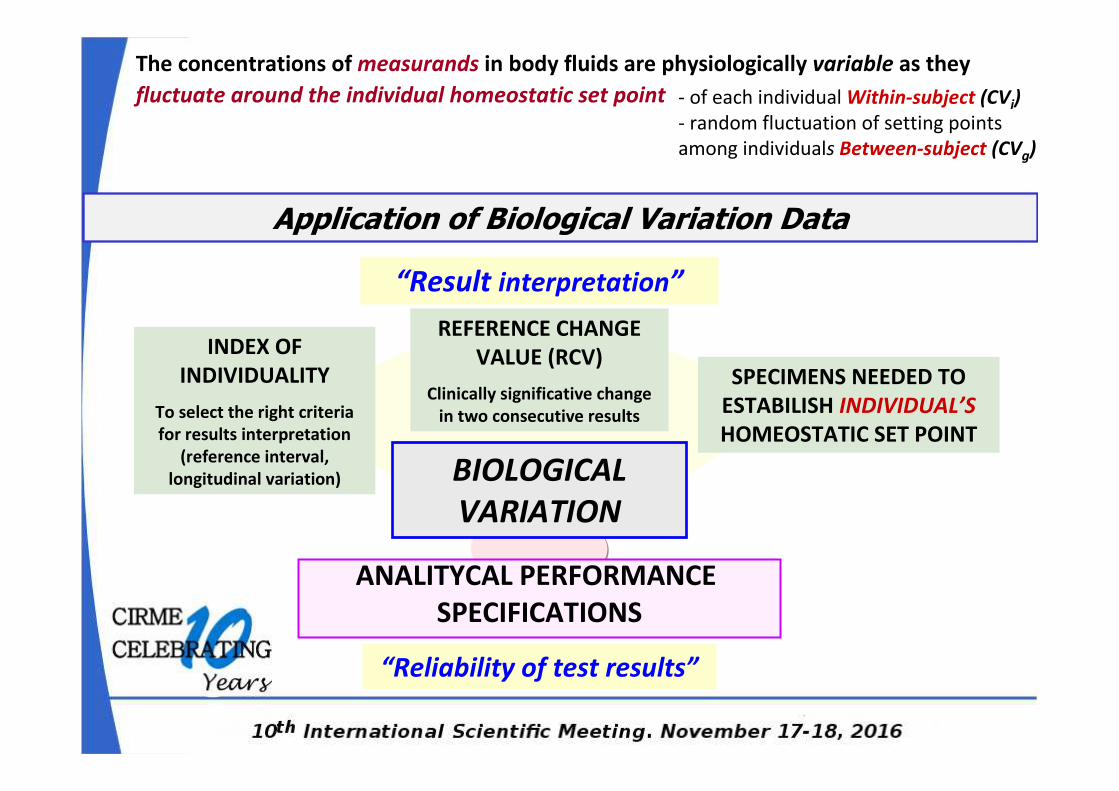
ANALITYCAL PERFORMANCE
SPECIFICATIONS
BIOLOGICAL
VARIATION
INDEX OF
INDIVIDUALITY
To select the right criteria
for results interpretation
(reference interval,
longitudinal variation)
REFERENCE CHANGE
VALUE (RCV)
Clinically significative change
in two consecutive results
SPECIMENS NEEDED TO
ESTABILISH INDIVIDUAL’S
HOMEOSTATIC SET POINT
“Result interpretation”
“Reliability of test results”
The concentrations of measurands in body fluids are physiologically variable as they
fluctuate around the individual homeostatic set point - of each individual Within-subject (CVi)
- random fluctuation of setting points
among individuals Between-subject (CVg)
Application of Biological Variation Data
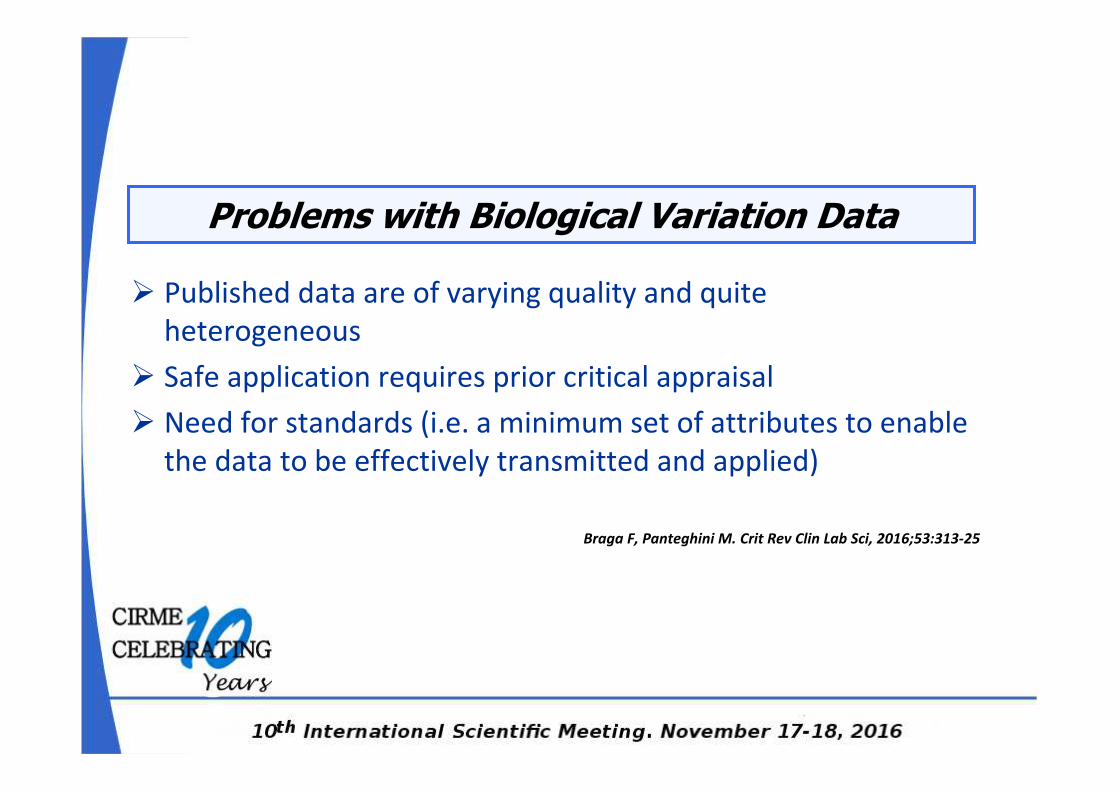
� Published data are of varying quality and quite
heterogeneous
� Safe application requires prior critical appraisal
� Need for standards (i.e. a minimum set of attributes to enable
the data to be effectively transmitted and applied)
Braga F, Panteghini M. Crit Rev Clin Lab Sci, 2016;53:313-25
Problems with Biological Variation Data
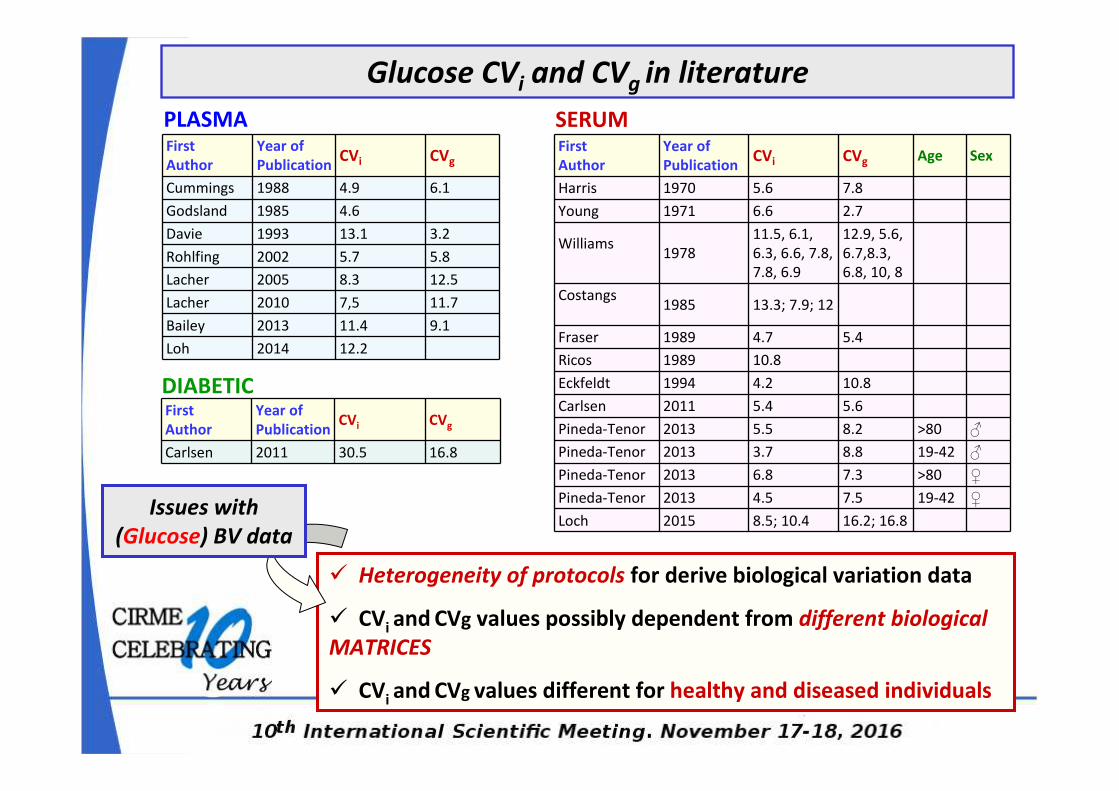
� Heterogeneity of protocols for derive biological variation data
� CVi and CVg values possibly dependent from different biological
MATRICES
� CVi and CVg values different for healthy and diseased individuals
Glucose CVi and CVg in literature
PLASMA SERUMFirst
Author
Year of
PublicationCVi CVg
Cummings 1988 4.9 6.1
Godsland 1985 4.6
Davie 1993 13.1 3.2
Rohlfing 2002 5.7 5.8
Lacher 2005 8.3 12.5
Lacher 2010 7,5 11.7
Bailey 2013 11.4 9.1
Loh 2014 12.2
First
Author
Year of
PublicationCVi CVg Age Sex
Harris 1970 5.6 7.8
Young 1971 6.6 2.7
Williams1978
11.5, 6.1,
6.3, 6.6, 7.8,
7.8, 6.9
12.9, 5.6,
6.7,8.3,
6.8, 10, 8
Costangs1985 13.3; 7.9; 12
Fraser 1989 4.7 5.4
Ricos 1989 10.8
Eckfeldt 1994 4.2 10.8
Carlsen 2011 5.4 5.6
Pineda-Tenor 2013 5.5 8.2 >80 ♂
Pineda-Tenor 2013 3.7 8.8 19-42 ♂
Pineda-Tenor 2013 6.8 7.3 >80 ♀
Pineda-Tenor 2013 4.5 7.5 19-42 ♀
Loch 2015 8.5; 10.4 16.2; 16.8Issues with
(Glucose) BV data
First
Author
Year of
PublicationCVi CVg
Carlsen 2011 30.5 16.8
DIABETIC
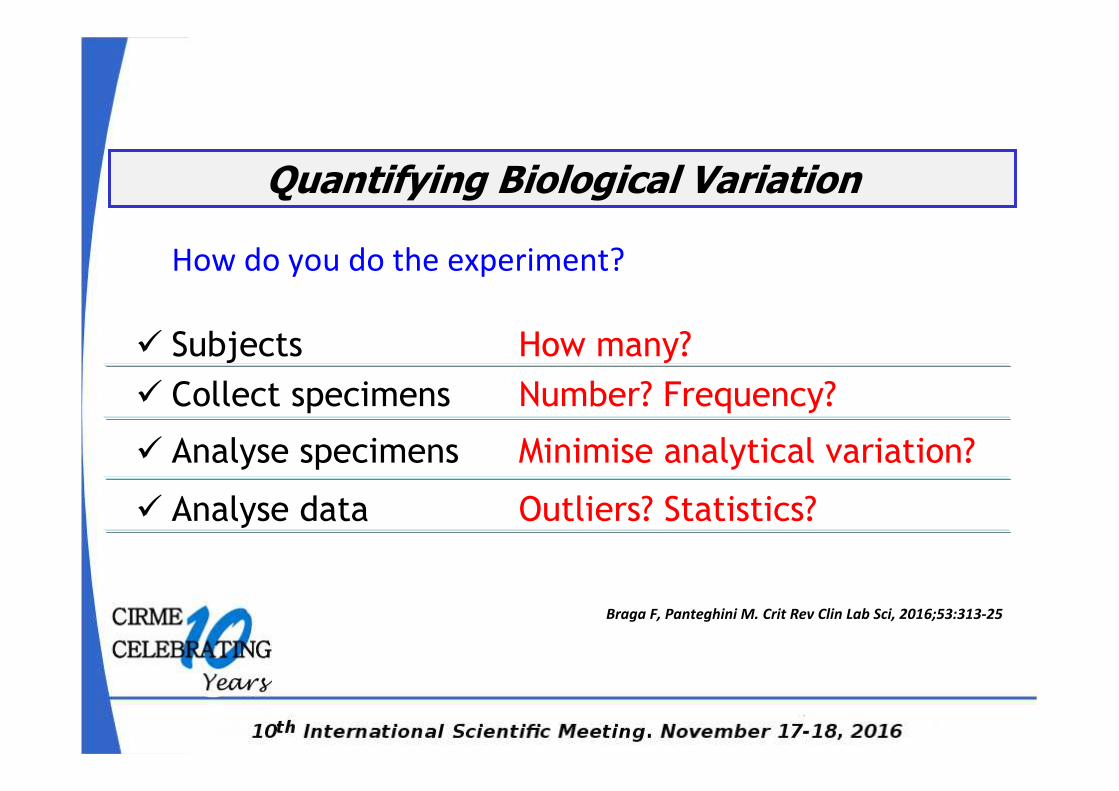
Quantifying Biological Variation
How do you do the experiment?
� Subjects How many?
� Collect specimens Number? Frequency?
� Analyse specimens Minimise analytical variation?
� Analyse data Outliers? Statistics?
Braga F, Panteghini M. Crit Rev Clin Lab Sci, 2016;53:313-25
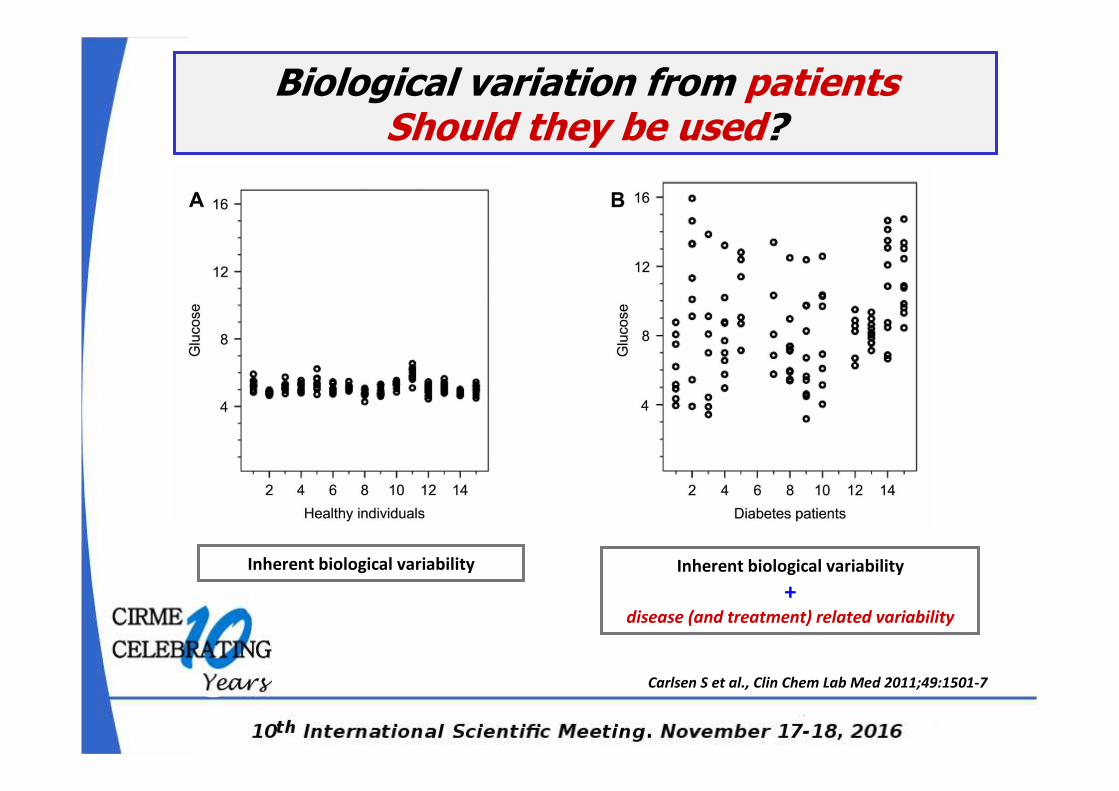
Biological variation from patientsShould they be used?
Inherent biological variability
+ disease (and treatment) related variability
Inherent biological variability
Carlsen S et al., Clin Chem Lab Med 2011;49:1501-7
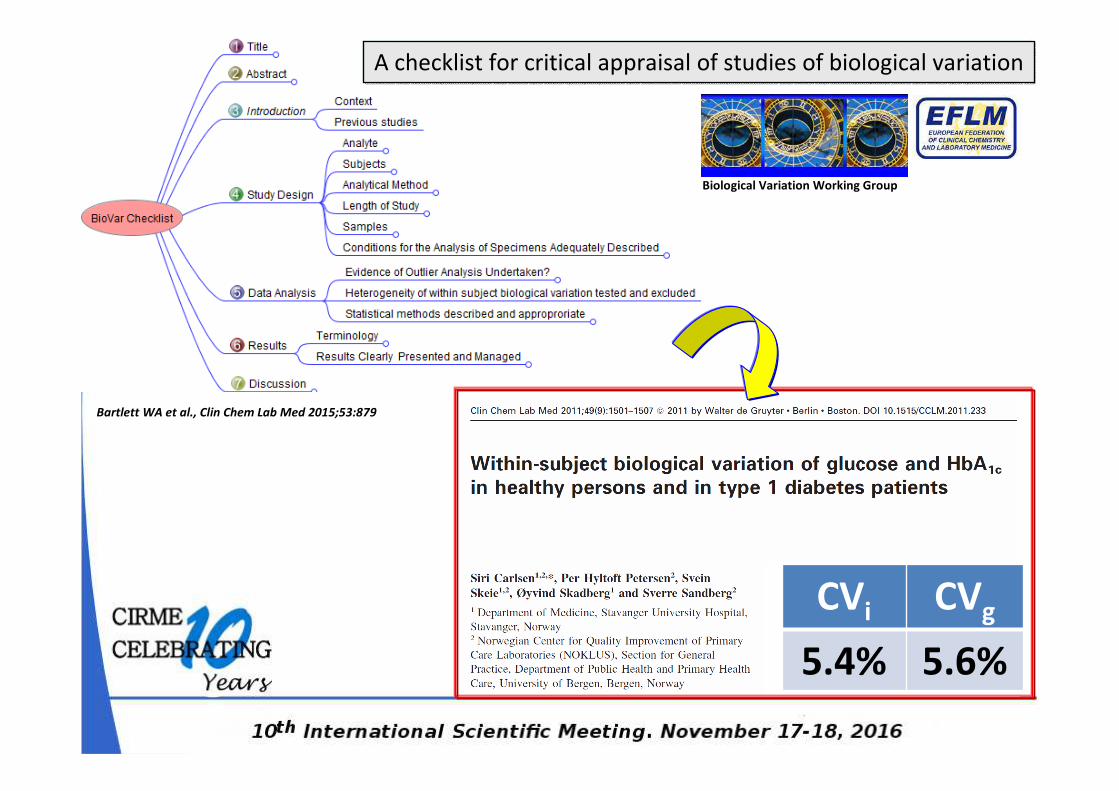
CVi CVg
5.4% 5.6%
Bartlett WA et al., Clin Chem Lab Med 2015;53:879
Biological Variation Working Group
A checklist for critical appraisal of studies of biological variation
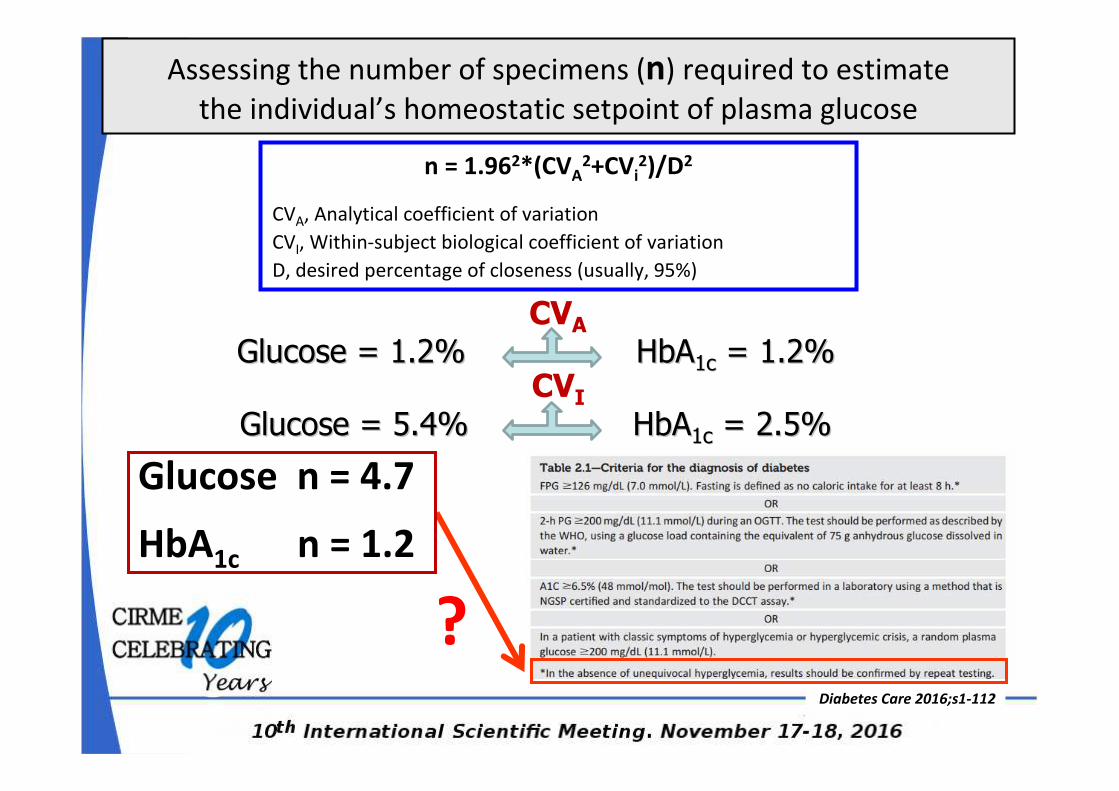
n = 1.962*(CVA2+CVi
2)/D2
CVA, Analytical coefficient of variation
CVI, Within-subject biological coefficient of variation
D, desired percentage of closeness (usually, 95%)
Assessing the number of specimens (n) required to estimate
the individual’s homeostatic setpoint of plasma glucose
Diabetes Care 2016;s1-112
CVA
Glucose = 1.2% Glucose = 1.2% HbAHbA1c1c = 1.2%= 1.2%
CVI
Glucose = 5.4% Glucose = 5.4% HbAHbA1c1c = 2.5%= 2.5%
HbA1c n = 1.2
Glucose n = 4.7
?
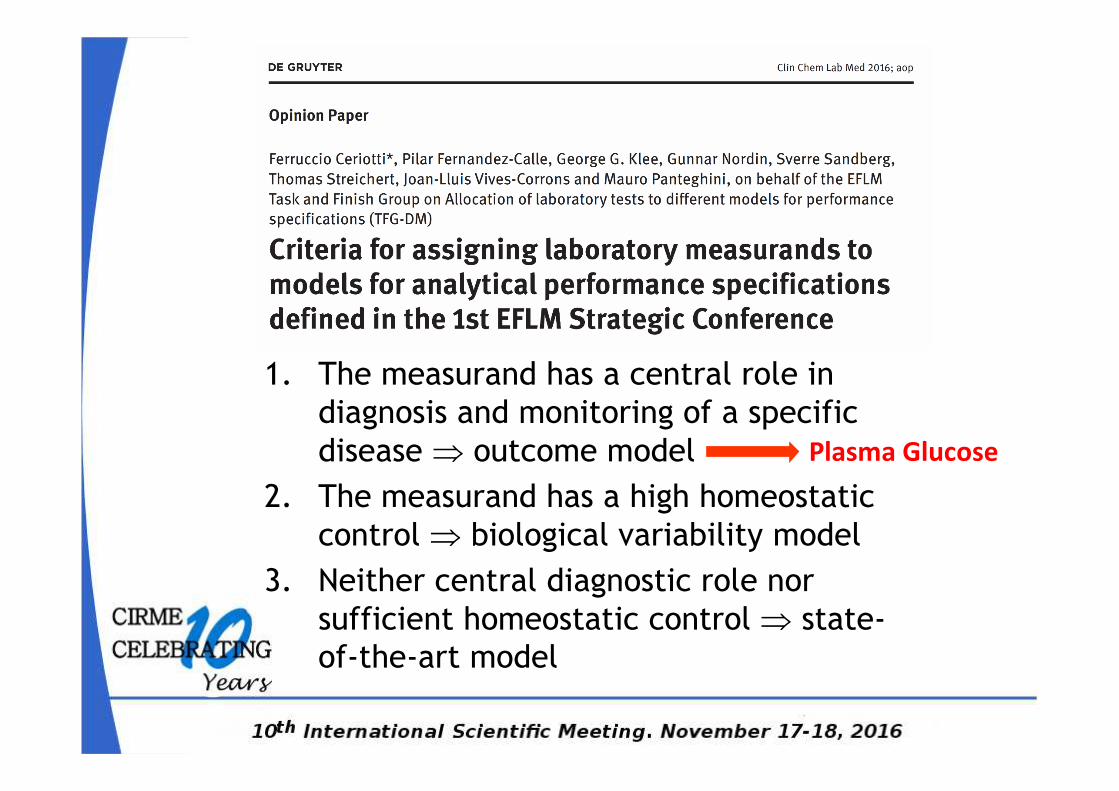
1. The measurand has a central role in
diagnosis and monitoring of a specific
disease ⇒ outcome model
2. The measurand has a high homeostatic
control ⇒ biological variability model
3. Neither central diagnostic role nor
sufficient homeostatic control ⇒ state-
of-the-art model
Plasma Glucose
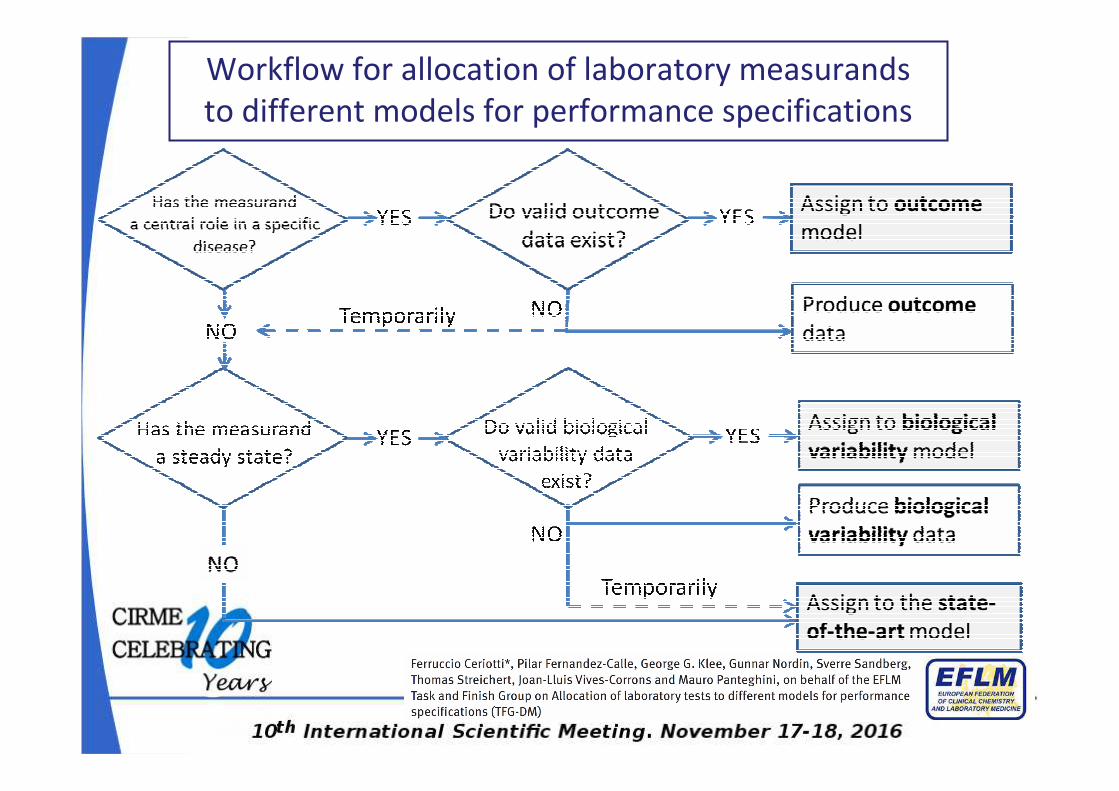
Workflow for allocation of laboratory measurands
to different models for performance specifications
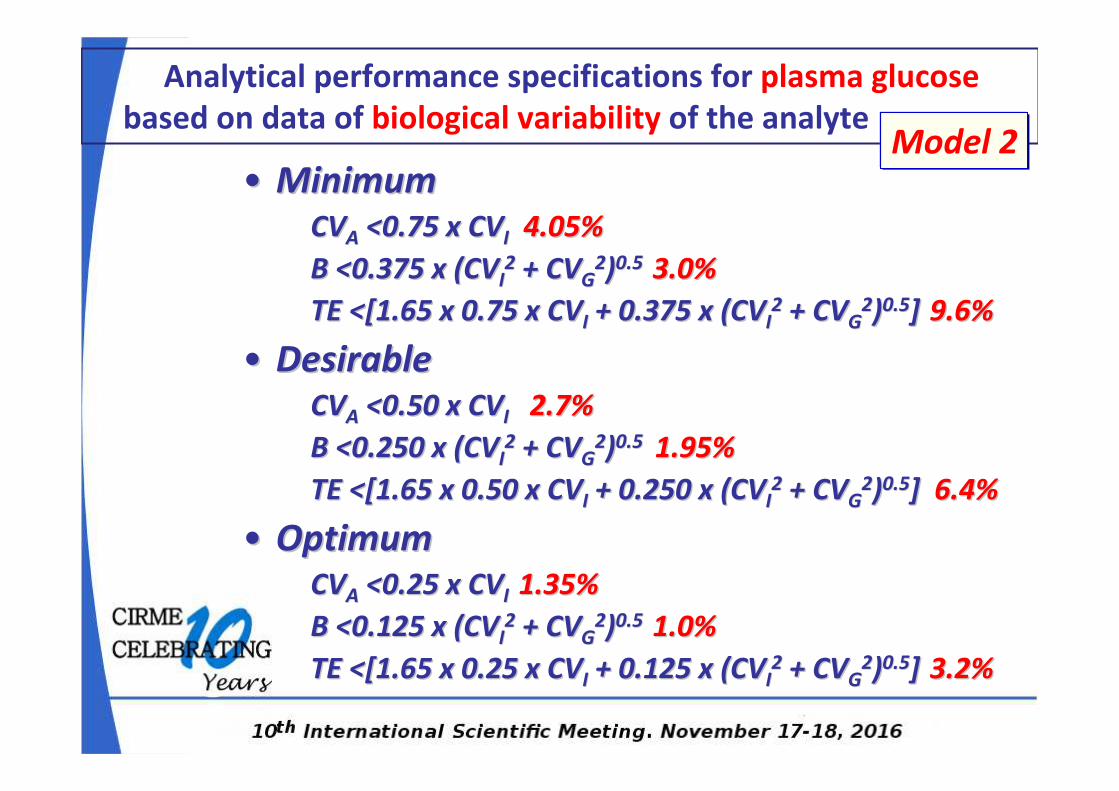
•• MinimumMinimumCVCVAA <0.75 x CV<0.75 x CVI I 4.05%4.05%
B <0.375 x (CVB <0.375 x (CVII22 + CV+ CVGG
22))0.5 0.5 3.0%3.0%
TE <[1.65 x 0.75 x CVTE <[1.65 x 0.75 x CVII + 0.375 x (CV+ 0.375 x (CVII22 + CV+ CVGG
22))0.50.5]] 9.6%9.6%
•• DesirableDesirableCVCVAA <0.50 x CV<0.50 x CVII 2.7%2.7%
B <0.250 x (CVB <0.250 x (CVII22 + CV+ CVGG
22))0.5 0.5 1.95%1.95%
TE <[1.65 x 0.50 x CVTE <[1.65 x 0.50 x CVII + 0.250 x (CV+ 0.250 x (CVII22 + CV+ CVGG
22))0.50.5] ] 6.4%6.4%
•• OptimumOptimumCVCVAA <0.25 x CV<0.25 x CVI I 1.35%1.35%
B <0.125 x (CVB <0.125 x (CVII22 + CV+ CVGG
22))0.5 0.5 1.0%1.0%
TE <[1.65 x 0.25 x CVTE <[1.65 x 0.25 x CVII + 0.125 x (CV+ 0.125 x (CVII22 + CV+ CVGG
22))0.50.5]] 3.2%3.2%
Analytical performance specifications for plasma glucose
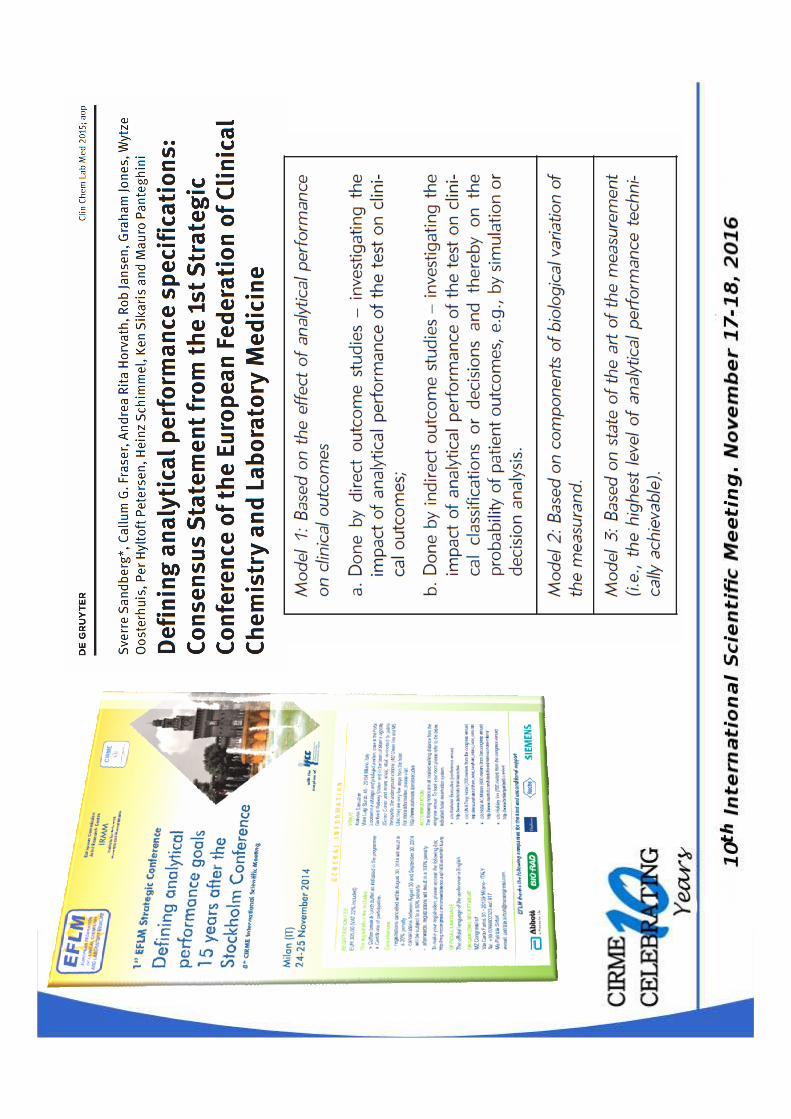
based on data of biological variability of the analyteModel 2
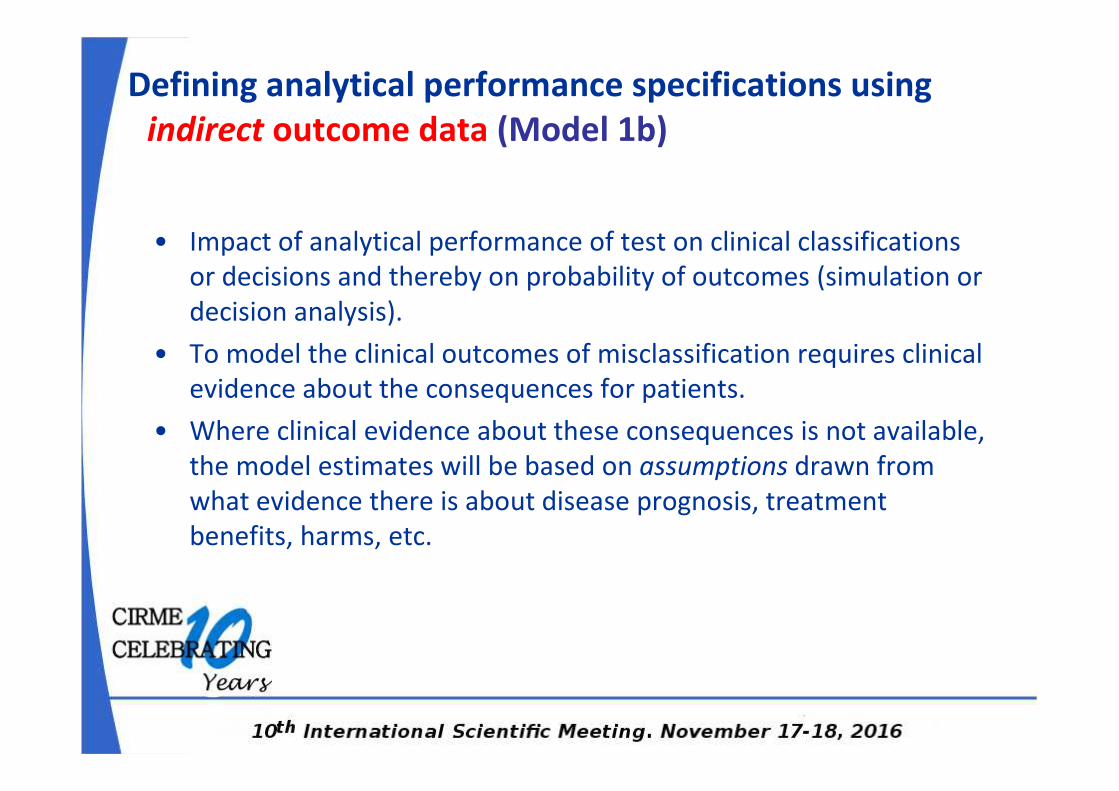
• Impact of analytical performance of test on clinical classifications
or decisions and thereby on probability of outcomes (simulation or
decision analysis).
• To model the clinical outcomes of misclassification requires clinical
evidence about the consequences for patients.
• Where clinical evidence about these consequences is not available,
the model estimates will be based on assumptions drawn from
what evidence there is about disease prognosis, treatment
benefits, harms, etc.
Defining analytical performance specifications using
indirect outcome data (Model 1b)
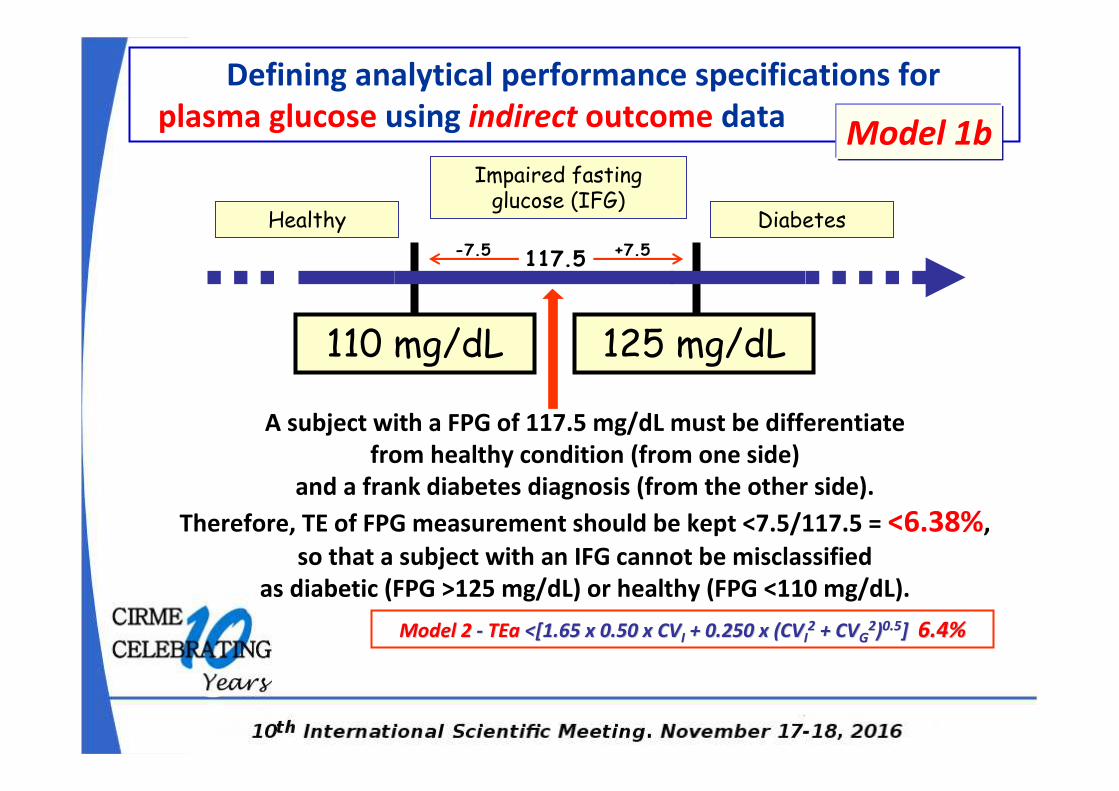
Healthy
Impaired fasting glucose (IFG)
Diabetes
110 mg/dL 125 mg/dL
A subject with a FPG of 117.5 mg/dL must be differentiate
from healthy condition (from one side)
and a frank diabetes diagnosis (from the other side).
Therefore, TE of FPG measurement should be kept <7.5/117.5 = <6.38%,
so that a subject with an IFG cannot be misclassified
as diabetic (FPG >125 mg/dL) or healthy (FPG <110 mg/dL).
Defining analytical performance specifications for
plasma glucose using indirect outcome data
Model 2Model 2 -- TEaTEa <[1.65 x 0.50 x CV<[1.65 x 0.50 x CVII + 0.250 x (CV+ 0.250 x (CVII22 + CV+ CVGG
22))0.50.5] ] 6.4% 6.4%
117.5 -7.5 +7.5
Model 1b
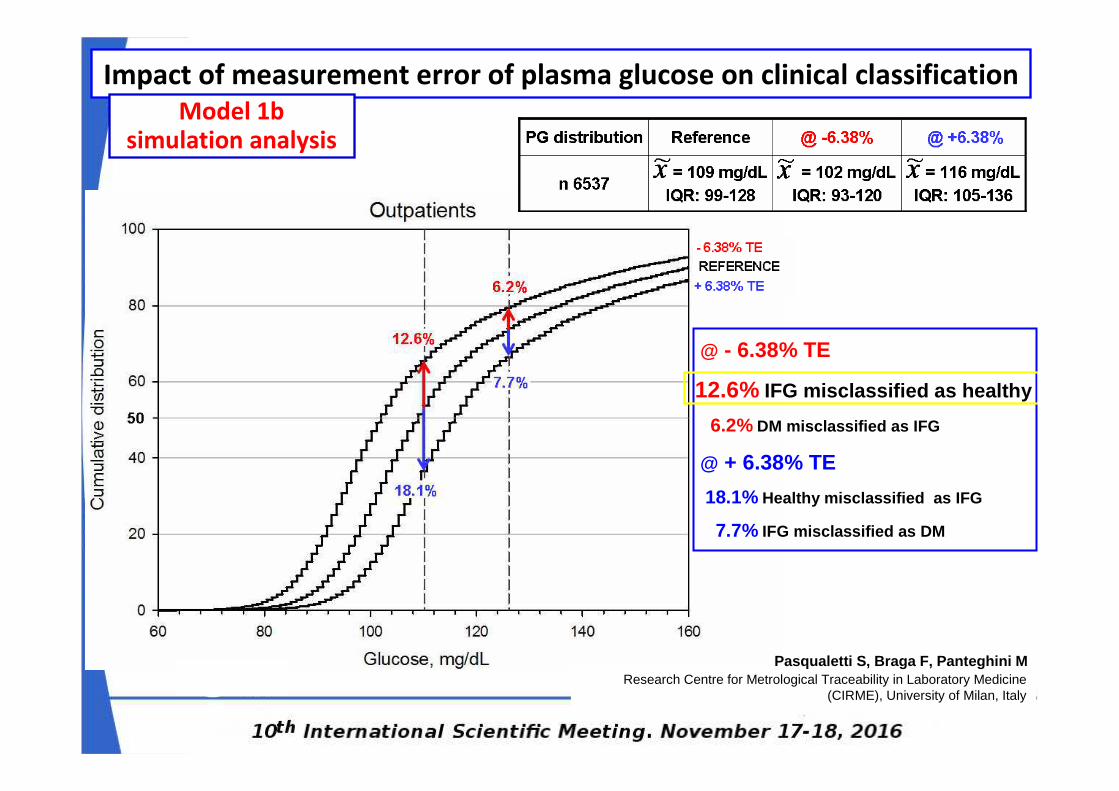
Impact of measurement error of plasma glucose on clinical classification
Model 1b simulation analysis
@ - 6.38% TE
12.6% IFG misclassified as healthy
6.2% DM misclassified as IFG
@ + 6.38% TE
18.1% Healthy misclassified as IFG
7.7% IFG misclassified as DM
Research Centre for Metrological Traceability in Laboratory Medicine (CIRME), University of Milan, Italy
Pasqualetti S, Braga F, Panteghini M
Analitical aspects of glucose testing
VTOT = (VP2 + VA
2 + VI2)1/2
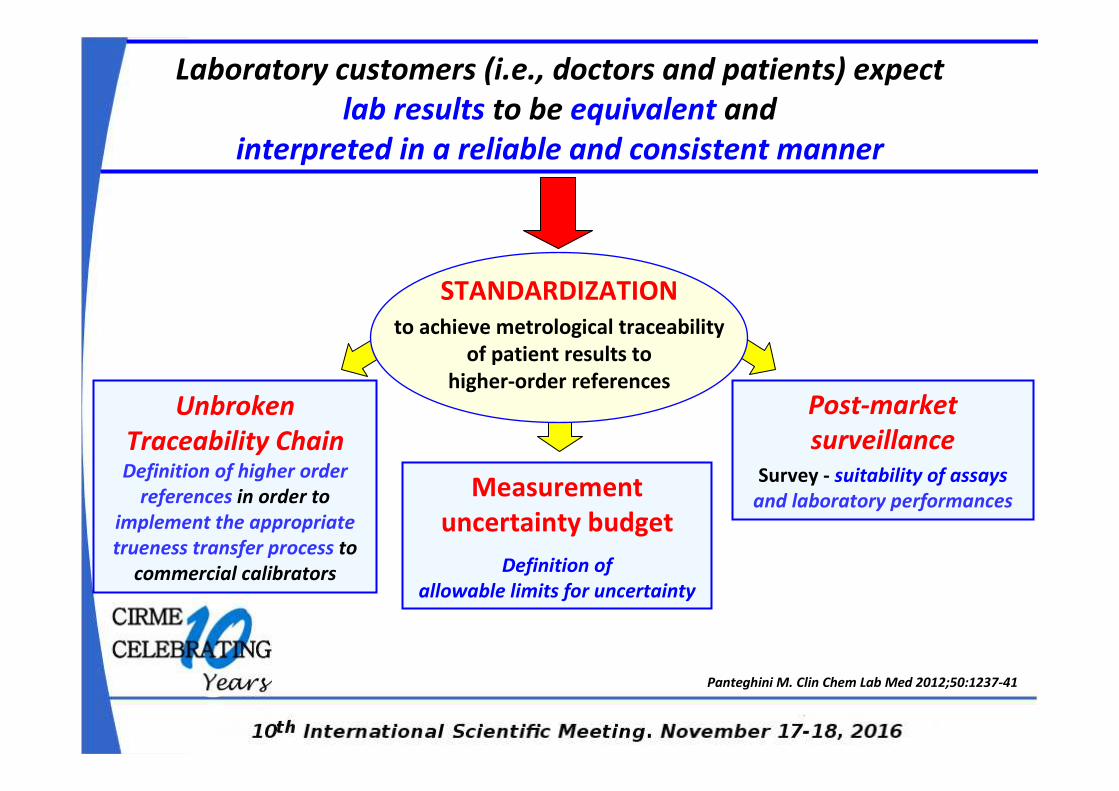
Unbroken
Traceability ChainDefinition of higher order
references in order to
implement the appropriate
trueness transfer process to
commercial calibrators
Panteghini M. Clin Chem Lab Med 2012;50:1237-41
STANDARDIZATION
to achieve metrological traceability
of patient results to
higher-order references
Measurement
uncertainty budget
Definition of
allowable limits for uncertainty
Post-market
surveillanceSurvey - suitability of assays
and laboratory performances
Laboratory customers (i.e., doctors and patients) expect
lab results to be equivalent and
interpreted in a reliable and consistent manner
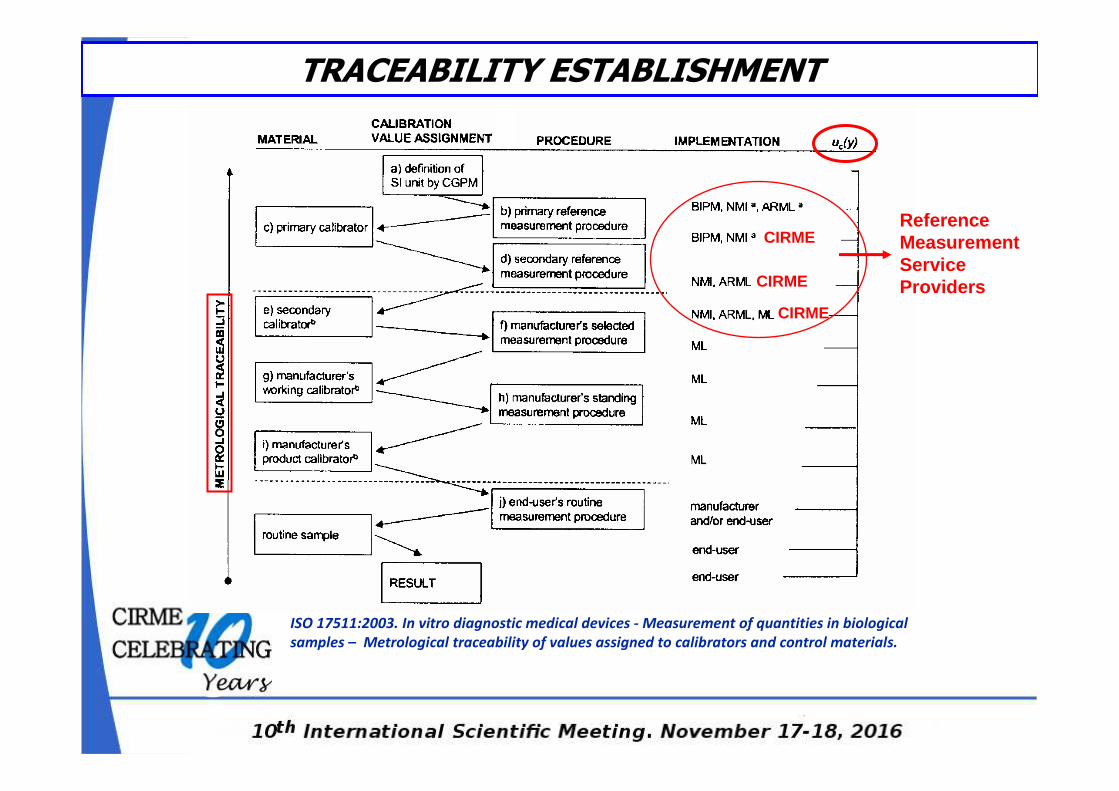
TRACEABILITY ESTABLISHMENT
ISO 17511:2003. In vitro diagnostic medical devices - Measurement of quantities in biological
samples – Metrological traceability of values assigned to calibrators and control materials.
Reference Measurement Service ProvidersCIRME
CIRME
CIRME
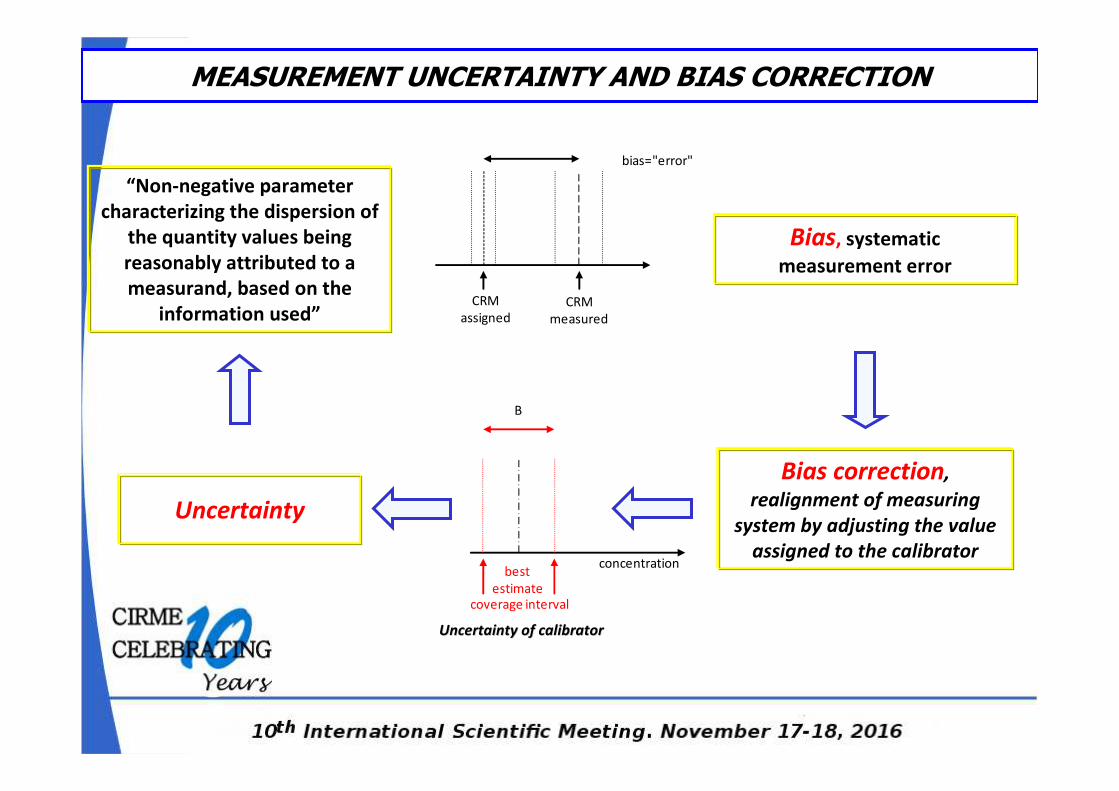
bias="error"
CRM
assigned
CRM
measured
concentration
coverage interval
B
best
estimate
Uncertainty of calibratorUncertainty of calibrator
Bias, systematic
measurement error
“Non-negative parameter
characterizing the dispersion of
the quantity values being
reasonably attributed to a
measurand, based on the
information used”
Bias correction,
realignment of measuring
system by adjusting the value
assigned to the calibrator
Uncertainty
MEASUREMENT UNCERTAINTY AND BIAS CORRECTION
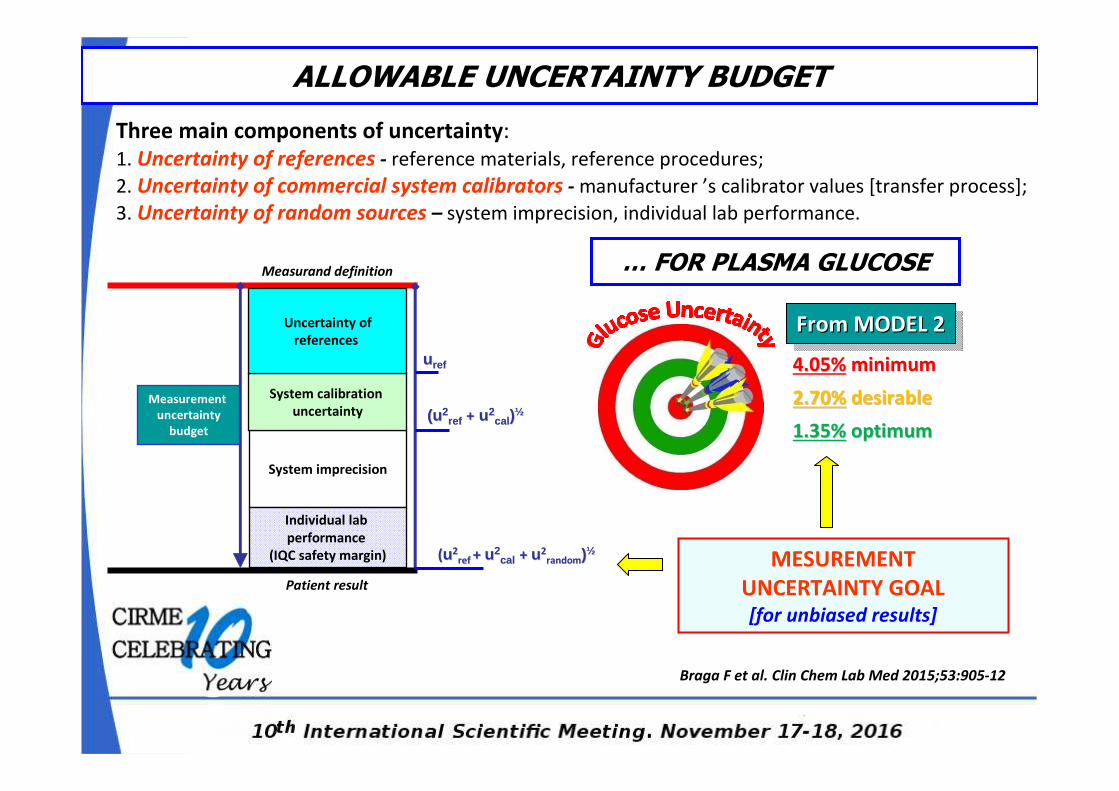
Three main components of uncertainty:
1. Uncertainty of references - reference materials, reference procedures;
2. Uncertainty of commercial system calibrators - manufacturer ’s calibrator values [transfer process];
3. Uncertainty of random sources – system imprecision, individual lab performance.
Braga F et al. Clin Chem Lab Med 2015;53:905-12
ALLOWABLE UNCERTAINTY BUDGET
MESUREMENT
UNCERTAINTY GOAL[for unbiased results]
uu refref
(u(u22refref ++ uu22
calcal ))½½
((uu22ref ref + + uu22
calcal + + uu22randomrandom))½½
System imprecision
System calibration
uncertainty
Individual lab
performance
(IQC safety margin)
Measurement
uncertainty
budget
Uncertainty of
references
Measurand definition
Patient result
From MODEL 2From MODEL 2From MODEL 2
4.05%4.05% minimumminimum
2.70%2.70% desirabledesirable
1.35%1.35% optimumoptimum
… FOR PLASMA GLUCOSE
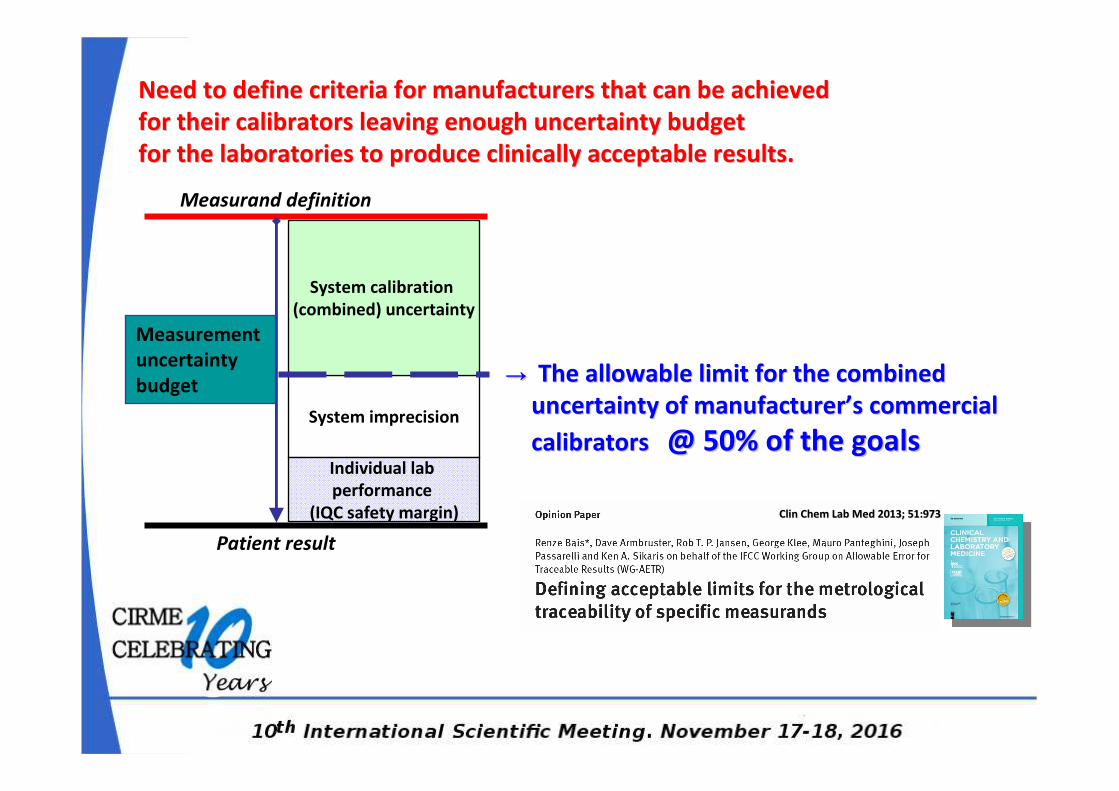
Clin Chem Lab Med 2013; 51:973Clin Chem Lab Med 2013; 51:973
→→ The allowable limit for the combined The allowable limit for the combined
uncertainty of manufactureruncertainty of manufacturer’’s commercial s commercial
calibrators calibrators @ @ 50% of the goals50% of the goalsSystem imprecision
System calibration
(combined) uncertainty
Individual lab
performance
(IQC safety margin)
Measurement
uncertainty
budget
Need to define criteria for manufacturers that can be achieved Need to define criteria for manufacturers that can be achieved
for their calibrators leaving enough uncertainty budget for their calibrators leaving enough uncertainty budget
for the laboratories to produce clinically acceptable results.for the laboratories to produce clinically acceptable results.
Measurand definition
Patient result
Braga F, et al. Clin Chim Acta 2014;432:55-61
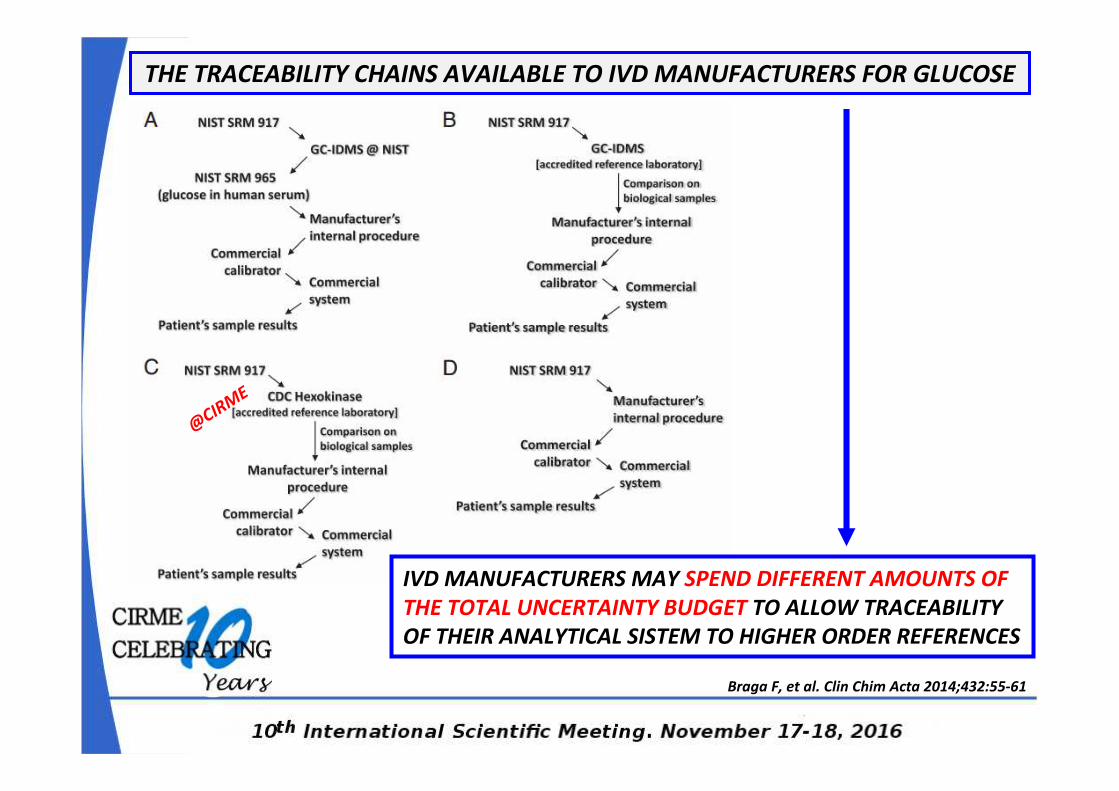
IVD MANUFACTURERS MAY SPEND DIFFERENT AMOUNTS OF
THE TOTAL UNCERTAINTY BUDGET TO ALLOW TRACEABILITY
OF THEIR ANALYTICAL SISTEM TO HIGHER ORDER REFERENCES
THE TRACEABILITY CHAINS AVAILABLE TO IVD MANUFACTURERS FOR GLUCOSE
@CIR
ME
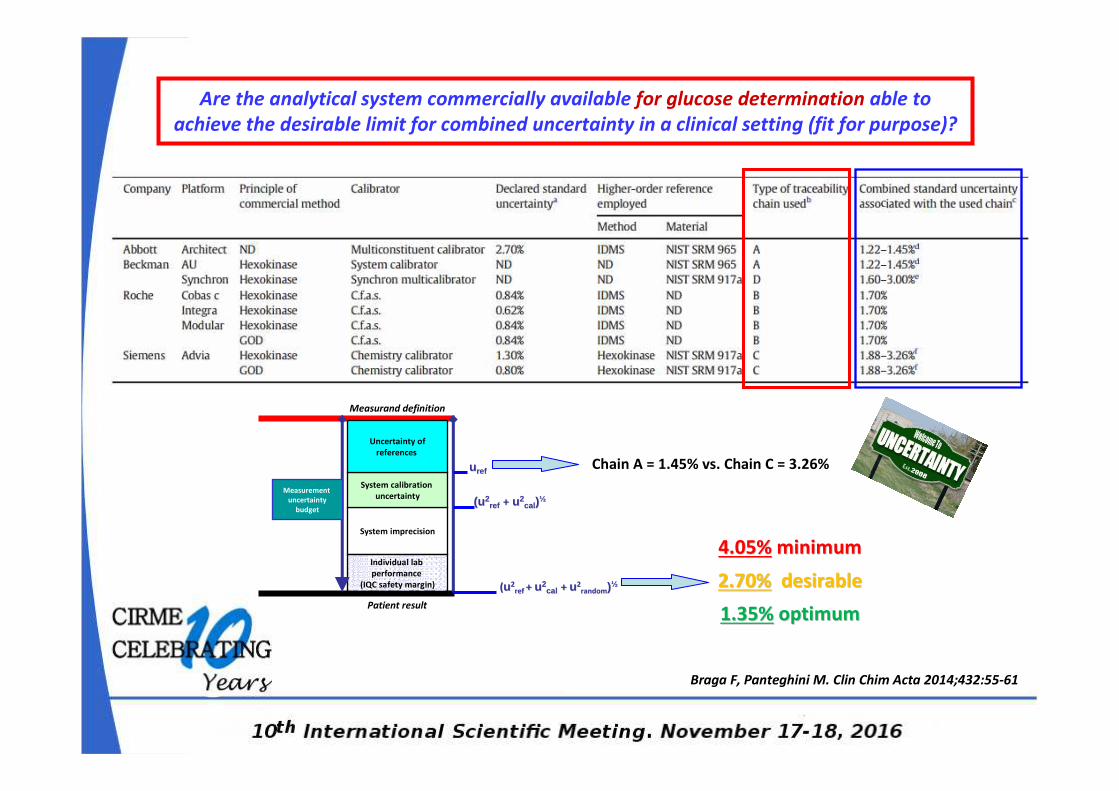
Braga F, Panteghini M. Clin Chim Acta 2014;432:55-61
Chain A = 1.45% vs. Chain C = 3.26%
Are the analytical system commercially available for glucose determination able to
achieve the desirable limit for combined uncertainty in a clinical setting (fit for purpose)?
uu refref
(u(u22refref ++ uu22
calcal ))½½
((uu22ref ref + + uu22
calcal + + uu22randomrandom))½½
System imprecision
System calibration
uncertainty
Individual lab
performance
(IQC safety margin)
Measurement
uncertainty
budget
Uncertainty of
references
Measurand definition
Patient result
4.05%4.05% minimumminimum
2.70%2.70% desirabledesirable
1.35%1.35% optimumoptimum
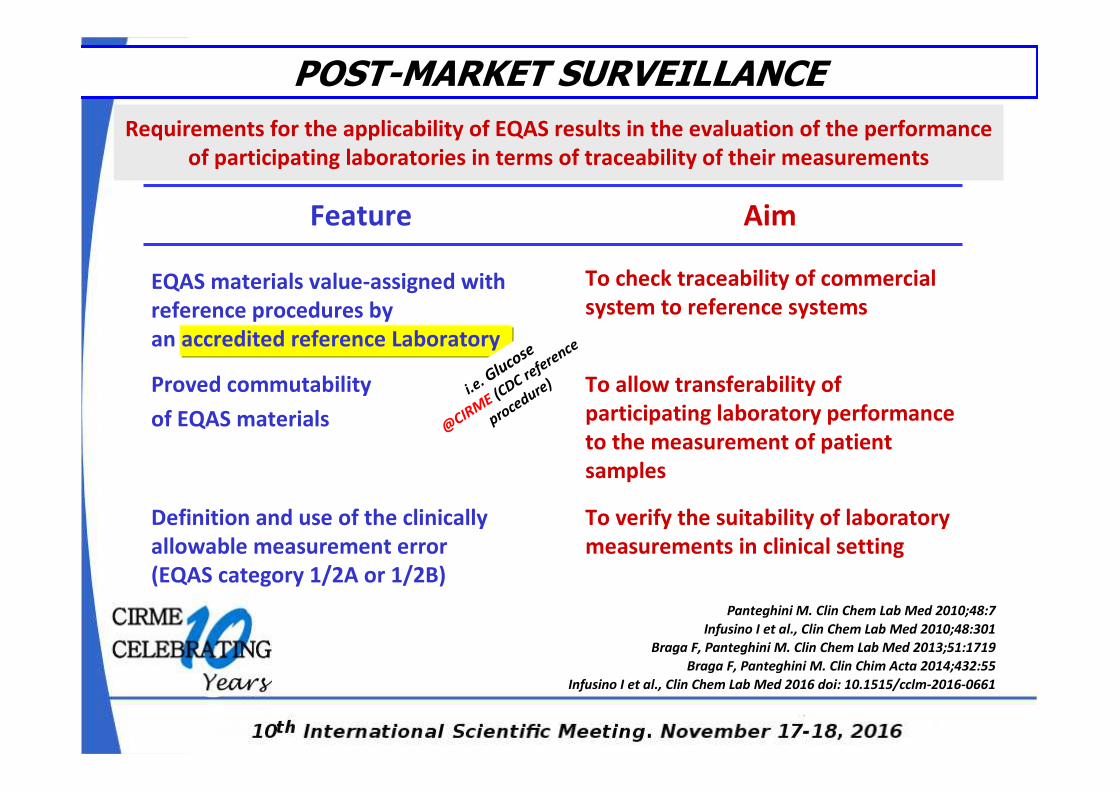
Requirements for the applicability of EQAS results in the evaluation of the performance
of participating laboratories in terms of traceability of their measurements
Feature Aim
EQAS materials value-assigned with
reference procedures by
an accredited reference Laboratory
To check traceability of commercial
system to reference systems
Proved commutability
of EQAS materials
To allow transferability of
participating laboratory performance
to the measurement of patient
samples
Definition and use of the clinically
allowable measurement error
(EQAS category 1/2A or 1/2B)
To verify the suitability of laboratory
measurements in clinical setting
Panteghini M. Clin Chem Lab Med 2010;48:7
Infusino I et al., Clin Chem Lab Med 2010;48:301
Braga F, Panteghini M. Clin Chem Lab Med 2013;51:1719
Braga F, Panteghini M. Clin Chim Acta 2014;432:55
Infusino I et al., Clin Chem Lab Med 2016 doi: 10.1515/cclm-2016-0661
POST-MARKET SURVEILLANCE
i.e. G
lucose
@CIRM
E (CDC refere
nce
procedure)
EQAS
Category
1/2A
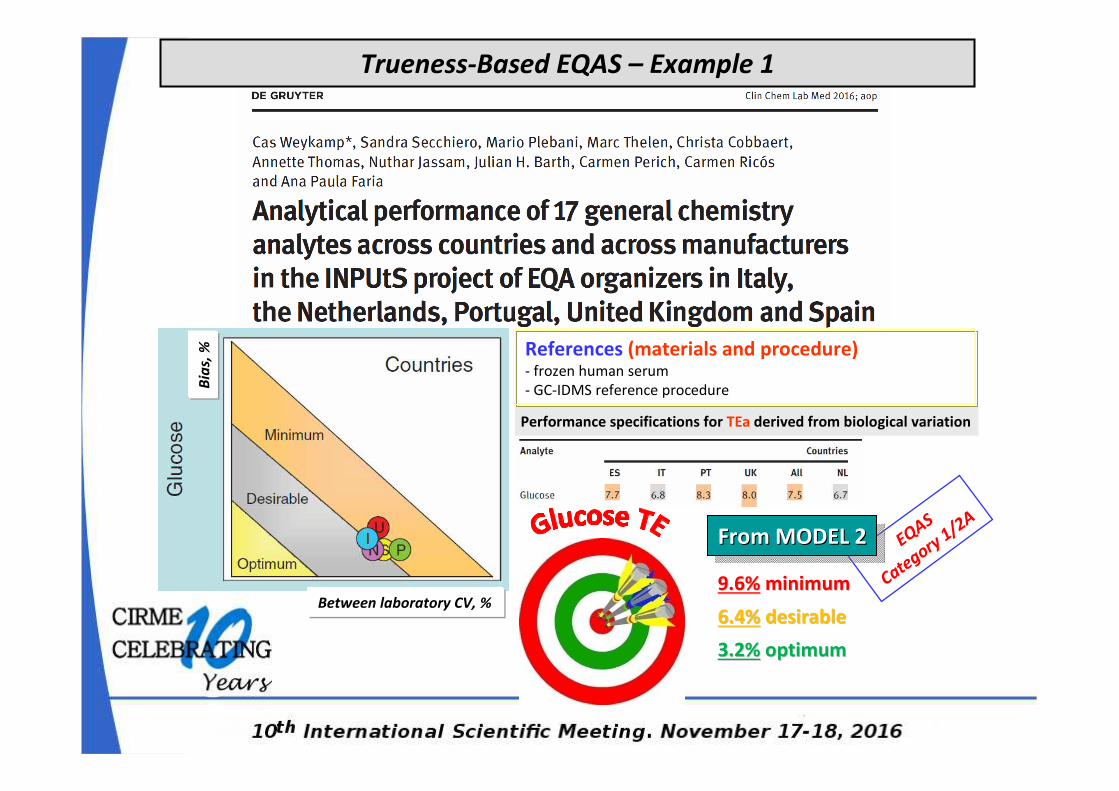
Performance specifications for TEa derived from biological variation
From MODEL 2From MODEL 2From MODEL 2
9.6%9.6% minimumminimum
6.4%6.4% desirabledesirable
3.2%3.2% optimumoptimum
References (materials and procedure)- frozen human serum
- GC-IDMS reference procedure
Between laboratory CV, %
Bia
s, %
Trueness-Based EQAS – Example 1
EQAS
Category 1/2A
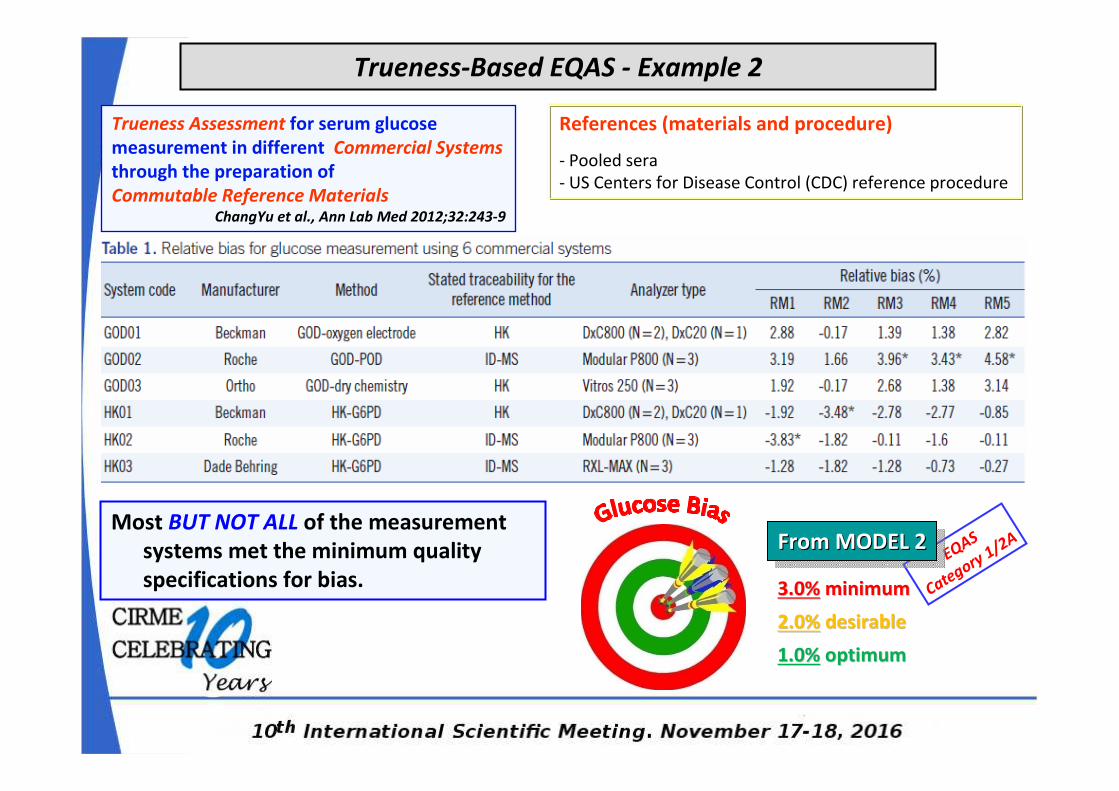
Trueness-Based EQAS - Example 2
Trueness Assessment for serum glucose
measurement in different Commercial Systems
through the preparation of
Commutable Reference Materials ChangYu et al., Ann Lab Med 2012;32:243-9
References (materials and procedure)
- Pooled sera
- US Centers for Disease Control (CDC) reference procedure
Most BUT NOT ALL of the measurement
systems met the minimum quality
specifications for bias.
From MODEL 2From MODEL 2From MODEL 2
3.0%3.0% minimumminimum
2.0%2.0% desirabledesirable
1.0%1.0% optimumoptimum
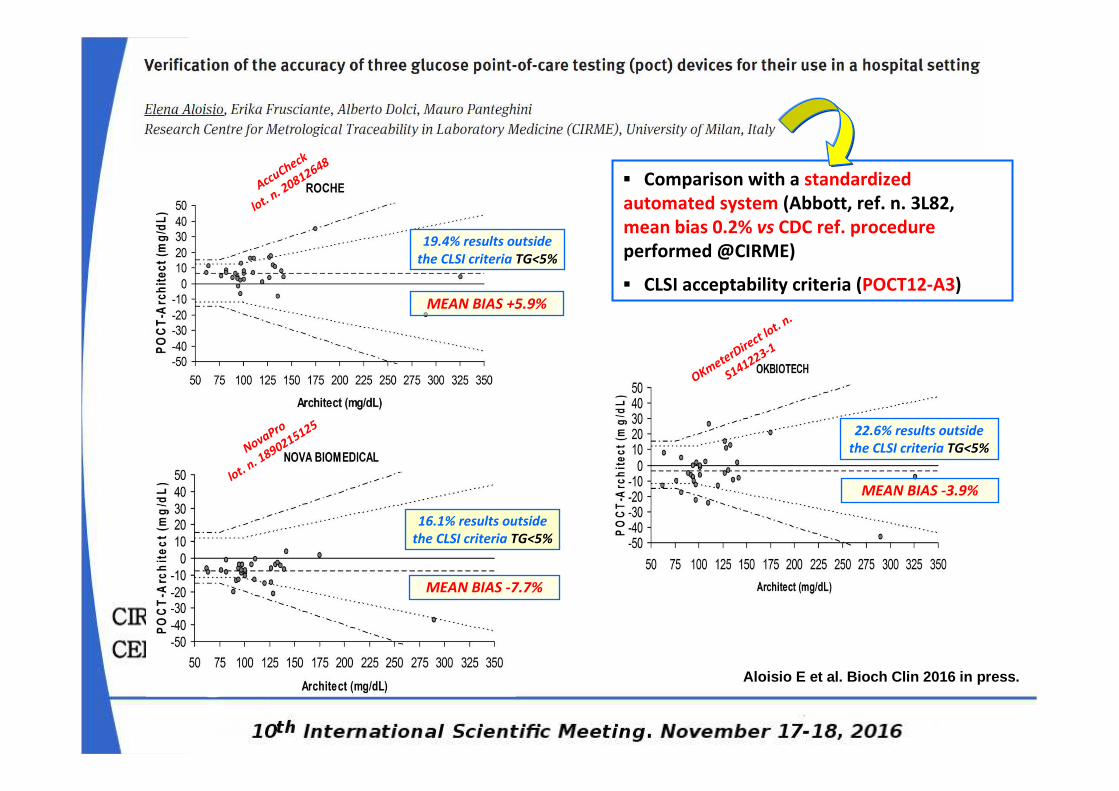
OKmeterDire
ct lot. n
.
S141223-1
NovaPro
lot. n. 1
890215125
AccuCheck
lot. n. 2
0812648
19.4% results outside
the CLSI criteria TG<5%
22.6% results outside
the CLSI criteria TG<5%
16.1% results outside
the CLSI criteria TG<5%
MEAN BIAS +5.9%
MEAN BIAS -3.9%
MEAN BIAS -7.7%
▪ Comparison with a standardized
automated system (Abbott, ref. n. 3L82,
mean bias 0.2% vs CDC ref. procedure
performed @CIRME)
▪ CLSI acceptability criteria (POCT12-A3)
Aloisio E et al. Bioch Clin 2016 in press.

…QUANTIFICATION OF A SIMPLE MOLECULE LIKE GLUCOSE
IS NOT SIMPLE...
...BUT WE ARE WELL ON THE WAY !
…DESPITE MANY EFFORTS
BY THE
PROFESSION...
Thank you for Your kind attention !!


![Preanalytical phase and patient outcome - unimi.it · Preanalytical phase and patient outcome Ana-Maria Šimundić ... Ppt0000001 [Sola lettura] Author: tesi Created Date: 11/30/2018](https://static.documents.pub/doc/80x56/5f04f79b7e708231d410989e/preanalytical-phase-and-patient-outcome-unimiit-preanalytical-phase-and-patient.jpg)


