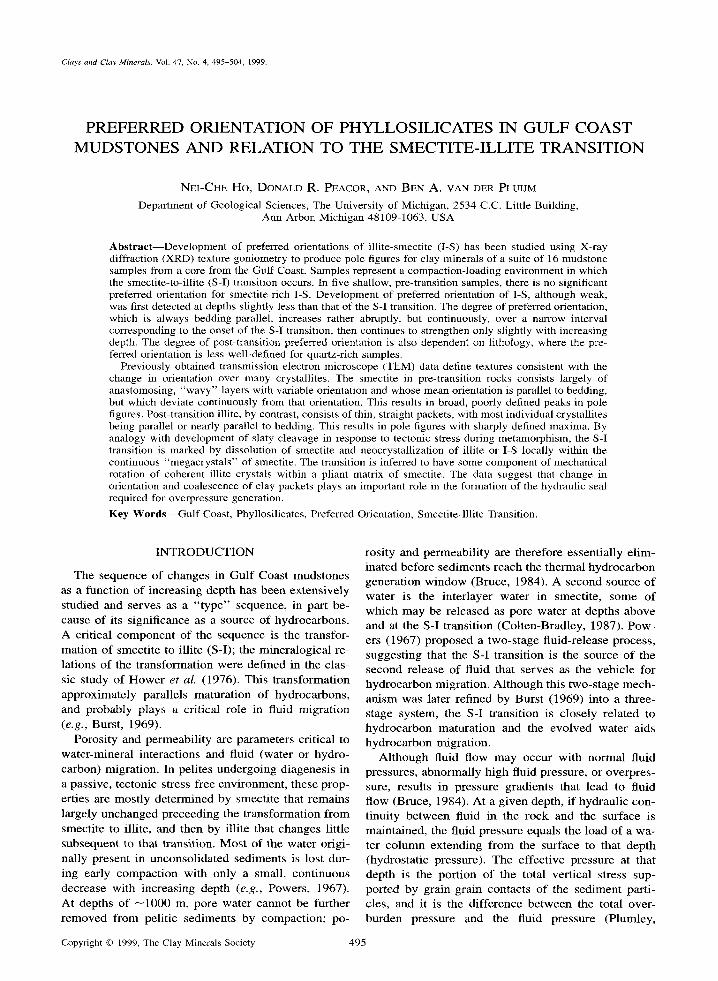
Clays and Clay Minerals, Vol.47, No. 4, 495-504, 1999. PREFERRED ORIENTATION OF PHYLLOSILICATES IN GULF COAST MUDSTONES AND RELATION TO THE SMECTITE-ILLITE TRANSITION NEI-CHE Ho, DONALD R. PEACOR, AND BEN A. VAN DER PLUIJM Department of Geological Sciences, The University of Michigan, 2534 C.C. Little Building, Ann Arbor, Michigan 48109-1063, USA Abstract--Development of preferred orientations of illite-smectite (I-S) has been studied using X-ray diffraction (XRD) texture goniometry to produce pole figures for clay minerals of a suite of 16 mudstone samples from a core from the Gulf Coast. Samples represent a compaction-loading environment in which the smectite-to-illite (S-I) transition occurs. In five shallow, pre-transition samples, there is no significant preferred orientation for smectite rich I-S. Development of preferred orientation of I-S, although weak, was first detected at depths slightly less than that of the S-I transition. The degree of preferred orientation, which is always bedding-parallel, increases rather abruptly, but continuously, over a narrow interval corresponding to the onset of the S-I transition, then continues to strengthen only slightly with increasing depth. The degree of post-transition preferred orientation is also dependent on lithology, where the pre- ferred orientation is less well-defined for quartz-rich samples. Previously obtained transmission electron microscope (TEM) data define textures consistent with the change in orientation over many crystallites. The smectite in pre-transition rocks consists largely of anastomosing, "wavy" layers with variable orientation and whose mean orientation is parallel to bedding, but which deviate continuously from that orientation. This results in broad, poorly defined peaks in pole figures. Post-transition illite, by contrast, consists of thin, straight packets, with most individual crystallites being parallel or nearly parallel to bedding. This results in pole figures with sharply defined maxima. By analogy with development of slaty cleavage in response to tectonic stress during metamorphism, the S-I transition is marked by dissolution of smectite and neocrystallization of illite or I-S locally within the continuous "megacrystals" of smectite. The transition is inferred to have some component of mechanical rotation of coherent illite crystals within a pliant matrix of smectite. The data suggest that change in orientation and coalescence of clay packets plays an important role in the formation of the hydraulic seal required for over-pressure generation. Key Words--Gulf Coast, Phyllosilicates, Preferred Orientation, Smectite-lllite Transition. INTRODUCTION The sequence of changes in Gulf Coast mudstones as a function of increasing depth has been extensively studied and serves as a "type" sequence, in part be- cause of its significance as a source of hydrocarbons. A critical component of the sequence is the transfor- mation of smectite to illite (S-I); the mineralogical re- lations of the transformation were defined in the clas- sic study of Hower et al. (1976). This transformation approximately parallels maturation of hydrocarbons, and probably plays a critical role in fluid migration (e.g., Burst, 1969). Porosity and permeability are parameters critical to water-mineral interactions and fluid (water or hydro- carbon) migration. In pelites undergoing diagenesis in a passive, tectonic-stress-free environment, these prop- erties are mostly determined by smectite that remains largely unchanged preceeding the transformation from smectite to illite, and then by illite that changes little subsequent to that transition. Most of the water origi- nally present in unconsolidated sediments is lost dur- ing early compaction with only a small, continuous decrease with increasing depth (e.g., Powers, 1967). At depths of --1000 m, pore water cannot be further removed from pelitic sediments by compaction; po- rosity and permeability are therefore essentially elim- inated before sediments reach the thermal hydrocarbon generation window (Bruce, 1984). A second source of water is the interlayer water in smectite, some of which may be released as pore water at depths above and at the S-I transition (Colten-Bradley, 1987). Pow- ers (1967) proposed a two-stage fluid-release process, suggesting that the S-I transition is the source of the second release of fluid that serves as the vehicle for hydrocarbon migration. Although this two-stage mech- anism was later refined by Burst (1969) into a three- stage system, the S-I transition is closely related to hydrocarbon maturation and the evolved water aids hydrocarbon migration. Although fluid flow may occur with normal fluid pressures, abnormally high fluid pressure, or overpres- sure, results in pressure gradients that lead to fluid flow (Bruce, 1984). At a given depth, if hydraulic con- tinuity between fluid in the rock and the surface is maintained, the fluid pressure equals the load of a wa- ter column extending from the surface to that depth (hydrostatic pressure). The effective pressure at that depth is the portion of the total vertical stress sup- ported by grain grain contacts of the sediment parti- cles, and it is the difference between the total over- burden pressure and the fluid pressure (Plumley, Copyright 1999, The Clay Minerals Society 495
Transcript
Clays and Clay Minerals, Vol. 47, No. 4, 495-504, 1999.
PREFERRED ORIENTATION OF PHYLLOSILICATES IN GULF COAST M U D S T O N E S A N D RELATION TO THE SMECTITE-ILLITE TRANSITION
NEI-CHE Ho, DONALD R. PEACOR, AND BEN A. VAN DER PLUIJM
Department of Geological Sciences, The University of Michigan, 2534 C.C. Little Building, Ann Arbor, Michigan 48109-1063, USA
Abstract - -Development of preferred orientations of illite-smectite (I-S) has been studied using X-ray diffraction (XRD) texture goniometry to produce pole figures for clay minerals of a suite of 16 mudstone samples from a core from the Gulf Coast. Samples represent a compaction-loading environment in which the smectite-to-illite (S-I) transition occurs. In five shallow, pre-transition samples, there is no significant preferred orientation for smectite rich I-S. Development of preferred orientation of I-S, although weak, was first detected at depths slightly less than that of the S-I transition. The degree of preferred orientation, which is always bedding-parallel, increases rather abruptly, but continuously, over a narrow interval corresponding to the onset of the S-I transition, then continues to strengthen only slightly with increasing depth. The degree of post-transition preferred orientation is also dependent on lithology, where the pre- ferred orientation is less well-defined for quartz-rich samples.
Previously obtained transmission electron microscope (TEM) data define textures consistent with the change in orientation over many crystallites. The smectite in pre-transition rocks consists largely of anastomosing, "wavy" layers with variable orientation and whose mean orientation is parallel to bedding, but which deviate continuously from that orientation. This results in broad, poorly defined peaks in pole figures. Post-transition illite, by contrast, consists of thin, straight packets, with most individual crystallites being parallel or nearly parallel to bedding. This results in pole figures with sharply defined maxima. By analogy with development of slaty cleavage in response to tectonic stress during metamorphism, the S-I transition is marked by dissolution of smectite and neocrystallization of illite or I-S locally within the continuous "megacrystals" of smectite. The transition is inferred to have some component of mechanical rotation of coherent illite crystals within a pliant matrix of smectite. The data suggest that change in orientation and coalescence of clay packets plays an important role in the formation of the hydraulic seal required for over-pressure generation.
Key Words - - G u l f Coast, Phyllosilicates, Preferred Orientation, Smectite-lllite Transition.
I N T R O D U C T I O N
The sequence of changes in G u l f Coas t m u d s t o n e s as a func t ion of inc reas ing dep th has b e e n ex tens ive ly s tudied and serves as a " t y p e " sequence, in par t be- cause of its s igni f icance as a source of hydroca rbons . A cri t ical c o m p o n e n t of the sequence is the t ransfor- ma t ion of smect i te to ill i te (S-I); the mine ra log ica l re- la t ions of the t r ans fo rma t ion were def ined in the clas- sic s tudy of H o w e r e t al. (1976). This t r ans fo rma t ion approx imate ly paral le ls ma tu ra t ion of hydroca rbons , and p robab ly plays a cri t ical role in fluid mig ra t ion
( e .g . , Burst , 1969). Poros i ty and permeab i l i ty are pa ramete r s cr i t ical to
wate r -minera l in te rac t ions and fluid (water or hydro- ca rbon) migra t ion . In pel i tes u n d e r g o i n g d iagenes i s in a pass ive, tec tonic-s t ress- f ree env i ronmen t , these prop- ert ies are mos t ly de t e rmined by smect i te tha t r em a i ns largely u n c h a n g e d p receed ing the t r ans fo rma t ion f rom smect i te to illite, and then by il l i te tha t changes l i t t le subsequen t to tha t t ransi t ion. M o s t of the wate r origi- nal ly present in unconso l ida t ed sed imen t s is lost dur- ing early c o m p a c t i o n wi th only a small , con t inuous decrease wi th inc reas ing dep th ( e . g . , Powers , 1967). At dep ths o f - -1000 m, pore wa te r c a n n o t be fur ther r e m o v e d f rom peli t ic sed imen t s by compac t ion ; po-
ros i ty and pe rmeab i l i t y are therefore essent ia l ly e l im- ina ted before sed imen t s r each the t he rma l h y d r o c a r b o n genera t ion w i n d o w (Bruce, 1984). A second source of wa te r is the in te r layer wate r in smect i te , some of w h i c h m a y be re leased as pore wa te r at dep ths above and at the S-I t rans i t ion (Col ten-Brad ley , 1987). Pow- ers (1967) p roposed a two-s tage f luid-release process , sugges t ing that the S-I t rans i t ion is the source of the second re lease of fluid that serves as the veh ic le for h y d r o c a r b o n migra t ion . A l t h o u g h this two-s tage mech- a n i s m was later ref ined by Bur s t (1969) into a three- s tage sys tem, the S-I t rans i t ion is c lose ly re la ted to h y d r o c a r b o n ma tu ra t ion and the evo lved water aids h y d r o c a r b o n migra t ion .
A l t h o u g h fluid f low m a y occur wi th n o r m a l fluid pressures , abno rma l ly h igh fluid pressure , or overpres - sure, resul ts in pressure gradients tha t lead to fluid flow (Bruce, 1984). A t a g iven depth , i f hydrau l i c con- t inui ty b e t w e e n fluid in the rock and the surface is ma in ta ined , the fluid pressure equals the load of a wa- ter c o l u m n ex tend ing f rom the surface to tha t dep th (hydros ta t ic pressure) . The ef fec t ive pressure at that dep th is the por t ion of the total vert ical stress sup- por t ed by gra in gra in contac t s o f the s ed imen t par t i - cles, and it is the d i f fe rence b e t w e e n the total over- b u r d e n pressure and the fluid pressure (Plumley,
Copyright �9 1999, The Clay Minerals Society 495
496 Ho, Peacor, and van der Pluijm Clays and Clay Minerals
1980). Overpressure is present when the fluid pressure is greater than hydrostatic pressure, a condition com- mon in Gulf Coast sediments. Many mechanisms have been proposed as sources of overpressure, including: 1) compaction disequilibrium (e.g., Magara, 1975a; Chapman, 1980; Mello and Karner, 1996), 2) aquath- ermal pressure (e.g., Barker, 1972; Magara, 1975b; Sharp, 1983; Luo et al., 1994), and 3) clay transfor- mation (e.g., Powers, 1967; Plumley, 1980; Bruce, 1984; Pendkar and Jordan, 1993; Luo et al. , 1994). Regardless of the mechanism, all require reduction in porosity and permeability, and most importantly, a sealing mechanism that isolates the pore water from the surface (e.g. , Mello et al., 1994). Although it has been suggested that the S-I transformation may not solely account for the presence of high pore fluid pres- sures (e.g., Chapman, 1980), transmission electron mi- croscopy (TEM) studies in Gulf Coast mudstones (Freed and Peacor, 1989a) and North Sea siltstones (Nadeau, pers. comm.) showed that there is a dramatic change in texture concomitant with the S-I transfor- mation, and that such changes are at least compatible with a sealing effect.
Because of its association with hydrocarbon gener- ation and migration, much research has focused on the S-I transition process using techniques such as powder X-ray diffraction (XRD) (e.g., Srodon, 1980; Reyn- olds, 1992), TEM (e.g., Ahn and Peacor, 1986; Jiang et al., 1990; Guthrie and Veblen, 1989), and nuclear magnetic resonance (NMR) spectroscopy (e.g. , Barron et aL, 1985). Mineralogical relations were summarized by Hower et al. (1976). It is generally agreed that clay in mudstones consists of (Reichweite) R0 I-S with ~20% illite at all depths extending to the onset of the S-I transition. That transition then occurs over a rela- tively narrow range of depths. Clay minerals remain largely unchanged with further depth, consisting of ~80% illite in I-S according to XRD data. The S-I transformation involves release of interlayer water, substitution of AP + for Si 4+ and fixation of K +, which is approximated by the reaction (Hower et al., 1976): smectite + A13+ + K + = illite + Si 4+. This process is independent of formation boundaries, depth, and geo- logical age (e.g. , Bruce, 1984). Rather, temperature is generally inferred to be the variable most affecting re- action progress (Perry and Hower, 1970). Several transformation mechanisms have been proposed, and the subject remains controversial (e.g., Altaner and Ylagen, 1997). For example, Hower et al. (1976) im- plied a process of progressive replacement of layers of smectite by layers of illite, whereas Pevear and Reynolds (1997) proposed precipitation of illite on a substrate of detrital mica. Ahn and Peacor (1986) pro- posed a model involving local dissolution of smectite and precipitation of illite. The specifics of the reaction process are subject to debate, but it is generally agreed that layers of illite retain at least the approximate ori-
entations of preexisting layers of smectite as demon- strated by TEM images.
Much research on rocks bearing I-S has focused in- dependently on the mineralogical relations and phys- ical properties such as porosity and permeability. These properties must clearly be related to the min- eralogy, crystallite size, and spatial orientations of the clay minerals. The changes in texture concomitant with the transition as documented by Freed and Peacor (1989a) may be accompanied by changes in preferred orientation of the clays that are a critical component of changes in porosity and permeability. Despite the probability of a link between the latter properties, min- eralogical changes, and preferred orientation, there are few studies that give quantitative data regarding the degree of preferred orientation and its variation as a function of depth (e.g. , Sintubin, 1994), and none in relation to the S-I transformation.
Several methods exist for the quantitative determi- nation of preferred orientation, but the most direct in- volves XRD. Automated instrumentation and software were developed in our laboratory to produce contoured pole figures showing the preferred orientation of phyl- losilicates; procedures, equipment design, and treat- ment of data are found in van der Pluijm et al. (1994, 1995). We refer to our method as high-resolution X- ray texture goniometry (HRXTG) because it utilizes the narrow collimated X-ray beam of a single-crystal diffractometer to interact with a small sample area, rather than the broad divergent beam of a powder dif- fractometer. The sequence of pelites in the Gulf Coast has been affected only by burial stresses and not by tectonic stress. The sequence progresses as a contin- uous function of depth interrupted only by the S-I transformation, which has important consequences for porosity and permeability, overpressure, and fluid mi- gration. The samples were previously studied by other methods, including TEM (e.g. , Dong and Peacor, 1996; Dong et al., 1997) so that XRD preferred-ori- entation data can be linked with mineralogical rela- tions and detailed textures in high-resolution images. These relations in turn can be used for the interpreta- tion of higher grade processes which are related to modification of burial metamorphic textures, such as slaty-cleavage development.
SAMPLE DESCRIPTIONS
Mudstone samples were originally obtained from the Socony Mobil Oil Company No. 1 Zula E. Boyd well, DeWitt County, Texas, drilled to a depth of 4300 m. The well first penetrated the near-surface Miocene Fleming Formation and then a thick Tertiary section, intersecting Cretaceous sediments at --3370 m. This sequence represents a passive margin deposition en- vironment, with at least a mud-dominated prograda- tional system in the Late Cretaceous, a regressive event in the Tertiary, three major regressive-transgres-
Table 1. Summary of sample data. Because samples are in the form of cuttings, the depths are given as intervals of 9 m. Illite content, if available, and additional data such as core temperatures, were given by Freed and Peacor (1992). Data shown in Figures 1 and 2 are denoted with "2". Samples 1-6 are pre-S-I transitional, 7-9 are transitional, and 10 16 are post- transitional, n/a (not applicable) refers to I-S peaks that are so broad that no single peak 20-value is evident, and/or to the lack of an identifiable pole density maximum.
Max. pole density Dm ~ (mrd) Max. Contour
contour interval ID Depth (m) % Illite ~ (A) Dio D,,,,~ (mrd) (nard)
1 Freed and Peacor (1992). 2 Data shown in Figure 2.
s ive cycles in the Eocene , and a final r egress ion in the Ol igocene (Freed and Peacor, 1992). There is no repor t of abno rma l fluid pressures encoun te red dur ing dril- ling.
These samples were chosen because of p rev ious de- ta i led charac te r i za t ion us ing X R D (Freed and Peacor, 1987, 1992) and T E M (Freed and Peacor, 1987, 1989b, 1992; D o n g and Peacor, 1996; D o n g et al., 1997). Those T E M obse rva t ions p rov ided direct vi- sua l iza t ion of the textura l re la t ionships ref lected in H R X T G data, and o f the k ind o f S-I t rans i t ion specific to the s tudied samples . A total of 16 c lay- r ich pel i tes were ob ta ined f rom dep ths of - -60 to 4250 m, num- be red sequent ia l ly wi th increas ing depth. Table 1 sum- mar izes the dep th of each sample and the i l l i te -smec- tite con ten t (in % illite) where de t e rmined by Freed and Peacor (1992). Because these samples are cut t ings f rom cores, the dep ths are g iven as in te rva l s o f --9 m. Specif ic cu t t ings were chosen where bedd i ng direc- t ions cou ld be r ecogn ized by features such as color var ia t ion and prefe r red breakage , as subsequen t ly ver- ified by T E M images of p re fe r red grain or ienta t ions .
A c c o r d i n g to F reed and Peaco r (1992), S-1 t ransi- t ional samples occur be t w een depths o f - -2100 m (83~ and - 2 4 0 0 m (88~ co r r e spond ing approxi- mate ly to samples 7 - 9 of this study. Samples f rom the pre- t rans i t ion zone are smect i te- r ich; X R D data (Freed and Peacor, 1992) ind ica te - 3 5 % ill i te in R0 mixed- layered I-S in the pre- t rans i t ion zone samples . The il- lite con ten t increases abrupt ly to - -85% across the t ransi t ion, then r ema ins near ly cons tan t for deeper samples . T E M data conf i rmed that smect i te is the
d o m i n a n t au th igen ic phase in sha l low samples . As the S-I t rans i t ion proceeds , subhedra l c rys ta l s of R1 I-S and subsequen t ly i l l i te were o b s e r v e d wi th in a f rame- work o f smect i te , wi th the i r p ropor t ion inc reas ing rel- a t ive to smect i te wi th inc reas ing dep th unt i l v i r tua l ly all smect i te was rep laced by illi te c rys ta l l i tes averag- ing - 1 0 0 A in th ickness .
A N A L Y T I C A L T E C H N I Q U E S A N D S A M P L E P R E P A R A T I O N
The H R X T G dev ice is an a t t a c h m e n t to an auto- m a t e d En ra f -Non ius C A D 4 s ing le -c rys ta l d i f f rac tom- eter wi th a MoKc~-radiat ion source and sc in t i l la t ion de- tector. P re fe r red-or ien ta t ion data were m e a s u r e d in t r ansmis s ion mode , w h i c h is r e c o m m e n d e d for X R D peaks wi th low di f f rac t ion angles (20) such as for the re la t ive ly in tense (001) peaks o f phyl los i l i ca tes (e.g., Oertel , 1985; Wenk, 1985). In t r an smi s s ion mode , X- rays pass t h rough the sample and the de tec tor is po- s i t ioned at a pre-se t 20 angle to rece ive X- rays dif- f rac ted by a specific set o f p lanes of a specif ic phase . To measu re the d i f f rac ted X - r a y in tens i t ies in d i f fe ren t or ienta t ions , the sample is ro ta ted us ing the axial sys- t em of the C A D 4 d i f f r ac tomete r and the pole- f igure dev ice to sample a grid o f or ien ta t ions , wh i l e the X- ray source and the de tec tor r e m a i n s ta t ionary. A t each or ienta t ion , b o t h the d i f f rac ted in tens i ty and the cor- r e s p o n d i n g o r ien ta t ion i n fo rma t ion are recorded. In- tensi t ies are first cor rec ted for b a c k g r o u n d and absorp- t ion, then n o r m a l i z e d so that the resul ts are concen t ra - t ion - independen t . The resu l t ing va lues are re la t ive po le densi t ies , and are expressed in mul t ip les of r a n d o m
498 Ho, Peacor, and van der Pluijm Clays and Clay Minerals
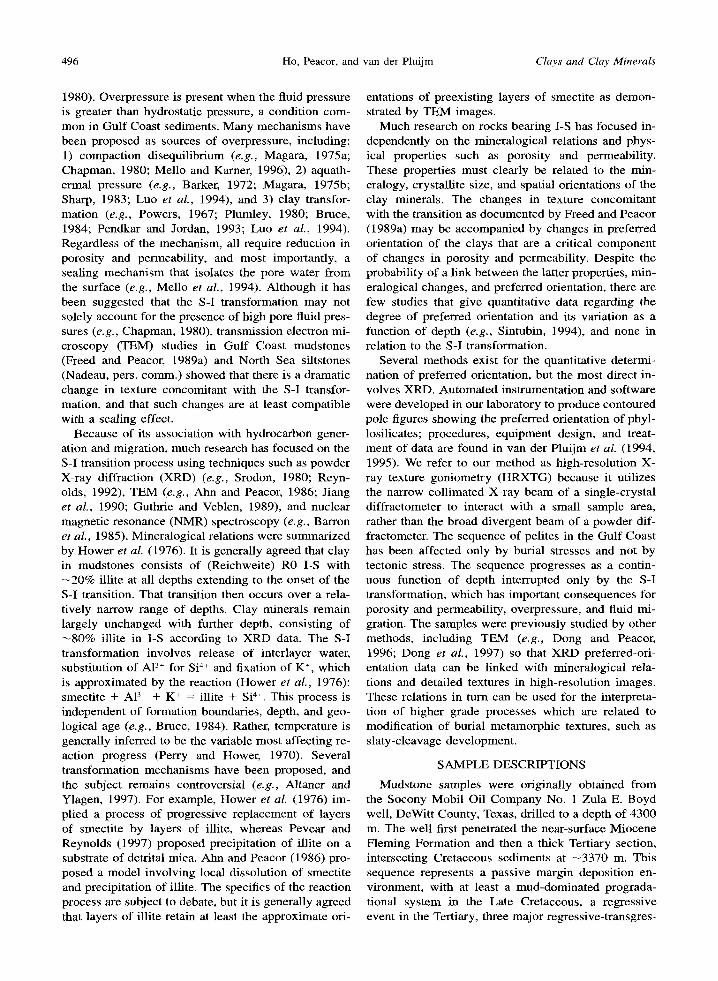
Figure 1. XRD pattern (20-scan) for sample 12 obtained with the single-crystal diffraction system is typical of this study. The 20 values for Dl0 and Dmi x are shown.
d is t r ibut ion (mrd; Wenk, 1985); i.e., dens i ty o f a g iven pole is ca lcu la ted re la t ive to the average po le densi ty, wh ich is d e t e r m i n e d by d is t r ibu t ing the in tegra ted total pole dens i ty un i fo rmly over the full sphere. T h e final output is a con toured p ro jec t ion showing or ien ta t ions of a g iven po le of a g iven set of p lanes (usual ly (001) in the case of phyl los i l ica tes) , p lo t ted in lower -hemi- sphere equal -area projec t ion. For detai ls regard ing in- s t rumenta t ion and cor rec t ion procedures , see van der P lu i jm et al. (1994). M e a s u r e m e n t s of mos t samples were car r ied out more than once to conf i rm the results .
Pr ior to the m e a s u r e m e n t of p re fe r red-or ien ta t ion data, a scan over a r ange of 20 was m a d e to: 1) vali- date phases present , ba sed o n prev ious de t e rmina t ions by s tandard p o w d e r X R D techniques , and de t e rmine the precise d i f f rac t ion angles for data col lect ion, and 2) de t e rmine an appropr ia te level of b a c k g r o u n d cor- rect ion. This k ind of scan is ca l led a " 2 0 - s c a n " to d i s t inguish it f r om a "po le - f igure s c a n " wh ich gen- erates p re fe r red-or ien ta t ion data. The 20-scan is essen- t ial ly the same as a s tandard p o w d e r X R D pattern.
The spec imens used for p re fe r red o r ien ta t ion mea- su rements are rock sl ices m o u n t e d on a square alu- m i n u m holder wi th a c i rcular open ing in its cen te r to al low X-rays to pass. R o c k sl ices are - 0 . 2 m m thick, and were cut pe rpend icu la r to bedd ing , as T E M ob- se rva t ions (Dong and Peacor, 1996) conf i rmed pref- e rence for o r ien ta t ion o f c lay minera l s paral lel to bed- ding. The prec ise th ickness of each spec imen was m e a s u r e d to correc t d i f f rac t ion in tens i t ies for absorp- t ion, All samples , w h i c h cons is ted of smal l cut t ings , were e m b e d d e d in epoxy b locks before cut t ing so that the c ross -sec t ion of the sample would be suff ic ient ly large to fit the H R X T G sample holder. Smec t i t e - r i ch samples , w h o s e textures m a y h a v e b e e n af fec ted by wate r dur ing the sample p repara t ion process , were first impregna t ed us ing epoxy res in to p reven t expans ion of smect i te and resu l t ing des t ruc t ion of samples . To p reven t sample de format ion , i m p r e g n a t i o n was accom- p l i shed pass ive ly at r o o m pressure . S imi la r t r ea tmen t o f samples s tudied b y T E M veri f ied the lack of defor- mat ion .
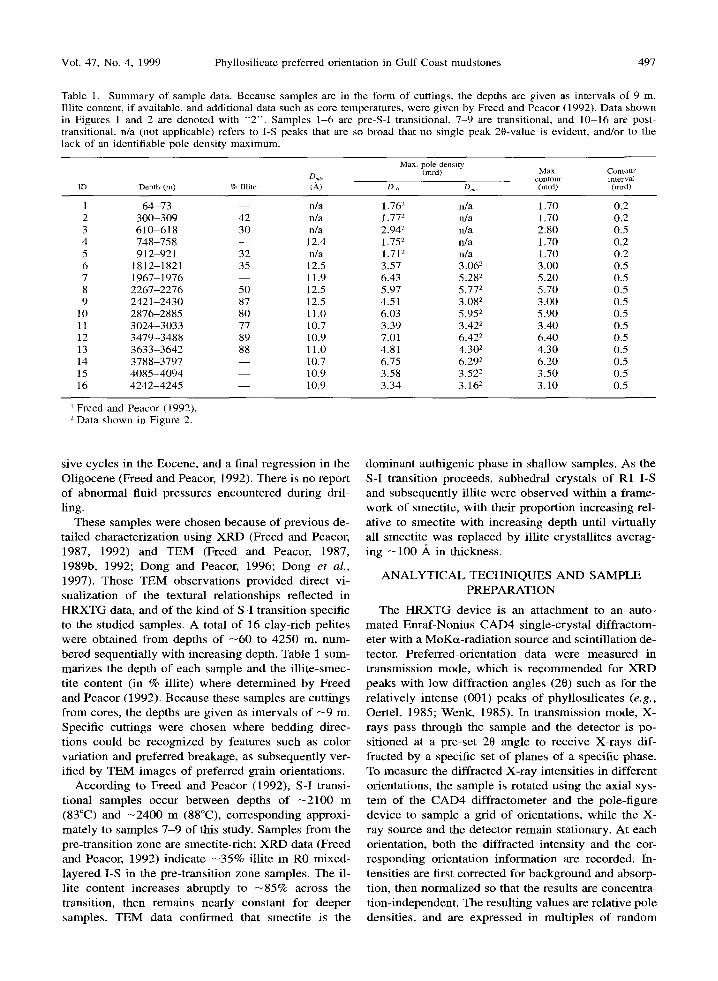
Figure 2. Pole figures. Those for samples 1-5 correspond to D10 and those for samples 6-16 to Dn~ x. Maximum contours and contour intervals are given in Table 1. The peak of the pole density distribution was rotated to the center of each plot for pole figures with well-defined maxima; this direction is within 10 ~ of the normal to bedding. For shallow samples where there is no well-defined maximum, the estimate of the position of the pole normal to bedding was rotated to the figure center. The shaded area represents the S-I transition zone. Pole figures are placed to the right or left of the depth indicator to conserve space.
R E S U L T S
A typical 20-scan is s h o w n in F igure 1. T h e scans have a broad, in tense peak wi th in te rp lana r spac ing b e t w e e n d -- 1 0 - 1 4 ,~, co r r e spond ing to m i x ed - l ay e r I-S, and of ten a smal l , re la t ive ly sharp peak wi th d 10 A (not p resen t in F igure 1), co r r e spond ing in par t to detr i tal i l l i te or muscov i t e (see be low) . Pole- f igure scans were ob ta ined at two va lues of 20 for each sam- pie, each m e a s u r e d twice. O n e was ob ta ined for 20 co r r e spond ing to d - 10 ,~, a va lue that was cons tan t for all samples . This pos i t ion , co r r e spond ing to i l l i te or muscov i t e , is re fe r red to as O10 and largely repre- sents the p re fe r red or ien ta t ion of detr i ta l illite, if any, in pre - t rans i t ion samples . T h e second 20 va lue corre- sponded to the pos i t ion o f the m a x i m u m in tens i ty o f the b road peak b e t w e e n d - 1 0 - 1 4 A; this pos i t ion is de s igna t ed as Dm~x. T h e va lue of Dmi x var ied f r o m sam- ple to sample as a func t ion of re la t ive p ropor t ions of i l l i te and smect i te in I-S.
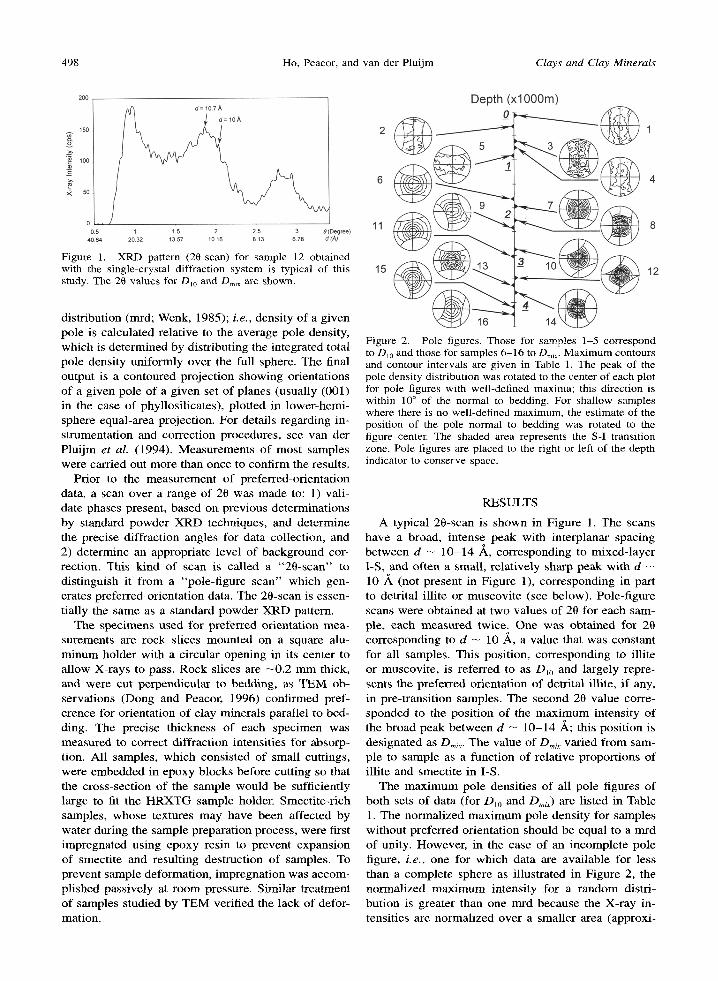
The m a x i m u m pole dens i t ies of all po le f igures of b o t h sets of da ta (for D10 and Dmix) are l i s ted in Table 1. The n o r m a l i z e d m a x i m u m pole dens i ty for samples wi thou t p re fe r red or ien ta t ion should be equal to a nard of unity. However , in the case of an i n c o m p l e t e po le figure, i.e., one for w h i c h da ta are ava i l ab le for less than a comple t e sphere as i l lus t ra ted in F igure 2, the n o r m a l i z e d m a x i m u m in tens i ty for a r a n d o m distr i- bu t ion is grea ter than one m r d because the X- ray in- tensi t ies are n o r m a l i z e d over a smal le r area (approxi-
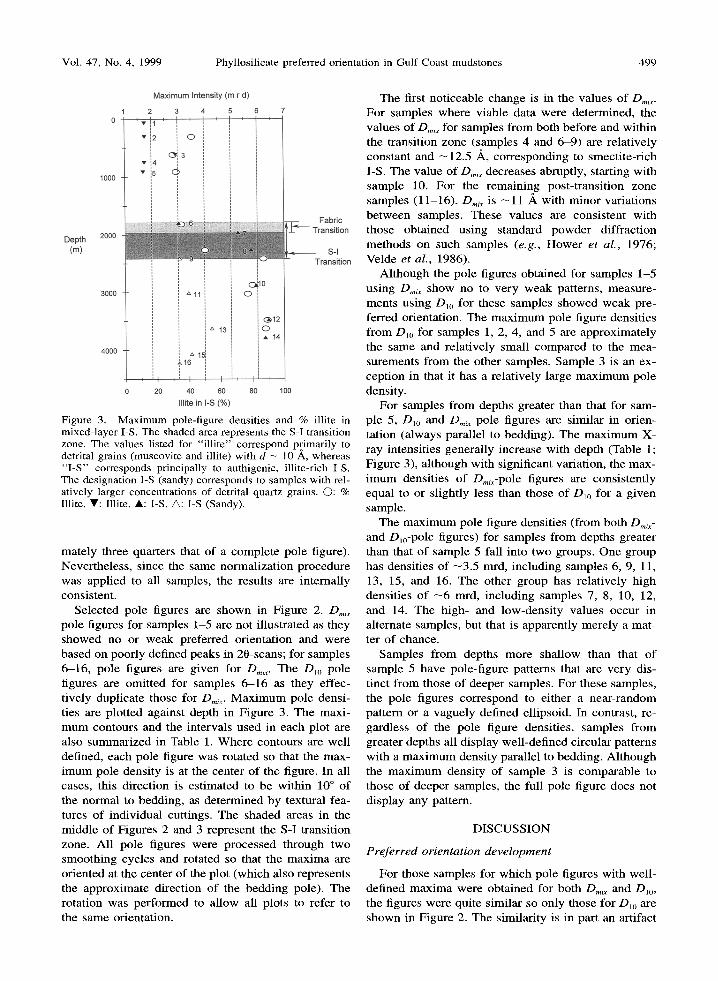
Figure 3. Maximum pole-figure densities and % illite in mixed-layer I-S. The shaded area represents the S-I transition zone. The values listed for "illite" correspond primarily to detrital grains (muscovite and illite) with d ~ 10 A, whereas "I-S" corresponds principally to authigenic, illite-rich I-S. The designation I-S (sandy) corresponds to samples with rel- atively larger concentrations of detrital quartz grains. O: % Illite, V: Illite, A: I-S, A: I-S (Sandy).
mately three quarters that of a complete pole figure). Nevertheless, since the same normalization procedure was applied to all samples, the results are internally consistent.
Selected pole figures are shown in Figure 2. Dm~ pole figures for samples 1-5 are not illustrated as they showed no or weak preferred orientation and were based on poorly defined peaks in 20-scans; for samples 6-16, pole figures are given for Dm~ ~. The D m pole figures are omitted for samples 6-16 as they effec- tively duplicate those for D ~ . Maximum pole densi- ties are plotted against depth in Figure 3. The maxi- mum contours and the intervals used in each plot are also summarized in Table 1. Where contours are well defined, each pole figure was rotated so that the max- imum pole density is at the center of the figure. In all cases, this direction is estimated to be within 10 ~ of the normal to bedding, as determined by textural fea- tures of individual cuttings. The shaded areas in the middle of Figures 2 and 3 represent the S-I transition zone. All pole figures were processed through two smoothing cycles and rotated so that the maxima are oriented at the center of the plot (which also represents the approximate direction of the bedding pole). The rotation was performed to allow all plots to refer to the same orientation.
The first noticeable change is in the values of D,,i x. For samples where viable data were determined, the values of D,,~ for samples from both before and within the transition zone (samples 4 and 6-9) are relatively constant and -12 .5 ,~, corresponding to smectite-rich I-S. The value of D,,,ix decreases abruptly, starting with sample 10. For the remaining post-transition zone samples (11-16), Dmi x is --11 ,~ with minor variations between samples. These values are consistent with those obtained using standard powder diffraction methods on such samples (e.g., Hower et al., 1976; Velde et al., 1986).
Although the pole figures obtained for samples 1-5 using D,,ix show no to very weak patterns, measure- ments using D~0 for these samples showed weak pre- ferred orientation. The maximum pole figure densities from D10 for samples 1, 2, 4, and 5 are approximately the same and relatively small compared to the mea- surements from the other samples. Sample 3 is an ex- ception in that it has a relatively large maximum pole density.
For samples from depths greater than that for sam- ple 5, D10 and Dmlx pole figures are similar in orien- tation (always parallel to bedding). The maximum X- ray intensities generally increase with depth (Table 1; Figure 3), although with significant variation, the max- imum densities of Dm~x-pole figures are consistently equal to or slightly less than those of D w for a given sample.
The maximum pole figure densities (from both D,,ix- and Dj0-pole figures) for samples from depths greater than that of sample 5 fall into two groups. One group has densities of --3.5 mrd, including samples 6, 9, 11, 13, 15, and 16. The other group has relatively high densities of - 6 mrd, including samples 7, 8, 10, 12, and 14. The high- and low-density values occur in alternate samples, but that is apparently merely a mat- ter of chance.
Samples from depths more shallow than that of sample 5 have pole-figure patterns that are very dis- tinct from those of deeper samples. For these samples, the pole figures correspond to either a near-random pattem or a vaguely defined ellipsoid. In contrast, re- gardless of the pole figure densities, samples from greater depths all display well-defined circular patterns with a maximum density parallel to bedding. Although the maximum density of sample 3 is comparable to those of deeper samples, the full pole figure does not display any pattern.
DISCUSSION
Preferred orientation development
For those samples for which pole figures with well- defined maxima were obtained for both D~gx and D m, the figures were quite similar so only those for D10 are shown in Figure 2. The similarity is in part an artifact
500 Ho, Peacor, and van der Pluijm Clays and Clay Minerals
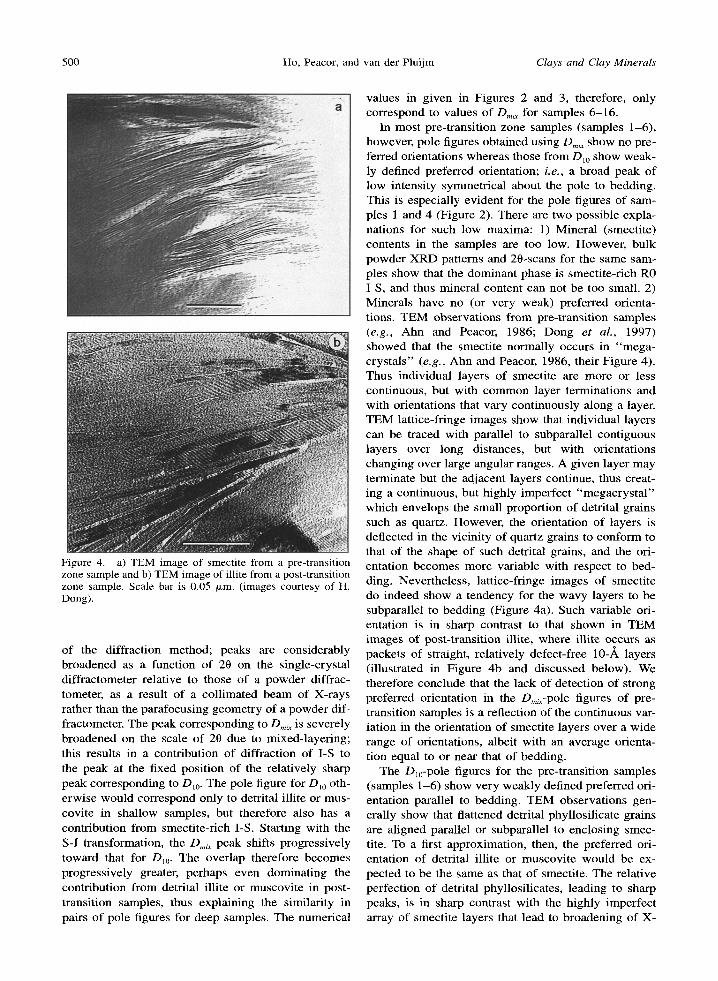
Figure 4. a) TEM image of smectite from a pre-transition zone sample and b) TEM image of illite from a post-transition zone sample. Scale bar is 0.05 Ixm. (images courtesy of H. Dong).
of the diffraction method; peaks are considerably broadened as a function of 20 on the single-crystal diffractometer relative to those of a powder diffrac- tometer, as a result of a collimated beam of X-rays rather than the parafocusing geometry of a powder dif- fractometer. The peak corresponding to Dmi x is severely broadened on the scale of 20 due to mixed-layering; this results in a contribution of diffraction of I-S to the peak at the fixed position of the relatively sharp peak corresponding to D10. The pole figure for D~0 oth- erwise would correspond only to detrital illite or mus- covite in shallow samples, but therefore also has a contribution from smectite-rich I-S. Starting with the S-I transformation, the Omi x peak shifts progressively toward that for D10. The overlap therefore becomes progressively greater, perhaps even dominating the contribution from detrital illite or muscovite in post- transition samples, thus explaining the similarity in pairs of pole figures for deep samples. The numerical
values in given in Figures 2 and 3, therefore, only correspond to values of Dmix for samples 6-16.
In most pre-transition zone samples (samples 1-6), however, pole figures obtained using D,,i~ show no pre- ferred orientations whereas those from D10 show weak- ly defined preferred orientation; i.e., a broad peak of low intensity symmetrical about the pole to bedding. This is especially evident for the pole figures of sam- pies 1 and 4 (Figure 2). There are two possible expla- nations for such low maxima: 1) Mineral (smectite) contents in the samples are too low. However, bulk powder XRD patterns and 20-scans for the same sam- pies show that the dominant phase is smectite-rich R0 I-S, and thus mineral content can not be too small. 2) Minerals have no (or very weak) preferred orienta- tions. TEM observations from pre-transition samples (e.g., Ahn and Peacor, 1986; Dong et al., 1997) showed that the smectite normally occurs in "mega- crystals" (e.g., Ahn and Peacor, 1986, their Figure 4). Thus individual layers of smectite are more or less continuous, but with common layer terminations and with orientations that vary continuously along a layer. TEM lattice-fringe images show that individual layers can be traced with parallel to subparallel contiguous layers over long distances, but with orientations changing over large angular ranges. A given layer may terminate but the adjacent layers continue, thus creat- ing a continuous, but highly imperfect "megacrystal" which envelops the small proportion of detrital grains such as quartz. However, the orientation of layers is deflected in the vicinity of quartz grains to conform to that of the shape of such detrital grains, and the ori- entation becomes more variable with respect to bed- ding. Nevertheless, lattice-fringe images of smectite do indeed show a tendency for the wavy layers to be subparallel to bedding (Figure 4a). Such variable ori- entation is in sharp contrast to that shown in TEM images of post-transition illite, where illite occurs as packets of straight, relatively defect-free 10-,~ layers (illustrated in Figure 4b and discussed below). We therefore conclude that the lack of detection of strong preferred orientation in the Dmix-pole figures of pre- transition samples is a reflection of the continuous var- iation in the orientation of smectite layers over a wide range of orientations, albeit with an average orienta- tion equal to or near that of bedding.
The D10-pole figures for the pre-transition samples (samples 1-6) show very weakly defined preferred ori- entation parallel to bedding. TEM observations gen- erally show that flattened detrital phyllosilicate grains are aligned parallel or subparallel to enclosing smec- rite. To a first approximation, then, the preferred ori- entation of detrital illite or muscovite would be ex- pected to be the same as that of smectite. The relative perfection of detrital phyllosilicates, leading to sharp peaks, is in sharp contrast with the highly imperfect array of smectite layers that lead to broadening of X-
ray peaks. We ascribe the lack of any preferred ori- entation in the Dmix-pole figures to a combination of very weakly defined preferred orientation and broad- ened diffraction maxima. Figures 2 and 3 therefore include data only for Dl0-pole figures in pre-transition samples, those for Dmi x being featureless.
In the post-transition zone samples, all the pole fig- ures show similar circular patterns. Such circular pat- terns are typical of a compaction environment where layer-parallel tectonic stresses were absent. The max- imum densities of the Dmix-pole figures fall into two distinct groups. One group of samples has "high" den- sities of --6 mrd, and the other " low" densities of - 3 . 5 mrd. We ascribe these differences in strength of preferred orientation to the presence of detrital grains. Powder XRD patterns of all post-transition samples fall into two distinct groups corresponding exactly to those for pole-figure density. The powder XRD data show that the proportion of quartz, which is primarily of detrital origin, is significantly higher in the samples with low densities, by factors to two. Van der Pluijm et al. (1994) showed that the pole-figure peak density decreased in direct proportion to an increasing ratio of quartz to clay contents, in a 2-cm thick sediment se- quence in which the proportion of quartz varies strong- ly. The increased quartz content causes phyllosilicate grains to have orientations conforming to detrital grain shapes and therefore to be more random. This, in fact, is similar to a well-known experimental technique of minimizing preferred orientation of clay minerals in X-ray diffractometer patterns by spiking samples with materials such as crushed glass.
S-I transition and preferred orientation
The overall trend in preferred orientation is one in which pre-tramsition samples have a near-constant, but weak preferred orientation, whereas post-transition samples have strong, well-developed preferred orien- tations, with a rapid change at approximately the onset of the S-I transition. This suggests that the S-I transi- tion is intimately related to the development of the strong preferred orientation.
Freed and Peacor (1989a) compared the textures of pre-transition smectite-rich and post-transition illite- rich mudstones from the Gulf Coast, and concluded that, in addition to the release of interlayer water as pore fluid, the S-I transition facilitates the generation of overpressure by providing an effective hydraulic seal. Figure 4b shows the texture typical of illite-rich mudstones, which contrasts sharply with that of the smectite-rich mudstones of Figure 4a. Rather than con- sisting of a continuous, anastomosing array of layers as in smectite, illite occurs as discrete packets of straight, relatively defect-flee layers that comprise in- dividual crystallites; their mean thickness is on the or- der of 100 ,~ as directly measured from the TEM im- ages of Ahn and Peacor (1986), Freed and Peacor
(1989a), and Dong et al. (1997) by R. J. Merriman (pers. comm.). Such discrete crystals sometimes form stacks in which individual discrete packets are sub- parallel, somewhat like the cards in a badly stacked deck. Packets thus form an array whereby there is very limited pore space at packet contacts. No pore space was resolvable in SEM images of samples of this study. It is even difficult to detect pore space having dimensions as large as tens of angstroms in the highest resolution TEM images. However, especially where packets intersect at low angles, pore space may be observed that is on the order of only a few angstroms in maximum dimension. More importantly, such pore space is always defined by localized grain-grain con- tacts, and always appears to be discrete and discon- nected; i.e,, the pore space appears to be consistent with vanishingly small permeability. However, it is noteworthy that observations are made after removing the sample from a fluid-rich environment under pres- sure, whereas the samples are under vacuum when studied by electron microscopy. Pore space may be diminished by the change in environment. Alternative- ly, contraction of shale samples during loss of water is normally accompanied by strain features (e.g., as exemplified by lens-like openings in dehydrated smec- rite). Lack of detectable porosity described herein, however, is for samples which display no strain fea- tures.
TEM images show a dramatically different texture in illite-rich mudstones, where packets appear to have a much higher portion of layers (sub)parallel to bed- ding, as compared with smectite. Such relations are therefore consistent with the sharp increase in degree of preferred orientation during the S-1 transformation. The abrupt changes in preferred orientation, clay min- eral assemblage, textures of the clay minerals, and the occurrence of overpressure as reported in other cores in the Gulf Coast sediments, all occur in a near parallel fashion, and comprise a consistent set of diverse data. The mechanism of transformation of smectite to illite is controversial, perhaps occurring in different sedi- ment sequences by mechanisms as diverse as layer-by- layer replacement or complete dissolution and ne t - crystallization. As directly observed by TEM methods for the specific samples used in this study, however, the transition occurs by local dissolution of smectite with neocrystallization of discrete, subhedral crystals of R1 I-S or illite within the enclosing smectite matrix (Ahn and Peacor, 1986; Freed and Peacor, 1992; Dong et al., 1997). Such subhedral crystals retain the ap- proximate orientation of precursor smectite layers, and gradually increase in size, consuming the smectite, un- til they coalesce to form the pore-space-free (and pre- sumably, the relatively impermeable) array of inter- locking illite crystals. Such growing, coherent crystals are immersed in anastomosing smectite layers, allow- ing them to respond to load stress, with their orienta-
502 Ho, Peacor, and van der Pluijm Clays and Clay Minerals
tions adjusting gradually by rotation to the plane of bedding. The smectite-rich samples thus give rise to continuously variable pole figure orientations over a broad angular range and with a poorly defined maxi- mum, whereas illite-rich samples result in a narrow range of orientations having a well-defined maximum pole density.
Changes in preferred orientation are analogous to the development of slaty cleavage in response to tec- tonic stress, where mineral-grain orientation changes from bedding-parallel to cleavage-parallel. The debate about a mechanism has long centered on mechanical rotation of phyllosilicate grains or dissolution-net- crystallization, van der Pluijm et al. (1998) having shown that both mechanisms may be active under some conditions. For the S-I transformation, the pro- cess is dissolution of smectite and neocrystallization of iltite or R1 I-S normal to load stress, which is thus analogous to dissolution of clay minerals parallel to bedding and neocrystallization of mica normal to prin- cipal tectonic stress. Thus, the relatively defect-free, growing coherent illite crystallites can rotate within the enclosing incoherent array of smectite. Therefore, increase in preferred orientation has elements both of dissolution-neocrystallization and grain rotation.
Relation o f preferred orientation data to porosity, permeability, and geopressuring
We do not establish the relation between preferred orientation and properties such as porosity and per- meability, but we do make quantitative measures re- lating to orientation in clay minerals in a typical mud- stone sequence. Nevertheless, changes in preferred ori- entation concomitant with the I-S transition must re- flect differences in texture. In addition there is a clear relationship between the I-S transition and geopres- suring in some sediment sequences (see below), fur- ther linking the change in preferred orientation to po- rosity and permeability. Because porosity and perme- ability are controlled by textural relations, all of these variables must be linked in some way.
Direct measurements for shales show a continuous decrease in porosity as a function of depth with little or no change associated with the S-I transition. For example, Maxwell (1964) showed for his shales that porosity decreased rapidly at relatively shallow depths, but stabilized at - 1 2 0 0 m. Porosity actually increased very slightly at a depth of --2400 m, which is approx- imately where the S-I transition occurs, but the change was subtle. Plumley (1980) showed, using ~/-~ density logs for Gulf Coast sediments, that there is a contin- uous decrease in porosity to the depth of the onset of the S-I transition. With further increase in depth, po- rosity is constant or slightly larger. Similar results showing continuous increases in porosity as a function of depth, with no discontinuities associated with the S-I transition, have been reported by many investiga-
tors (e.g., Katsube and Williamson, 1994; Vernik and Liu, 1997). Hence, although there are minor changes in porosity with increasing depth correlating approxi- mately with the S-I transition, such changes are subtle compared with the marked change in preferred orien- tation.
Overpressure is commonly associated with the S-I transition. The top of the overpressure zone is nor- mally at the same depth or slightly deeper than the top of the S-I transition zone (e.g., Bruce, 1984). Dis- equilibrium compaction, aquathermal pressuring, and the S-I transformation are among the mechanisms pro- posed as the cause of overpressure as discussed, e.g., by Mello et aL (1994). The disequilibrium compaction mechanism concerns rapid sedimentation rates that prevent fluids from readily escaping. The aquathermal mechanism requires that overpressure is generated by thermal expansion of sealed pore fluids. The S-I trans- formation may contribute to overpressure through the release of interlayer water into confined pore space, where porosity was diminished by textural changes caused by changes in crystallite size, orientation, and mutual boundary relations. Although there is debate on the importance of each mechanism, an effective seal must be required for each mechanism.
An ongoing TEM and XRD study of a North Sea shale sequence showing that fluid pressure increases to abnormal values, shows also the growth of illitic clay (I-S) both as a replacement of detrital phyllosili- cates and in the available pore space (Nadeau et aL, pets. comm.). Such data are consistent with this study, which demonstrates a direct relation between the I-S transition and a change in texture that affects porosity and permeability. Geopressuring requires that the ab- normally pressured fluids be sealed, and the changes in texture only provide a mechanism for sealing. How- ever, appropriate textures in bulk shale leading to di- minished porosity and permeability must be coupled with appropriate geologic structure, including a lack of fluid pathways associated, for example, with fault- ing. Comparison of preferred orientation in the sam- ples described in this study with those of other sedi- ment sequences is required to determine if the rela- tions observed for the Gulf Coast are universal.
CONCLUSIONS
The onset of the S-I transition is intimately associ- ated with the development of preferred orientation of phyllosilicates. The imperfect, wavy smectite layers with variable orientation relative to bedding are trans- formed to straight, defect-free illite packets most of which are subparallel to bedding, resulting in signifi- cant improvement in preferred orientation. The bed- ding-parallel orientation is consistent with develop- ment of bedding fabric in response to compaction load, resulting from dissolution-neocrystallization at smectite-illite (or I-S) boundaries and mechanical ro-
tation. The process is analogous to s la ty-cleavage for- mat ion in response to e levated tectonic stress and tem- perature during low-grade metamorph ism. These re- sults support the proposal that coa lescence of illite packets during the S-I transit ion provides the hydraulic seal necessary for overpressure generat ion. The initial deve lopment of prefer red orientat ion at the S-I tran- s i t ion c o n t r i b u t e d to c o m p a c t i o n d i sequ i l ib r ium, which, in turn, p roduced an initial condi t ion of abnor- mal pressure, abnormal shale porosity, and subnormal bulk density.
A C K N O W L E D G M E N T S
The single-crystal diffractometer was purchased under NSF grant EAR-8917350. This study was supported by the Amer- ican Chemical Society-Petroleum Research Fund (27461- AC8) and the National Science Foundation (EAR-9614407). Special thanks are due to R. Freed (Trinity University) for providing samples and discussion. We also thank H. Dong, R. J. Merriman, and R Nadeau for generously sharing re- search results, and R. Nolen-Hoeksema for discussions on physical properties of mudstones. We thank two anonymous reviewers and S. Guggenheim for their constructive, helpful reviews.
R E F E R E N C E S
Ahn, J.H. and Peacor, D.R. (1986) Transmission and analyt- ical electron microscopy of the smectite-to-illite transition. Clays and Clay Minerals, 34, 165-179.
Altaner, S.P. and Ylagen, R.E (1997) Comparison of structural modes of mixed-layer illite/smectite and reaction mecha- nisms of smectite illitization. Clays and Clay Minerals, 45, 517-533.
Barker, C. (1972) Aquathermal pressure--role of temperature in development of abnormal-pressure zones. American As- sociation o f Petroleum Geologists Bulletin, 56, 2068-2071.
Barron, RE, Slade, R, and Frost, R.L. (1985) Ordering of aluminum in tetrahedral sites in mixed-layer 2:1 phyllos- ilicates by solid-state high resolution NMR. Physical Chemistry, 89, 3880 3885.
Bruce, C.H. (1984) Smectite dehydration--its relation to structural development and hydrocarbon accumulation in northern Gulf of Mexico basin. American Association o f Petroleum Geologists" Bulletin, 68, 673-683.
Burst, J.E (1969) Diagenesis of Gulf Coast clayey sediments and its possible relation to petroleum migration. American Association o f Petroleum Geologists Bulletin, 53, 73-93.
Chapman, R.E. (1980) Mechanical versus thermal cause of abnormally high pore pressures in shales. American Asso- ciation of Petroleum Geologists Bulletin, 64, 2179-2183.
Colten-Bradley, V.A. (1987) Role of pressure in smectite de- hydration--effects on geopressure and smectite-to-illite transformation. American Association o f Petroleum Geol- ogists Bulletin, 71, 1414-1427.
Dong, H. and Peacor, D.R. (1996) TEM observations of co- herent stacking relations in smectite, I/S and illite of shales: Evidence for MacEwan crystallites and dominance of 2Mr polytypism. Clays and Clay Minerals, 44, 257-275.
Dong, H., Peacor, D.R., and Freed, R.L. (1997) Phase rela- tions among smectite, R1 illite-smectite, and illite. Ameri- can Mineralogist, 82, 379-391.
Freed, R.L. and Peacor, D.R. (1987) New insights on diagen- esis and I/S reactions in Texas Gulf Coast sediments. Clay Minerals, 24, 667-668.
Freed, R.L. and Peacor, D.R. (1989a) Geopressured shale and sealing effect of smectite to illite transition. American As- sociation o f Petroleum Geologists" Bulletin, 73, 1223-1232.
Freed, R.L. and Peacor, D.R. (1989b) TEM lattice fringe im- ages with R1 ordering of illite/smectite in Gulf Coast pelitic rocks. Geological Society o f America Abstracts' with Pro- gram, 21, A16.
Freed, R.L. and Peacor, D.R. (1992) Diagenesis and the for- mation of authigenic illite-rich I/S crystals in Gulf Coast shales: TEM study of clay separates. Journal o f Sedimen- tary Petrology, 62, 220-234.
Gretener, RE. (1979) Pore pressure: Fundamentals, general ramifications, and implications for structure geology (re- vised). American Association o f Petroleum Geologists, Continuing Education Course Note Series 4, 131 pp.
Guthrie, G.D., Jr. and Veblen, D.R. (1989) High-resolution transmission electron microscopy of mixed-layer illite/ smectite: Computer simulation. Clays and Clay Minerals, 37, 1-11.
Hower, J., Eslinger, E.V., Hower, M.E., and Perry, E.A. (1976) Mechanism of burial metamorphism of argillaceous sediment: Mineralogical and chemical evidence. Geologi- cal Society o f America Bulletin, 87, 725-737.
Jiang, W-T., Peacor, D.R., Merriman, R.J., and Roberts, B. (1990) Transmission and analytical electron microscopic study of mixed-layer illite-smectite formed as an apparent replacement product of diagenetic illite. Clays and Clay Minerals, 38, 449-468.
Katsube, T.J. and Williamson, M.A. (1994) Effects of diagen- esis on shale nano-pore structure and implications for seal- ing capacity. Clay Minerals, 29, 451-461.
Luo, M., Baker, M.R., and LeMone, D.V. (1994) Distribution and generation of the overpressure system, Eastern Dela- ware Basin, Western Texas and Southern New Mexico. American Association o f Petroleum Geologists Bulletin, 78, 1386-1405.
Magara, K. (1975a) Reevaluation of montmorillonite dehy- dration as cause of abnormal pressure and hydrocarbon mi- gration. American Association o f Petroleum Geologists Bulletin, 59, 292-302.
Magara, K. (1975b) Importance of aquathermal pressuring effect in Gulf Coast. American Association o f Petroleum Geologists" Bulletin, 59, 2037-2045.
Maxwell, R.T. (1964) Influence of depth, temperature, and geologic age on porosity of quartzose sandstone. American Association o f Petroleum Geologists" Bulletin, 48, 697-709.
Mello, U.T. and Karner, G.D. (1996) Development of sedi- ment overpressure and its effect on thermal maturation: Ap- plication to the Gulf of Mexico Basin. American Associa- tion o f Petroleum Geologists Bulletin, 80, 1367-1396.
Mello, U.T., Karner, G.D., and Anderson, R.N. (1994) A physical explanation for the positioning of the depth to the top of overpressure in shale-dominated sequences in the Gulf Coast basin, United States. Journal o f Geophysical Research, 99, 2775-2789.
Oertel, G. (1985) The relationship of strain and preferred ori- entation of phyllosilicate grains in rocks--a review. Tec- tonophysics, 100, 413-447.
Pendkar, N. and Jordan, R.R. (1993) Diagenesis of siliciclas- tic reservoir rocks, Baltimore Canyon Trough, Mid-Atlantic continental margin. Geological Society o f America Pro- gram with Abstracts, 28, A336.
Perry, E. and Hower, J. (1970) Burial diagenesis in Gulf Coast pelitic sediments. Clays and Clay Minerals, 18, 165- 177.
Pevear, D.R., Houser, P.J., Robinson, G.A., and Reynolds, R.C. (1997) Disorder in illite: The differences between shales, K-bentonites, and sandstones--the AFM evidence.
504 Ho, Peacor, and van der Pluijm Clays and Clay Minerals
l l t h International Clay Conference, Program with Ab- stracts, A58.
Plumley, W.J. (1980) Abnormally high fluid pressure: Survey of some basic principles. American Association o f Petro- leum Geologists Bulletin, 64, 414-430.
Powers, M.C. (1967) Fluid-release mechanisms in compact- ing marine mudrock and their importance in oil explora- tion. American Association o f Petroleum Geologists" Bul- letin, 51, 1240-1254.
Reynolds, R.C., Jr. (1992) X-ray diffraction studies of illite/ smectite from rocks, <1 Ixm randomly oriented powders and < l txm oriented powder aggregates: The absence of laboratory-induced artifacts. Clays and Clay Minerals, 40, 387-396.
Sharp, J.M., Jr. (1983) Permeability controls on aquathermal pressuring. American Association of Petroleum Geologists Bulletin, 67, 2057-2061.
Sintubin, M. (1994) Clay fabric in relation to the burial his- tory of shales. Sedimentology, 41, 1161-1169.
Srodon, J. (1980) Precise identification of i11ite/smectite in- terstratifications by X-ray powder diffraction. Clays and Clay Minerals, 32, 337-349.
van der Pluijm, B.A., Ho, N-C., and Peacor, D.R. (1994) High-resolution X-ray texture goniometry. Journal o f Structural Geology, 16, 1029-1032.
van der Pluijm, B.A., Ho, N-C., and Peacor, D.R. (1995) High-resolution X-ray texture goniometry: Reply. Journal of Structural Geology, 17, 925-926.
van der Pluijm, B.A., Ho, N-C., Merriman, R.J., and Peacor, D.R. (1998) Contradictions of slate formation resolved? Nature, 392, 348.
Velde, B., Suzuki, T., and Nicor, E. (1986) Pressure-temper- ature-composition of illite/smectite mixed-layer minerals: Niger Delta mudstones and other examples. Clays and Clay Minerals, 34, 435-441.
Vernik, L. and Liu, X. (1997) Velocity anisotropy in shales: A petrophysical study. Geophysics, 62, 521-532.
Wenk, H-R. (1985) Measurement of pole figures. In Preferred Orientation in Deformed Metals and Rocks: An Introduc- tion to Modern Texture Analysis, H.R. Wenk, ed., Academ- ic Press, New York, 11-47.
(Received 18 February 1998; accepted 18 February 1999, Ms. 98-027)