National Vital Statistics Reports Volume 64, Number 6 June 17, 2015 Births: Preliminary Data for 2014 Brady E. Hamilton, Ph.D.; Joyce A. Martin, M.P.H.; Michelle J.K. Osterman, M.H.S.; and Sally C. Curtin, M.A., Division of Vital Statistics Abstract Objectives—This report presents preliminary 2014 data on U.S. births. Births are shown by age, live-birth order, race, and Hispanic origin of mother. Data on marital status, cesarean delivery, preterm births, and low birthweight are also presented. Methods—Data are based on 99.71% of 2014 births. Records for the few states with less than 100% of records received are weighted Percent 2013 2014 40 Overall cesarean delivery rate Low-risk cesarean 1 delivery rate 35 30 25 20 0 All births Non- Non- AIAN API Hispanic All births Non- Non- AIAN API Hispanic Hispanic Hispanic Hispanic Hispanic white black white black Race and Hispanic origin of mother 1 Defined as singleton, term (37 or more weeks of completed gestation based on obstetric estimate), vertex (not breech) cesarean deliveries to women having a first birth. NOTE: AIAN is American Indian or Alaska Native; API is Asian or Pacific Islander. SOURCE: CDC/NCHS, National Vital Statistics System. Figure 1. Overall and low-risk cesarean delivery rates, by race and Hispanic origin of mother: United States, final 2013 and preliminary 2014 U.S. DEPARTMENT OF HEALTH AND HUMAN SERVICES Centers for Disease Control and Prevention National Center for Health Statistics National Vital Statistics System
Transcript
National Vital Statistics Reports Volume 64, Number 6 June 17, 2015
Births: Preliminary Data for 2014 Brady E. Hamilton, Ph.D.; Joyce A. Martin, M.P.H.; Michelle J.K. Osterman, M.H.S.; and Sally C. Curtin, M.A., Division of Vital Statistics
Abstract
Objectives—This report presents preliminary 2014 data on U.S. births. Births are shown by age, live-birth order, race, and Hispanic
origin of mother. Data on marital status, cesarean delivery, preterm births, and low birthweight are also presented.
Methods—Data are based on 99.71% of 2014 births. Records for the few states with less than 100% of records received are weighted
0 All births Non- Non- AIAN API Hispanic All births Non- Non- AIAN API Hispanic
Hispanic Hispanic Hispanic Hispanic white black white black
Race and Hispanic origin of mother 1Defined as singleton, term (37 or more weeks of completed gestation based on obstetric estimate), vertex (not breech) cesarean deliveries to women having a first birth. NOTE: AIAN is American Indian or Alaska Native; API is Asian or Pacific Islander. SOURCE: CDC/NCHS, National Vital Statistics System.
Figure 1. Overall and low-risk cesarean delivery rates, by race and Hispanic origin of mother: United States, final 2013 and preliminary 2014
U.S. DEPARTMENT OF HEALTH AND HUMAN SERVICES Centers for Disease Control and Prevention
National Center for Health Statistics National Vital Statistics System
2 National Vital Statistics Reports, Vol. 64, No. 6, June 17, 2015
to independent control counts of all births received in state vital statistics offices in 2014. Comparisons are made with final 2013 data and earlier years.
Results—The 2014 preliminary number of U.S. births was 3,985,924, an increase of 1% from 2013. The number of births increased for women in all race and Hispanic origin groups in 2014 except for American Indian or Alaska Native women, for whom births decreased. The general fertility rate was 62.9 births per 1,000 women aged 15–44, up 1% from 2013, and the first increase in the fertility rate since 2007. The birth rate for teenagers aged 15–19 decreased 9% in 2014 to 24.2 births per 1,000 women, yet another historic low for the nation; rates decreased for both younger and older teenagers to record lows. The birth rate for women in their early 20s declined to 79.0 births per 1,000 women, another record low. Birth rates for women in their 30s and early 40s increased in 2014. The nonmarital birth rate declined 1% in 2014, to 44.0 births per 1,000 unmarried women aged 15–44, dropping for six consecutive years. The cesarean delivery rate was down 2%, and the low-risk cesarean delivery rate was down 3%, in 2014. The preterm birth rate (based on a change in measure) was down in 2014 to 9.57%. The low birthweight rate was essentially unchanged in 2014 at 8.00%.
Keywords: birth rates • maternal and infant health • vital statistics
Introduction This report from the Centers for Disease Control and Preven
tion’s (CDC) National Center for Health Statistics (NCHS) presents preliminary data on births and birth rates and selected maternal and infant health characteristics (including cesarean delivery [Figure 1]) for the United States in 2014. The findings are based on nearly 100% of registered vital records occurring in calendar year 2014, which were received and processed by NCHS as of February 12, 2015. Trends in the preliminary reports for 1995–2013 births were confirmed by the final vital statistics for each year (1,2). Comparisons are based on the final data for 2013 and earlier years (2). Changes and differences presented in this report are statistically significant at the 0.05 level, unless noted otherwise.
Beginning with the 2014 data year, NCHS is transitioning to a new standard for estimating the gestational age of the newborn. The new measure—the obstetric estimate of gestation at delivery (OE)— replaces the measure based on the date of the last normal menses (LMP) (3). Accordingly, gestational age data shown in this report are based on OE. However, LMP-based data are also available for all relevant report tables at http://www.cdc.gov/nchs/data/nvsr/nvsr64/ nvsr64_06_supplemental_and_expanded_tables.pdf. National data based on OE data are available only from data year 2007 forward. Gestational age estimates differ somewhat between the OE- and LMP-based measures. For example, the 2014 OE-based preterm birth rate for the United States is 9.57%, compared with the LMP-based rate of 11.32%. Of note, both measures show declines in the rate of preterm birth from 2007 to 2014. The reasons for the change, and a detailed comparison of the two measures, are presented in: ‘‘Measuring Gestational Age in Vital Statistics Data: Transitioning to the Obstetric Estimate’’ (3).
State-specific detailed tables for 2014 births, based on preliminary data and showing the percentages of births delivered by cesarean
and born preterm, are available on the NCHS website (see Internet Tables I–1 and I–2 at http://www.cdc.gov/nchs/data/nvsr/nvsr64/ nvsr64_06_tables.pdf).
Population estimates by age, sex, and race and Hispanic origin for 2014 at the national and state levels were not available as of the preparation of this report. Accordingly, birth and fertility rates by race and Hispanic origin and fertility rates by state could not be shown here. Birth and fertility rates by age and race and Hispanic origin based on 2014 preliminary data will be released as soon as available at http://www.cdc.gov/nchs/data/nvsr/nvsr64/nvsr64_06_supplemental_ and_expanded_tables.pdf.
Results
Births and birth rates Key findings, illustrated in Tables 1–6 and Figures 2–4, are
listed below:
+ The preliminary number of births for the United States in 2014 was 3,985,924, an increase of 1% (or 53,743 births) from 2013 (3,932,181) (Tables 1 and 2 and Figure 2) (2). This is the first increase in births since 2007, ending the recent downward trend. The number of births declined steadily from 2007 through 2010, but the pace of decline slowed from 2010 through 2013.
+ The number of births increased 1% for women in each of the three largest race and Hispanic origin groups (non-Hispanic white, non-Hispanic black, and Hispanic) from 2013 to 2014 (2). Births to Asian or Pacific Islander (API) women increased 6% in 2014, whereas births to American Indian or Alaska Native (AIAN) women decreased 2%.
+ The preliminary general fertility rate (GFR) for the United States also increased 1% in 2014, to 62.9 births per 1,000 women aged 15–44, from 62.5 in 2013 (Tables 1, 3, and 5 and Figure 2) (2,4). This is the first increase in the fertility rate since 2007. Similar to the trend in the number of births, the rate declined steadily from 2007 through 2013, with the pace of decline slowing from 2010 through 2013.
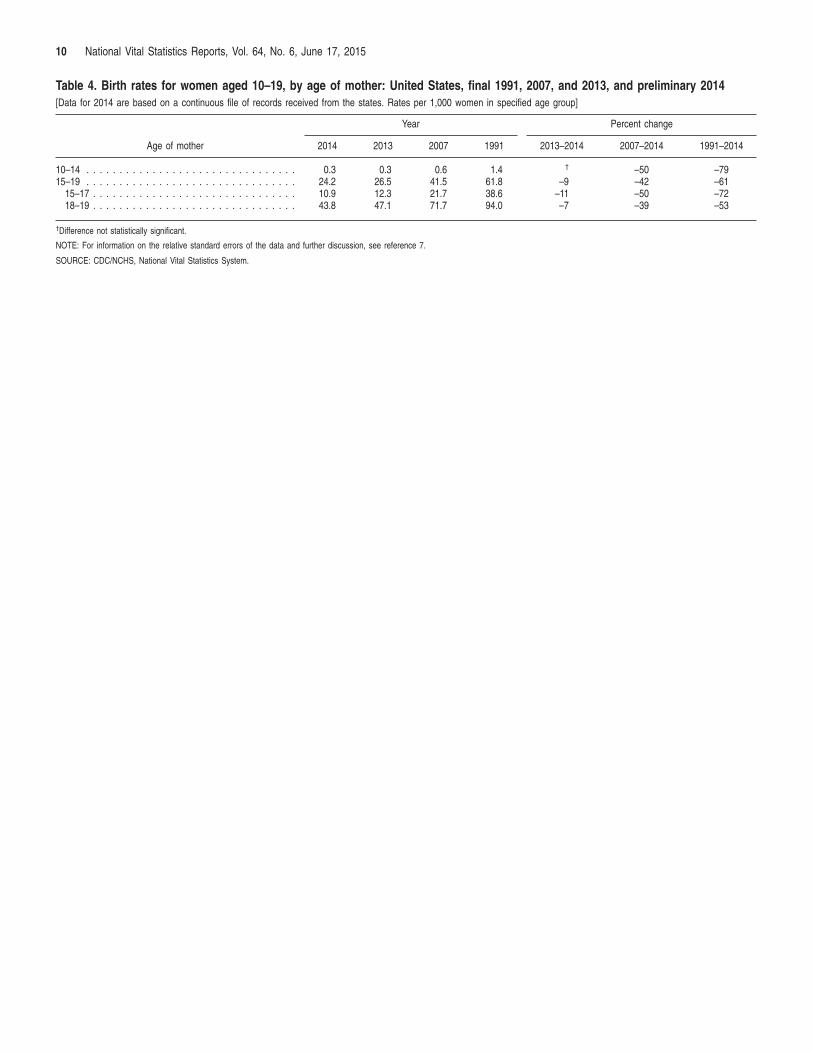
+ The preliminary birth rate for teenagers in 2014 was 24.2 births per 1,000 women aged 15–19—yet another historic low for the nation (Tables 1, 3, and 4 and Figures 3 and 4) (2,5). The rate was down 9% from 2013 (26.5) and has declined more than 7% annually since 2007. Since the most recent peak in 1991 (61.8), the rate has declined a total of 61% (5). In 2014, the preliminary number of births to women aged 15–19 was 249,067 (Tables 1 and 2), down 9% from 2013 and 44% from 2007 (444,899) (2,5).
+ In 2014, the preliminary birth rates for teenagers aged 15–17 and 18–19 fell 11% and 7%, respectively, to 10.9 and 43.8 births per 1,000 women, another record low for both groups, from 12.3 and 47.1 in 2013. Since 2007, the rate for teenagers aged 15–17 has declined more than 9% annually, and the rate for those aged 18–19 has declined nearly 7% annually. The number of births for teenagers aged 15–17 declined 11% from 2013 to 2014, and births to those aged 18–19 declined 8%.
NOTE: Rates are plotted on a logarithmic scale. SOURCE: CDC/NCHS, National Vital Statistics System.
18–19
15–19
15–17
200019951990 10
50
100
2005 2010 2014
Rat
e pe
r 1,0
00 w
omen
in s
peci
fied
age
grou
p
10
50
100
Figure 3. Birth rates for women aged 15–19, by age group: United States, final 1990–2013 and preliminary 2014
3 National Vital Statistics Reports, Vol. 64, No. 6, June 17, 2015
2014 2010200019901980197019601950194019301920
Num
ber o
f birt
hs (m
illio
ns)
Rate per 1,000 w
omen aged 15–44
0
40
80
120
160
200
0
1
2
3
4
5
Number
Rate
NOTE: Beginning with 1959, trend lines are based on registered live births; trend lines for 1920–1958 are based on live births adjusted for underregistration. SOURCE: CDC/NCHS, National Vital Statistics System.
Figure 2. Live births and general fertility rates: United States, final 1920–2013 and preliminary 2014
R
ate
per 1
,000
wom
en in
spe
cifie
d ag
e gr
oup
200 200
100 100
50 50
10 10
5 5
1 1 1990 1995 2000 2005 2010 2014
15–19
20–24
25–29
30–34
35–39
40–44
NOTE: Rates are plotted on a logarithmic scale. SOURCE: CDC/NCHS, National Vital Statistics System.
Figure 4. Birth rates, by selected age of mother: United States, final 1990–2013 and preliminary 2014
4 National Vital Statistics Reports, Vol. 64, No. 6, June 17, 2015
+ The birth rate for teenagers aged 10–14 was 0.3 births per 1,000 in 2014, unchanged from 2013, the historic low for the nation. The number of births to mothers in this age group declined 11% in 2014, to 2,771 births.
+ The preliminary birth rate for women aged 20–24 in 2014 was 79.0 births per 1,000 women, down 2% from the rate in 2013 (80.7), reaching yet another record low for the nation (Tables 1 and 3 and Figure 4) (2,4). The rate for women in this age group has declined steadily since 2007 at more than 4% a year. The number of births to women in their early 20s decreased 2% from 2013 to 2014 (Tables 1 and 2). The rate for women aged 25–29 was 105.7 births per 1,000 women, essentially unchanged from 2013 (105.5) (2). Since 2008, the rate for women in this age group has declined more than 1% a year. The number of births to women in their late 20s increased 2% from 2013 to 2014.
+ The preliminary birth rate for women aged 30–34 in 2014 was 100.8 births per 1,000 women, up 3% from the rate in 2013 (98.0) (Tables 1 and 3 and Figure 4). The rate for this group has increased steadily since 2011. The number of births to women in their early 30s also increased in 2014, by 4%. The rate for women aged 35–39 was 50.9 births per 1,000 women, up 3% from 2013 (49.3). The rate for this group has increased steadily since 2010 (2). The number of births to women in their late 30s increased 5% in 2014.
+ The preliminary birth rate for women aged 40–44 in 2014 was 10.6 births per 1,000 women, up 2% from 2013 (10.4). Since 1982, the rate for women in their early 40s has generally risen (2,4). The number of births to these women was essentially unchanged in
2014. The rate for women aged 45–49 (which includes births to women aged 50 and over) was 0.8 births per 1,000 women, unchanged from 2013. The number of births to women in this age group increased 4% in 2014 (Tables 2–4).
+ The preliminary total fertility rate (TFR) for the United States in 2014 was 1,861.5 births per 1,000 women, a slight increase (less than 1%) from the rate in 2013 (1,857.5) (2). This is the first increase in the rate since 2007 (2). The TFR estimates the number of births that a hypothetical group of 1,000 women would have over their lifetimes, based on the age-specific birth rates in a given year.
+ The 2014 TFR was below replacement—the level at which a given generation can exactly replace itself (2,100 births per 1,000 women). The rate has not been above replacement since 2007 (2).
+ The preliminary first birth rate for the United States in 2014 was 24.6 first births per 1,000 women aged 15–44, down slightly (less than 1%) from 2013 (24.7) and reaching another record low (Table 3) (2,4). First-birth rates decreased for women aged 15–24, increased for women aged 30–39, and were unchanged for women aged 10–14, 25–29, and 40 and over (2,6). The rate for second-order births to women aged 15–44 also increased in 2014, by 1%, as did the rates for third-order (up 2%) and fourth- and higher-order (up 3%) births.
+ The birth rate for unmarried women in 2014 (44.0 births per 1,000 unmarried women aged 15–44) declined 1% from 2013 (44.3) (2). The rate has declined for 6 consecutive years and was 15% lower than the all-time peak in 2007 and 2008 (51.8). The 2014 preliminary rate was the lowest since 2002 (43.6).
+ Nonmarital births numbered almost 9,000 more in 2014 (1,604,495) than in 2013 (1,595,873), a 1% increase (Table 6). The 2014 preliminary number of nonmarital births is 7% lower than the 2008 peak (1,726,566).
+ The percentage of all births to unmarried women declined to 40.3% in 2014, from 40.6% in 2013. This overall decline was primarily the result of a compositional shift (that is, more births to older women who have proportionally fewer nonmarital births than their younger counterparts).
+ The percentage of nonmarital births declined from 2013 to 2014 for all race and Hispanic origin groups. The percentage of births to unmarried mothers in 2014 ranged from 16.4% for API women to 70.9% for non-Hispanic black women.
Maternal and infant health characteristics
Key findings, illustrated in Tables 7 and 8 and Figures 1 and 5, are listed below:
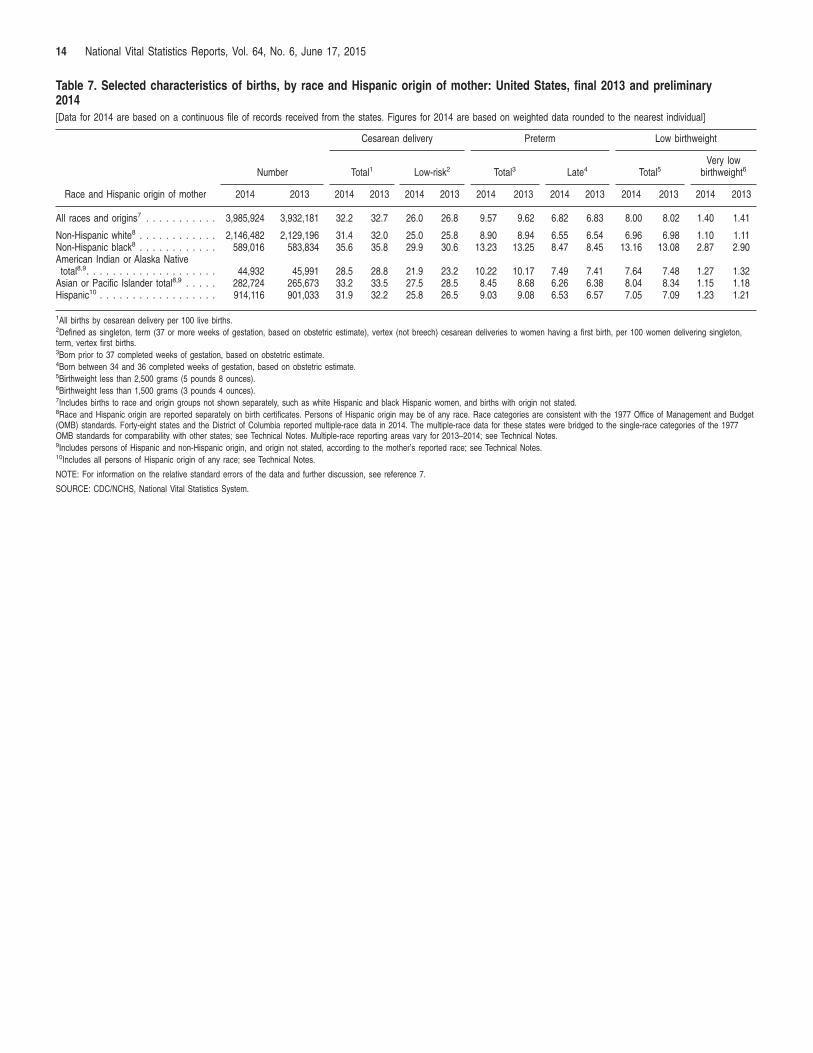
+ In 2014, the overall cesarean delivery rate was 32.2%, a 2% decline from 32.7% in 2013 (Table 8). After peaking in 2009 at 32.9%, the rate remained stable for 2010–2012. The 2014 preliminary rate is the lowest since 2007.
+ The cesarean delivery rate for non-Hispanic white women declined for the fifth straight year in 2014, down 2% to 31.4%. Rates declined in 2014 for the first time since the mid-1990s
14.7115
Per
cent
0
5
10
Hispanic
10.44
9.57 9.90
8.90
13.23
9.35 9.03
2014 2007
Total Non-Hispanic white Non-Hispanic black
Race and Hispanic origin of mother NOTE: Gestational age is based on obstetric estimate of gestation. SOURCE: CDC/NCHS, National Vital Statistics System.
Figure 5. Preterm birth rates, by race and Hispanic origin of mother: United States, final 2007 and preliminary 2014
5 National Vital Statistics Reports, Vol. 64, No. 6, June 17, 2015
for non-Hispanic black (down 1%, to 35.6%), Hispanic (down 1%, to 31.9%), and API (down 1%, to 33.2%) women, but were statistically unchanged for AIAN women (28.5% in 2014) (Table 8 and Figure 1) (2).
+ The rate of low-risk cesarean delivery, which is cesarean delivery among nulliparous (first birth), term (37 or more completed weeks based on the obstetric estimate), singleton (one fetus), vertex (head-first) births, declined to 26.0% in 2014. This is 3% lower than the 2013 rate (26.8%) and is the largest decline since the 2009 peak (28.0%).
+ Rates of low-risk cesarean delivery declined for all race and ethnicity groups in 2014. Declines ranged from 2% for non-Hispanic black women to 6% for AIAN women (Table 7 and Figure 1).
+ The 2014 preterm birth rate (based on the obstetric estimate of gestation, as described in the Introduction) was 9.57%, down slightly from 9.62% in 2013. The percentage of births delivered at less than 37 completed weeks of gestation has declined 8% since 2007 (from 10.44%), the first year for which national data are available for this measure (and differs from the LMP-based rate previously published) (Tables 7 and 8 and Figure 5) (3).
+ The rate of infants born early preterm (less than 34 weeks) was down slightly, from 2.79% to 2.75% for 2013–2014; the late preterm birth rate (34–36 weeks) was essentially stable at 6.82% in 2014. Since 2007, the early preterm level has declined 6% and the late preterm rate by 9% (Table 8).
+ Preterm rates were essentially stable for each of the largest race and Hispanic origin groups for 2013–2014: non-Hispanic
white (8.90% in 2014), non-Hispanic black (13.23%), and Hispanic (9.03%) (Table 7). Since 2007, preterm rates have fallen 10% for non-Hispanic white and non-Hispanic black and 3% for Hispanic infants.
+ Preterm birth rates declined in 44 states and the District of Columbia from 2007 to 2014; the rates for 6 states (Hawaii, Iowa, Kansas, Montana, Nebraska, and North Dakota) did not change significantly over this period (see 2013 and 2014 data in Table I–2).
+ The 2014 U.S. low birthweight (LBW) rate was 8.00%, essentially unchanged from 2013 (8.02%). The LBW rate (the percentage of infants born at less than 2,500 grams or 5 pounds, 8 ounces) rose to 8.26% in 2006 but has trended slowly downward during 2007–2014 (2). The percentage of very low birthweight (VLBW) infants (less than 1,500 grams or 3 pounds, 4 ounces) was stable at 1.40% in 2014. The VLBW level has also declined in recent years, from a peak of 1.49% for 2005–2007 (Table 7) (2).
+ LBW levels were essentially unchanged in 2014 from 2013 for the three largest race and Hispanic origin groups: non-Hispanic white (6.96% in 2014), non-Hispanic black (13.16%), and Hispanic (7.05%). Since 2006, however, modest declines in LBW are reported for non-Hispanic white (5%) and non-Hispanic black (6%) births; the rate among Hispanic infants has not changed significantly over this period (see 2013 and 2014 data in Table 7) (2).
6 National Vital Statistics Reports, Vol. 64, No. 6, June 17, 2015
References
1. Hamilton BE, Martin JA, Osterman MJK, Curtin SC. Births: Preliminary data for 2013. National vital statistics reports; vol 63 no 2. Hyattsville, MD: National Center for Health Statistics. 2014. Available from: http://www.cdc.gov/nchs/data/nvsr/nvsr63/nvsr63_02.pdf.
2. Martin JA, Hamilton BE, Osterman MJK, et al. Births: Final data for 2013. National vital statistics reports; vol 64 no 1. Hyattsville, MD: National Center for Health Statistics. 2015. Available from: http://www.cdc.gov/nchs/data/nvsr/nvsr64/nvsr64_01.pdf.
3. Martin JA, Osterman MJK, Kirmeyer SE, Gregory ECW. Measuring gestational age in vital statistics data: Transitioning to the obstetric estimate. National vital statistics reports; vol 64 no 5. Hyattsville, MD: National Center for Health Statistics. 2015. Available from: http://www.cdc.gov/nchs/data/nvsr/nvsr64/nvsr64_05.pdf.
4. National Center for Health Statistics. Vital statistics of the United States, 2003. Vol I, Natality. 2003. Available from: http://www.cdc.gov/ nchs/products/vsus.htm.
5. Ventura SJ, Hamilton BE, Mathews TJ. National and state patterns of teen births in the United States, 1940–2013. National vital statistics reports; vol 63 no 4. Hyattsville, MD: National Center for Health Statistics. 2014. Available from: http://www.cdc.gov/nchs/data/nvsr/ nvsr63/nvsr63_04.pdf.
6. Mathews TJ, Hamilton BE. First births to older women continue to rise. NCHS data brief, no 152. Hyattsville, MD: National Center for Health Statistics. 2014. Available from: http://www.cdc.gov/nchs/data/ databriefs/db152.pdf.
7. Hamilton BE, Martin JA, Ventura SJ. Births: Preliminary data for 2005. National vital statistics reports; vol 55 no 11. Hyattsville, MD: National Center for Health Statistics. 2006. Available from: http://www.cdc.gov/nchs/data/nvsr/nvsr55/nvsr55_11.pdf.
8. National Center for Health Statistics. User guide to the 2013 Natality Public Use File. Hyattsville, MD. 2014. Available from: ftp://ftp.cdc.gov/pub/Health_Statistics/NCHS/Dataset_Documentation/ DVS/natality/UserGuide2013.pdf.
9. National Center for Health Statistics. U.S. Standard Certificate of Live Birth. 2003. Available from: http://www.cdc.gov/nchs/data/dvs/birth1103final-ACC.pdf.
10. National Center for Health Statistics. Report of the Panel to Evaluate the U.S. Standard Certificates. 2000. Available from: http://www.cdc.gov/nchs/data/dvs/panelreport_acc.pdf.
11. U.S. Office of Management and Budget. Revisions to the standards for the classification of federal data on race and ethnicity. Fed Regist 62(210):58782–90. 1997. Available from: http://www.whitehouse.gov/ omb/fedreg_1997standards.
12. U.S. Office of Management and Budget. Race and ethnic standards for federal statistics and administrative reporting. Statistical Policy Directive 15. 1977. Available from: http://wonder.cdc.gov/WONDER/help/ populations/bridged-race/Directive15.html.
13. Ingram DD, Parker JD, Schenker N, et al. United States Census 2000 population with bridged race categories. National Center for Health Statistics. Vital Health Stat 2(135). 2003. Available from: http://www.cdc.gov/nchs/data/series/sr_02/sr02_135.pdf.
14. Johnson D. Coding and editing multiple race. Presented at the 2004 Joint Meeting of NAPHSIS and VSCP. Portland, Oregon. June 6–10, 2004.
15. Weed JA. NCHS procedures for multiple-race and Hispanic origin data: Collection, coding, editing, and transmitting. Presented at the 2004 Joint Meeting of NAPHSIS and VSCP. Portland, Oregon. June 6–10, 2004. Available from: http://www.cdc.gov/nchs/data/dvs/multiple_ race_docu_5-10-04.pdf.
16. Hamilton BE, Ventura SJ. Characteristics of births to single- and multiple-race women: California, Hawaii, Pennsylvania, Utah, and Washington, 2003. National vital statistics reports; vol 55 no 15. Hyattsville, MD: National Center for Health Statistics. 2007. Available from: http://www.cdc.gov/nchs/data/nvsr/nvsr55/nvsr55_15.pdf.
17. U.S. Census Bureau, Population Division. Annual estimates of the resident population by single year of age and sex for the United States: April 1, 2010 to July 1, 2014 (NC–EST2014–AGESEX–RES). Available from: http://www.census.gov/popest/data/datasets.html.
18. U.S. Census Bureau, Population Division. Annual estimates of the resident population for the United States, regions, states, and Puerto Rico: April 1, 2010 to July 1, 2014 (NST–EST2014–01). Available from: http://www.census.gov/popest/data/state/totals/2014/tables/NSTEST2014-01.xls.
19. U.S. Census Bureau. International Data Base: Population by single years of age and sex, 2014. Available from: http://www.census.gov/ population/international/data/idb/informationGateway.php.
20. Ventura SJ, Bachrach CA. Nonmarital childbearing in the United States, 1940–99. National vital statistics reports; vol 48 no 16. Hyattsville, MD: National Center for Health Statistics. 2000. Available from: http://www.cdc.gov/nchs/data/nvsr/nvsr48/nvs48_16.pdf.
21. U.S. Census Bureau. The Data Web: DataFerrett. Current Population Survey. March supplement. 2014. Available from: http://dataferrett. census.gov/.
List of Detailed Tables 1. Births and birth rates, by age of mother: United States, final 2013
and preliminary 2014 . . . . . . . . . . . . . . . . . . . . . . . . . . . . . 7 2. Births, by age of mother, live-birth order, and race and Hispanic
origin of mother: United States, preliminary 2014. . . . . . . . . . . 8 3. Birth rates, by age of mother and live-birth order: United States,
preliminary 2014 . . . . . . . . . . . . . . . . . . . . . . . . . . . . . . . . 9 4. Birth rates for women aged 10–19, by age of mother: United States,
final 1991, 2007, and 2013, and preliminary 2014 . . . . . . . . . . . . 10 5. Births, by race and Hispanic origin of mother: United States and
each state and territory, preliminary 2014 . . . . . . . . . . . . . . . 11 6. Births to unmarried women, by age and race and Hispanic origin
of mother: United States, final 2013 and preliminary 2014 . . . . 13 7. Selected characteristics of births, by race and Hispanic origin of
mother: United States, final 2013 and preliminary 2014 . . . . . . 14 8. Distribution of births born preterm (prior to 37 completed weeks of
9. Total count of records and completeness of preliminary file of live births: United States and each state and territory, preliminary 2014 . . . . . . . . . . . . . . . . . . . . . . . . . . . . . . . . . . . . . . . . 16
List of Internet tables Available from: http://www.cdc.gov/nchs/data/nvsr/nvsr64/nvsr64_06_tables.pdf
I–1. Births, by total cesarean delivery and low-risk cesarean delivery: United States and each state and territory, final 2013 and preliminary 2014
I–2. Preterm and late preterm births: United States and each state and territory, final 2013 and preliminary 2014
7 National Vital Statistics Reports, Vol. 64, No. 6, June 17, 2015
Table 1. Births and birth rates, by age of mother: United States, final 2013 and preliminary 2014 [Data for 2014 are based on a continuous file of records received from the states. Figures for 2014 are based on weighted data categories may not add to totals. Rates are per 1,000 women in specified age group. Rates for all ages are the total number of per 1,000 women aged 15–44]
– Quantity zero. 1Includes births to race and origin groups not shown separately, such as white Hispanic and black Hispanic women, and births with origin not stated. 2Race and Hispanic origin are reported separately on birth certificates. Persons of Hispanic origin may be of any race. Race categories are consistent with the 1977 Office of Management and Budget (OMB) standards. Forty-eight states and the District of Columbia reported multiple-race data in 2014. The multiple-race data for these states were bridged to the single-race categories of the 1977 OMB standards for comparability with other states; see Technical Notes. 3Includes persons of Hispanic and non-Hispanic origin, and origin not stated, according to the mother’s reported race; see Technical Notes. 4Includes all persons of Hispanic origin of any race; see Technical Notes.
NOTE: For information on the relative standard errors of the data and further discussion, see reference 7.
SOURCE: CDC/NCHS, National Vital Statistics System.
9 National Vital Statistics Reports, Vol. 64, No. 6, June 17, 2015
Table 3. Birth rates, by age [Data are based on a continuous file
of of
mother and records received
live-birth order: United from the states. Rates are per
0.0 Quantity more than zero but less than 0.05. * Figure does not meet standards of reliability or precision; based on fewer than 20 births in the numerator. 1The rate shown is the fertility rate, which is defined as the total number of births, regardless of age of mother, per 1,000 women aged 2The birth rate for women in this age group is computed by relating the number of births to women aged 45 and over to the number of group are to women aged 45–49.
NOTE: For information on the relative standard errors of the data and further discussion, see reference 7.
SOURCE: CDC/NCHS, National Vital Statistics System.
15–44. births to women aged 45–49 because most of the births in this
10 National Vital Statistics Reports, Vol. 64, No. 6, June 17, 2015
Table 4. Birth [Data for 2014 are
rates based
for on a
women aged continuous file of
10–19, by age of records received from
mother: the states.
United Rates per
States, final 1,000 women in
1991, 2007, and specified age group]
2013, and preliminary 2014
Year Percent change
Age of mother 2014 2013 2007 1991 2013–2014 2007–2014 1991–2014
National Vital Statistics Reports, Vol. 64, No. 6, June 17, 2015 11
Table 5. Births, by race and Hispanic origin of mother: United States and each state and [By place of residence. Data are based on a continuous file of records received from the states. Figures are based on categories may not add to totals. Birth rates are total births per 1,000 total population; fertility rates are total births per
territory, preliminary 2014 weighted data rounded to the nearest 1,000 women aged 15–44]
12 National Vital Statistics Reports, Vol. 64, No. 6, June 17, 2015
Table 5. Births, by race and Hispanic origin of mother: United States and each state and [By place of residence. Data are based on a continuous file of records received from the states. Figures are based on categories may not add to totals. Birth rates are total births per 1,000 total population; fertility rates are total births per
territory, preliminary 2014—Con. weighted data rounded to the nearest individual, 1,000 women aged 15–44]
- - - Data not available. * Figure does not meet standards of reliability or precision; less than 85% of data for the area were available as of release of the preliminary file; see Technical Notes. – Quantity zero. 1Includes births to race and origin groups not shown separately, such as white Hispanic and black Hispanic women, and births with origin not stated. 2Race and Hispanic origin are reported separately on birth certificates. Persons of Hispanic origin may be of any race. Race categories are consistent with the 1977 Office of Management and Budget (OMB) standards. Forty-eight states and the District of Columbia reported multiple race data in 2014. The multiple-race data for these states were bridged to the single-race categories of the 1977 OMB standards for comparability with other states; see Technical Notes. 3Includes persons of Hispanic and non-Hispanic origin, and origin not stated, according to the mother’s reported race; see Technical Notes. 4Includes all persons of Hispanic origin of any race; see Technical Notes. 5Excludes data for the territories.
NOTE: For information on the relative standard errors of the data and further discussion, see reference 7.
SOURCE: CDC/NCHS, National Vital Statistics System.
National Vital Statistics Reports, Vol. 64, No. 6, June 17, 2015 13
Table 6. Births to unmarried women, 2014 [Data for 2014 are based on a continuous file of categories may not add to tota]l
1Includes births to race and origin groups not shown separately, such as white Hispanic and black Hispanic women, and births with origin not stated. 2Race and Hispanic origin are reported separately on birth certificates. Persons of Hispanic origin may be of any race. Race categories are consistent with the 1977 Office of Management and Budget (OMB) standards. Forty-eight states and the District of Columbia reported multiple-race data in 2014. The multiple-race data for these states were bridged to the single-race categories of the 1977 OMB standards for comparability with other states; see Technical Notes. Multiple-race reporting areas vary for 2013–2014; see Technical Notes. 3Includes persons of Hispanic and non-Hispanic origin, and origin not stated, according to the mother’s reported race; see Technical Notes. 4Includes all persons of Hispanic origin of any race; see Technical Notes.
NOTE: For information on the relative standard errors of the data and further discussion, see reference 7.
SOURCE: CDC/NCHS, National Vital Statistics System.
14 National Vital Statistics Reports, Vol. 64, No. 6, June 17, 2015
Table 7. Selected characteristics of births, by race and Hispanic origin of mother: United States, final 2013 and preliminary 2014 [Data for 2014 are based on a continuous file of records received from the states. Figures for 2014 are based on weighted data rounded to the nearest individual]
Cesarean delivery Preterm Low birthweight
Very low Number Total1 Low-risk2 Total3 Late4 Total5 birthweight6
Race and Hispanic origin of mother 2014 2013 2014 2013 2014 2013 2014 2013 2014 2013 2014 2013 2014 2013
1All births by cesarean delivery per 100 live births. 2Defined as singleton, term (37 or more weeks of gestation, based on obstetric estimate), vertex (not breech) cesarean deliveries to women having a first birth, per 100 women delivering singleton, term, vertex first births. 3Born prior to 37 completed weeks of gestation, based on obstetric estimate. 4Born between 34 and 36 completed weeks of gestation, based on obstetric estimate. 5Birthweight less than 2,500 grams (5 pounds 8 ounces). 6Birthweight less than 1,500 grams (3 pounds 4 ounces). 7Includes births to race and origin groups not shown separately, such as white Hispanic and black Hispanic women, and births with origin not stated. 8Race and Hispanic origin are reported separately on birth certificates. Persons of Hispanic origin may be of any race. Race categories are consistent with the 1977 Office of Management and Budget (OMB) standards. Forty-eight states and the District of Columbia reported multiple-race data in 2014. The multiple-race data for these states were bridged to the single-race categories of the 1977 OMB standards for comparability with other states; see Technical Notes. Multiple-race reporting areas vary for 2013–2014; see Technical Notes. 9Includes persons of Hispanic and non-Hispanic origin, and origin not stated, according to the mother’s reported race; see Technical Notes. 10Includes all persons of Hispanic origin of any race; see Technical Notes.
NOTE: For information on the relative standard errors of the data and further discussion, see reference 7.
SOURCE: CDC/NCHS, National Vital Statistics System.
National Vital Statistics Reports, Vol. 64, No. 6, June 17, 2015 15
Table 8. Distribution of births born preterm (prior to 37 completed weeks of gestation): United States, final 2007 and 2013 and preliminary 2014 [Data for 2014 are based on a continuous file of records received from the states]
- - - Data not available. 1Excludes data for Puerto Rico, Virgin Islands, Guam, American Samoa, and Northern Marianas.
NOTE: Percent completeness = Number of records in preliminary file × 100/Count of records.
SOURCE: CDC/NCHS, National Vital Statistics System.
National Vital Statistics Reports, Vol. 64, No. 6, June 17, 2015 17
Technical Notes
Nature and sources of data
Preliminary data for 2014 are based on nearly all births for that year (99.71%) (Table 9), with levels for 40 states and the District of Columbia at 100%. Preliminary 2014 data are based on the continuous receipt and processing of statistical records through February 12, 2015, by the Centers for Disease Control and Prevention’s National Center for Health Statistics (NCHS). NCHS receives the data from the states’ vital registration systems through the Vital Statistics Cooperative Program. In this report, U.S. totals include only events occurring within the 50 states and the District of Columbia. Data for Puerto Rico and American Samoa are included in tables showing data by state, but are not included in U.S. totals (Tables 5 and 9, and see state-specific Internet tables at http://www.cdc.gov/ nchs/data/nvsr/nvsr64/nvsr64_06_tables.pdf). Data for Northern Marianas and the Virgin Islands were not available, and less than 85% of data for Guam were available, as of release of the 2014 preliminary file. (For prior releases of preliminary birth data, a criterion of at least 75% of a state’s records for the year was used [7].) Accordingly, data for these territories are not included in this report. Detailed information on reporting completeness and imputation procedures may be found in the ‘‘User Guide to the 2013 Natality Public Use File’’ (8).
To produce the preliminary estimates shown in this report, records in the file were weighted using independent control counts of all 2014 births by state of occurrence. Detailed information on weighting and the reliability of estimates is also available elsewhere (7).
1989 and 2003 U.S. Standard Certificates of Live Birth
This report includes selected 2014 data on items that are collected on both the 1989 revision of the U.S. Standard Certificate of Live Birth (unrevised) and the 2003 revision of the U.S. Standard Certificate of Live Birth (revised). The 2003 revision is described in detail elsewhere (2,8–10). Forty-seven states (Alabama, Alaska, Arizona, Arkansas, California, Colorado, Delaware, Florida, Georgia, Hawaii, Idaho, Illinois, Indiana, Iowa, Kansas, Kentucky, Louisiana, Maine, Maryland, Massachusetts, Michigan, Minnesota, Mississippi, Missouri, Montana, Nebraska, Nevada, New Hampshire, New Mexico, New York, North Carolina, North Dakota, Ohio, Oklahoma, Oregon, Pennsylvania, South Carolina, South Dakota, Tennessee, Texas, Utah, Vermont, Virginia, Washington, West Virginia, Wisconsin, and Wyoming), the District of Columbia, Guam, Puerto Rico, and Northern Marianas had implemented the revised birth certificate as of January 1, 2014. One additional state, New Jersey, implemented the revised birth certificate in 2014, but after January 1 (in July) and only for selected facilities. Furthermore, the revised data for New Jersey were not available as of release of the 2014 preliminary file. The 47 revised states and the District of Columbia that implemented the revision as of January 1, 2014, represent 96.2% of all births in 2014.
Data items exclusive to either the 1989 or the 2003 birth certificate revisions are not shown in this report. A forthcoming report and data release based on 2014 final data will present selected data exclusive to the 2003 revised certificate.
Age of mother For information on and discussion of age of mother, see ‘‘User
Guide to the 2013 Natality Public Use File’’ (8).
Hispanic origin and race
Hispanic origin
Hispanic origin and race are reported separately on the birth certificate. Data shown by race (i.e., American Indian or Alaska Native and Asian or Pacific Islander) include persons of Hispanic or non-Hispanic origin, and data for Hispanic origin include all persons of Hispanic origin of any race. Data for non-Hispanic persons are shown separately for white mother and black mother, given the substantial differences in fertility and maternal and infant health characteristics between Hispanic and non-Hispanic white women and Hispanic and non-Hispanic black women. Items asking for the Hispanic origin of the mother have been included on the birth certificates of all states and the District of Columbia, the Virgin Islands, and Guam since 1993, on the birth certificate of Puerto Rico starting in 2005, and on the birth certificate of Northern Marianas starting in 2010 (8). American Samoa does not collect this information.
Single, multiple, and ‘‘bridged’’ race
The 2003 revision of the U.S. Standard Certificate of Live Birth allows the reporting of more than one race (multiple races) for each parent (9), in accordance with the revised standards issued by the Office of Management and Budget (OMB) in 1997 (11). Information on this change is presented elsewhere (8,12–15).
In 2014, 48 states and the District of Columbia reported multiple-race data. Multiple-race reporting areas include the 47 fully revised states (see ‘‘1989 and 2003 U.S. Standard Certificates of Live Birth’’ section above) and the District of Columbia, which used the 2003 revision of the U.S. Standard Certificate of Live Birth, as well as Rhode Island, which used the 1989 revision but collected multiple-race data comparable to data for the states using the revised certificate. Puerto Rico, which revised its birth certificate in 2005, continued to report race according to the 1989 revision (i.e., as an open-ended question in which only one response is accepted). Multiple-race data for New Jersey were not available as of release of the 2014 preliminary file. The 48 states and the District of Columbia accounted for 96.5% of U.S. births in 2014. Data from the vital records of the remaining two areas, Connecticut and part of New Jersey, are based on the 1989 revision of the certificate that follows the 1977 OMB standard, allowing only a single race to be reported (12,13).
To provide uniformity and comparability of the data during the transition period, before all or most of the data are available in the new multiple-race format, it was necessary to ‘‘bridge’’ the responses of those who reported more than one race (multiple races) to one single race. The bridging procedure for multiple-race mothers and fathers is based on the procedure used to bridge the multiple-race population estimates (13–15). Information detailing the processing and tabulation of data by race is presented elsewhere (8). A previous report describes multiple-race birth data for 2003 (16).
18 National Vital Statistics Reports, Vol. 64, No. 6, June 17, 2015
Marital status
For information on and discussion of marital status, see ‘‘User Guide to the 2013 Natality Public Use File’’ (8).
Method of delivery, gestation, and birthweight
For information on and discussion of method of delivery and birthweight, see ‘‘User Guide to the 2013 Natality Public Use File’’ (8).
Beginning with the 2014 data year, NCHS is transitioning to a new standard for estimating the gestational age of the newborn. The new measure—the obstetric estimate of gestation at delivery (OE)— replaces the measure based on the date of the last normal menses (LMP) (3). Accordingly, gestational age data shown in this report are based on OE. However, LMP-based data are also available for all relevant report tables at http://www.cdc.gov/nchs/data/nvsr/nvsr64/ nvsr64_06_supplemental_and_expanded_tables.pdf. National data based on OE data are available only from data year 2007 forward. Gestational age estimates differ somewhat between the OE- and LMP-based measures. For example, the 2014 OE-based preterm birth rate for the United States is 9.57%, compared with the LMP-based rate of 11.32%. Of note, both measures show declines in the rate of preterm birth from 2007 to 2014. Information on and discussion of the reasons for the change, and a detailed comparison of the two measures, are presented elsewhere (3).
Population denominators
U.S. national birth and fertility rates and state-level birth rates for 2014 shown in this report are based on population estimates derived from the 2010 census as of July 1, 2014 (17,18). Birth and fertility rates for the territories shown in this report (with the exception of Puerto Rico) are based on population estimates provided by the U.S. Census Bureau’s International Data Base (19). Rates for Puerto Rico are based on population estimates derived from the 2010 census as of July 1, 2014 (18).
Rates by state and territory shown in this report may differ from rates computed on the basis of other population estimates. Rates for states and territories with smaller populations, or groups with smaller populations, are more likely to be affected by differences in population base.
Information on the national estimates of births to unmarried women (i.e., methods of determining marital status) and the computation of preliminary birth rates for unmarried women is presented elsewhere (2,8,20). The birth rate for unmarried women for 2014 is estimated based on the population distributions by marital status provided by the U.S. Census Bureau as of March 2014 and applied to the national population estimates as of July 1, 2014, which are derived from the 2010 census (17,20,21).
Postcensenal population estimates by age, sex, and race and Hispanic origin for 2014 at the national and state levels were not available as of the preparation of this report. Accordingly, birth and fertility rates by race and Hispanic origin and fertility rates by state could not be shown in this report. Birth and fertility rates by age and race and Hispanic origin based on 2014 preliminary data will be released as soon as available at http://www.cdc.gov/nchs/data/nvsr/nvsr64/nvsr64_06_ supplemental_and_expanded_tables.pdf.
Computing rates and percentages and reliabilityof estimates
For information on and further discussion of computing rates and percentages and the relative standard errors of the data, see ‘‘Births: Preliminary Data for 2005’’ (7).
This report was prepared under the general direction of Delton Atkinson, Director of the Division of Vital Statistics (DVS) and Amy M. Branum, Chief of the Reproductive Statistics Branch (RSB). Rajesh Virkar, Chief of the Information Technology Branch (IT), and Steve J. Steimel and Annie S. Liu of IT, provided computer programming support and statistical tables. Steve J. Steimel and Annie S. Liu prepared the natality file. Sharon E. Kirmeyer of RSB provided content review. Staff of the Data Acquisition, Classification, and Evaluation Branch carried out quality evaluation and acceptance procedures for the state data files on which this report is based. The Registration Methods staff of DVS consulted with state vital statistics offices regarding the collection of birth certificate data. This report was edited and produced by NCHS Office of Information Services, Information Design and Publishing Staff: Barbara J. Wassell edited the report; typesetting was done by Jacqueline M. Davis; and graphics were produced by Michael W. Jones (contractor).
Suggested citation
Hamilton BE, Martin JA, Osterman MJK, Curtin SC. Births: Preliminary data for 2014. National vital statistics reports; vol 64 no 6. Hyattsville, MD: National Center for Health Statistics. 2015.
Copyright information
All material appearing in this report is in the public domain and may be reproduced or copied without permission; citation as to source, however, is appreciated.
National Center for Health Statistics
Charles J. Rothwell, M.S., M.B.A., Director Nathaniel Schenker, Ph.D., Deputy Director
Jennifer H. Madans, Ph.D., Associate Director for Science
Division of Vital Statistics Delton Atkinson, M.P.H., M.P.H., P.M.P.,
Director
For e-mail updates on NCHS publication releases, subscribe online at: http://www.cdc.gov/nchs/govdelivery.htm. For questions or general information about NCHS: Tel: 1–800–CDC–INFO (1–800–232–4636) • TTY: 1–888–232–6348